31
Phosphorus, nutrient, carbon and water interactions. Jason Neff Geosciences Dept, CU Boulder
| Date post: | 14-Dec-2015 |
| Category: |
Documents |
| Upload: | lillian-orchard |
| View: | 216 times |
| Download: | 0 times |

Phosphorus, nutrient, carbon and water interactions.
Jason Neff
Geosciences Dept, CU Boulder

What controls primary productivity?
N
P P PCa, MgFe
H2OH2O H2O
Short vs. long term limitations
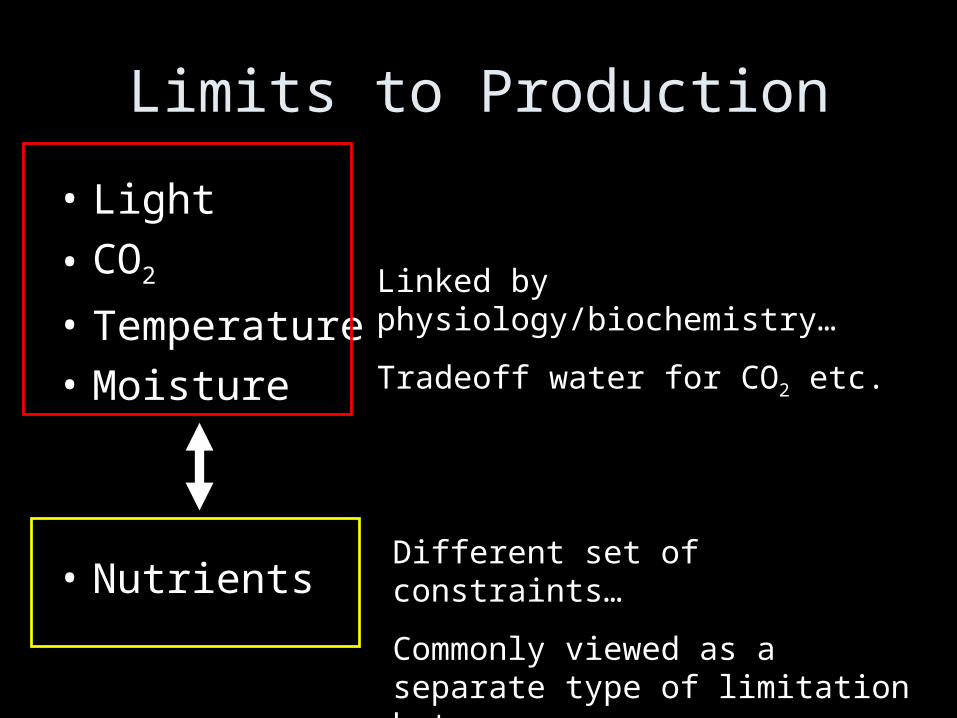
Limits to Production
• Light
• CO2
• Temperature
• Moisture
• Nutrients
Linked by physiology/biochemistry…
Tradeoff water for CO2 etc.
Different set of constraints…
Commonly viewed as a separate type of limitation but…

Nutrients as a limitation
Justus von Liebig: “Liebig’s law of the minimum”
~1850:
Yield (growth) is proportional to the amount of the most limiting nutrient, whichever nutrient it may be.
Start of the green revolution & clearly linked plant growth rates to the amount of mineral nutrients present.
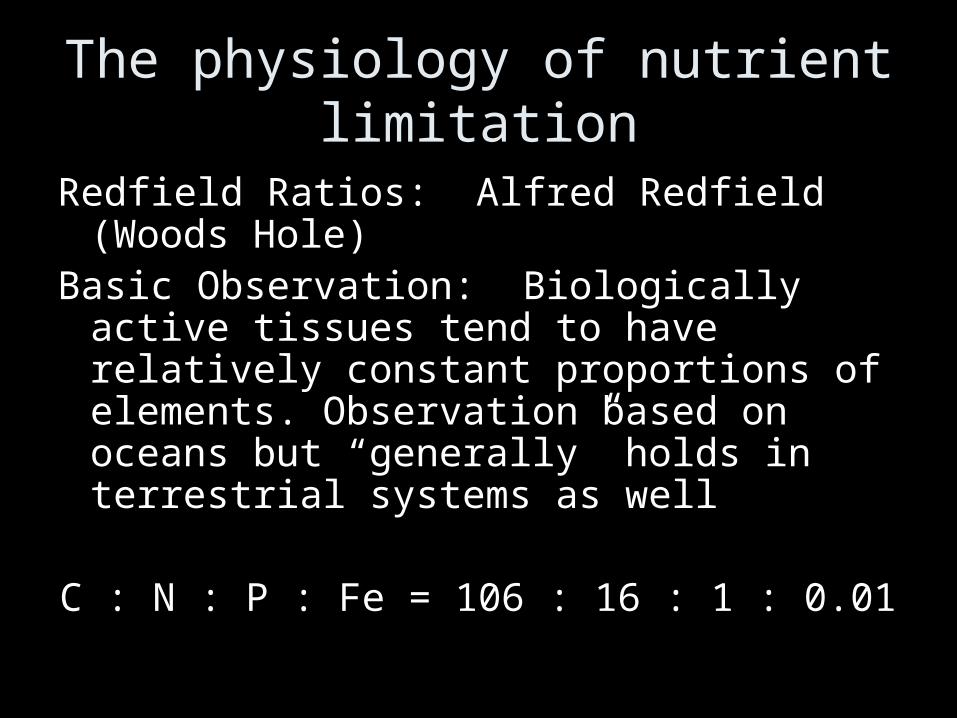
The physiology of nutrient limitation
Redfield Ratios: Alfred Redfield (Woods Hole)
Basic Observation: Biologically active tissues tend to have relatively constant proportions of elements. Observation based on oceans but “generally” holds in terrestrial systems as well
C : N : P : Fe = 106 : 16 : 1 : 0.01

Early Succession – abundant rock-derived minerals (e.g. P, Mg, Ca etc). Very little N.

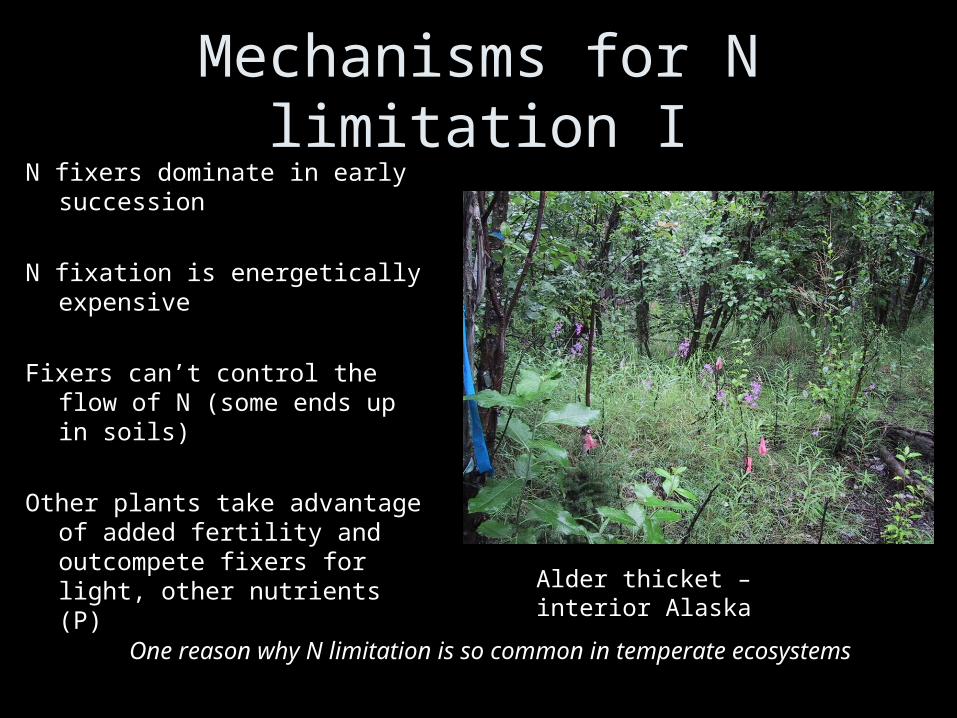
Mechanisms for N limitation IN fixers dominate in early
succession
N fixation is energetically expensive
Fixers can’t control the flow of N (some ends up in soils)
Other plants take advantage of added fertility and outcompete fixers for light, other nutrients (P)
Alder thicket – interior Alaska
One reason why N limitation is so common in temperate ecosystems
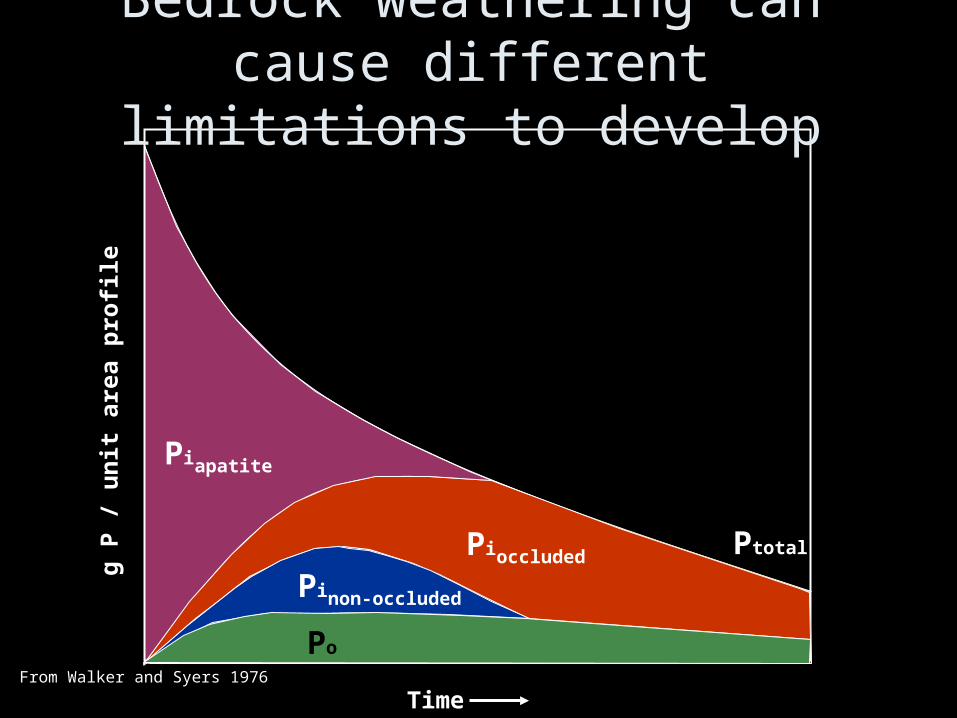
Piapatite
Pioccluded
Pinon-occluded
Po
Ptotal
Time
g P
/ u
nit
are
a p
rofi
le
From Walker and Syers 1976
Bedrock weathering can cause different limitations to develop

Long term P changes
Chadwick et al, 1999
N Limitation or
NP colimitation
P limitation

Crews et al, 1995
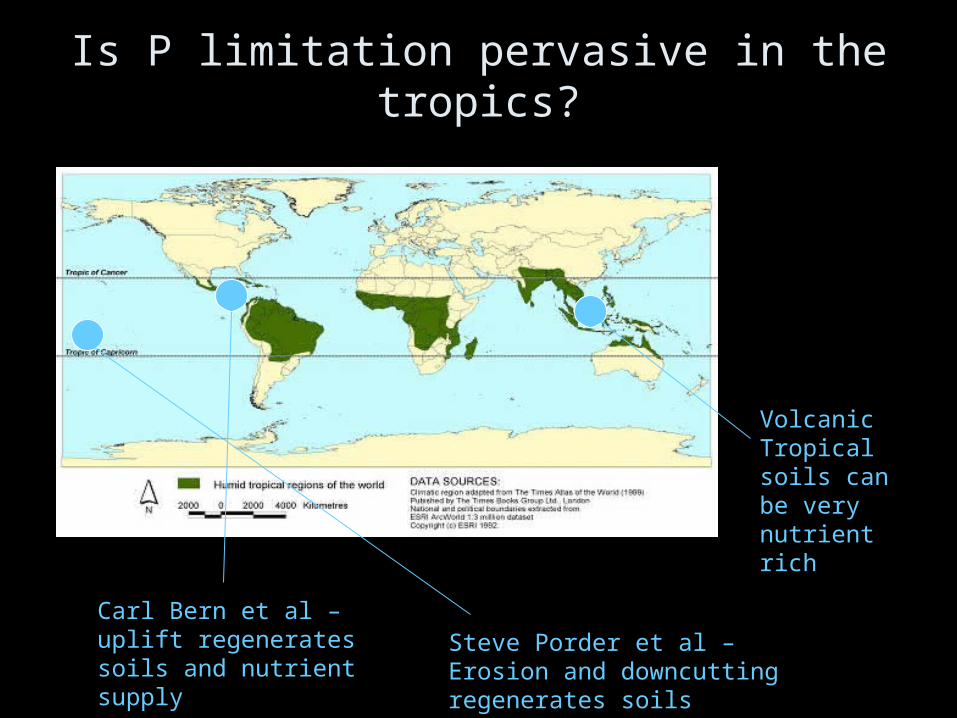
Is P limitation pervasive in the tropics?
Carl Bern et al – uplift regenerates soils and nutrient supply
Steve Porder et al – Erosion and downcutting regenerates soils
Volcanic Tropical soils can be very nutrient rich
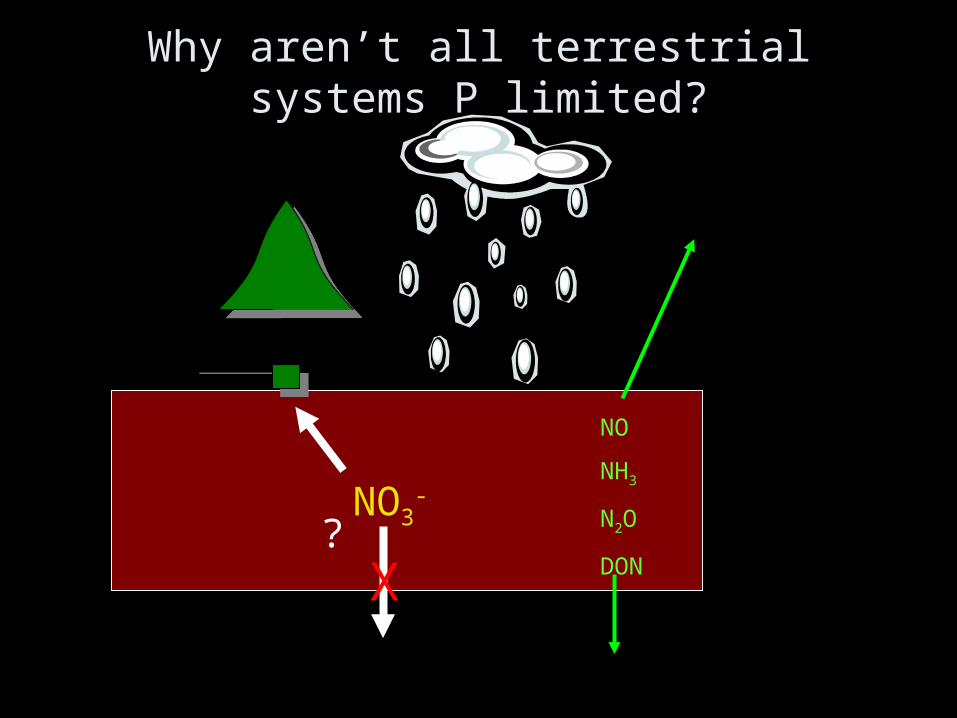
Why aren’t all terrestrial systems P limited?
NO3-
?X
NO
NH3
N2O
DON
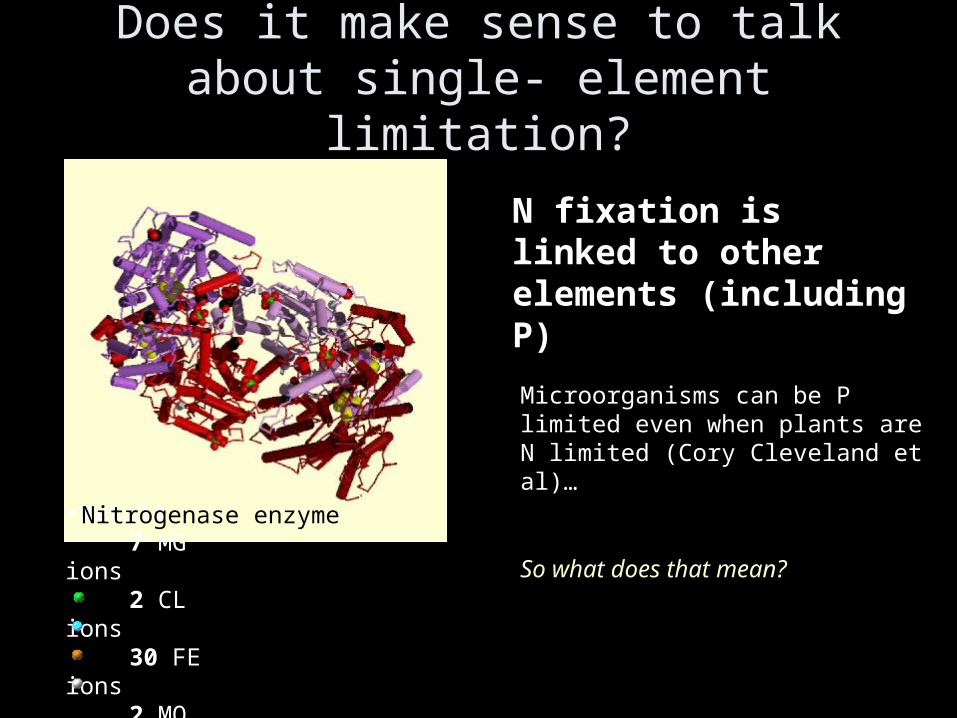
Does it make sense to talk about single- element limitation?
•Metals 7 MG ions 2 CL ions 30 FE ions 2 MO ions
N fixation is linked to other elements (including P)
Nitrogenase enzyme
Microorganisms can be P limited even when plants are N limited (Cory Cleveland et al)…
So what does that mean?

Nutrients vs. WaterP
rimar
y P
rodu
ctio
n (g
m-2)
Annual Rainfall (mm)
0 100 200 300 400
050
0 10
0015
00
Actual Production
Potential P
roduction
From Penning de Vries and Djiteye, 1982
Nutrient Limitation
Nutrients vs. Water
N availability and loss are tied to moisture
N delivery (deposition) and fixation are tied to moisture
Changes in precipitation can influence production through the N cycle, particularly following perturbations

Summary
N is not the only element that limits productivity. P in freshwater, oceans and tropical systems
Metals (Fe) in oceans
Base cations in some tropical settings
Water-Nutrient interactions are complex There isn’t a clear distinction between a nutrient limited vs.
water limited ecosystem
Changes in water often influence ecosystems via the N cycle

Nutrient input/output balance
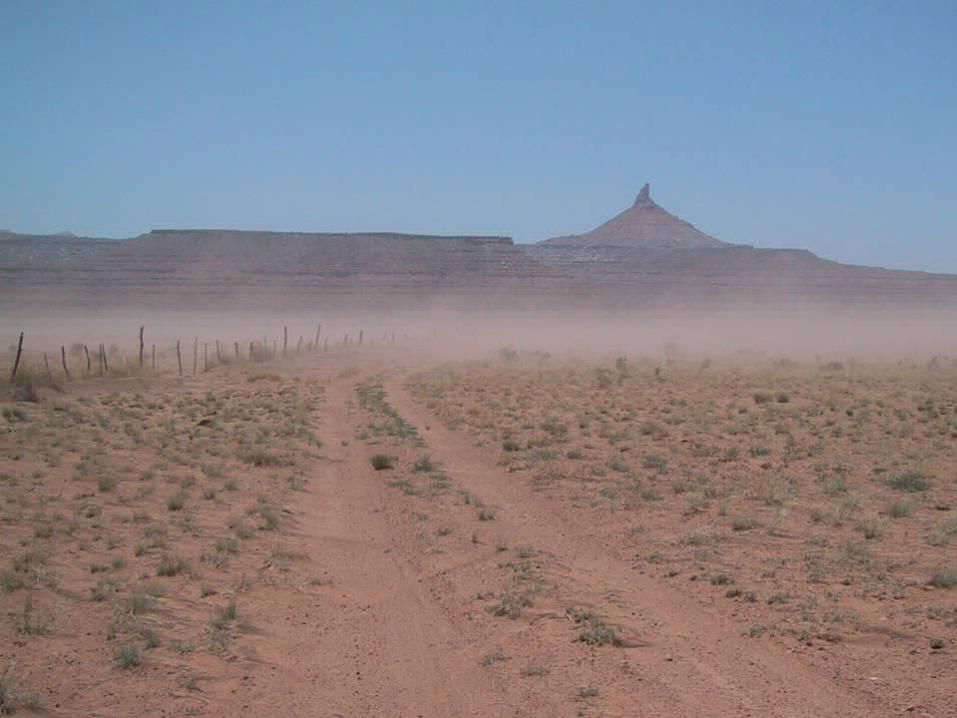
Dust coming off the Sahara Chadwick et al, 1999

P in Dust
Dust contains mineral aerosols and often is generated in deserts (lots of CaPO4)
Once deposited, dust can weather and contribute P to a soil. In very old systems, this is probably the only source of P to the ecosystems

Dust and the Mountains of the Western US

Dust Deposition in San Juan Mountains
1999
2004
2003


5.3X
5.3X
5.7X
Sediment loading increased ~ 200 years ago


Dust Provenance
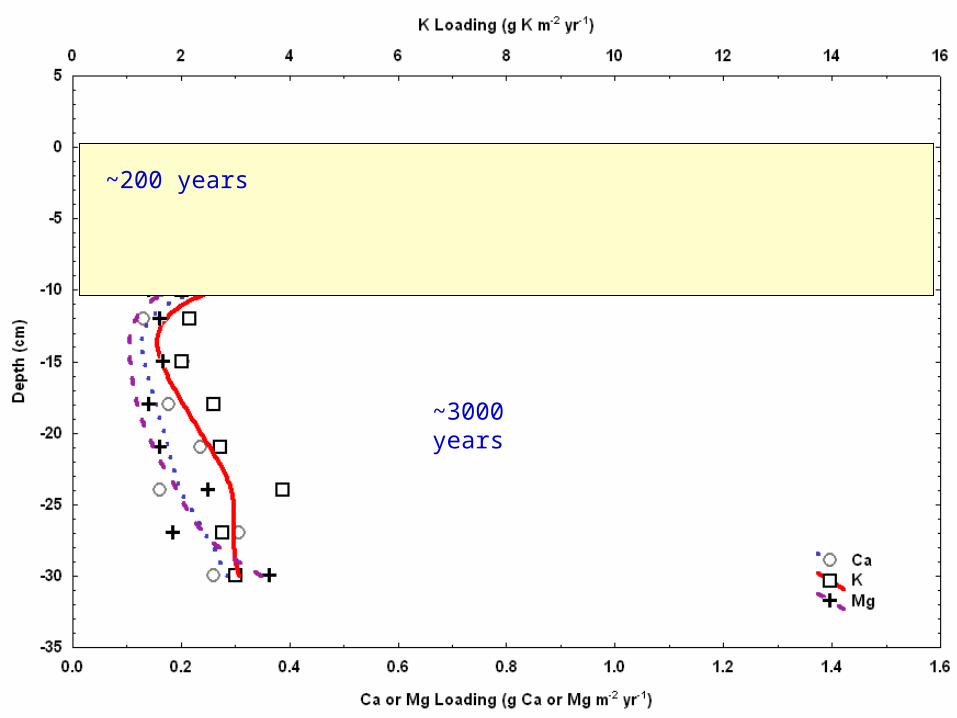
~200 years
~3000 years

~200 years
~3000 years

Sed. Rate (g m-2 sediment yr-1)Porphyry Tarn : Senator Beck
Tarn
Areal Flux (g m-2 yr-1)Porphyry Tarn : Senator Beck
Tarn
KContemporary1900-1920Historic
8.09 : 8.0416.83 : 12.832.89 : 2.48
0.97 : 1.732.03 : 2.77
0.35 : 0.0.54
MgContemporary1900-1920Historic
2.42 : 1.365.24 : 0.660.65 : 0.19
0.29 : 0.290.63 : 0.140.07 : 0.04
CaContemporary1900-1920Historic
3.11 : 1.013.88 : 0.750.44 : 0.19
0.37 : 0.220.47 : 0.140.05 : 0.04
PContemporary1900-1920Historic
0.60 : 0.310.44 : 0.300.05 : 0.05
0.07 : 0.070.05 : 0.060.01 : 0.01

How do changes in non-limiting nutrients affect ecological function?
What does it mean that P deposition has increased 7X relative to background rates?
What role does the deposition of base cations play in soil development and stream chemistry?
Summary
There are human perturbations to most of the biologically-relevant element cycles on earth.
For many of these perturbations (e.g. P, Ca, Mg etc), we lack basic information on the magnitude of change and the potential biological impacts.


