Phosphorylation and Dephosphorylation of Histone V (H5): Controlled Condensation of Avian Erythrocyte Chromatin? Michael T. Sung Appendix: Phosphorylation and Dephosphorylation of Histone H5. I I. Circular Dichroic Studies3 Thomas E. Wagner, Joe B. Hartford, Martin Serra, Vaughn Vandegrift, and Michael T. Sung ABSTRACT: During avian erythropoiesis, the blast cells of the bone marrow mature into polychromatic erythrocytes (late stages known as reticulocytes) and then into mature red blood cells. When chickens are made anemic, the proportion of im- mature cells in the anemic bone marrow increases dramati- cally. The level of the lysine-rich histones, H1 and H5, has been found to be constant in the blood and bone marrow of normal and anemic chickens. This implies that H5 replaces HI quantitatively. Urea-aluminum-lactate starch gel electro- phoresis of H5 from these sources shows that the degree of phosphorylation of H5 is proportional to the number of im- mature cells. About 70% of the H5 from the most immature bone marrow is phosphorylated, while 50% of the H5 from anemic blood is phosphorylated and H5 in normal blood is Erythropoiesis, the process of red blood cell formation and maturation, provides an excellent model system for studying the problems of cellular differentiation and gene regulation. The developing erythroid cells exhibit characteristic features of cytodifferentiation proceeding from genetically active early cells to inert mature erythrocytes. In mammals, this inacti- vation is accomplished by elimination of the nucleus during the terminal differentiation stages. In avians, however, the nucleus is retained in a highly condensed state. It is generally assumed that macromolecules in association with the eryth- rocyte chromatin are responsible for this metabolic inactivity. In particular, a major erythrocyte-specific histone, fraction V (H5), rich in lysine, serine, and alanine (Neelin et al., 1964, Hnilica, 1964) has been implicated (Johns, 1969). Early studies by Purkayastha and Neelin (1966) indicated that H5 is biosynthesized during the terminal stages of erythropoiesis. This suggests a simple role for the histone in bringing about the final gene inactivation and chromatin condensation. More recently, Appels et al. (1972) and Moss et al. (1973) showed that H5 is present, though at a reduced level, in the early dividing erythroblast. This observation argues + From the Department of Chemistry and Biochemistry, Southern II- linois University, Carbondale, Illinois 62901, Receiaed Jury 29, 1976. This work was generously supported by the American Cancer Society (Grants KP-122 and NP-122a). 3 From the Department of Chemistry, Ohio Universtiy, Athens, Ohio 47501 (T.E.W., M.S., and V.V.), and the Department of Chemistry and Biochemistry, Southern Illinois University, Carbondale, 111. 62901 (J.B.H. and M.T.S.). This work was generously supported by the American Cancer Society (Grants NP-122. NP-122a. and NP-123). almost completely devoid of phosphate. When immature cells of the anemic bone marrow are incubated in the presence of inorganic 32P and [3H]lysine and [3H]arginine, extensive 32P incorporation is found in the phospho species. A minimum of nine phosphorylated components have been demonstrated by starch gel electrophoresis. The incorporation of 3H is time dependent. After 1.5 h of labeling, 3H is found in H5 con- taining 0, I, 2, and 3 phosphates. The combined data suggest that newly synthesized H 5 becomes progressively phospho- rylated and that at the terminal stage of development, the phosphorylated H5 is completely dephosphorylated. These events may be important in controlling the timing of chromatin condensation. against a simple relationship between H5 biosynthesis and concomitant template inactivation. In the present paper, the metabolism of H5 is studied. We find that, after its synthesis in the cytoplasm, the protein is transported to the nucleus where it undergoes maturation. The process involves the se- quential unidirectional phosphorylation of the newly synthe- sized H5 molecule during which nine phosphoryl groups may be introduced. At the terminal stages of red cell maturation. the phosphorylated H5 becomes dephosphorylated. The se- quence of synthesis, phosphorylation, and dephosphorylation of H5 is very similar to that of the sperm-specific protein, protamine. This similarity, together with other evidence (Appels et al., 1974; Brasch et al., 1972, Kernell et al., 1971, Lurquin and Seligy, 1972), strongly suggests that the biological function of H5 in avian erythrocytes is akin to that of the sperm-specific protamine in condensing and packaging the DNA. Materials and Methods Materials. ~-['H]Arginine (12 Ci/mmol) and ~-[~H]lysine (50 Ci/mmol) were obtained from Schwarz/Mann; carrier free inorganic 32P from New England Nuclear; NCS reagent from Amersham Searle; hydrolyzed starch from 0. Hiller Co., Madison, Wis. The avian myeloid blastosis virus (AMV) was a gift from Dr. Joseph Beard. Chicken Blood and Bone Marrow Cells. The induction of anemia with 2-acetylphenylhydrazine and the preparation of blood and bone marrow cells from anemic and normal chickens have been fully described in another publication from this laboratory (Sung et al., 1977). 286 BIOCHEMISTRY. VOL. 16, NO. 2, 1977
Transcript
Phosphorylation and Dephosphorylation of Histone V (H5): Controlled Condensation of Avian Erythrocyte Chromatin?
Michael T. Sung
Appendix: Phosphorylation and Dephosphorylation of Histone H5. I I . Circular Dichroic Studies3
Thomas E. Wagner, Joe B. Hartford, Martin Serra, Vaughn Vandegrift, and Michael T. Sung
ABSTRACT: During avian erythropoiesis, the blast cells of the bone marrow mature into polychromatic erythrocytes (late stages known as reticulocytes) and then into mature red blood cells. When chickens are made anemic, the proportion of im- mature cells in the anemic bone marrow increases dramati- cally. The level of the lysine-rich histones, H1 and H5, has been found to be constant in the blood and bone marrow of normal and anemic chickens. This implies that H5 replaces HI quantitatively. Urea-aluminum-lactate starch gel electro- phoresis of H5 from these sources shows that the degree of phosphorylation of H 5 is proportional to the number of im- mature cells. About 70% of the H5 from the most immature bone marrow is phosphorylated, while 50% of the H5 from anemic blood is phosphorylated and H 5 in normal blood is
Ery thropoies i s , the process of red blood cell formation and maturation, provides an excellent model system for studying the problems of cellular differentiation and gene regulation. The developing erythroid cells exhibit characteristic features of cytodifferentiation proceeding from genetically active early cells to inert mature erythrocytes. In mammals, this inacti- vation is accomplished by elimination of the nucleus during the terminal differentiation stages. In avians, however, the nucleus is retained in a highly condensed state. It is generally assumed that macromolecules in association with the eryth- rocyte chromatin are responsible for this metabolic inactivity. I n particular, a major erythrocyte-specific histone, fraction V (H5) , rich in lysine, serine, and alanine (Neelin et al., 1964, Hnilica, 1964) has been implicated (Johns, 1969).
Early studies by Purkayastha and Neelin (1966) indicated that H5 is biosynthesized during the terminal stages of erythropoiesis. This suggests a simple role for the histone in bringing about the final gene inactivation and chromatin condensation. More recently, Appels et al. (1972) and Moss et al. (1973) showed that H 5 is present, though a t a reduced level, in the early dividing erythroblast. This observation argues
+ From the Department of Chemistry and Biochemistry, Southern I I - linois University, Carbondale, Illinois 62901, Receiaed Jury 29, 1976. This work was generously supported by the American Cancer Society (Grants KP-122 and NP-122a).
3 From the Department of Chemistry, Ohio Universtiy, Athens, Ohio 47501 (T.E.W., M.S., and V.V.) , and the Department of Chemistry and Biochemistry, Southern Illinois University, Carbondale, 111. 62901 (J.B.H. and M.T.S.). This work was generously supported by the American Cancer Society (Grants NP-122. NP-122a. and NP-123).
almost completely devoid of phosphate. When immature cells of the anemic bone marrow are incubated in the presence of inorganic 32P and [3H]lysine and [3H]arginine, extensive 32P incorporation is found in the phospho species. A minimum of nine phosphorylated components have been demonstrated by starch gel electrophoresis. The incorporation of 3H is time dependent. After 1.5 h of labeling, 3H is found in H5 con- taining 0, I , 2, and 3 phosphates. The combined data suggest that newly synthesized H 5 becomes progressively phospho- rylated and that a t the terminal stage of development, the phosphorylated H 5 is completely dephosphorylated. These events may be important in controlling the timing of chromatin condensation.
against a simple relationship between H5 biosynthesis and concomitant template inactivation. In the present paper, the metabolism of H 5 is studied. We find that, after its synthesis in the cytoplasm, the protein is transported to the nucleus where it undergoes maturation. The process involves the se- quential unidirectional phosphorylation of the newly synthe- sized H5 molecule during which nine phosphoryl groups may be introduced. At the terminal stages of red cell maturation. the phosphorylated H5 becomes dephosphorylated. The se- quence of synthesis, phosphorylation, and dephosphorylation of H5 is very similar to that of the sperm-specific protein, protamine. This similarity, together with other evidence (Appels et al., 1974; Brasch et al., 1972, Kernell et al., 1971, Lurquin and Seligy, 1972), strongly suggests that the biological function of H5 in avian erythrocytes is akin to that of the sperm-specific protamine in condensing and packaging the DNA.
Materials and Methods Materials. ~-['H]Arginine (12 Ci/mmol) and ~ - [ ~ H ] l y s i n e
(50 Ci/mmol) were obtained from Schwarz/Mann; carrier free inorganic 32P from New England Nuclear; N C S reagent from Amersham Searle; hydrolyzed starch from 0. Hiller Co., Madison, Wis. The avian myeloid blastosis virus (AMV) was a gift from Dr. Joseph Beard.
Chicken Blood and Bone Marrow Cells. The induction of anemia with 2-acetylphenylhydrazine and the preparation of blood and bone marrow cells from anemic and normal chickens have been fully described in another publication from this laboratory (Sung et al., 1977).
286 B I O C H E M I S T R Y . V O L . 1 6 , N O . 2 , 1 9 7 7
P H O S P H O R Y L A T I O N A N D D E P H O S P H O R Y L A T I O N O F H 5
For the induction of erythroblasts, 5-10-day-old white leghorn chickens were used. The birds were injected ip' or iv with 5-8 X 1 0 ' O particles of avian myeloid blastosis virus (AMV). The development of the disease and the proportion of erythroblast were monitored daily starting on the 8th day. Blood smears were analyzed by the method of Lucas and Jamroz (1961) using the stains of May-Griinwald-Giemsa. Near the terminal stages of the disease, the blood was obtained by cardiac puncture. The viremic blast cells were separated from matured erythrocytes by using albumin step gradients according to Leif and Vinograd (1964).
Cell Incubations. Blood and bone marrow cells were pre- pared as previously described (Sung et al., 1977). The incu- bation mixture consisted of 5 X lo8 cells/ml, 400 pCi/ml of inorganic 32P, 50 pCi/ml each of [3H]lysine and [3H]arginine, and modified Eagles' spinner medium (Sung et al., 1977) (minus arginine and lysine, and buffered with 10 mm Hepes instead of phosphate buffer). All incubations were carried out in a reciprocating water bath a t 40 OC.
Lysine-Rich Histones. The lysine-rich histones were re- covered as 5% perchloric acid soluble proteins from the 0.2 M HCI-solubilized crude histone preparations (Sung et al., 1977). H1 was separated from H5 on a Bio-Gel P-100 column (2.5 X 100) eluted with 0.01 M HCI and 0.01% azide.
Starch Gel Electrophoresis. Starch gels were prepared as previously described (Sung and Smithies, 1969). After elec- trophoresis, the gels were sliced horizontally and stained by the sensitive cobalt-amido black 10B procedure. For quanti- tation of the phospho species in H5, the stained gels were scanned in a Gilford linear-transport system. The densitometric tracing of H5 was monitored with an electronic digital inte- grator (Spectral Physics), and the area under each peak was automatically calculated. For analysis of radioactivity in the H5, the middle 2-mm horizontal slab was cut into 1-mm thick slices and solubilized in 0.4 ml of N C S reagent according to Louie and Dixon (1972). The samples were counted in a Packard Tricarb scintillation counter.
Results H5 Differentiation. In Figure 1 the lysine-rich histones
obtained from erythropoietic tissues representing various de- grees of maturation (a-d) are compared on Bio-Gel P-100 column. As expected, the relative level of H5 increases with the maturation of erythroid cells. Figure l a shows that the viremic blast cells do contain H5, though a t a reduced level. The ratio of H1 to H5 is 5:1, which is substantially lower than that obtained by Sotirov and Johns (1972) [3.4:1]. In our ex- periment, avian myeloid blastosis virus was used, which may have induced other myeloid blasts as well as erythroblasts. In the anemic bone marrow, 40% of the cells are erythroblasts and 38% are polychromatic erythrocytes (for composition of cell types, see Table I and also Williams 1972). The ratio of H1 to H5 is approximately 1:l (Figure lb). In the anemic blood, nearly all (95%) the cells are reticulocytes. The ratio of H1 to H5 is 1:2 (Figure IC) and in the very mature red cells of the normal blood it is 1:3 (Figure Id). The above ratios are in good agreement with the work of Billit and Hindley (1973) who analyzed in stained gels the content of the lysine-rich histones from the three tissues. The results suggest that H5 accumulates during red cell differentiation. However, if, as has been pro- posed, H I is partially replaced, this could cause an overesti-
I Abbreviations used are: iv, intraperitoneally; iv, intravenously; CD, circular dichroism; Hepes, 4-(2-hydroxyethyl)- 1 -piperazineethanesulfonic acid; Tris, 2-amino-2-hydroxymethyl- I ,3-propanediol.
I I
Fraction No. F I G U R E 1 : The differentiation of H5 during avian erythropoiesis. The lysine-rich histones ( H I and H5) were chromatographed on a Bio-Gel P-100 column (0.25 X 100 cm) and eluted with 0.01 M HCI containing 0.01% sodium azide, and 5-ml fractions were collected. The protein ab- sorbance in the fractions was read at 230 nm. H I emerged from the column first, followed by H5. The relative content of H5 was compared to H I in (a) viremic blast cells, (b) anemic bone marrow, (c) anemic blood, and (d) normal blood.
mation of the content of H5 in the more mature cells. To overcome this difficulty, the content of H5 was next compared to H4 in these and other experiments by integrating the P-60 chromatographic peaks as monitored at 230 nm. The ratio of H4 to H5 in anemic bone marrow, anemic blood, and normal blood is approximately 1 : 1, 1 : 1.5, and 1 :2. The combined ratio of (H1 + H5) is 2:l in all three tissues. The constancy in the sum of HI and H5 is not surprising, as others have shown that the total histone to DNA ratio appears to be constant through developmental stages (Appels et al. 1971). Our semiquanti- tative data indicate that H5 not only progessively accumulates but replaces H1 on a one-to-one basis. More quantitative ex- periments, however, are needed to establish this point.
Newly Synthesized H5 Undergoes Progressive Phospho- rylation. As has been pointed out in previous work (Sung et al., 1977), H5 in the erythroblasts (anemic bone marrow) shows extensive heterogeneity (when electrophoresed in starch gel) (see also Figure 3). It is known that enzymatic phospho- rylation and acetylation of histones can alter their electro- phcretic mobility and contribute directly to the observed multiple bands. That this heterogeneity is due to phosphoryl- ation alone can be substantiated by several lines of evidence. The slow migrating components disappear after treatment with alkaline phosphatase. There is no acetylation in H5 (Sung et al., 1977). There is extensive incorporation of inorganic 32P in the purified H5 following the labeling of immature anemic bone marrow cells (Sung et al., 1977).
B I O C H E M I S T R Y , V O L . 1 6 , N O . 2 , 1 9 7 7 287
S U N G
b
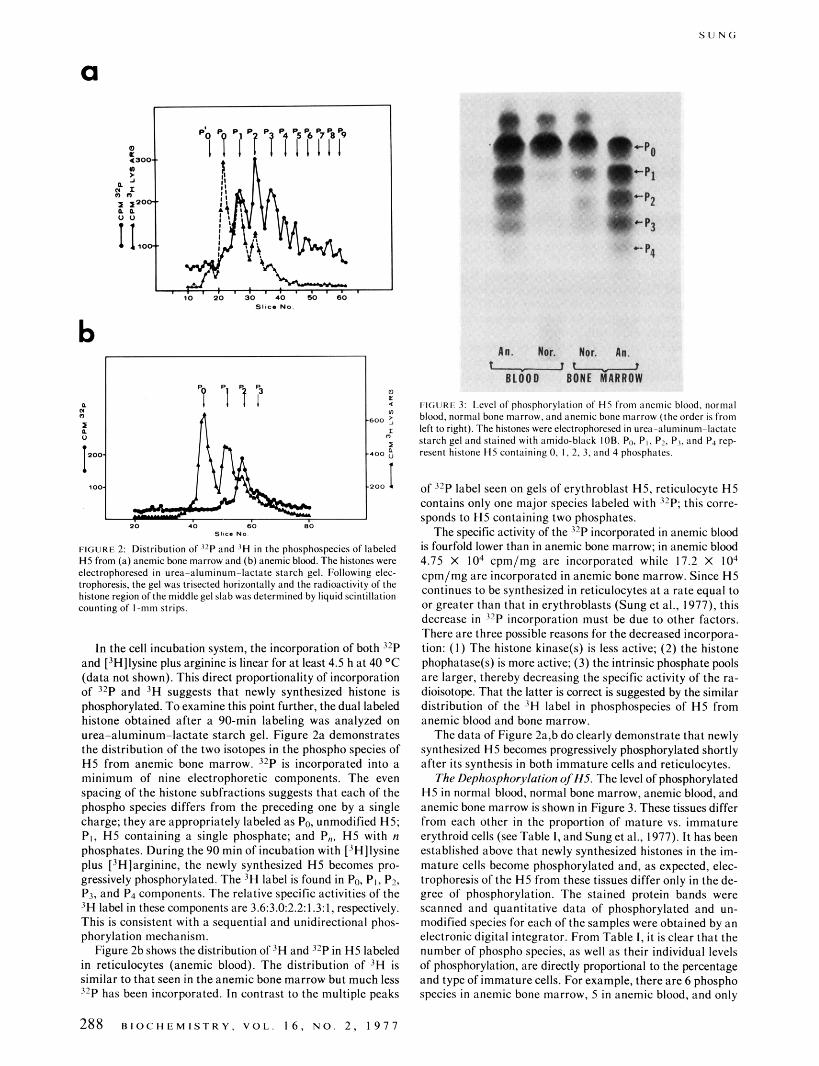
FIGURE 2: Distribution of I2P and 'H in the phosphospecies of labeled HS from (a) anemic bone marrow and (b) anemic blmd. The histones were electrophoresed in uTea~aluminum~lactate starch gel. Following elec- trophoresis. the gel was trisected horizontally and the radioactivity of the histone region of the middle gel slab was determined by liquid scintillation counting of I-mm strips.
In the cell incubation system, the incorporation of both '2P and ['Hllysine plus arginine is linear for at least 4.5 h at 40 O C
(data not shown). This direct proportionality of incorporation of '*P and 'H suggests that newly synthesized histone is phosphorylated. To examine this point further, the dual labeled histone obtained after a 90-min labeling was analyzed on urea-aluminum-lactate starch gel. Figure 2a demonstrates the distribution of the two isotopes in the phospho species of H5 from anemic bone marrow. '*P is incorporated into a minimum of nine electrophoretic components. The even spacing of the histone subfractions suggests that each of the phospho species differs from the preceding one by a single charge; they are appropriately labeled as PO, unmodified H5; P I , H5 containing a single phosphate: and P,. H5 with n phosphates. During the 90 min of incubation with ['Hllysine plus [)H]arginine, the newly synthesized H5 becomes pro- gressively phosphorylated. The 'H label is found in Po, PI, P2. P3, and P4 components. The relative specific activities of the 3H label in these components are 3.6:3.02.2:1.3:1, respectively. This is consistent with a sequential and unidirectional phos- phorylation mechanism.
Figure 2b shows the distribution of JH and '*P in H5 labeled in reticulocytes (anemic blood). The distribution of 'H is similar to that seen in the anemic bone marrow but much less 32P has been incorporated. In contrast to the multiple peaks
288 B I O C H E M I S T R Y . V O L 1 6 , N O . 2 , 1 9 7 7
FltiURli 3: Level of phosphorylation of HS from anemic blood. normal blood, normal bane marrow, and anemic bone marrow (the order i s from left to right). The histones were electrophoresed in urea~aluminum-lac(ntc starch gel and stained with amido-black IOB. Po. P,, P?. P1. and Pa rep- resent histone HS containing 0, I, 2, 3. and 4 phasphatcs.
of l2P label seen on gels of erythroblast H5, reticulocyte H5 contains only one major species labeled with 3 2 P this corre- sponds to H5 containing two phosphates.
The specific activity of the 32P incorporated in anemic blood is fourfold lower than in anemic bone marrow; in anemic blood 4.75 X IO4 cpm/mg are incorporated while 17.2 X I O 4 cpm/mg are incorporated in anemic bone marrow. Since H5 continues to be synthesized in reticulocytes a t a rate equal to or greater than that in erythroblasts (Sung et al., 1977). this decrease i n j rP incorporation must be due to other factors. There are three possible reasons for the decreased incorpora- tion: ( I ) The histone kinase@) is less active; (2) the histone phophatase(s) is more active; (3) the intrinsic phosphate pols are larger, thereby decreasing the specific activity of the ra- dioisotope. That the latter is correct is suggested by the similar distribution of the 'H label in phosphospecies of H5 from anemic blood and bone marrow.
The data of Figure 2a,b do clearly demonstrate that newly synthesized H5 becomes progressively phosphorylated shortly after its synthesis in both immature cells and reticulocytes.
The Dephosphorylation of HS. The level of phosphorylated H5 in normal blood, normal bone marrow, anemic blood, and anemic bone marrow is shown in Figure 3. These tissues differ from each other in the proportion of mature vs. immature erythroid cells (see Table I, and Sung et al., 1977). It has been established above that newly synthesized histones in the im- mature cells become phosphorylated and, as expected, elec- trophoresis of the H5 from these tissues differ only in the de- gree of phosphorylation. The stained protein bands were scanned and quantitative data of phosphorylated and un- modified species for each of the samples were obtained by an electronicdigital integrator. From Table I, it isclear that the number of phospho species, as well as their individual levels of phosphorylation, are directly proportional to the percentage and type of immature cells. For example, there are 6 phospho species in anemic bone marrow. 5 in anemic blood, and only
P H O S P H O R Y L A T I O N A N D D E P H O S P H O R Y L A T I O N O F H 5
~~~ ~ ~
T A B L E I .
Cell Type %of Total Histone H 5
Erythroblast Polychromatic Mature Red Source of (Oh) Erythrocyte (96) Blood Cells (96) Histone H 5 Po’ Po Pi p2 P3 p4 P5 Ph
~~~ ~
0 0 99 Normal blood 24.2 57.4 9.7 8.7 0 0 0 0 4 21 53 Normal bone 16.2 43.5 17.2 11.7 6.1 5.3 0 0
2 in the normal blood. In particular, the data suggest that H 5 synthesized in the early cells (blast and early polychromatic erythrocytes) is highly phosphorylated and undergoes pro- gressive dephosphorylation in the late polychromatic eryth- rocytes to become fully dephosphorylated in mature erythro- cytes. The Pol is the most cathodic migrating H 5 species and the content increases with the maturation stages. It is not known if Po1 is a minor component of H 5 or a degradation product. In any event, this minor component does not appear to affect the above conclusion.
Discussion The appearance of a cell-specific histone H 5 during the
terminal differentiation of avian erythroid cells is thought to be responsible for the final repression of the erythrocyte chromatin. However, one of the strongest arguments against H 5 serving such a role is its early synthesis in erythroblasts where much R N A synthesis is taking place and cell division continues. Others have tried to rationalize the problem by suggesting that the progressive inactivation is due to H 5 ac- cumulation. Yet, it is clear from our study that erythroblasts contain 20-30% of the final H 5 content and are still dividing and metabolically active. Therefore, other modulations are necessary to prevent the premature inactivation of chroma- tin.
Appels and Wells (1972) have suggested that the chroma- tin-bound H 5 in the immature cells is being continually re- newed and that it is this dynamic state of H 5 which permits template transcription. In terms of biological economy, such a control scheme is wasteful. Further, the scheme assumes a full complement of H5 in the erythroblasts and polychromatic erythrocytes, which is contradicted by our data presented in Figure 1. In early studies, we experienced difficulty in the handling of H 1 and H5 from erythroid cells. Presumably, these proteins are in extended conformations making them suscep- tible to proteolytic attack. Whether this has bearing on the study of Appels and Wells (1972) is not known a t present.
In the present study, we show conclusively that newly syn- thesized H 5 becomes progressively phosphorylated (see also Tobin and Seligy, 1975). The phosphorylation of other basic proteins is well documented, especially during spermatogenesis in trout testis (Louie and Dixon, 1972; Sung and Dixon, 1970). In this regard, the metabolism of H 5 appears to be similar to that of the sperm-specific protein, protamine; i.e., soon after synthesis, multiple sites are phosphorylated, and then de- phosphorylation occurs later. These two proteins may also both play similar roles in the condensation of chromatin, although in avian erythropoiesis there is no complete replacement of histones during condensation (Appels et al., 1972; Billet and Hindley, 1972). By analogy to the protamine story and in light of the present study, a maturation pathway for the newly
synthesized H 5 may be explained as follows. In the first half of the process, phosphokinases catalyze sequential esterifica- tion of phosphoryl groups to strategic seryl residues in the newly synthesized H5 molecule. The conversion steps are un- idirectional, from the nascent histone PO - P I - Pz - P,, where P represents H 5 containing 0, 1, 2, and n 2 9 phos- phates. The purpose of this phosphorylation may be to orient the binding of H 5 to DNA such that, in the highly phospho- rylated state, the strong interactions between the two macro- molecules may be diminished to the point that weak, yet spe- cific, forces could come into play. During the second half of the maturation process, the properly oriented H5 is sequentially dephosphorylated by specific phosphatases. By dephosphor- ylation, the histone regains its strong interactions with DNA and thereby brings about well controlled condensation of the mature erythrocyte chromatin.
On an a priori basis, the highly phosphorylated H 5 will bind with reduced affinity to the erythrocyte chromatin; the reduced affinity may make the complex “functionally inactive”. Con- sistent with this contention, we have shown in the Appendix that, in contrast to unmodified H5, the highly phosphorylated form from anemic bone marrow is not capable of mediating conformational changes in the DNA. At terminal stages of red cell maturation, the highly phosphorylated H5 becomes de- phosphorylated and this event does correlate well with the cessation of macromolecular biosynthesis and chromatin condensation.
Acknowledgment The excellent technical assistance of Marsha Bundman, and
the critical editorial comments of Dr. Elizabeth Freedlender are gratefully acknowledged.
Appendix: Phosphorylation and Dephosphorylation of Histone H5. 11. Circular Dichroic Studies
The circular dichroic (CD) study described in this Appendix compares the effects of H 5 samples which are phosphorylated to different degrees (see Table I) on the conformation of DNA in the in vitro reconstituted nucleohistone complexes. Details on the parameters which influence the conformational effects of H5 on DNA, such as salt concentration, DNA-histone ratio, and phosphorylation, will be reported elsewhere (Wagner et al., 1977, in preparation). Here, we describe the biological implication of this work. The purpose is to obtain preliminary physical evidence for the suggested role of H 5 phosphorylation and dephosphorylation in bringing about a well-controlled condensation of avian erythrocyte chromatin.
Complexes of H5 with DNA. Chicken erythrocyte DNA was prepared by the procedure of Marmur (1961). The histone H 5 samples and DNA were dissolved in separate solutions containing 2 M NaCl and 0.01 M Tris-HC1, p H 7.2 Aliquots
B I O C H E M I S T R Y , V O L . 1 6 , N O . 2 , 1 9 7 7 289
S I J N G
w 2 2 0 2 4 0 2 8 0 2 8 0 3 0 0
*(nm)
F I G U R E 4: Circular dichroic spectra of H5 (m-m), DNA (-), anemic bone marrow H5-DNA complexes (- - -), anemic blood H5-DNA com- plexes (0-0) . normal bone marrow H5-DNA complexes (0-0). and normal blood H5-DNA complexes (0-0). The histone to DNA ratio in all complexes is 0.5:l and the spectra were measured at 0.15 M NaCI, 0.001 M Tris, pH 7.2.
of histone and DNA solutions were mixed while vortexing to obtain the histone-to-DNA input weight ratio of 0.5:l. The mixture of histone and DNA in high-salt solution was allowed to complex by the removal of salt using a gradient dialysis procedure at 4 O C (Bonner et al., 1968). A step gradient of 1.5, 1 .O, 0.4,0.3, and 0.15 M NaCl was used. Dialysis a t 1.5, 1 .O, 0.4, and 0.3 M with each solution containing 0.05 M Tris, pH 7.2, was for 4 h each and the final dialysis step at 0.3 M NaCl to0.15 M NaCl was for 12 h.
Circular Dichroism. Circular dichroic spectra were obtained using a Durum Jasco 5-20 circular dichrometer. The concen- tration of DNA in all nucleohistone H5 complexes was ap- proximately 1 X in DNA nucleotide residue. Mean res- idue ellipticity (8) is reported in deg cm2 dmol-' on the basis of DNA nucleotide residue concentration. The degree of tur- bidity of complexes was measured by calculating A ~ O O / A ~ ~ O ratios (Adler et al., 1971) and these were 10.07.
Figure 4 shows the C D spectrum of chicken DNA. It is characterized by a doublet maxima a t 275 and 280 nm (8275.280
= 8 100 f 200), a minimum at 247 nm (8247 = -9800), fol- lowed by a crossover a t 227 nm and with another positive maximum a t 218 nm (0218 = 3200). The CD spectrum of his- tone H5, regardless of degrees of phosphorylation, is generally featureless a t 250-300 nm and some secondary structure is observed a t the far-UV region. On the other hand, when the unmodified H5 (indicated as normal blood in Figure 4) is complexed to DNA in 0.15 M NaCI, it causes a marked change in the spectrum which is characteristic of the DNA alone. The biphasic nature of the positive band ( 8 2 8 3 = 2200) is completely removed. The crossover point and the negative maximum are both red shifted to 275 and 250 nm, respectively. At the other extreme, the CD spectrum of nucleohistone complex between DNA and the highly phosphorylated H5 from anemic bone
marrow is DNA like. Comparison of the nucleohistone C D spectra for the intermediate levels of phosphorylated H5 (anemic blood and normal bone marrow) further verifies that phosphorylated H5 is less capable of altering DNA confor- mation. The effect of phosphorylation of H5 on DNA con- formation is difficult to quantitate, since the phosphoryl- ation-mediated effects must be due to a combination of the sites, as well as the level of phosphorylation a t each site in the histones. Nevertheless, the magnitude of these effects appears to be dependent on the known level of phosphorylation in the histones (anemic bone marrow < anemic blood < normal bone marrow < normal blood).
The ability of H5 to alter DNA conformation suggests a mechanism for the genetic repression observed in nucleated erythrocytes. The decreased effectiveness of phosphorylated H5 in causing conformational change points to a means of controlling the repression.
References Adler, A. J., Schaffhausen, B., Langan, T. A., and Fasman,
Appels, R., Bolund, L., and Ringertz, R. R. (1 974), J . Mol.
Appels, R., and Wells, J. R. E. (1972), J . Mol. Biol. 70,
Appels, R., Wells, J. R. E., Williams, A. F. (1971), J . CellSci.
Billett, M. A., and Hindley, J. (1972), Eur. J . Biochem. 28,
Bonner, J., et al. (1968), Methods Enzymol. 1 2B, 3. Brasch, K., Setterfield, G., Neelin, J. M. (1972), Exp. Cell
Hnilica, L. S. (1964), Experientia 20, 12. Johns, E. W. (1969), Homeostatic Regul., Ciba Found. Symp.,
1969, Wolstenholm, G. E. W., and Knight, J., Ed., London, Churchill, pp 128.
Kernell, A. M., Bolund, L., and Ringertz, N. R. (1 97 1 ), Exp. Cell Res. 30, 609.
Leif, R. C., and Vinograd, J. ( I 964), Proc. Natl. Acad. Sri. U.S.A. 51, 520.
Louie, A. J., and Dixon, G. H. (1972), J . Biol. Chem. 247, 5490, 7962.
Lucus, A. M., and Jamroz, C. (1961), in Atlas of Avian He- matology USDA Monograph, p 25.
Lurquin, P. F., and Seligy, V. L. (1 972), Biochem. Biophys. Res. Commun. 46, 1399.
Marmur, J . (1961), J . Biol. Chem. 3, 208. Moss, B . A,, Joyce, W. G., and Ingram, V. M. ( 1 973), J . Biol.
Chem. 248, 1025. Neelin, J. M., Callahan, P. L., Lamb, D. C., Murray, K.
( 1 964), Can. J . Biochem. 42, 1743. Purkayastha, R., and Neelin, J. M. (1966), Biochim. Biophys.
Acta 127, 468. Sotirov, N., and Johns, E. W. (1972), Exp. Cell Res. 73,
13. Sung, M. T., and Dixon, G. H. ( 1 970), Proc. Natl. Acad. Sci.
U.S.A. 67, 1616. Sung, M. T., Harford, J. B., Bundman, M., and Vidalakis, G. (1977), Biochemistry 15 (preceding paper in this issue).
Sung, M . T., and Smithies, 0. (1969), Biopolymers 7 , 39. Tobin, R. S., and Seligy, V. L. (1975), J . Biol. Chem. 250,
Williams, A. F. (1972), J . Cell Sci. 10, 27.
G. D. (1971), Biochemistry 10, 909.
Biol. 87, 339.
425.
10, 47.
451.
Res. 74, 27.
358.
290 B I O C H E M I S T R Y . V O L . 1 6 , N O . 2, 1977