103
LEANDRO GOULART DE ARAUJO PHOTO-OXIDATIVE DEGRADATION OF BISPHENOL A BY H2O2/UV: PROCESS STUDY AND KINETIC MODELLING São Paulo 2018

LEANDRO GOULART DE ARAUJO
PHOTO-OXIDATIVE DEGRADATION OF BISPHENOL A BY H2O2/UV:
PROCESS STUDY AND KINETIC MODELLING
São Paulo
2018

LEANDRO GOULART DE ARAUJO
PHOTO-OXIDATIVE DEGRADATION OF BISPHENOL A BY H2O2/UV: PROCESS
STUDY AND KINETIC MODELLING
São Paulo
2018
Tese apresentada à Escola Politécnica da
Universidade de São Paulo para obtenção do título
de Doutor em Ciências

LEANDRO GOULART DE ARAUJO
PHOTO-OXIDATIVE DEGRADATION OF BISPHENOL A BY H2O2/UV: PROCESS
STUDY AND KINETIC MODELLING
São Paulo
2018
Tese apresentada à Escola Politécnica da
Universidade de São Paulo para obtenção do título
de Doutor em Ciências
Área de concentração: Engenharia Química
Orientador: Prof. Dr. Antonio Carlos Silva Costa
Teixeira


Ao meu pai pela imensa saudade e a
minha mãe por todo amor.

AGRADECIMENTOS
Ao Professor Antonio Carlos Silva Costa Teixeira, pela oportunidade, dedicação e orientação
transmitida durante todo o trabalho.
Me gustaría expresar mi agradecimiento al Profesor Orlando M. Alfano por recibirme en su
grupo de investigación, contribuyendo a mi desarrollo profesional y personal.
Mi más sincero agradecimiento a los investigadores Dr. Leandro Conte y Dra. Agustina V.
Schenone por ayudarme en mi aprendizaje y en la adquisición de nuevos conocimientos.
Aos meus pais: Álvaro (in memoriam) e Valdete, por todo carinho e amor. Vocês são meus
maiores exemplos de vida. Também quero agradecer a minha irmã Luciana, por acreditar em
mim e pelo carinho.
À minha companheira Thalita, por todo amor, carinho e aos maravilhosos momentos juntos.
Obrigado por cuidar de mim nos instantes difíceis, por não me deixar desistir e pela paciência
e suporte durante minha estadia no exterior.
Mi gratitud al Sr. Antonio Carlos Negro, por la amistad y los esfuerzos en ayudarme.
A mis profesores y amigos del Jiu Jitsu y de asados de la ciudad de Santa Fe, AR. En especial,
a mi profesor Emiliano Riestra y mis amigos Ruben F. Zapata por la gran amistad y
compañerismo, y Diego “Carioca” por la amistad.
A mis amigos del postgrado de la UNL, Isaías y Joana, por la amistad y compañía.
Aos amigos José Eduardo pela imensa ajuda e paciência, e ao José Otávio pelas valiosas
dicas.
Ao Professor Moisés T. dos Santos do Departamento de Engenharia Química e a Professora
Adriana Bauer da Faculdade de Educação pela atenção, ensinamentos e colaboração para o
meu desenvolvimento como monitor no programa de aperfeiçoamento de ensino (PAE).
À Professora Cristina Borba da Escola Politécnica, Poli-USP, e a Msc. Marina Lunndo
Letramento Acadêmico da Faculdade de Filosofia, Letras e Ciências Humanas, FFLCH -
USP, ambas pelas sugestões referentes à adequação da escrita em inglês para o exame de
qualificação.

À Dra. Adriana C. Velosa e à Professora Kátia R. B. Nogueira pelos ensinamentos.
Ao Murilo Moya e à Flaviane (Flavis) Santos pelos trabalhos feitos em conjunto.
Ao grupo Dempster MS Lab, em especial a Lidiane, Meriellen e Anita, por toda ajuda e
esforços.
Ao Professor Julio T. Marumo do IPEN, pelas sugestões e amizade.
Ao Dr. Paulo Firmino Moreira Junior por toda ajuda e esforços.
Aos “monstros” do laboratório Rodrigo e Joel, por toda ajuda e amizade.
Aos amigos de departamento, pelas risadas e ótimas discussões no almoço, cafés e churrascos.
Aos meus professores de jiu jitsu em São Paulo: Igor Schneider (Tigrão) e Julio, e aos amigos
e companheiros de equipe: Vinicius, Daniel, Milani, Julião e muitos outros, pelos treinos,
rodízios, açaís e amizade.
Aos meus amigos de Poços de Caldas, MG, pelos bons momentos. Em especial ao Tiago, pela
ajuda na mudança de formato de alguns gráficos.
Ao grupo AdOx, pelas valorosas contribuições. Em especial a Patrícia Metolina por sempre
estar disposta a ajudar.
Ao pessoal da secretaria, Elisete, Alexandre e Graça, pelos auxílios.
Ao programa de Pós-Graduação em Engenharia Química e a CAPES pelo auxílio financeiro.
A todos que contribuíram direta ou indiretamente no desenvolvimento deste trabalho.

“The important work of moving
the world forward does not wait to
be done by perfect men.”
(George Eliot)
RESUMO
O bisfenol A (BPA) é amplamente utilizado na fabricação de plásticos, resinas epóxi e
policarbonatos. Trata-se de um composto tóxico e um desregulador endócrino. Diferentes
estudos evidenciam a presença do BPA em diversos compartimentos ambientais em todo
planeta, identificando-o como um poluente persistente e resistente à degradação biológica,
que apresenta efeitos sinergéticos com outros poluentes. Nesse contexto, os processos
oxidativos avançados (POA) têm recebido atenção devido a sua capacidade em degradar
poluentes com tais características, transformando-os em compostos menos perigosos ou até
mesmo mineralizando-os totalmente. Apesar de haver trabalhos na literatura acerca da
utilização de POA para degradação de BPA, estudos sistemáticos dos efeitos de variáveis de
processo junto com a interpretação estatística dos resultados são virtualmente inexistentes.
Além disso, até onde se sabe um modelo cinético rigoroso ainda não foi proposto para a
degradação desse poluente por meio do processo H2O2/UV. Este trabalho teve por objetivo
avaliar a degradação do BPA pelo processo H2O2/UV, investigando os efeitos da
concentração inicial de H2O2 e da taxa específica de emissão de fótons (EP,0) por meio de um
projeto experimental Doehlert, combinado com a análise de superfície de resposta. Os
experimentos foram realizados em um reator tubular fotoquímico equipado com uma lâmpada
UV de 254 nm, para [H2O2]0 e EP,0 entre 1,6-9,6 mmol L-1 e 0,87 × 10¹⁸ - 3,6 × 10¹⁸ fótons L-1
s-1, respectivamente. Todos os experimentos sob H2O2/UV resultaram em total degradação do
BPA após 60 min de irradiação. Nesse caso, as melhores condições foram [H2O2]0 = 7,6
mmol L-1 e EP,0 = 3,6 × 10¹⁸ fótons L-1 s-1, para as quais se obteve o melhor desempenho
quanto à taxa de degradação de BPA e à remoção após 15 min, e a segunda maior remoção de
COT após 180 min. Entretanto, na maioria dos experimentos menos de 75% de remoção de
COT foram observados, com 95% de mineralização obtida apenas para os maiores [H2O2]0 e
EP,0. Elaborou-se um modelo matemático que considera as características do reator utilizado e
o campo de radiação, baseado no modelo de fonte linear de emissão em planos paralelos
(LSPP), combinado à equação de transferência radiativa (RTE), aos balanços materiais e a um
modelo cinético detalhado do processo H2O2/UV. Foi empregada a aproximação de estado
estacionário para todas as espécies radicalares. Na estimativa das constantes cinéticas
desconhecidas, utilizou-se o método de mínimos quadrados não linear. Esse modelo foi capaz
de ajustar satisfatoriamente as concentrações experimentais de BPA e de H2O2 em função do
tempo. Este trabalho mostra que o processo H2O2/UV constitui uma alternativa conveniente
para a degradação de BPA em matrizes aquosas, com total degradação do composto alvo e

porcentagem de mineralização adequada nas condições ótimas de operação. Tais condições
podem servir como diretrizes iniciais de processamento em escalas piloto e industrial. Por sua
vez, simulações empregando o modelo matemático proposto permitem gerar informações
úteis para projeto e aumento de escala de processos de pré- ou pós-tratamento de efluentes
contendo esse poluente.
Palavras-chave: Bisfenol A, Processos oxidativos avançados, UV, H2O2/UV, Carbono
orgânico total, modelagem cinética, modelagem do campo de radiação.

ABSTRACT
Bisphenol A (BPA) is widely used in the production of plastics, epoxy resins and
polycarbonates. It is a toxic, endocrine disruptor compound. Different studies have shown the
presence of BPA in several environmental systems, classifying it as a worldwide persistent
pollutant which may act synergistically with other pollutants. In this context, advanced
oxidation processes (AOP) have received great attention due to their ability to degrade
pollutants with such characteristics, through their transformation into less hazardous
compounds or even their mineralization. Although there are investigations on the use of AOPs
for BPA degradation, systematic studies on the effects of process variables, coupled with the
statistical interpretation of the results are virtually non-existent. Furthermore, to the best of
our knowledge, a rigorous kinetic model has not yet been proposed for the degradation of this
pollutant by the H2O2/UV process. The objective of this work was to evaluate BPA
degradation by the H2O2/UV process, investigating the effects of the initial H2O2
concentration and the specific rate of photons emission (EP,0) by means of a Doehlert
experimental design, combined with the response surface methodology. The experiments
were performed in a photochemical tubular reactor equipped with a 254-nm UV lamp, for
[H2O2]0 and EP,0 in the ranges 1.6-9.6 mmol L-1 and 0.87 × 10¹⁸-3.6 × 10¹⁸ photons L-1 s-1,
respectively. Total BPA degradation was achieved after 60 min of irradiation in all
experiments. The best conditions were [H2O2]0 = 7.6 mmol L-1 and EP,0 = 3.6 × 10¹⁸ photons
L-1 s-1, for which the best performance was obtained regarding the BPA degradation rate, BPA
degradation after 15 min, and the second highest TOC removal after 180 min. However, in
most experiments less than 75% TOC removal was observed, with 95% mineralization
obtained only for the superior [H2O2]0 and EP,0. A mathematical model was developed,
considering the reactor characteristics and the radiation field, based on the line source with
parallel emission (LSPP) approach, in combination with the radiative transfer equation (RTE),
mass balances, and a detailed kinetic model of the H2O2/UV process. The steady-state
approximation was applied for all radical species. In the estimation of unknown kinetic
constants, the non-linear least squares method was employed. The model was able to
satisfactorily fit experimental BPA and H2O2 concentrations as a function of time. This work
shows that the H2O2/UV process is a good alternative for BPA removal from aqueous
streams, with total degradation of the target compound and adequate percent mineralization
under optimal operating conditions. Such conditions may serve as first guidelines for pilot-
plant and industrial processes operation. In addition, simulations using the proposed kinetic

model may provide useful information for the design and scale-up of pre- or post-treatment of
effluents containing this pollutant.
Keywords: Bisphenol A, Advanced oxidation processes, UV, H2O2/UV, Total organic carbon,
Kinetic modelling, Radiation field modelling.
LIST OF FIGURES
Figure 3.1 ‒ Release and distribution of EDCs into the environment. ..................................... 26
Figure 3.2 – Diagram of BPA production by acid catalysed phenol with acetone condensation.
.................................................................................................................................................. 27
Figure 3.3 – Structural formula of bisphenol A. ...................................................................... 28
Figure 3.4 – Scheme of the main phenomena responsible for pollutant degradation by the
H2O2/UV process. ..................................................................................................................... 34
Figure 3.5 – Schematic diagram of the kinetic modelling strategy. ......................................... 43
Figure 3.6 – LSPP model in perspective. ................................................................................. 45
Figure 3.7 − LSSE model in perspective. ................................................................................. 46
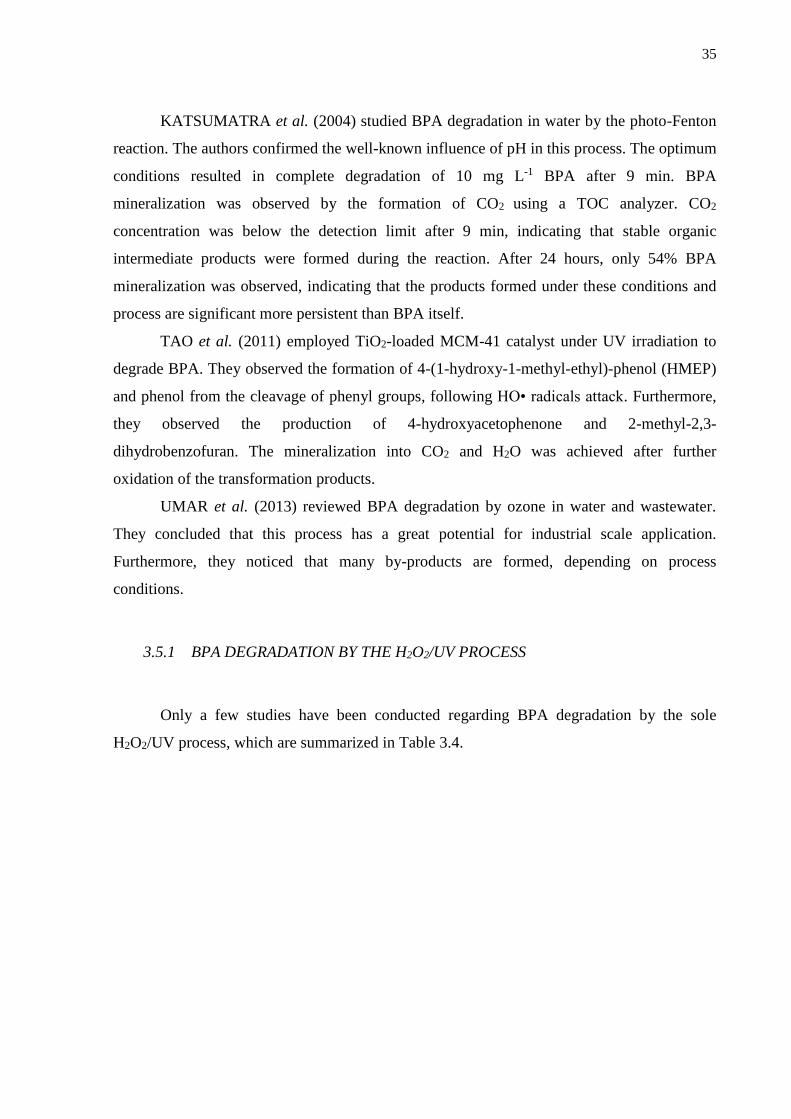
Figure 4.1 ‒ Experimental apparatus. ....................................................................................... 51
Figure 4.2 – Scheme of the experimental apparatus. ................................................................ 51
Figure 4.3 ‒ Experimental design based on the Doehlert matrix for the H2O2/UV process. ... 53
Figure 5.1 – Representation of the annular photoreactor. ........................................................ 60
Figure 5.2 ‒ Scheme of the radiation field. .............................................................................. 61
Figure 6.1 – UV-Vis absorption spectrum of BPA in aqueous solution. ................................. 67
Figure 6.2 ‒ BPA degradation during the H2O2/UV experiments for different H2O2 initial
concentrations and specific photon emission rates. [BPA]0 = 48.2 ± 0.9 mg L-1. Conditions
([H2O2]0, mmol L-1 – EP,0, × 1018 photons·L-1 s-1): Exp 1 (3.6 – 3.6); Exp 2 (7.6 – 3.6);
Exp 3 (9.6 – 1.4); Exp 4 (7.6 – 0.87); Exp 5 (3.6 – 0.87); Exp 6 (1.6 – 1.4);
Exp7 (5.6 – 1.4). Experiments run in duplicate. ....................................................................... 68
Figure 6.3 ‒ Total organic carbon removal during the H2O2/UV experiments for different
H2O2 initial concentrations and specific photon emission rates. [TOC]0 = 38.7 ± 0.9 mg L-1.
Conditions ([H2O2]0, mmol L-1 – EP,0, ×1018 photons L-1 s-1): Exp 1 (3.6 – 3.6); Exp 2
(7.6 – 3.6); Exp 3 (9.6 – 1.4); Exp 4 (7.6 – 0.87); Exp 5 (3.6 – 0.87); Exp 6 (1.6
– 1.4); Exp 7 (5.6 – 1.4). Experiments run in duplicate. ...................................................... 70
Figure 6.4 ‒ Time profiles of hydrogen peroxide concentrations during the H2O2/UV
experiments. .............................................................................................................................. 71
Figure 6.5 ‒ Time profiles of pH during the H2O2/UV experiments.pH0 = 7.08 ± 0.47.
Conditions ([H2O2]0, mmol L-1 – EP,0, ×1018 photons L-1 s-1): Exp 1 (3.6 – 3.6); Exp 2
(7.6 – 3.6); Exp 3 (9.6 – 1.4); Exp 4 (7.6 – 0.87); Exp 5 (3.6 – 0.87); Exp 6 (1.6
– 1.4); Exp 7 (5.6 – 1.4). Experiments run in duplicate. ...................................................... 72

Figure 6.6 ‒ Pareto charts for the responses. Degrees of freedom = 8 (t = 2.31). Fisher F for
95% confidence level. (a) Y1, apparent first-order specific BPA degradation rate (min-1). (b)
Y2, BPA degradation after 15 min (%). (c) Y3, TOC removal after 120 min (%). X1 and X2 are
the codified independent variables corresponding to [H2O2]0 and EP,0, respectively. .............. 74
Figure 6.7 ‒ Distribution of residuals as a function of the predicted values. (a) Y1, apparent
first-order specific BPA degradation rate (min-1). (b) Y2, BPA degradation after 15 min (%).
(c) Y3, TOC removal after 120 min (%). X1 and X2 are the codified independent variables
corresponding to [H2O2]0 and EP,0, respectively. ...................................................................... 76
Figure 6.8 ‒ (a) Response surface for Y1 (apparent first-order specific BPA degradation rate,
min-1), described by Equation I in Table 6.2. (b) Contour plots. X1 and X2 are the codified
independent variables corresponding to [H2O2]0 and EP,0, respectively. .................................. 77
Figure 6.9 ‒ (a) Response surface for Y2 (BPA degradation after 15 min, %), described by
Equation II in Table 6.2. (b) Contour plots. X1 and X2 are the codified independent variables
corresponding to [H2O2]0 and EP,0, respectively. ...................................................................... 78
Figure 6.10 ‒ (a) Response surface for Y3 (TOC removal after 120 min, %), described by
Equation III in Table 6.2. (b) Contour plots. X1 and X2 are the codified independent variables
corresponding to [H2O2]0 and EP,0, respectively. ...................................................................... 79
Figure 6.11 ‒ Experimental and predicted normalized BPA (□, dashed line) and H2O2 (▽,
solid line) concentrations over time for all experimental conditions. Conditions ([H2O2]0,
mmol L-1 – EP,0, ×1018 photons L-1 s-1): Exp 1 (3.6 – 3.6); Exp 2 (7.6 – 3.6); Exp 3 (9.6 – 1.4);
Exp 4 (7.6 – 0.87). Experiments run in duplicate. .................................................................... 82

LIST OF TABLES
Table 3.1 – Chemical and physical properties of BPA (STAPLES et al., 1998; BISPHENOL
A GLOBAL INDUSTRY GROUP, 2002; HAYNES, 2011; EUROPEAN
UNION, 2012; FENT et al., 2003; ZENG et al., 2006; XU et al., 2009; STAPLES
et al., 1998). ........................................................................................................... 28
Table 3.2 – Sample sites and corresponding BPA concentrations. .......................................... 30
Table 3.3 − Advanced Oxidation Processes. Adapted from CHENG et al. (2016). ................ 32
Table 3.4 – Literature review for the oxidation of BPA by the H2O2/UV process. ................. 36
Table 3.5 ‒ Reactions of the H2O2/UV process. Modified from EDALATMANESH et al.
(2008) and CRITTENDEN et al. (1999). *References: a target compound; b
depends on target organic compound. ................................................................... 40
Table 3.6 ‒ Quantum yields of H2O2 photolysis. Source: Adapted from OPPENLÄNDER
(2003). ................................................................................................................... 41
Table 4.1 ‒ Conditions of the H2O2/UV experiments. ............................................................. 53
Table 5.1 ‒ Reaction scheme for BPA degradation under the H2O2/UV process..................... 56
Table 5.2 ‒ Notations used for the parameters of the H2O2/UV process.................................. 57
Table 6.1 ‒ Conditions and results of the H2O2/UV experiments. Y1: apparent first-order
specific BPA degradation rate; Y2: BPA degradation after 15 min; Y3: TOC
removal after 120 min. [BPA]0 = 48.2 ± 0.9 mg L-1; [TOC]0 = 38.7 ± 0.9 mg L-1.
The Y values are the average of the results of duplicate runs. ............................... 69
Table 6.2 ‒ Response surface models obtained for the H2O2/UV process. Y1: apparent first-
order specific BPA degradation rate; Y2: BPA degradation after 15 min; Y3: TOC
removal after 120 min. Codified variables X1 and X2 refer to [H2O2]0 and EP,0,
respectively. See Table 6.1 for the codified values of the Doehlert design,
corresponding to [H2O2]0 (initial hydrogen peroxide concentration) and EP,0
(specific photon emission rate).............................................................................. 72
Table 6.3 ‒ Analysis of variance (ANOVA) for the apparent first-order specific BPA
degradation rate (Y1, min-1). Fisher F for 95 % confidence level. X1 and X2 are the
codified independent variables corresponding to [H2O2]0 and EP,0, respectively. 73
Table 6.4 − Analysis of variance (ANOVA) for BPA degradation after 15 minutes (Y2, %).
Fisher F for 95 % confidence level. X1 and X2 are the codified independent
variables corresponding to [H2O2]0 and EP,0, respectively. ................................... 73

Table 6.5 − Analysis of variance (ANOVA) for TOC removal after 120 minutes (Y3, %).
Fisher F for 95 % confidence level. X1 and X2 are the codified independent
variables corresponding to [H2O2]0 and EP,0, respectively. ................................... 73
Table 6.6 ‒ Comparison between literature and estimated values ........................................... 81

LIST OF ABBREVIATIONS AND ACRONYMS
1-D One dimension
ANOVA Analysis of variance
AOP Advanced oxidation processes
BPA Bisphenol A
CAS Chemical Abstracts Service
CV Control volume
DBP Dibutyl phthalate
DOC Dissolved organic carbon
EDC Endocrine disruptor compound
ESVE Extense source with volumetric emission
HPLC High performance liquid chromatography
IC Inorganic carbon
ICP Inductively coupled plasma
IUPAC International Union of Pure and Applied
Chemistry
LC-MS Liquid chromatography-mass spectrometry
LP Low-pressure
LSEE Line source with spherical emission
LSPP Line source with parallel plane emission
LVEPA Local volumetric rate of energy absorption
LVRPA Local volumetric rate of photon absorption
MP Medium-pressure
PPCP Pharmaceutical and personal care products
RMSE Root mean square error
RTE Radiation transfer equation
SPE Solid phase extraction
SPS Sodium persulfate
SSA Steady state approximation
TC Total carbon
TOC Total organic carbon
USEPA U. S. Environmental Protection Agency

UV Ultraviolet
VTG Vitellogenin
WWF World Wide Fund for Nature
YES Yeast estrogen screen

NOMENCLATURE
A Area cm2 or m2
b UV path length cm or m
[BPA]0 Initial BPA concentration mg L-1 or mol m-3
c Speed of light m s-1
C Constant -
Ci Concentration of the reacting species i mg L-1 or mol m-3
dA Small area on the x coordinate m2
dEν Total amount of radiative energy Einstein
dq radiation energy density flux Einstein m-3
DLamp Lamp diameter cm or m
𝑒𝜆𝑎(𝑥, 𝑡) Spectral local volumetric rate of photon absorption Einstein L-1 s-1
𝐸𝑃,0 Specific rate of photons emission photons L-1 s-1 or
Einstein m-3 s-1
𝐺𝜈(𝑥, 𝑡) Spectral incident radiation Einstein m-2 s-1
[H2O2]0 Initial H2O2 concentration mmol L-1 or mol m-3
Iλ,Ω Spectral specific intensity W m-2 sr-1
𝑘𝑛 Rate constant for a reaction n L mol-1 s-1
KOC Soil/sediment adsorption coefficient L kg-1
KOW Octanol-water partition coefficient -
l Path length of irradiation cm or m
L or LL Lamp length cm or m
n Normal vector -
Ni Flux of convection-diffusion of the reacting
species i
mol m-2 s-1

P Photon flow mol s-1 (Einstein s-1)
𝑞𝑖 Radiant flux mol cm-2 s-1 (Einstein
cm-2 s-1)
𝑟 Perpendicular distance from the lamp to a point
P(r,z)
m
R1 and R2 inner and outer radius of the photoreactor,
respectively
m
Ri Homogeneous reaction rate of the reacting species
i
m3 mol-1 s-1
𝑟𝐿𝑃 or 𝑅𝑖𝑛 Lamp radius m
𝑟𝑢𝑣,𝑖 Photolysis rate for the reacting species i mol L-1 s-1
𝑆𝐿 Radiation energy emission Einstein s-1 m-1
𝑠𝑟 Point of radiation entry in the photoreactor
reaction space
-
t Time seconds
𝑡0 Initial time seconds
V Total volume L or m3
Vr Irradiated volume L or m3
𝑥 Position in relation to the irradiation source in
cylindrical coordinates
m
𝑊𝛺,𝜈𝑎 Absorption contribution W m-3 s-2 sr-1
𝑊𝛺,𝜈𝑒 Emission contribution W m-3 s-2 sr-1
𝑊𝛺,𝜈𝑖𝑛−𝑠 In-Scattering contribution W m-3 s-2 sr-1
𝑊𝛺,𝜈𝑜𝑢−𝑠 Out-Scattering contribution W m-3 s-2 sr-1

Greek letters
dΩ or dω Solid angle degrees or radians
ɛ Molar (decadic) absorption coefficient m3 mol-1 s-1
𝜅𝑖 Volumetric absorption coefficient of
reacting species i
s-1
ɸ𝑖 Quantum yield for the reacting species i dimensionless
𝜌𝑖 Distance from point P(r, z) to an arbitrary
point of the lamp
m
θ Angle between the irradiated area and the
radiation source
degrees or radians
ν Radiation frequency Hz

CONTENTS
1. INTRODUCTION ............................................................................................................. 23
2. OBJECTIVES ................................................................................................................... 25
3. BACKGROUND ............................................................................................................... 26
3.1 Endocrine Disruptors Compounds ............................................................................. 26
3.2 BPA: Production and Process .................................................................................... 27
3.3 Physical and chemical properties of BPA .................................................................. 28
3.4 Environmental contamination and toxicity ................................................................ 29
3.5 Advanced Oxidation Processes (AOPs) .................................................................... 32
3.5.1 BPA degradation by the H2O2/UV process ........................................................ 35
3.5.2 H2O2/UV reactions ............................................................................................. 39
3.5.3 Photolysis quantum yield ................................................................................... 41
3.6 Kinetic and photoreactor modelling .......................................................................... 42
3.6.1 LSPP model ........................................................................................................ 44
3.6.2 LSSE model ........................................................................................................ 46
3.6.3 ESVE model ....................................................................................................... 47
3.7 Contributions of the Thesis ........................................................................................ 49
4. MATERIALS AND METHODS ...................................................................................... 50
4.1 Chemicals ................................................................................................................... 50
4.2 Equipment and Procedures ........................................................................................ 50
4.2.1 Determination of the molar absorption coefficient of BPA (ɛ) .......................... 50
4.2.2 Study of BPA photo-degradation ....................................................................... 50
4.2.3 Experimental Design: Doehlert matrix ............................................................... 52
4.2.4 Statistical analysis of the results ......................................................................... 53
4.3 Analytical Techniques ............................................................................................... 54
4.3.1 High-Performance Liquid Chromatography ....................................................... 54
4.3.2 Total Organic Carbon (TOC) ............................................................................. 54
4.3.3 Hydrogen Peroxide Determination ..................................................................... 54
5. Kinetic modelling .............................................................................................................. 55
5.1 Reaction mechanisms and rate equations .................................................................. 55
5.2 Material balances ....................................................................................................... 57

5.3 Photoreactor modelling - Emission models in a homogeneous system ..................... 60
5.3.1 LSPP model ........................................................................................................ 65
6. RESULTS AND DISCUSSION ....................................................................................... 66
6.1 Experimental results .................................................................................................. 66
6.1.1 Determination of the spectral molar absorption coefficient () .......................... 66
6.1.2 BPA degradation by the H2O2/UV process ........................................................ 67
6.2 Statistical analysis - results of the Doehlert experimental design.............................. 72
6.3 Kinetic modelling ...................................................................................................... 80
6.3.1 Parameters estimation – LSPP model ................................................................. 80
7. CONCLUSIONS AND FUTURE WORK ....................................................................... 85
8. REFERENCES .................................................................................................................. 87
23
1. INTRODUCTION
Bisphenol A (BPA) is widely used as an intermediate compound in the production of
several materials, such as plastics, epoxy and polycarbonate resins (BISPHENOL A
GLOBAL INDUSTRY GROUP, 2003). End products of such production processes are
powder paints, automotive lenses, compact disks, building materials, adhesives, among others
(STAPLES et al., 1998). BPA may be released into the environment from bottles, landfill
leachates, paper, packaging and chemical industry effluents (TORRES et al., 2008).
In 1998, Staples et al. (1998) showed that BPA toxicity is expected to be between low
to moderate level (algal EC50 of 1000 µg L-1). Moreover, previous studies revealed that this
pollutant could show estrogenic activity at mg L-1 levels (DODDS and LAWSON, 1936,
SODRÉ et al., 2007, KUSVURAN and YILDIRIM, 2013). However, in Brazil, only plastic
baby feeding bottles have specific regulations regarding this contaminant (RDC Resolution n.
41/2011), which forbid the importation and manufacture of these products containing BPA in
their formulation. Furthermore, the U.S. Environmental Protection Agency (USEPA) and the
World Wide Fund for Nature (WWF) consider BPA an endocrine disruptor compound (EDC)
(ZHANG and LI, 2014; MOHAPATRA et al., 2010).
BPA has been detected in wastewaters, and its removal using conventional treatment
techniques, such as the biological approaches, revealed to be ineffective (FÜRHACKER et al.
2000, MOHAPATRA et al., 2011). Therefore, alternative treatments capable of efficiently
degrading this pollutant are becoming a great concern. In this context, Advanced Oxidation
Processes (AOP) have been receiving great attention due to their capability to degrade
persistent pollutants, through their transformation into less hazardous compounds or even
their mineralization. Besides, they are easy to operate at room temperature and pressure,
among other advantages, such as treating contaminants at low concentrations (mg L-1-µg L-1)
(SHARMA et al., 2011; TITUS et al., 2004; DOMÈNECH et al., 2004). These processes
generate hydroxyl radicals (HO●), highly reactive, oxidative species capable of degrading
many organic compounds (ZAHORODNA et al., 2007). Hydroxyl radicals have a high redox
potential (2.8 V HSE) in comparison with other oxidants, only lower than that of fluorine
(PLANT and JEFF, 1994; HAGER, 1990).
Commonly applied AOPs for such purposes include Fenton (H2O2/Fe2+)
(MOHAPATRA et al., 2011) and photo-Fenton (H2O2/Fe2+/UV) reactions (KATSUMATA et
al., 2004), photocatalysis (RODRÍGUES et al., 2010; SIN et al., 2012), UV photolysis

24
(CHEN et al., 2007), sonication and ozonation (O3) (KUSVURAN and YILDIRIM, 2013;
UMAR et al., 2013), or their combination (CHEN et al., 2006).
In this context, this work is aimed at investigating the use of the AOP based on the
H2O2/UV system to remove BPA from water, focusing on the effect of the important
operational variables, namely hydrogen peroxide initial concentration and specific rate of
photons emission. To the best of our knowledge, the influence of these variables on BPA
degradation through H2O2/UV process has not been previously investigated considering a
detailed approach based on experimental design and response surface methodologies.
Furthermore, a mathematical model is proposed for the process, which can be used for
process optimization and scale-up.

25
2. OBJECTIVES
This study is aimed at investigating BPA degradation in water using the H2O2/UV
process. The specific objectives are:
To evaluate the effect of the specific rate of photons emission from the radiation
source and the H2O2 initial concentration under UVC at 254 nm upon BPA degradation;
To identify the optimal conditions of these variables for BPA degradation and total
organic carbon (TOC) removal;
To propose a mathematical model, phenomenological and empirical, for BPA
degradation by the H2O2/UV process.

26
3. BACKGROUND
3.1 Endocrine Disruptors Compounds
An endocrine system in perfect conditions is primordial for reproduction,
development, and growth of living organisms. Therefore, the identification of endocrine
disrupting compounds (EDCs) is necessary, since these substances can interfere with hormone
synthesis and/or hormone signalling (GUNNARSSON, 2008). According to the literature, the
first reports on these substances were published in the mid-20th century. Over recent decades,
research efforts to understand this problem have been intensively made (GUNNARSSON,
2008; LIU et al., 2009).
According to the US Environmental Agency (USEPA), an EDC is defined as: “An
exogenous agent that interferes with the synthesis, secretion, transport, binding, action, or
elimination of natural hormones in the body that are responsible for the maintenance of
homeostasis, reproduction, development, and/or behaviour” (EPA, 1997). This definition is
generic, and, for this reason, more than 87,000 known chemicals are considered EDC
(KOMESLI et al., 2015).
EDCs, both natural and synthetic are released into the environment by humans
(industry, agriculture, etc.) and animals. These substances, as well as other pharmaceutical
and personal care products (PPCPs), may reach environmental compartments (soil, surface
water, sediment and ground water) mainly through sewage treatment systems (LIU et al.,
2009; ROSENFELDT and LINDEN, 2004). The main distribution routes of EDCs into the
environment are illustrated in Figure 3.1.
Figure 3.1 ‒ Release and distribution of EDCs into the environment.
(Source: Modified from INGERSLEV and HALLING-SØRENSEN, 2003 apud LIU et al., 2009)

27
Some preliminary work about estrogenic chemicals was carried out by DODDS and
LAWSON (1936). Their first investigations on EDCs found that bisphenol A (BPA) showed
full estrogenic activity. In short, the experiments were carried out by injecting about 70 mg
kg-1 day-1 of BPA in ovariectomised adult rats, and changes were observed in vaginal
epithelium, a common response caused by estrogens. Usually, BPA targets hormones as the
thyroid, cortisol, and oestrogen.
3.2 BPA: Production and Process
BPA was discovered in 1905 and nowadays it has been mainly used to make
compounds, such as plastics, epoxy resins, and polycarbonate resins
(POLYCARBONATE/BPA GLOBAL GROUP, 2003). BPA production reached
approximately 4.6 million metric tonnes in 2012, an increment of 372,000 tonnes compared to
the record of 4.4 million in 2011 (MCGROUP, 2015).
One of the most common available processes for BPA production is the condensation
of phenol with acetone using an acid as the catalyst (AGRAWAL and SUMAN, 2012). Figure
3.2 illustrates BPA production by this process.
Figure 3.2 – Diagram of BPA production by acid catalysed phenol with acetone condensation.
(Source: Modified from AGRAWAL and SUMAN, 2012)
According to the authors, the first step is the addition of phenol and acetone in a molar
ratio of 3:1, under 50°C temperature and 1atm pressure. As indicated in Figure 3.2, anhydrous
hydrogen chloride and methyl mercaptan (MeSH) are added to the reactor. Hydrogen chloride

28
and MeSH act as the catalysis and promoter, respectively. The residence time in the reactor is
about 3 h. Since the reaction is exothermic, cooling water is required. The process is efficient,
with 99% acetone conversion to BPA with the addition of phenol in excess. HCl can be
recovered and recycled for further use. AGRAWAL and SUMAN (2012) stress the
importance of temperature control, considering that higher temperatures cause BPA
isomerization. The BPA solution is then purified by distillation and the water is separated.
Simultaneously with the distillation process, some stabilizers are added in order to avoid BPA
isomerization into o- and p- isomers. In the last distillation column, the reaction product is
distilled under lower pressure. Finally, the subsequent steps are employed to remove
remaining BPA isomers and purify the product through crystallization.
3.3 Physical and chemical properties of BPA
BPA is used for opposite purposes. As a plasticizer, BPA aims at increasing flexibility
and malleability. On the other hand, as a hardener, BPA is added into the material aiming at
increasing its resistance. Figure 3.3 presents the structural formula of BPA.
Figure 3.3 – Structural formula of bisphenol A.
(Source: FÜRHACKER et al., 2000)
BPA is solid, colourless, soluble in organic solvents and slightly soluble in water
(approximately 120 mg L-1) (AGRAWAL and SUMAN, 2012; AGENSON and URASE,
2007). Table 3.1 lists the main properties of BPA.
Table 3.1 – Chemical and physical properties of BPA (STAPLES et al., 1998; BISPHENOL A GLOBAL
INDUSTRY GROUP, 2002; HAYNES, 2011; EUROPEAN UNION, 2012; FENT et al., 2003; ZENG et al.,
2006; XU et al., 2009; STAPLES et al., 1998).
Main Properties
Chemical formula C15H16O2
Molar weight 228 g mol-1
CAS number 80-05-7
Solubility in water (25 ºC) 120 mg L-1
Melting point 153 °C (1 atm)
Boiling point 360 °C (1 atm)
Henry’s constant 4.0×10⁻⁸ mm Hg
KOC 115-3886 (slight mobility in soil)
Log KOW 3.4 (ambient pH)

29
3.4 Environmental contamination and toxicity
Since BPA is a widely-manufactured chemical, some concerns have been raised,
regarding its concentration in various environments, such as marine, aquatic, and terrestrial
(DORN et al., 1987). In addition, the pollutant concentration is an important step to be
considered before taking the necessary actions. Some EDCs were identified at µg L-1 level by
a nationwide survey of pollutants in U.S. surface water, including BPA (12 µg L-1) (KOPLIN
et al., 2002 apud ROSENFELDT and LINDEN, 2004). It is worth mentioning that there is a
large amount of studies regarding the presence BPA in diverse environmental compartments
around the globe. Table 3.2 details BPA concentrations measured in some of these sample
sites.

30
Table 3.2 – Sample sites and corresponding BPA concentrations.
General
overview
Specific sample spots BPA concentration
Reference
Country or
region
Industrial
activities
Metal/wood industry 2.6-35 µg L-1 FÜRHACKER et al.
(2000)
Austria
Chemical industry
2.5-50 µg L-1 FÜRHACKER et al.
(2000)
Austria
Hospital
1 µg L-1 FÜRHACKER et al.
(2000)
Austria
Paper production
28-72 µg L-1 FÜRHACKER et al.
(2000)
Austria
Cloth washing
company
1-8.9 µg L-1 FÜRHACKER et al.
(2000)
Austria
Food industry
3.8 µg L-1 FÜRHACKER et al.
(2000)
Austria
Household areas I
2.6 µg L-1 FÜRHACKER et al.
(2000)
Austria
Household areas II
5.8 µg L-1 FÜRHACKER et al.
(2000)
Austria
Influent
10-37 µg L-1 FÜRHACKER et al.
(2000)
Austria
Effluent
2.5 µg L-1 FÜRHACKER et al.
(2000)
Austria
Sewage leachates
1.3-5.4 µg mL-1
(without treatment);
0.5-5.1 ng mL-1
KAWAGOSHI et al.
(2003); COOR et al.
(2003);
YAMAMOTO et
al.(2001);
YAMADA et
al.(1999)
Japan;
Germany;
Japan
Food cans 4-23 µg L-1 BROTONS et al.
(1994)
Spain
Serum 0.2×10⁻³-20×10-3 µg
L-1
VANDERBERG et
al. (2007)
Review article
Human
body
Placental tissue
11.2×10⁻³ to
104.9×10⁻³ µg g-1
tissue
VANDERBERG et
al. (2007)
Review article
Breast milk 0.28-0.97 ng mL-1 SUN et al. (2004) Japan
Urine Male: 2.82-1.63 ng
mL-1 Female: 2.76-
1.12 ng mL-1
CALAFAT et al.
(2005); KIM et al.
(2003)
United States;
Korea
Semen Non-detected by
high sensitive
methods
VANDERBERG et
al. (2007)
Review article
Follicular fluid 2 ng mL-1 IKEZUKI et al.
(2002)
Japan
Saliva 3.33-30 µg mL-1 OLEA et al. (1996) Spain

31
Table 3.2 (Cont.) – Sample sites and corresponding BPA concentrations.
General
overview
Specific
sample
spots
BPA
concentration
Reference Country or region
Water in
general
Drinking
water
<1 µg L-1 EPA (2010) United States
Shallow
monitoring
wells
up to 4.5 µg L-1 ERICKSON (2012);
ERICKSON et al. (2014)
United States
Median
surface
fresh water
0.01 to 0.08 µg L-1 KLECKA et al. (2009) North America and
Europe
Water
leaving
waste
treatment
sites
up to 22 µg L-1 LEE et al. (2007); LEE et
al.(2011)
United States
Waste
Fly ash 2 µg kg-1 MORIN et al. (2015) Norway
Plastics 63 to 313 mg kg-1 MORIN et al. (2015) Norway
Landfill
leachates
median of 17 µg L-
1 (maximum 692
µg L-1)/
0.1 to 17200 µg L-
1
ARP (2012)/SAKAMOTO et
al. (2004); YASUHARA et al.
(1997); YAMAMOTO et al.
(2001); TARO et al. (2003);
ASAKURA et al. (2004);
KURATA et al. (2008)
Norway; Japan
The data provided by these studies yield convincing evidence that BPA is a
widespread pollutant, although the measured concentrations were very contrasting at different
sample spots.
As previously mentioned, BPA was identified as an estrogenic chemical. As regards to
this characteristic, USEPA evaluated BPA as a weak estrogenic, five orders of magnitude
lower than 17β-estradiol (CHEN et al., 2002). Additionally, no mutagenicity was identified.
BPA was considered toxic by the same agency, which used Daphnia magna as a reference
organism to measure toxicity (EC50=10 mg L-1 in a 48-h assay). Moreover, even low levels of
this contaminant may be considered a major concern because of its physiological effect in
living organisms (ROSENFELDT and LINDEN, 2004).
Despite the current discussion on the effects in humans, EDCs including BPA are
known to present chemical persistence, microbial resistance and may show synergistic effects
with other pollutants (TIJANI et al., 2013).

32
3.5 Advanced Oxidation Processes (AOPs)
There are many types of pre-treatments aiming at removing EDCs from several
matrices, such as chemical, mechanical, oxidative, biological or a combination of such types
(SCRIMSHAW and LESTER, 2003). According to CONTRERAS et al. (2003), biological
remediation is usually the most economical alternative to treat wastewater, ground water, and
other aqueous wastes. Biological degradation relies on a variety of factors; including
concentration, pH, and the chemical structure of the target compound (CONTRERAS et al.,
2003). The underlying argument against biological remediation is that many compounds are
considered bio-recalcitrant and the data gathered in the literature suggests EDCs in sewage
may be transferred to activate sludge because of their hydrophobic properties (LI et al., 2011;
CONTRERAS et al., 2003). In the literature, BPA concentrations in sludge were found to be
between 4 and 1363 ng g-1 (GATIDOU et al., 2007; FROMME et al., 2002). AOPs have
shown to successfully degrade several EDCs (SILVA et al., 2014; PUMA et al., 2010; LAU
et al., 2007, TERNES et al., 2003, ALUM et al., 2004; KATSUMATA et al., 2004;
ROSENFELDT and LINDEN, 2004; ROSENFELDT et al., 2007; SURI et al., 2007).
According to OPPENLÄNDER (2003), and as already mentioned, AOPs involve the
production of highly reactive and non-selective hydroxyl radicals (HO●), amongst other ROS,
which are the most important oxidizing specie in aqueous media (STAEHELIN and
HOIGNÉ, 1985). These radicals are generated by many different systems, with or without
irradiation (Table 3.3).
Table 3.3 − Advanced Oxidation Processes. Adapted from CHENG et al. (2016).
Irradiated Non irradiated
UV/O3 O3/H2O2
H2O2/UV O3/OH-
Electron beam H2O2/Fe2+ (Fenton)
TiO2/O2/UV Electro-Fenton
TiO2/ H2O2/UV Ultrasound
Photo-Fenton Wet air oxidation
Irradiated AOPs involve photochemistry concepts, which is a branch within the field
of chemistry that studies the chemical and physical phenomena that may occur as a result of
the interaction of chemical compounds with UV-visible radiation. This field of chemistry
involves the interaction between photons and molecules, particularly, the mechanistic

33
interpretations of photoproducts formation, as well as their characterization and identification
(OPPENLÄNDER, 2003).
Photochemical degradation may take place by direct or indirect photolysis. In
experiments conducted by direct photolysis, the organic compounds may be degraded by
absorbing UV-visible radiation. This degradation occurs by the interaction of compounds with
photons, leading to electronic excitation and cleavage of molecule bonds (PARSONS, 2015;
DOMÈNECH et al., 2001). In this regard, degradation must be performed at the appropriate
wavelength to reach the maximum efficiency. Parsons (2005) described the most common
photochemical reactions occurring by homolytic cleavage (Equations 3.1 to 3.6).
𝐴𝐵 + ℎ𝜈 → 𝐴𝐵∗ (3.1)
𝐴𝐵∗ → (𝐴⦁…𝐵⦁)𝑐𝑎𝑔𝑒 → 𝐴⦁ + 𝐵⦁ (3.2)
(𝐴⦁…𝐵⦁)𝑐𝑎𝑔𝑒 → 𝐴𝐵 (3.3)
𝐴𝐵∗ → (𝐴+…𝐵−)𝑐𝑎𝑔𝑒 → 𝐴+ + 𝐵− (3.4)
𝐴𝐵∗ + 𝑂23 → 𝐴𝐵⦁+ + 𝑂2
⦁− (3.5)
𝐴𝐵∗ + 𝑂23 → 𝐴𝐵 + 𝑂2
1 (3.6)
UV absorption by a molecule is given by Equation 3.1, which results in compound
excitation (highly energetic). The homolytic cleavage given by Equation 3.2 is the
predominant step of these reactions, in which the radicals escape from the solvent cage and
may undergo oxidation/reduction reactions. According to Equation 3.3, the recombination of
primary radicals has a high possibility of taking place in the reaction medium, which explains
the low quantum yield observed in some cases. In Equation 3.4, solvents with polar
molecules, such as water, promote heterolytic scission (NICK et al., 1992). Also, electrons
and energy may be transferred to dissolved oxygen molecules, even though a lengthy lifetime
of the excited state is necessary, as the triplet state. In this situation, many reactive oxygen
species (ROS) are produced, such as the superoxide anion radical (Equation 3.5) and singlet
oxygen (Equation 3.6) (PARSONS, 2005). As a result, dissolved oxygen plays an important
role in the oxidative degradation of pollutants and affects the reaction rates, the intermediate
products formed and the mineralization of the target compound (PARSONS, 2005).
An equally significant aspect of photolysis is the indirect degradation pathway. This
process uses oxidants as initiators of the photochemical reactions or via light absorption by
34
natural substances, such as chromophoric dissolved organic matter (ZEPP and CLINE, 1976).
As a consequence, this absorption may lead to the production of reactive oxygen species, such
as HO and 1O2, which react with organic contaminants by a series of oxidation reactions,
usually generating CO2 and water.
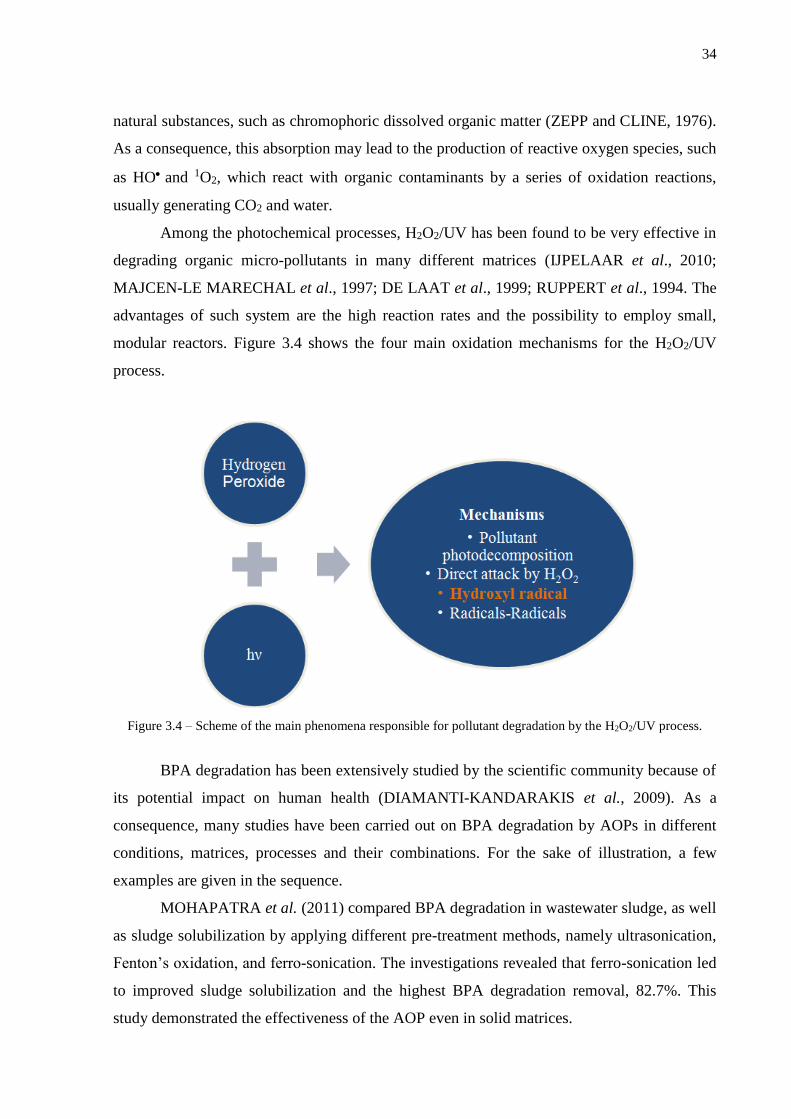
Among the photochemical processes, H2O2/UV has been found to be very effective in
degrading organic micro-pollutants in many different matrices (IJPELAAR et al., 2010;
MAJCEN-LE MARECHAL et al., 1997; DE LAAT et al., 1999; RUPPERT et al., 1994. The
advantages of such system are the high reaction rates and the possibility to employ small,
modular reactors. Figure 3.4 shows the four main oxidation mechanisms for the H2O2/UV
process.
Figure 3.4 – Scheme of the main phenomena responsible for pollutant degradation by the H2O2/UV process.
BPA degradation has been extensively studied by the scientific community because of
its potential impact on human health (DIAMANTI-KANDARAKIS et al., 2009). As a
consequence, many studies have been carried out on BPA degradation by AOPs in different
conditions, matrices, processes and their combinations. For the sake of illustration, a few
examples are given in the sequence.
MOHAPATRA et al. (2011) compared BPA degradation in wastewater sludge, as well
as sludge solubilization by applying different pre-treatment methods, namely ultrasonication,
Fenton’s oxidation, and ferro-sonication. The investigations revealed that ferro-sonication led
to improved sludge solubilization and the highest BPA degradation removal, 82.7%. This
study demonstrated the effectiveness of the AOP even in solid matrices.
35
KATSUMATRA et al. (2004) studied BPA degradation in water by the photo-Fenton
reaction. The authors confirmed the well-known influence of pH in this process. The optimum
conditions resulted in complete degradation of 10 mg L-1 BPA after 9 min. BPA
mineralization was observed by the formation of CO2 using a TOC analyzer. CO2
concentration was below the detection limit after 9 min, indicating that stable organic
intermediate products were formed during the reaction. After 24 hours, only 54% BPA
mineralization was observed, indicating that the products formed under these conditions and
process are significant more persistent than BPA itself.
TAO et al. (2011) employed TiO2-loaded MCM-41 catalyst under UV irradiation to
degrade BPA. They observed the formation of 4-(1-hydroxy-1-methyl-ethyl)-phenol (HMEP)
and phenol from the cleavage of phenyl groups, following HO• radicals attack. Furthermore,
they observed the production of 4-hydroxyacetophenone and 2-methyl-2,3-
dihydrobenzofuran. The mineralization into CO2 and H2O was achieved after further
oxidation of the transformation products.
UMAR et al. (2013) reviewed BPA degradation by ozone in water and wastewater.
They concluded that this process has a great potential for industrial scale application.
Furthermore, they noticed that many by-products are formed, depending on process
conditions.
3.5.1 BPA DEGRADATION BY THE H2O2/UV PROCESS
Only a few studies have been conducted regarding BPA degradation by the sole
H2O2/UV process, which are summarized in Table 3.4.

36
Table 3.4 – Literature review for the oxidation of BPA by the H2O2/UV process.
Article Compounds Process Quantification
method
Equipment used for the
H2O2/UV process H2O2 concentration(mg L-1) Fluence (UV*)**
BPA degradation TOC removal
ROSENFELDT
and LINDEN
(2004)
BPA (0.233 µmol L-1);
ethinylestradiol; estradiol
UV and
H2O2/UV
HPLC* ; TOC* 4 monochromatic 15-W low
pressure lamps and a 1-kW
medium-pressure lamp
15 and 24 1000 mJ cm-2 5 and 15%
(photolysis, LP and
MP, respectively);
90% (H2O2/UV for
both lamps)
Up to 65% (H2O2/UV)
CHEN et al.
(2006)
BPA (60 µmol L-1 or 13.7
mg L-1)
UV and
H2O2/UV
HPLC; YES*;
VTG*
4 monochromatic 15-W low
pressure Hg lamps
10, 25 and 50 100 to 5000 mJ
cm-2
Irrelevant degradation
rates (photolysis);
99% (H2O2/UV)
-
CHEN et al.
(2007)
BPA (60 µmol L-1 or 13.7
mg L-1)
UV and
H2O2/UV
HPLC; YES;
VTG
4 monochromatic 15-W low
pressure Hg lamps
10, 25 and 50 100 to 5000 mJ
cm-2
Lower than 20%
(photolysis);
97% (H2O2/UV)
-
FELIS et al.
(2010)
BPA (10 mg L-1) UV and
H2O2/UV
HPLC; TOC 200-W medium pressure
mercury lamp
10, 100 and 1000 754.78 W m-3 About 97%
(photolysis);
below the limit of
quantification
(H2O2/UV)
Lower than 20%
(photolysis); up to
42% (H2O2/UV; lower
than 20%
(H2O2//UV/HCO3-)
PARK et al.
(2014)
BPA (9,14 mg L-1) UV, H2O2/UV
and
Ozone/H2O2
HPLC 65 W, UV lamp 150 and 300 20 mW cm-2 42,8% (photolysis and
nitrate);
29,6% (photolysis)
-
ZHANG and LI
(2014)
BPA (0.07, 0.13 and 0.26
mg g-1 dry weight);
estrone; 17β-estradiol;
estriol; 17α-
ethinylestradiol; 4-
nonylphenols
UV,
H2O2/UV,
photo-Fenton
like
SPE*/HPLC;
luminescence
spectrometry;
ICP*; DOC*
75-W low pressure Hg lamp 1700 to 68000 0.069 mW cm-2 30 to 50 %
(photolysis); up to
99% (H2O2/UV); up to
90% (H2O2/Fe2+/UV)
-
OLMEZ-
HANCI et al.
(2014)
BPA (20 mg L-1
or 88 µmol L-1)
UV, H2O2/UV
and UV/S2O82-
HPLC; Vibrio
fischeri bioassay;
YES; LC-MS*;
TOC
6 UV-C lamps (8 W each) 85 21 W h L-1 52% (photolysis);
complete degradation
(H2O2/UV and
UV/S2O82-)
Not significant
(photolysis); 70%
(H2O2/UV and
UV/S2O82-)
SHARMA et
al. (2015;
2016)
BPA (0.22 mmol L-1) and
BPA (0.04-0.31 mmol L-1)
H2O2/UV and
UV/S2O82-
(SPS)
HPLC; TOC UV low pressure mercury
lamps (total 40 W)
0.05 to 0.5 1.26×10⁻⁶ E s-1 85% (H2O2/UV); up to
95% (S2O82-/UV)
55% (SPS/UV); 38%
(H2O2/UV)
JAMIL et al.
(2017)
BPA (0.175 mmol L-1);
paracetamol; DBP
UV,
H2O2/UV,
Fenton and
photo-Fenton
HPLC UV medium pressure
mercury lamp (150 W)
0.17 to 1.02 1.32×10⁻⁵ E s-1 100% (all processes) 80% (H2O2/UV); 90%
(photo-Fenton)
*HPLC: High Performance Liquid Chromatography; TOC: Total Organic Carbon; YES: Yeast Estrogen Screen; VTG: Vitellogenin; SPE/HPLC: Solid Phase Extraction; ICP: Inductively Coupled Plasma; LC-MS: Liquid Chromatography-Mass Spectrometry; UV: Ultraviolet. DOC: Dissolved Organic Carbon; SPS: Sodium persulfate. **The data are given by using the original units from each article. Their transformation to the same unit was not
possible, since some necessary data to perform conversions are missing.

37
ROSENFELDT and LINDEN (2004) compared the efficiency of BPA degradation by
photolysis (UV-C) and by the combination H2O2/UV. The results showed that the
polychromatic UV medium-pressure (MP) lamp was slightly more effective than the
conventional UV low-pressure (LP) lamp. Furthermore, the combination H2O2/UV was much
more effective when compared to direct UV photolysis. The photolysis resulted in BPA
removals of approximately 5 and 15% for LP and MP lamps, respectively. In turn, the
H2O2/UV process resulted in BPA removals of about 90% for both lamps. A model for the
H2O2/UV process was developed and used by the authors to predict the degradation of some
EDCs in different conditions.
CHEN et al. (2006) evaluated the use of direct photolysis with LP-UV lamps and the
combination H2O2/UV. The authors showed that photolysis is not efficient to degrade BPA
(irrelevant degradation rates). On the other hand, the H2O2/UV achieved the reduction in BPA
concentration and estrogenic activity for both in vitro and in vivo. In vitro yeast estrogen
screen (YES) and in vivo vitellogenin (VTG) resulted in EC50 values of 7.23 μmol L-1 and
14.7 μmol L-1, respectively. The most efficient conditions were 5000 mJ cm-2 (UV fluence)
and 50 mg L-1 H2O2, resulting in BPA and estrogenic activity removals higher than 99%.
CHEN et al. (2007) studied BPA photolysis by LP and MP lamps. LP-UV data were
from CHEN et al. (2006). The study indicated that the MP-UV driven process was more
efficient. The parameters evaluated were BPA concentration and estrogenic activity. The
process efficiency was found to be similar regardless of the lamps for the H2O2/UV process.
The most efficient result was achieved with 25 mg L-1 of H2O2 and fluence of 5000 mJ cm-2,
which resulted in BPA and estrogenic activity removals higher than 97%. According to the
authors, the necessary fluence to achieve this result was even lower for 50 mg L-1 H2O2. It is
worth mentioning that the photolysis experiments and UV+10 mg L-1 of H2O2 promoted a
lower removal of estrogenic activity in comparison with BPA degradation. This result may
suggest the formation of estrogenic degradation products and/or a synergistic response of
these products with the remaining BPA. The results of CHEN et al. (2006) indicated that the
degradation process did not result in the production of acutely toxic intermediates. However,
in 2007, the authors observed a production of acidic intermediates in the process, which
increased acute toxicity.
FELIS et al. (2010) investigated BPA degradation by means of sole UV-radiation and
the H2O2/UV process in the absence or the presence of bicarbonate ions (HCO3). Initial BPA
concentration was 10 mg L-1. They employed a medium-pressure Hg lamp (255 to 579 nm)

38
and a nominal power of 400W. 𝐻𝐶𝑂3− ions concentration was 100 mg L-1. BPA degradation
by direct photolysis was about 97% after 30 minutes. For the combination H2O2/UV, BPA
concentration was below the limit of quantification after 15 minutes for all initial H2O2
concentrations: 10-1000 mg L-1.
PARK et al. (2013) studied the effect of nitrate on BPA degradation by three different
processes: UV, H2O2/UV, and H2O2/ozone. They observed that in the absence of H2O2, the
use of nitrate improved BPA degradation as a result of the hydroxyl radicals produced from
nitrate photolysis. This combination of photolysis with nitrate resulted in 42.8% BPA removal
after 30 minutes. On the contrary, in the absence of nitrate the authors achieved 29.6% BPA
degradation for the same reaction time. However, in the presence of H2O2, nitrate hindered
BPA removal, acting as a radical scavenger.
ZHANG and LI (2014) also evaluated UV irradiation and the combination H2O2/UV
in the degradation of BPA, estrone, 17β-estradiol, estriol, 17α-ethinylestradiol, and 4-
nonylphenols. They spiked 11 different metal ions in the solutions, which varied from 0.05 to
5 mmol L-1. The H2O2/UV process showed better results than UV alone. As indicated by the
authors, the BPA percent removals at pH values of 3, 5 and 7 were 89, 84 and 74%,
respectively, after 2 minutes under the H2O2/UV process. They also observed a positive
impact of metal ions on the degradation of the target EDCs during the H2O2/UV process, due
to enhanced Fenton-type reactions. For instance, 5 mmol L-1 Fe2+ or Fe3+ concentration
increased BPA removal efficiency from ~15% to 100%.
OLMEZ-HANCI et al. (2014) investigated BPA degradation and detoxification using
direct photolysis, H2O2/UV, and S2O82-/UV. BPA concentration was 20 mg L-1. The oxidant
doses were 2.5 mmol L-1. They employed six lamps of 8 W each, with maximum emission
band of the UV-C lamps at 253.7 nm. The UV-C light fluence was 2.27 W L-1. Under direct
photolysis, the degradation achieved was 52% after 120 min of irradiation. For the H2O2/UV
process, complete BPA degradation was observed in less than 10 min. TOC was 40%
removed after 120 min. The YES test indicated a rapid decline in estrogenic activity in the
first 5 min of treatment and kept decreasing during TOC removal. A closer look at the data
indicates that the UVC-driven treatment signalled more toxic by-products and with higher
estrogenic activities than the original compound. In addition, the authors admit the possibility
of complete mineralization under direct photolysis. However, this process requires a
considerable length of time, energy, and also a higher possibility of toxic intermediates being
formed.

39
SHARMA et al. (2015) also conducted experiments aiming at the degradation of BPA
using the H2O2/UV or S2O82-/UV. For the H2O2/UV process, BPA removal reached 85% at
the optimum conditions the authors considered. A low-pressure 40-W lamp emitting at 254
nm was used. The best H2O2 concentration was found to be 11.76 mmol L-1. It is worth
mentioning that oxidant concentrations at the higher levels showed an adverse effect, because
of the quenching of hydroxyl radicals by H2O2 molecules.
In a subsequent study, SHARMA et al. (2016) showed a mechanistic study of BPA
photo-oxidation employing the two different oxidants, H2O2 and sodium persulfate (SPS),
irradiated at 254 nm using a 40-W lamp. BPA concentrations varied from 0.04 mmol L-1 (~10
mg L-1) to 0.31 mmol L-1 (~70 mg L-1). The irradiation time was 360 min. The best BPA
removal (95.4%) for the H2O2/UV process was achieved for the inferior initial BPA
concentration. On the other hand, the superior initial BPA concentration resulted in the lowest
removal, with only 56. 8%. The evaluation of the TOC removal was undertaken only for the
BPA concentration of 0.22 mmol L-1 (50 mg L-1) and H2O2 concentration of 11.8 mmol L-1.
TOC removal was found to be 38.3% for the H2O2/UV system.
JAMIL et al. (2017) investigated the following homogeneous processes for degrading
paracetamol, bisphenol A, and dibutyl phthalate: UV, H2O2/UV, Fenton (H2O2/Fe(II)), and
photo-Fenton (H2O2/Fe(II)/UV) in water. Among them, the H2O2/UV system was found to be
the second most efficient in removing TOC. Both processes were investigated at pH 3 and 60
minutes of irradiation. The H2O2/UV process achieved 80% TOC removal using H2O2 at 25
mmol L-1. On the other hand, 90% TOC removal was attained using the photo-Fenton reaction
with H2O2 and Fe(II) concentrations of 5 and 3.6 mmol L-1, respectively.
Recent developments in BPA degradation by the H2O2/UV process allowed to
conclude that the process is efficient to degrade the target compound and may lead to the
formation of less toxic, non-endocrine disrupting intermediates. However, there is not a
systematic evaluation of process parameters, such as the oxidant concentration and photon
emissions rates from the same type of irradiation source. Usually, the comparison is made
using different types of sources, such as low and medium pressure Hg lamps.
3.5.2 H2O2/UV REACTIONS
CRITTENDEN et al. (1999) listed 44 elementary reactions in the H2O2/UV process,
obtained from independent published research. Since there are so many reactions involved, it

40
is usual to choose the most important reactions for the proposed mechanism.
EDALATMANESH et al. (2008) listed 15 reactions to propose a kinetic model for phenol
degradation under the H2O2/UV process. Some reactions are catalogued in Table 3.5.
Table 3.5 ‒ Reactions of the H2O2/UV process. Modified from EDALATMANESH et al. (2008) and
CRITTENDEN et al. (1999). *References: a target compound; b depends on the target organic compound.
Reaction
number Reaction k
R1 𝐻2𝑂2
ɸ𝐻2𝑂2→ 2𝐻𝑂⦁
𝑟𝑢𝑣,𝐻2𝑂2
R2 𝐻2𝑂2 +𝐻𝑂
⦁𝑘𝐼𝐼→ 𝐻2𝑂 + 𝐻𝑂2
⦁ 𝑘𝐼𝐼 = 2.7 × 10⁷𝐿 𝑚𝑜𝑙−1𝑠−1
R3 𝐻𝑂2
− +𝐻𝑂⦁𝑘𝐼𝐼𝐼→ 𝑂𝐻− +𝐻𝑂2
⦁ 𝑘𝐼𝐼𝐼 = 7.5 × 10⁹ 𝐿 𝑚𝑜𝑙−1𝑠−1
R4 𝐻2𝑂2 + 𝐻𝑂2⦁𝑘𝐼𝑉→ 𝐻𝑂⦁ +𝐻2𝑂 + 𝑂2 𝑘𝐼𝑉 = 3 𝐿 𝑚𝑜𝑙
−1𝑠−1
R5 𝐻2𝑂2 + 𝑂2
−𝑘𝑉→ 𝐻𝑂⦁ + 𝑂𝐻− + 𝑂2 𝑘𝑉 = 0.13 𝐿 𝑚𝑜𝑙
−1𝑠−1
R6 𝑂2•− +𝐻+
𝑘𝑉𝐼→ 𝐻𝑂2
• 𝑘𝑉𝐼 = 1 × 10¹⁰𝐿 𝑚𝑜𝑙−1𝑠−1
R7 𝐻𝑂2•𝑘𝑉𝐼𝐼→ 𝑂2
•− +𝐻+ 𝑘𝑉𝐼𝐼 = 1.58 × 10⁵𝑠−1
R8 𝐻𝑂⦁ +𝐻𝑂⦁
𝑘𝑉𝐼𝐼𝐼→ 𝐻2𝑂2
𝑘𝑉𝐼𝐼𝐼 = 5.5 × 10⁹𝐿 𝑚𝑜𝑙−1𝑠−1
R9 𝐻𝑂⦁ + 𝐻𝑂2⦁𝑘𝐼𝑋→ 𝑂2 +𝐻2𝑂 𝑘𝐼𝑋 = 6.6 × 10
9𝐿 𝑚𝑜𝑙−1𝑠−1
R10 𝐻𝑂2• +𝐻𝑂2
•𝑘𝑋→ 𝐻2𝑂2 + 𝑂2 𝑘𝑋 = 8.3 × 10
5𝐿 𝑚𝑜𝑙−1𝑠−1
R11 𝐻𝑂2• +𝑂2
•−𝑘𝑋𝐼→ 𝐻𝑂2
− + 𝑂2 𝑘𝑋𝐼 = 9.7 × 10⁷𝐿 𝑚𝑜𝑙−1𝑠−1
R12 𝐻𝑂⦁ + 𝑂2•−𝑘𝑋𝐼𝐼→ 𝑂2 + 𝑂𝐻
− 𝑘𝑋𝐼𝐼 = 7 × 10⁹𝐿 𝑚𝑜𝑙−1𝑠−1
R13 𝑅1𝑎 +𝐻𝑂⦁
𝑘𝑋𝐼𝐼𝐼→ 𝑖𝑛𝑡𝑒𝑟𝑚𝑒𝑑𝑖𝑎𝑡𝑒𝑠 → 𝐶𝑂2 +𝐻2𝑂 𝑘𝑋𝐼𝐼𝐼
𝑏
R14 𝑅1𝑎ɸ𝑅1
𝑎
→ 𝑖𝑛𝑡𝑒𝑟𝑚𝑒𝑑𝑖𝑎𝑡𝑒𝑠 → 𝐶𝑂2 +𝐻2𝑂 𝑟𝑢𝑣,𝑅1𝑎
The radical chain reactions are divided into (1) initiation: primary photolysis of H2O2
(R1); (2) propagation: (R2 to R4); (3) termination: (R8, R9 and R10); (4) degradation of the
target compound: (R13 and R14). The oxidizing capability of hydroxyl radicals is much
higher in comparison with other radical species. The rates of photolysis of H2O2 and the target
compound (𝑟𝑈𝑉,𝐻2𝑂2 and 𝑟𝑈𝑉,𝐵𝑃𝐴, respectively), appear in steps R1 and R14, and depend on
two parameters, which are the molar absorption coefficient (𝜀𝑖) and the photolysis quantum
yield (𝜙𝑖 ) (i species or oxidant). The molar (decadic) absorption coefficient indicates
quantitatively how chemical species interact with light. This value is substrate specific and

41
wavelength dependent (OPPENLANDER, 2003), with 𝜀𝐻2𝑂2 = 19 L mol-1 cm-1 and 𝜀𝐵𝑃𝐴 =
840 L mol-1 cm-1, both at 254 nm (OPPENLANDER, 2003; GOULART DE ARAUJO et al.,
2017)
The quantum yield is explained in the next section. More details about the reactions
will be given in Section 8.
3.5.3 PHOTOLYSIS QUANTUM YIELD
The photolysis quantum yield is defined in photochemistry as a measure of the global
efficiency of this process (BRAUN et al., 1991). This parameter is of interest when related to
H2O2 photochemistry. In theory, 1 mol of H2O2 should generate 2 moles of HO• (R1, Table
3.5). Nonetheless, experimental values may change depending on the experimental situation
(OPPENLÄNDER, 2003). For instance, in gas phase photolysis it is shown that other
photophysical and/or photochemical reaction channels occur, producing less than 2 moles of
HO• for each mol of hydrogen peroxide. In the liquid phase, this situation is more critical,
with the “cage effect” lowering the quantum yield of H2O2 photolysis to only 0.5.
Furthermore, hydroxyl radicals within the aqueous cage rapidly recombine to regenerate
hydrogen peroxide. Table 3.6 shows different quantum yields depending on the irradiation
wavelength as well as the phase.
Table 3.6 ‒ Quantum yields of H2O2 photolysis. Source: Adapted from OPPENLÄNDER (2003).
Oxidant Product Irradiation wavelength
λ nm-1, phase
Quantum yield
H2O2 HO•
200-354, gas phase 𝜙(−𝐻2𝑂2) = 1.0
254, in water 𝜙(−𝐻2𝑂2) = 0.5
313, in water 𝜙(−𝐻2𝑂2) = 0.30
254, in water 𝜙(+𝐻𝑂•) = 0.98
193, gas phase 𝜙(+𝐻𝑂•) = 1.22
248, gas phase 𝜙(+𝐻𝑂•) = 1.58

42
3.6 Kinetic and photoreactor modelling
According to EDALATMANESH et al. (2007), the study of kinetic models for
advanced oxidation processes is an important step to evaluate operation variables. Modelling
promotes a better understanding of the system, enabling its optimization as well as the
determination of the most relevant parameters for process design. However, oxidation
experiments conducted in different reactors revealed large discrepancies regarding reaction
kinetics (ZHANG et al., 2007, NAKASHIMA et al., 2003). In the case of studies using
estrogens, for example, and as reported by LI-PUMA et al. (2010), the main reason for these
differences is that the degradation rate constants were not set apart from the local volumetric
rates of photon absorption (LVRPA, ea) that took place for each reactor configuration.
Consequently, the comparison between different research results may be a difficult task and
even lead to inaccurate conclusions, limiting a potential scale-up of the oxidation system.
Moreover, according to MOHAJERANI et al. (2012), the radiation field, in photochemical
processes, is considered the main characteristic of the kinetics and photoreactors design. They
also underline that the photochemical reaction rate is proportional to the local volumetric rate
of energy absorption (LVREA), which is the same as LVRPA.
Similarly to conventional reactors, the analysis and modelling of photoreactors are
based on fundamental principles related to thermodynamics and transport phenomena
(moment, mass, and energy) (ALFANO et al., 1986). The study of photoreactors needs to
take into consideration both non photo-activated and photo-activated steps to properly
determine the reaction rates. As a result, the methodology must include dark steps
(conventional reactors) and irradiated steps (photochemical reactions). For the latter, the
LVRPA must be considered, since the reaction rate of photo-active steps depends essentially
on the rate photons are absorbed within the reacting volume. This rate is based on the spatial
distribution of radiant energy within the reaction space of the reactor, which relies on the
geometrical characteristics of the photoreactor system; physical and chemical parameters; and
on the concentration of the species capable of absorbing light. Figure 3.5 illustrates how these
steps are connected in order to obtain a numerical solution.

43
Figure 3.5 – Schematic diagram of the kinetic modelling strategy.
Source: Modified from IMOBERDORF et al. (2007)
There are two main explanations for non-uniformity in radiation field regarding
homogeneous photo-reactors: the attenuation of radiation by energy absorption of photo-
activated species (reagents and/or products) and the physical and geometric characteristics of
the system (radiation source/reactor). The light attenuation caused by the absorbing species
makes the LVRPA non-uniform.
The assessment of the LVRPA begins with a radiant energy balance at steady state
condition in a homogeneous system. Furthermore, a radiation source model is required. A
radiation source model can be obtained by the use of incidence models (GAERTNER and
KENT, 1958) or by the application of emission models (HARRIS and DRANOFF, 1965):
i. Incidence model: a mathematical model that assumes a distribution of a given
radiation in the vicinity of the reactor. The radiant energy on the reactor wall must be
measured experimentally. It considers the energy in normal planes in the axis of the
reactor and does not identify the dependency in regards to the axis coordinate;
ii. Emission model: This model proposes lamp emission fields. The incidence radiation
fields are later obtained, such as the incidence algorithm. This algorithm provides the
boundary condition for the radiant energy inside the reactor.

44
GARTER and KENT (1958) were one of the first to model photochemical reactions.
They studied the photolysis of aqueous uranyl oxalate. The experiments were performed in an
annular tubular reactor. The results demonstrated outstanding accuracy by assuming that the
photolysis rate was proportional to the residence time multiplied by the irradiance in a chosen
radial position. Reactant concentrations were not contemplated in their mathematical model.
According to MOHAJERANI et al. (2012), GARTER and KENT’s model could be applicable
only for low conversions (<12%). Moreover, this model cannot be used without empirically
adjusted parameters, which is a serious drawback for design purposes (ALFANO et al.,
1986).
Due to limitations of the incident models, an emission model will be applied in this
work in order to incorporate the radiation field term into the kinetic model. The main
emission models are the line source with parallel plane emission (LSPP), the line source with
spherical emission (LSSE), and the extense source with volumetric emission (ESVE)
(BRAUN et al., 1993).
The next section gives a brief overview of these emission models, pointing out their
main advantages and disadvantages, besides the general mathematical expressions used to
calculate the LVRPA. Note that this parameter is crucial to achieve a complete kinetic
expression and the choice of the model relies on the AOP employed and the experimental
geometry. The review paper by ALFANO et al. (1986) offers in detail an overview and a
critical discussion on this subject. Thenceforth, no conceptually new contributions have been
accomplished on the matter of radiation source emission modeling.
3.6.1 LSPP MODEL
LSSP is considered the simplest emission model and it is based on the following
assumptions (HARRIS and DRANOFF, 1965; ALFANO et al., 1986):
1. The source is seen as a line, with uniform emission along the axial direction (length);
2. The emitted radiation is on perpendicular planes regarding the lamp axis.
Figure 3.6 illustrates the LSPP model, where a point P(r, z) receives radiation on
perpendicular planes from a source, here considered linear. The variable r is distance from the

45
lamp to a point P(r,z); Rext is the maximum distance between the middle of the lamp and the
outermost point of the photoreactor; L is the lamp length.
Figure 3.6 – LSPP model in perspective.
For this model, the LVRPA (ea) is given by:
𝑒𝑎 = 𝜅𝑖𝑅𝑖𝑛𝑞𝑖𝑟𝑒𝑥𝑝[−𝜅𝑖(𝑟 − 𝑅𝑖𝑛)] (3.17)
with
𝑞𝑖 =𝑆𝐿
2𝜋𝑅𝑖𝑛=
𝑃
𝐿2𝜋𝑅𝑖𝑛 (3.18)
where κi is the volumetric absorption coefficient of reacting species (i), 𝑞𝑖 is the
radiant flux inmol cm-2 s-1 (Einstein cm-2 s-1), SL is the radiation energy in energy per unit time
and unit length, and P is the photon flow in mol s-1 (Einstein s-1). Rin is the radius of the
irradiation source.
The simplicity of this model is considered attractive; however, this model does not
predict experimental data within an acceptable error, except for a few cases (ROMERO et al.
1983). These few cases must present the following characteristics: (1) the lamp is situated
very close to the reacting medium and (2) the ratio of the reactor length and its diameter must

46
be large. In our case, both characteristics are presented. For that reason, the LSPP model is
considered adequate for our system.
3.6.2 LSSE MODEL
The lamp is viewed as a line source and each of its points emits radiation in every
direction and isotropically, using three dimensions to describe the emission process (JACOB
and DRANOFF, 1966). Furthermore, the source has a finite number of segments. Those
contributions are added up to estimate the radiant energy distribution within the reactor
(ALFANO et al., 1985).Figure 3.7 shows the geometry used for the LSSE model, where ρ is
the distance between a point A(r,z) to any point of the middle of the lamp (r = 0).
Figure 3.7 − LSSE model in perspective.
The value of ea is given by (CERDA, 1978):
𝑒𝑎 =𝑆𝐿𝜅
4𝜋𝑟∫ 𝑒𝑥𝑝 {−𝜅 [
(𝑟 − 𝑟𝐿𝑃𝑐𝑜𝑠𝜃
]} 𝑑𝜃
𝜃2
𝜃1
(3.19)
where 𝑟𝐿𝑃 is the lamp radius and θ is the angle formed between discretized points and the
irradiation source. More details about these angles will be given on Section 5.

47
According to ALFANO et al. (1986), line source models indicated satisfactorily good
results under various experimental configurations with the use of annular reactors. Note that
line source models are not suitable in the case of any kind of curved reflecting surface, a
situation where the consideration of the lamp as a line source would be unrealistic.
3.6.3 ESVE MODEL
This model assumes that the radiant energy source has finite spatial dimensions.
IRAZOQUI et al. (1973) considered the lamp as a perfect cylinder with null thickness. In
other words, the volume is the own irradiation source. The lamp shows constant emission in
the direction z. The term ea is then given by (CASSANO et al. 1995):
𝑒𝜐𝑎(𝑥, 𝑡) =
𝜅𝜐(𝑥, 𝑡)𝑃𝜐,𝑠2𝜋2𝑅𝐿𝐿𝐿
∫ 𝑑𝜑∫ 𝑑𝜑𝜃(𝜑)
𝑑𝜃𝑠𝑖𝑛𝜃𝑒𝑥𝑝 {−∫ 𝜅𝜐(��, 𝑡)𝑑����=𝑠(𝑥,𝜃,𝜑)
��=𝑆𝑟
}𝜑
(3.20)
It is worth mentioning that Equations 3.17-3.21 are the general forms used for each
model. Since ea is an irreducible function of position, the average value for the LVRPA (⟨𝑒𝑎⟩)
is the value that will be included in the kinetic expression, and it depends on the system
geometry. More details of the calculations for the LSPP model will be given in a later section
as regards our experimental setup.
As discussed earlier, no conceptually new contributions have been made since the
work published by ALFANO et al. (1986), and the present work is not intended to bring
innovations in this direction. However, many works have been developed using these
concepts. As there are many articles in which LVRPA has been added to the kinetic model,
we are not going to review each of them but the most used in the development of the present
work.
Studies demonstrated that under restricted optical and geometrical parameters, the
variations in the radial and angular coordinates did not result in significant changes regarding
the LVRPA (ALFANO et al., 1985; ALFANO et al., 1986a, ALFANO et al., 1986b).
ALFANO et al. (2001) presented a kinetic model to predict the degradation of 2,4-D and its
transformation products under the H2O2/UV process. The experimental work was carried out
in batch in a well-stirred tank irradiated underneath by a tubular lamp. They employed a one-
dimensional model (LSPP) to describe the monochromatic LVRPA spatial distribution, since

48
in previous works they found that radial and angular variations were not very significant for
their experimental apparatus (ALFANO et al., 1985; ALFANO et al., 1986; ALFANO et al.,
1986).
ROSSETTI et al. (2002) evaluated the decomposition of formic acid in water by the
photo-Fenton reaction. A kinetic model was developed to predict the decomposition rates of
formic acid and H2O2. The experimental study was performed in a flat-plate, well-stirred
reactor located inside a batch recycling system. Both sides of the reactor were irradiated by
two tubular lamps. The kinetic model selected was the same used by ALFANO et al. (2001).
The kinetic model represented well the evolution of formic acid and hydrogen peroxide
concentrations in a wide range of their initial molar concentrations. Furthermore, a deviation
smaller than 9% between predicted and experimental data was achieved.
CONTE et al. (2012) also developed a kinetic model to predict the evolution of
reactant concentrations in the photo-Fenton process. At first, they employed a well-stirred
tank laboratory reactor, and then a pilot-plant solar reactor, created to capture UV, visible, and
IR solar radiation. The pilot-plant photoreactor was able to achieve complete degradation of
the target compounds after 60 min of treatment. In addition, a high mineralization was
achieved after a longer period of treatment, 210 min. The computed values agreed with the
experimental data, satisfactorily representing the process as well as the reactor.
BENZAQUÉN et al. (2012) studied absolute and apparent quantum efficiencies
regarding atrazine degradation in water by the photo-Fenton process. They calculated the
LVRPA and used it to evaluate the quantum efficiencies. LVRPA (⟨𝑒𝑎(𝑥)𝑉𝑅⟩) ranged from
7.76× 10¹⁰ to 15.8× 10¹⁰ Einstein cm-3 s-1. They noticed unequal increasing levels of
LVRPA values compared to atrazine degradation rates. This behaviour indicated that the
absolute quantum efficiency is more sensitive to the initial ferric iron concentrations than the
apparent quantum efficiency.
BENZAQUÉN et al. (2015) proposed a kinetic model for atrazine degradation by the
Fenton and photo-Fenton processes. From an accepted reaction mechanism, which included
the LVRPA, they were able to reproduce the changes in ferric iron concentrations, hydrogen
peroxide to atrazine molar ratios, and radiation level on the pollutant degradation rate.

49
3.7 Contributions of the Thesis
In sum, most studies reported in the literature focus on varying experimental
conditions, such as different oxidant concentrations, pH, equipment, and so forth.
Nevertheless, systematic investigations on the effects of process variables on BPA
degradation, along with the statistical interpretation of the results are virtually inexistent in the
literature. Moreover, as far as we know, a detailed kinetic model has not been proposed for
BPA degradation by the H2O2/UV process. In this context, this Thesis has the following
original contributions:
i. The influence of the process variables: initial H2O2 concentration ([H2O2]0) and
specific rate of photons emission (EP,0) on BPA degradation by the H2O2/UV
process is investigated, considering a detailed approach based on a Doehlert
experimental design and response surface methodology;
ii. For the first time, a kinetic model is proposed for BPA degradation by the H2O2/UV
process considering an expression for the radiation field, with kinetic constants
estimated from experimental data. The results discussed here can be direct applied
to scaling-up, since the obtained kinetic constants are independent of the reactor
size, shape, and configuration.

50
4. MATERIALS AND METHODS
4.1 Chemicals
All the solutions were prepared using deionized water. Hydrogen peroxide 30%
(Synth) and technical grade bisphenol A (Purity ≥ 99%, IUPAC: 2,2-bis(4-hydroxyphenyl)
propane, 4,4’-isopropyl-idenediphenol, CAS number: 80-05-7) was supplied by Sigma-
Aldrich. Aqueous solutions of H2SO4 1 mol L-1 (prepared with H2SO4 98% w/w, Vetec) or
NaOH 1 mol L-1 (prepared with NaOH 97% w/w, Vetec) were used for pH correction. The
reactants used for High Performance Liquid Chromatography (HPLC) analysis were
acetonitrile (HPLC grade) and glacial acetic acid (100%), both HPLC grade and supplied by
Merck.
4.2 Equipment and Procedures
4.2.1 DETERMINATION OF THE MOLAR ABSORPTION COEFFICIENT OF BPA
(Ɛ)
The UV-Vis absorption spectrum (200 to 300 nm) of BPA was measured with a UV-
Vis spectrophotometer (Varian Cary 50), with a 1-cm path-length quartz cuvette. According
to the Beer’s Law, for dilute systems the graph of absorbance versus BPA concentration gives
a straight line with slope equal to the molar absorption coefficient ɛ (L mol-1 cm-1) at the given
wavelength.
4.2.2 STUDY OF BPA PHOTO-DEGRADATION
H2O2/UV experiments were performed in a tubular photochemical reactor (Figure 4.1
and Figure 4.2), which consists of a borosilicate glass tube (lamp diameter, 0.025 m; inner
diameter of the outer tube, 0.073 m; irradiated length, 1.027 m), equipped with a concentric
low-pressure (LP) mercury vapour lamp (TUV Philips, 36 W), emitting UV radiation at 253.7
nm.
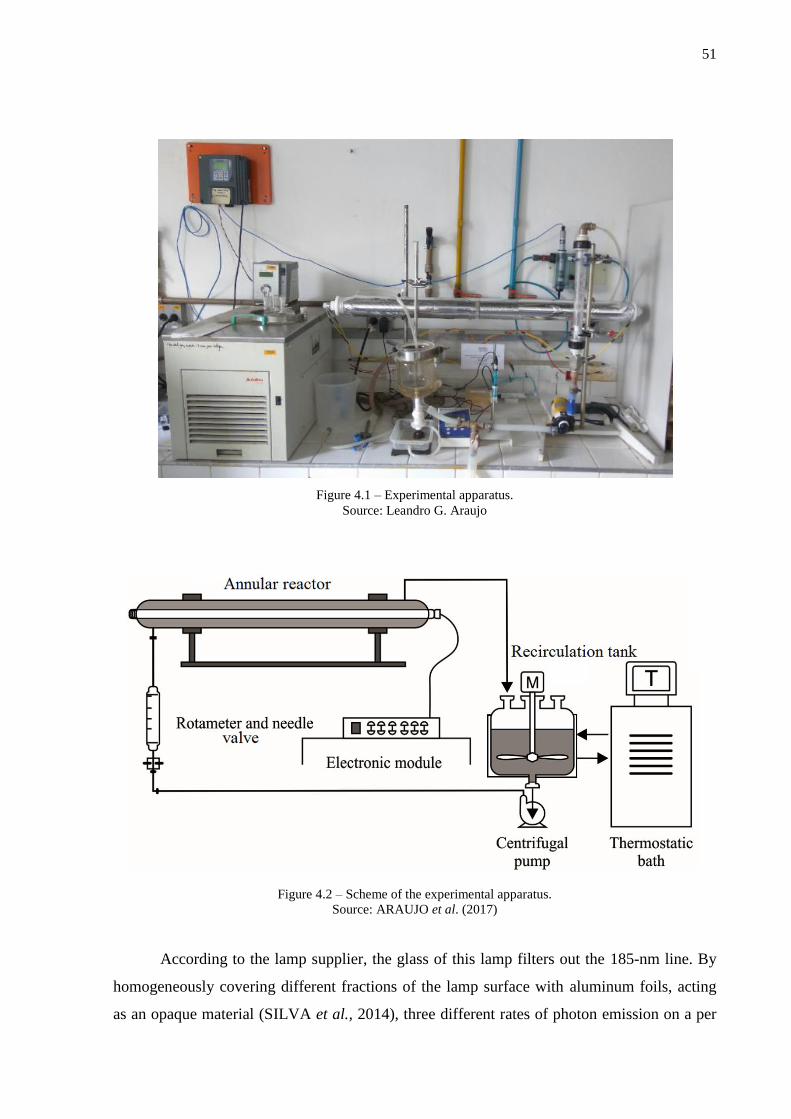
51
Figure 4.1 ‒ Experimental apparatus.
Source: Leandro G. Araujo
Figure 4.2 – Scheme of the experimental apparatus.
Source: ARAUJO et al. (2017)
According to the lamp supplier, the glass of this lamp filters out the 185-nm line. By
homogeneously covering different fractions of the lamp surface with aluminum foils, acting
as an opaque material (SILVA et al., 2014), three different rates of photon emission on a per

52
unit reactor volume basis (EP,0, photons L-1 s-1) were experimentally obtained by ferrioxalate
actinometry according to a procedure detailed elsewhere (BRAUN et al., 1991). These values
were 0.87×10¹⁸, 1.41×10¹⁸, and 3.6×10¹⁸ photons L-1 s-1 (SILVA et al., 2014). For the kinetic
study, the values of EP,0 were converted to another unit, namely: 1.44×10⁻³, 2.32×10⁻³, and
5.98×10⁻³ Einstein m-3 s-1. The radiation field inside the photochemical reactor was considered
uniform in the axial direction, except for the radial coordinate. All the experiments were
carried out in batch and the reactor was connected to a jacketed circulation vessel, from where
the samples were withdrawn. The initial BPA concentration was 48.2 ± 0.9 mg L-1. The initial
concentrations of H2O2 were 1.6, 3.6, 5.6, 7.6, and 9.6 mmol L-1. All the H2O2 solution was
added at the beginning of the experiments and no further addition of oxidant was made. The
temperature was kept at 25 ºC by means of a thermostatic bath and the total reaction time was
180 min. The initial pH was set at 7 at the beginning of the experiment, but uncontrolled over
time. The solution was recirculated at a flow rate of 400 mL min-1, and measured by a
rotameter equipped with a needle valve. The total solution and the tubular reactor volume
were 5.0 and 3.9 L, respectively. In the pH range of the experiments, BPA is protonated (pKa
BPA= 9.6) (ZENG et al., 2006), and therefore no important influence of pH on our results
was expected. Samples were withdrawn in times: 1, 2, 5, 10, 15, 30, 60, 75, 90, 105, 120, 135,
150, 165, and 180 min. A total of 20 mL was collected in each sampling. All the analyses
were made immediately after sampling. The sampling protocol was the following:
Hydrolysis and photolysis experiments were performed in a previous work and are
described elsewhere (GOULART DE ARAUJO et al., 2017). The results confirmed that BPA
hydrolysis over 24 hours was insignificant regardless of pH. BPA degradation due to direct
photolysis at 254 nm was ~20% after 120 min of irradiation, under the following conditions:
[BPA]0 = 50 mg L-1and EP,0 = 1.41 × 10¹⁸ photons L-1 s-1.
4.2.3 EXPERIMENTAL DESIGN: DOEHLERT MATRIX
An experimental design was used to perform the H2O2/UV experiments, based on the
Doehlert matrix (CAMPAÑA et al., 1997) for two variables (initial H2O2 concentration,
mmol L-1, X1; and specific rate of photons emission, EP,0, X2). The experimental runs were
made in duplicate. Figure 4.3 and Table 4.1 detail these design points, and the values of
[H2O2]0 and EP,0.

53
Figure 4.3 ‒ Experimental design based on the Doehlert matrix for the H2O2/UV process.
Table 4.1 ‒ Conditions of the H2O2/UV experiments.
Run X1; X2
(CODIFIED)
[H2O2]0; EP,0
(mmol L-1; ×1018 photons L-1 s-1)
1 0.5; 0.866 3.6; 3.6
2 0.5; 0.866 7.6; 3.6
3 1.0; 0.0 9.6; 1.4
4 0.5; 0.866 7.6; 0.87
5 0.5; 0.866 3.6; 0.87
6 1.0; 0.0 1.6; 1.4
7 0.0; 0.0 5.6; 1.4
In short, seven experimental points were carried out for the system (k2+ k +1, where k
is the number of independent variables, two in this study), in duplicates (total of 14
experiments). The dependent variables (responses) were the apparent first-order BPA
degradation rate constant (Y1, min-1), BPA degradation after 15 min (Y2, %), and TOC
removal after 120 min (Y3, %). When necessary, the codified values corresponding to [H2O2]0
were recalculated considering the actual measured values of this variable.
4.2.4 STATISTICAL ANALYSIS OF THE RESULTS
The effects of the variables involved in BPA degradation on each response were
statistically assessed by means of response surface models (Equation 4.1), where Xi
corresponds to the codified values of the independent variables, Yi are the experimental
responses, and a0, ai, aii and aij, are the model parameters. The analyses were performed using
the software Statgraphics Plus v. 5.0.

54
Yi = a0 + a1X1 + a2X2 + a11X12 + a22X2
2 + a12X1X2 (4.1)
4.3 Analytical Techniques
4.3.1 HIGH-PERFORMANCE LIQUID CHROMATOGRAPHY
BPA analyses were performed employing an HPLC system (Shimadzu), equipped
with a two-solvent delivery pump, a UV/Vis diode array detector (SPD 20A model), and a
C18 column (Phenomenex, 250 mm×4.6 mm; 5 μm). The absorption wavelength, the oven
temperature and the sample injection volume were 230 nm, 40 ºC, and 50 µL, respectively.
The analyses were performed in isocratic mode. The eluents were (a) H2O+0.2 % acetic acid
and (b) acetonitrile at 50:50 ratio (v/v), at 1.0 mL min−1. Under these conditions, the BPA
retention time was 8 min. The detection and quantification limits were 0.41 and 1.26 mg L−1,
respectively.
4.3.2 TOTAL ORGANIC CARBON (TOC)
TOC analysis was performed in a Shimadzu equipment (TOC-5000A model). TOC
was measured indirectly by the difference between total organic (TC) and inorganic carbon
(IC).
4.3.3 HYDROGEN PEROXIDE DETERMINATION
H2O2 concentration was measured by the method described by Nogueira et al. (2004).
Ammonium metavanadate was used in acidic medium, which resulted in the formation of a
red-orange colour peroxovanadium cation, with a maximum absorbance at 450 nm, which
was measured using a Varian Cary 50 UV-Vis spectrophotometer equipped with a 1-cm path
length quartz cuvette. The concentration of H2O2 during the experiments was obtained by
using the Beer-Lambert law (Equation 4.2) (OPPENLÄNDER, 2003):
𝐴10 = 𝜀 × 𝑐 × 𝑙 (4.2)
where,

55
A10: Decadic absorbance of a beam of collimated monochromatic radiation in a homogeneous
isotropic medium (VERHOEVEN, 1996 apud OPPENLÄNDER, 2003);
ε: molar (decadic) absorption coefficient in L mol-1 cm-1;
c: substrate concentration in mol L-1;
l: path length of irradiation in cm.
5. KINETIC MODELLING
This chapter is organized into three sections. The first describes the reaction
mechanism. The main reactions involved in the H2O2/UV process are listed as well as the
expressions and total rates obtained from these reactions. The second part deals with material
balances, in which an expression related to our experimental system is presented. The third
and last part of this chapter examines photo-reactor modelling for a homogeneous system.
The main equations regarding this subject will be discussed. More information about the
LSPP model will be also presented.
5.1 Reaction mechanisms and rate equations
As mentioned in the literature review, kinetic modelling is an essential tool for
employing AOP in large scales. However, the development of a mathematical model for an
AOP is considered arduous, due to the extensive number of reactions involved in those
processes. Because of that, the assumption of pseudo-steady-state is very usual for the
simulation of radical species concentrations, such as hydroxyl, peroxyl, and oxyl radicals
(KANG et al., 2002, ANDREOZZI et al., 2000, ALNAIZY and AKGERMAN, 2000).
The proposed kinetic model for the BPA degradation under H2O2/UV is based on the
reaction sequence proposed by HUANG and SHU (1995). The main interactions between
H2O2 with UV radiation and free radicals are described by reactions (1)–(6) in Table 5.1,
whereas reactions (7) and (8) represent the decomposition of any of the reacting organic
compounds presented in the system.

56
Table 5.1 ‒ Reaction scheme for BPA degradation under the H2O2/UV process.
Step Reaction nº
Initiation 𝐻2𝑂2ɸ𝐻2𝑂2→ 2𝐻𝑂⦁ (1)
Propagation 𝐻2𝑂2 + 𝐻𝑂
⦁𝑘2→𝐻𝑂2
⦁ +𝐻2𝑂 (2)
𝐻2𝑂2 + 𝐻𝑂2⦁𝑘3→𝐻𝑂⦁ +𝐻2𝑂 + 𝑂2 (3)
Termination
2𝐻𝑂⦁𝑘4→𝐻2𝑂2 (4)
2𝐻𝑂2⦁𝑘5→𝐻2𝑂2 +𝑂2 (5)
𝐻𝑂⦁ +𝐻𝑂2⦁𝑘6→𝐻2𝑂 + 𝑂2 (6)
Degradation of the target
pollutant
𝐵𝑃𝐴 + 𝐻𝑂⦁𝑘7→ 𝑝𝑟𝑜𝑑𝑢𝑐𝑡𝑠 (7)
𝐵𝑃𝐴 ɸ𝐵𝑃𝐴→ 𝑝𝑟𝑜𝑑𝑢𝑐𝑡𝑠 (8)
The rate expressions for BPA and H2O2 are obtained from the following assumptions
(ALFANO et al., 1986):
i. The steady-state approximation (SSA) was applied for highly reactive intermediates,
such as HO⦁ and HO2⦁ radicals;
ii. Reaction step 3 is slower than others involving HO2⦁ and can be neglected;
iii. Radical-radical termination reactions are neglected compared to propagation
reactions.
With these assumptions, the expressions for the rates of H2O2 and BPA photolysis
(𝑟𝑢𝑣,𝐻2𝑂2 𝑎𝑛𝑑 𝑟𝑢𝑣,𝐵𝑃𝐴), hydroxyl radical concentrations, and the total rates of H2O2 and BPA
consumption can be described by the following equations:
𝑟𝑈𝑉,𝐻2𝑂2 = ɸ𝐻2𝑂2𝑒254𝑛𝑚𝑎 (𝑥, 𝑡) (5.1)
𝑟𝑈𝑉,𝐵𝑃𝐴 = ɸ𝐵𝑃𝐴𝑒254𝑛𝑚𝑎 (𝑥, 𝑡) (5.2)
𝐶𝐻𝑂⦁(𝑥, 𝑡) = 2𝑟𝑈𝑉,𝐻2𝑂2
𝐶𝐻2𝑂2𝑘2 + 𝐶𝐵𝑃𝐴𝑘7 (5.3)

57
𝑅𝐻2𝑂2(𝑥, 𝑡) = −𝑟𝑈𝑉,𝐻2𝑂2 − 𝑘2𝐶𝐻2𝑂2𝐶𝐻𝑂⦁ (5.4)
𝑅𝐵𝑃𝐴(𝑥, 𝑡) = −𝑟𝑈𝑉,𝐵𝑃𝐴 − 𝑘7𝐶𝐵𝑃𝐴𝐶𝐻𝑂⦁ (5.5)
where, 𝑅𝑖(𝑥, 𝑡) (i = H2O2, BPA) are the local reaction rates; 𝐶𝐻𝑂⦁, 𝐶𝐻2𝑂2, and 𝐶𝐵𝑃𝐴 correspond
to the hydroxyl radical, H2O2, and BPA concentrations, respectively; k2 and k7 are the second
order kinetic rate constants defined in Table 5.1; ɸ𝐻2𝑂2 is the quantum yield of H2O2
photolysis; and 𝑒𝜆𝑎 represents the local volumetric rate of photon absorption by H2O2 and
BPA. The values for the constants are listed in Table 5.2.
Table 5.2 ‒ Notations used for the parameters of the H2O2/UV process.
Parameter Notation Value Reference
Quantum yield of H2O2 photolysis ɸ𝐻2𝑂2,254𝑛𝑚 0.5 (CRITTENDEN et
al., 1999)
Quantum yield of BPA ɸ𝐵𝑃𝐴,254𝑛𝑚 0.0075 (ARAUJO et al.,
2017)
Molar absorption coefficient of
H2O2 ɛ𝐻2𝑂2,254 𝑛𝑚 19.6 L mol-1 cm-1 (OPPENLANDER,
2003)
Molar absorption coefficient of
BPA ɛ𝐵𝑃𝐴,254 𝑛𝑚 912 L mol-1 cm-1 (ARAUJO et al.,
2017)
5.2 Material balances
The general equation of component conservation is (BIRD et al., 1960):
{𝑀𝑎𝑠𝑠 𝑒𝑛𝑡𝑒𝑟𝑖𝑛𝑔
𝐶. 𝑉.} − {
𝑀𝑎𝑠𝑠 𝑙𝑒𝑎𝑣𝑖𝑛𝑔𝐶. 𝑉.
} = {𝑀𝑎𝑠𝑠 𝑎𝑐𝑐𝑢𝑚𝑢𝑙𝑎𝑡𝑖𝑜𝑛
𝐶. 𝑉.} + {
𝑀𝑎𝑠𝑠 𝑝𝑟𝑜𝑑𝑢𝑐𝑡𝑖𝑜𝑛𝑎𝑛𝑑 𝑐𝑜𝑛𝑠𝑢𝑚𝑒
𝑏𝑦 ℎ𝑜𝑚𝑜𝑔𝑒𝑛𝑒𝑜𝑢𝑠𝑟𝑒𝑎𝑐𝑡𝑖𝑜𝑛 𝑖𝑛 𝐶. 𝑉.
} (5.6)
Where C.V. is the control volume, in which the full experimental apparatus is
considered, as shown previously in Figure 4.2.
For an infinitesimal control volume, Equation 5.6 becomes differential and it is given
by the convection-diffusion equation:

58
𝜕𝐶𝑖(𝑥, 𝑡)
𝜕𝑡+ ∇.𝑁𝑖(𝑥, 𝑡) = 𝑅𝑖(𝑥, 𝑡)
(5.7)
Where:
Ci: Concentration of the reacting species i;
Ni: Convection-diffusion flux of the reacting species i;
Ri: Homogeneous reaction rate of the reacting species i.
In this work, the reaction setup is as constant volume, isothermal, closed-loop,
perfectly-mixed batch recirculation system, which can be approximated as discontinuous.
Therefore, the second term on the left hand of Equation 5.7 (∇. 𝑁𝑖) is considered zero. In this
case,
𝜕𝐶𝑖(𝑥, 𝑡)
𝜕𝑡= 𝑅𝑖(𝑥, 𝑡) (5.8)
Equation 5.8 was then integrated according to the Reynolds transport theorem,
dividing the system volume in two terms. The volumes were named V for total volume, and Vr
and V-Vr for the photoreactor and tank volumes, respectively. The following equation results:
𝑑
𝑑𝑡∫ 𝐶𝑖(𝑥, 𝑡)𝑑𝑉 +
𝑑
𝑑𝑡∫ 𝐶𝑖(𝑥, 𝑡)𝑑𝑉 = ∫ 𝑅𝑖(𝑥, 𝑡)𝑑𝑉
𝑉𝑟
+ ∫ 𝑅𝑖𝑇(𝑥, 𝑡)𝑑𝑉
𝑉−𝑉𝑟𝑉−𝑉𝑟𝑉𝑟
(5.9)
On the grounds that the H2O2/UV process is dependent on irradiation, we considered
that the chemical reactions only occurred in the irradiated volume (Equation 5.10). This
consideration is valid, since the photochemical reactions are fast enough in such a way that
they are not expected to occur outside the irradiated volume. In addition, dark chemical
reactions outside the irradiated volume are unlikely or insignificant in comparison to
photochemical reactions
𝑑
𝑑𝑡∫ 𝐶𝑖(𝑥, 𝑡)𝑑𝑉 +
𝑑
𝑑𝑡∫ 𝐶𝑖(𝑥, 𝑡)𝑑𝑉 = ∫ 𝑅𝑖(𝑥, 𝑡)𝑑𝑉
𝑉𝑟𝑉−𝑉𝑟𝑉𝑟
(5.10)

59
By applying volume averaging all terms of Equation 5.10 (OCHOA and WHITAKER,
1995), the following equations are obtained:
⟨𝐶𝑖(𝑥, 𝑡)⟩𝑉𝑟 = 1
𝑉𝑟∫ 𝐶𝑖(𝑥, 𝑡)𝑑𝑉𝑉𝑟
(5.11)
⟨𝐶𝑖(𝑥, 𝑡)⟩𝑉−𝑉𝑟 = 1
𝑉 − 𝑉𝑟∫ 𝐶𝑖(𝑥, 𝑡)𝑑𝑉𝑉−𝑉𝑟
(5.12)
⟨𝑅𝑖(𝑥, 𝑡)⟩𝑉𝑟 = 1
𝑉𝑟∫ 𝑅𝑖(𝑥, 𝑡)𝑑𝑉𝑉𝑟
(5.13)
Substituting Equations 5.11-5.13 into Equation 5.10:
𝑑
𝑑𝑡[𝑉𝑟𝑉⟨𝐶𝑖(𝑥, 𝑡)⟩𝑉𝑟 +
𝑉 − 𝑉𝑟𝑉
⟨𝐶𝑖(𝑥, 𝑡)⟩𝑉−𝑉𝑟] =𝑉𝑟𝑉⟨𝑅𝑖(𝑥, 𝑡)⟩𝑉𝑟 (5.14)
The concentration of the species i (Ci) is considered uniform, since the system is
assumed to be well mixed. In this case, ⟨𝐶𝑖(𝑥, 𝑡)⟩𝑉𝑟 = ⟨𝐶𝑖(𝑥, 𝑡)⟩𝑉−𝑉𝑟 = 𝐶𝑖(𝑡) , and the
following molar balances can be written:
𝑑𝐶𝑖(𝑡)
𝑑𝑡=𝑉𝑅
𝑉⟨𝑅𝑖(𝑥, 𝑡)⟩𝑉𝑅 𝑖 = 𝐵𝑃𝐴, 𝐻2𝑂2,
(5.15)
With the initial conditions:
𝐶𝑖(𝑡0) = 𝐶𝑖0 𝑖 = 𝐵𝑃𝐴, 𝐻2𝑂2, (5.16)
The reaction rates are given by Equations 5.4 and 5.5. Substituting both equations for
the species (BPA and H2O2) into Equation 5.15:
𝑑𝐶𝐻2𝑂2𝑑𝑡
= 𝑉𝑅𝑉(−𝜙𝐻2𝑂2⟨𝑒𝐻2𝑂2
𝑎 (𝑥, 𝑡)⟩254𝑛𝑚 − 𝑘2𝐶𝐻2𝑂2𝐶𝐻𝑂⦁) (5.17)

60
𝑑𝐶𝐵𝑃𝐴𝑑𝑡
=𝑉𝑅𝑉(−𝜙𝐵𝑃𝐴⟨𝑒𝐵𝑃𝐴
𝑎 (𝑥, 𝑡)⟩254𝑛𝑚 − 𝑘7𝐶𝐵𝑃𝐴𝐶𝐻𝑂⦁) (5.18)
5.3 Photoreactor modelling - Emission models in a homogeneous system
There is a considerable amount of research about photoreactor modeling, and various
approaches have been proposed based on different photoreactor geometries and radiation
sources.
It is worth observing that the model developed here is based on our work, i.e.: annular
photoreactor; homogeneous solution; and the H2O2/UV process. Figure 5.1 illustrates the
annular reactor used in this work. PERES et al. (2015) studied the same reactor configuration.
Figure 5.1 – Representation of the annular photoreactor.
Source: PERES et al. (2015)
The emission of the radiant energy from the lamp is usually described assuming that
beams diverge radially from the linear source to parallel planes perpendicular to the lamp axis
(LSPP model) or in all directions through the reaction space (LSSE model). In this work, the
first approach was used. Photons propagation is expressed by bundles of rays and it is
generally described by a fundamental property called spectral specific intensity Iλ,Ω (energy

61
per unit time, unit area, and unit solid angle on the direction or propagation) (CASSANO et
al., 1995). Figure 5.2 illustrates a characterization of the radiation field.
Figure 5.2 ‒ Scheme of the radiation field.
Source: CASSANO et al. (1995)
Where dA is a small area on the x coordinate, P an arbitrary point in this area, and n the
normal to the area at this point P. The radiation may be emitted, reflected or transmitted on
this surface. By this draw line, one can consider the vector Ω. This vector originates an angle
θ with the normal n. The vector Ω corresponds to the axis of a cone with solid angle dΩ. A
truncated semi-infinite cone dω is formed by elementary solid angles analogous to rays, and
are parallel to Ω passing through dA.
By these definitions we can write the spectral specific intensity as follows (Equation
5.19) (CASSANO et al., 1995):
𝐼𝜈(𝑥, 𝛺, 𝑡, 𝜈) = limdA,dΩ,dt,dν→0
(d𝐸ν
d𝐴 cos𝜃d𝛺dt d𝜈) (5.19)
where 𝐼𝜈 is the spectral specific intensity (Einstein m-2 sr -1 unit frequency -1 s-1), dEν is
radiative energy, ν is radiation frequency, Ω is the solid angle and t is time.
The conservation equation applied on photons is given by Equation 5.20 (CASSANO
et al. 1995).
|
Inflow of photons Ω, ν into the volume
control
| + |
Outflow of photons Ω, ν
out of the volume control
| = ||
Net gain of Ω, ν photons owning to
photochemical interactions
|| (5.20)

62
The general form of the radiative transfer equation (RTE) considers how photons
interact within the radiation field inside the photoreactor (OZISIK, 1973; CASSANO et al.,
1995; SIEGEL and HOWELL, 2002, MARUGÁN, 2008):
1
𝑐
𝜕𝐼𝛺,𝜈𝜕𝑥
+ ∇. (𝐼𝛺,𝜈𝛺) = − 𝑊𝛺,𝜈𝑎⏞
𝐴𝑏𝑠𝑜𝑟𝑝𝑡𝑖𝑜𝑛
+ 𝑊𝛺,𝜈𝑒⏞
𝐸𝑚𝑖𝑠𝑠𝑖𝑜𝑛
+ 𝑊𝛺,𝜈𝑖𝑛−𝑠⏞
𝐼𝑛−𝑆𝑐𝑎𝑡𝑡𝑒𝑟𝑖𝑛𝑔
− 𝑊𝛺,𝜈𝑜𝑢𝑡−𝑠⏞
𝑂𝑢𝑡−𝑆𝑐𝑎𝑡𝑡𝑒𝑟𝑖𝑛𝑔
(5.21)
where c is the speed of light, in meters per second.
As shown in Equation 5.21, the radiation field reaches its steady state instantaneously
(first term at the left hand is very small). Nevertheless, I may change with time in case that the
boundary condition associated with Equation 5.21 is time dependent. The processes related to
absorption, emission, in-scattering or out-scattering may also change with time. Note that
Equation 5.21 presents two source terms (absorption and emission) and two sink terms (in and
out-scattering). Constitutive equations must be provided for each of these terms.
Some considerations were made:
i. The factor 1/c is too low, therefore the first member approaches to zero;
ii. Since the medium is optically homogeneous, there is no emission or scattering.
Thus, Equation 5.21 reduces to:
∇. (𝐼𝛺,𝜈𝛺) = −𝑊𝛺,𝜈𝑎 =
𝑑𝐼𝜈(𝑠, 𝛺, 𝑡)
𝑑𝑠 (5.22)
where 𝑊𝛺,𝜈𝑎 gives the contribution of photon absorption.
Note that without other contributions, the RTE (Equation 5.21) corresponds to the
“Beer-Lambert-Bouguer Law”. For the absorption contribution one can write:
𝑊𝛺,𝜈𝑎 = 𝑘𝜈(𝑠, 𝑡)𝐼𝜈(𝑠, 𝛺, 𝑡) (5.23)
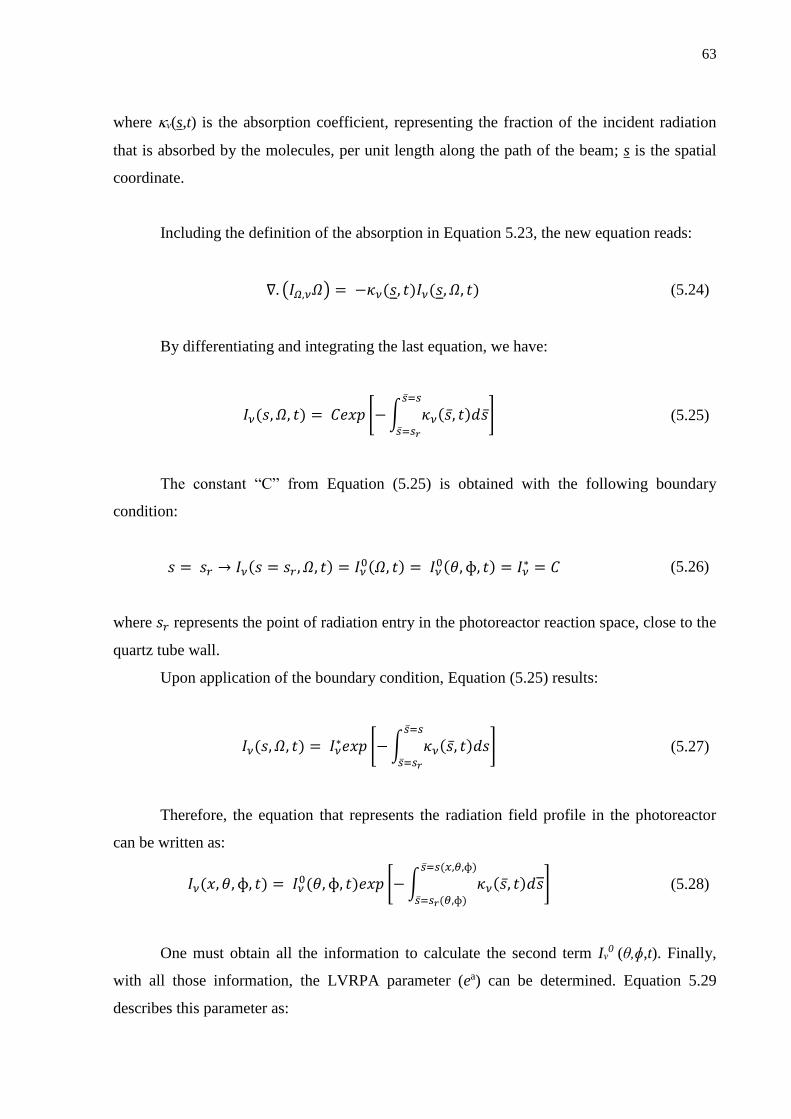
63
where ν(s,t) is the absorption coefficient, representing the fraction of the incident radiation
that is absorbed by the molecules, per unit length along the path of the beam; s is the spatial
coordinate.
Including the definition of the absorption in Equation 5.23, the new equation reads:
∇. (𝐼𝛺,𝜈𝛺) = −𝜅𝜈(𝑠, 𝑡)𝐼𝜈(𝑠, 𝛺, 𝑡) (5.24)
By differentiating and integrating the last equation, we have:
𝐼𝜈(𝑠, 𝛺, 𝑡) = 𝐶𝑒𝑥𝑝 [−∫ 𝜅𝜈(��, 𝑡)𝑑����=𝑠
��=𝑠𝑟
] (5.25)
The constant “C” from Equation (5.25) is obtained with the following boundary
condition:
𝑠 = 𝑠𝑟 → 𝐼𝜈(𝑠 = 𝑠𝑟 , 𝛺, 𝑡) = 𝐼𝜈0(𝛺, 𝑡) = 𝐼𝜈
0(𝜃, ɸ, 𝑡) = 𝐼𝜈∗ = 𝐶 (5.26)
where 𝑠𝑟 represents the point of radiation entry in the photoreactor reaction space, close to the
quartz tube wall.
Upon application of the boundary condition, Equation (5.25) results:
𝐼𝜈(𝑠, 𝛺, 𝑡) = 𝐼𝜈∗𝑒𝑥𝑝 [−∫ 𝜅𝜈(��, 𝑡)𝑑𝑠
��=𝑠
��=𝑠𝑟
] (5.27)
Therefore, the equation that represents the radiation field profile in the photoreactor
can be written as:
𝐼𝜈(𝑥, 𝜃, ɸ, 𝑡) = 𝐼𝜈0(𝜃, ɸ, 𝑡)𝑒𝑥𝑝 [−∫ 𝜅𝜈(��, 𝑡)𝑑𝑠
��=𝑠(𝑥,𝜃,ɸ)
��=𝑠𝑟(𝜃,ɸ)
] (5.28)
One must obtain all the information to calculate the second term Iν0 (θ,ɸ,t). Finally,
with all those information, the LVRPA parameter (ea) can be determined. Equation 5.29
describes this parameter as:

64
𝑒𝜈𝑎(𝑥, 𝑡) = 𝜅𝜈(𝑥, 𝑡) × 𝐺𝜈(𝑥, 𝑡) (5.29)
where 𝐺𝜈(𝑥, 𝑡)is another important photochemical property called spectral incident radiation
(energy per unit time and unit area from all directions). This property can be calculated by
integrating the spectral specific intensity over the entire photo-reactor volume. Therefore,
𝐺𝜈(𝑥, 𝑡) is mathematically defined as:
𝐺𝜈(𝑥, 𝑡) = ∫ 𝐼𝜈𝑑𝛺𝛺
(5.30)
The solid angle (Ω) can be written as:
𝑑𝛺 = 𝑠𝑖𝑛𝜃𝑑𝜃𝑑ɸ (5.31)
In spherical coordinates and by substituting Equation 5.31 into Equation 5.30:
𝐺𝜈 = ∫ ∫ 𝐼𝜈𝑠𝑖𝑛𝜃𝑑ɸ𝑑𝜃ɸ2
ɸ1
𝜃2
𝜃1
(5.32)
Note that Equation 5.32 is valid only for monochromatic radiation.
Now, with the expressions for 𝐺𝜈(𝑥, 𝑡), Equation 5.29 reads:
𝑒𝜈𝑎(𝑥, 𝑡) = 𝜅𝜈(𝑥, 𝑡)∫ ∫ 𝐼𝜈𝑠𝑖𝑛𝜃𝑑ɸ𝑑𝜃
ɸ2
ɸ1
𝜃2
𝜃1
(5.33)
𝐼𝜈 was defined previously in Equation 5.28; therefore, Equation 5.33 can be rewritten
as:
𝑒𝜈𝑎(𝑥, 𝑡) = 𝜅𝜈(𝑥, 𝑡)∫ 𝑑ɸ∫ 𝐼𝜈
∗𝑒𝑥𝑝 [−∫ 𝜅𝜈(��, 𝑡)��=𝑠(𝑥,𝜃,ɸ)
��=𝑠𝑟
] 𝑠𝑖𝑛𝜃𝑑𝜃𝜃2
𝜃1
ɸ2
ɸ1
(5.34)

65
where Iν* is the energy transferred from the wall of the quartz tube to the reaction medium
and it is obtained by an emission model. The term Iν* is initially written as:
𝐼𝜈∗(𝜃, ɸ, 𝑡) = 𝑓[𝑙𝑎𝑚𝑝 𝑐𝑎𝑟𝑎𝑐𝑡ℎ𝑒𝑟𝑖𝑠𝑡𝑖𝑐𝑠; 𝑟𝑒𝑎𝑐𝑡𝑜𝑟 𝑔𝑒𝑜𝑚𝑒𝑡𝑟𝑦] (5.35)
This equation provides the boundary condition in the reactor entry. Note that the
process of radiation emission is considered stationary.
5.3.1 LSPP MODEL
The ea for the LSPP model was previously given (Equation 3.19), and its average
value for our experimental setup is given by:
⟨𝑒𝑎(𝑥)⟩𝑉𝑟 =1
𝑉𝜅𝑖𝑟𝑖𝑞𝑖∫
𝑒−𝜅𝑖(𝑟−𝑟𝑖)
𝑟2𝜋𝑟𝑑𝑟𝑑𝑧
𝑟𝑒
𝑟𝑖
(5.36)
where ⟨𝑒𝑎(𝑥)⟩𝑉𝑟 is a volumetric average value and 𝜅𝑖 is the volumetric absorption coefficient
of the reacting species (H2O2 and BPA), which can be expressed as:
𝜅𝑖,𝜆 = 𝛼𝑖,254𝑛𝑚 × 𝐶𝑖 (5.37)
where 𝜅𝑖,𝜆 is the molar absorptivity of the absorbing species, which is a function of the
wavelength λ (254 nm in the present work).
By integrating Equation 5.36 and substituting “𝑞𝑖” by Equation 3.20, we obtained the
expression for the radiation field for our system by means of the LSPP model:
⟨𝑒𝑎(𝑥)⟩𝑉𝑟 =𝑃
𝑉× [1 − 𝑒𝑥𝑝(−𝑏(𝜅𝐻2𝑂2 + 𝜅𝐵𝑃𝐴))] (5.38)
where the first term of the right hand side of the expression is the specific rate of photons
emission (P/V = EP,0) and b is the path length.
66
With the expression for the radiation field, we can obtain the final equations for our
system by substituting Equations 5.17 and 5.18 into Equation 5.38:
𝑑𝐶𝐻2𝑂2𝑑𝑡
= 𝑉𝑅𝑉(−𝜙𝐻2𝑂2
𝑃
𝑉× [1 − 𝑒𝑥𝑝(−𝑏(𝜅𝐻2𝑂2 + 𝜅𝐵𝑃𝐴))] − 𝑘2𝐶𝐻2𝑂2𝐶𝐻𝑂⦁) (5.39)
𝑑𝐶𝐵𝑃𝐴𝑑𝑡
=𝑉𝑅𝑉(−𝜙𝐵𝑃𝐴
𝑃
𝑉× [1 − 𝑒𝑥𝑝(−𝑏(𝜅𝐻2𝑂2 + 𝜅𝐵𝑃𝐴))] − 𝑘7𝐶𝐵𝑃𝐴𝐶𝐻𝑂⦁) (5.40)
6. RESULTS AND DISCUSSION
This section is organized as follows. The first part details the determination of the
spectral molar absorption coefficient (ɛ) of BPA, as well as the results of the H2O2/UV
experiments in terms of BPA, H2O2, TOC, and pH behaviors over time. A discussion is also
presented, comparing and relating the results as regards the literature whenever possible. In
the second part, the effects of each independent variable (H2O2 and EP,0) on BPA degradation
by the H2O2/UV process is discussed according to the response surface analysis, for each
experimental response (apparent first-order BPA degradation rate constant, BPA degradation
after 15 min, and TOC removal after 120 min). The third and last part presents the results
obtained by the kinetic study and mathematical modelling, comparing predicted and
experimental values of BPA and H2O2 concentrations as a function of reaction time.
6.1 Experimental results
6.1.1 DETERMINATION OF THE SPECTRAL MOLAR ABSORPTION
COEFFICIENT ()
The molar absorption coefficient of BPA was determined as a function of wavelength.
Figure 6.1 shows the absorption spectrum.

67
Figure 6.1 – UV-Vis absorption spectrum of BPA in aqueous solution.
Figure 6.1 shows that BPA absorbs UV radiation in the range of 200-300 nm and two
main peaks are seen, at 230 nm and 280 nm. The photolysis efficiency relies on the decadic
molar absorption coefficient of the compound at these wavelengths. The most relevant value
for this coefficient is at 254 nm, since the lamp used in the experiments emits at this
wavelength. Figure 6.1 also highlights the molar absorption coefficient in a shorter range of
220-280 nm for λ and 0-4000 L mol-1 cm-1 for ε. According to these results, ε is
approximately 840 L mol-1 cm-1 at 254 nm at pH 7, which is slightly different to the value
obtained by BAEZA and KNAPPE (2011), 750 L mol-1 cm-1 at 254 nm and pH 7.85. In
addition, the value found for the molar absorption of BPA is much higher than that of H2O2,
which has a direct impact on BPA degradation during the H2O2/UV process, as discussed
later.
6.1.2 BPA DEGRADATION BY THE H2O2/UV PROCESS
Figure 6.2 illustrates BPA concentration over time during the H2O2/UV process under
different conditions.

68
Figure 6.2 ‒ BPA degradation during the H2O2/UV experiments for different H2O2 initial concentrations and
specific photon emission rates. [BPA]0 = 48.2 ± 0.9 mg L-1. Conditions ([H2O2]0, mmol L-1 – EP,0, × 1018
photons·L-1 s-1): Exp 1 (3.6 – 3.6); Exp 2 (7.6 – 3.6); Exp 3 (9.6 – 1.4); Exp 4 (7.6 – 0.87);
Exp 5 (3.6 – 0.87); Exp 6 (1.6 – 1.4); Exp7 (5.6 – 1.4). Experiments run in duplicate.
All the BPA concentrations were below the detection limit after 80 min of irradiation.
However, the experiments signalled contrasting BPA degradation extents. Experiments 1, 2,
3, and 7 resulted in BPA degradations of 97, 99, 94, and 95%, respectively, after 15 min. On
the contrary, in experiments 4, 5, and 6 lower degradations were achieved (55, 62, and 78%,
respectively) at the same reaction time. These data suggest a higher importance of the specific
photon emission rate compared to the effect of hydrogen peroxide, since a higher initial
oxidant concentration (experiment 6, [H2O2]0 = 7.6 mmol L-1) resulted in lower pollutant
removal after 15 min. Moreover, the results indicate that BPA degradation followed apparent
first-order decay for all the experimental conditions, with high values of the determination
coefficients (R2) shown by the curves of ln([BPA]/[BPA]0) × time, for all the experiments
(0.932, 0.967, 0.933, 0.989, 0.981, 0.985, and 0.944, respectively).
The results in Table 6.1 show that experiment 2 ([H2O2]0 = 7.6 mmol L-1; EP,0 = 3.6 ×
1018 photons L-1 s-1) signalled the highest values of the specific BPA degradation rate and
BPA degradation after 15 min, and the second highest TOC removal. It is worth observing
that the value of [H2O2]0 for experiment 2 was close to the theoretical stoichiometric
concentration (8 mmol L-1) estimated for the initial BPA concentration adopted (50 mg L-1).
In this case, BPA degradation in experiment 2 was about 70% after only two min. FELIS et
al. (2010) obtained about 60% BPA degradation after five min, using 3 × 10⁻¹ mmol L-1 H2O2
and 9.8 mg L-1 initial BPA concentration.

69
Table 6.1 ‒ Conditions and results of the H2O2/UV experiments. Y1: apparent first-order specific BPA
degradation rate; Y2: BPA degradation after 15 min; Y3: TOC removal after 120 min. [BPA]0 = 48.2 ± 0.9 mg L-1;
[TOC]0 = 38.7 ± 0.9 mg L-1. The Y values are the average of the results of duplicate runs.
Exp [H2O2]0; EP,0 Y1 Y2 Y3
(mmol L-1; × 1018 photons L-1s-1) (min-1) (%) (%)
1 3.6; 3.6 0.223 96.9 94.9
2 7.6; 3.6 0.305 99.3 91.5
3 9.6; 1.4 0.187 97.7 43.8
4 7.6; 0.87 0.041 91.9 11.3
5 3.6; 0.87 0.058 62.5 15.6
6 1.6; 1.4 0.089 93.0 34.4
7 5.6; 1.4 0.196 94.7 50.9
A closer look at the data indicates that experiment 4 ([H2O2]0 = 7.6 mmol L-1 and EP,0
= 0.87 × 10¹⁸ photons L-1s-1) recorded a low value of the specific BPA degradation rate Y1,
even though a high H2O2 concentration was employed. In contrast, an improvement was
observed when EP,0 was kept at 3.6 × 10¹⁸ photons L-1s-1, and [H2O2]0 moved to 3.6 mmol L-1
(experiment 1), suggesting that the effect of the photon emission rate would be more relevant
upon the BPA removal.
There is an additional aspect that should be considered regarding the effect of H2O2
concentration, namely the competition of H2O2 and BPA molecules for incident photons. In
fact, the molar absorption coefficient of BPA at 254 nm (840 L mol-1 cm-1) is much higher
than that of hydrogen peroxide (19 L mol-1 cm-1, according to OPPENLÄNDER, 2003).
Therefore, for our experiments the fraction of UV radiation absorbed at time zero by H2O2 in
comparison with BPA molecules would be between 15% to 50% for [H2O2]0 = 1.6 and 9.6
mmol L-1, respectively, varying with time as both H2O2 and BPA concentrations decrease (for
simplification, the effect of unknown absorbing intermediate compounds is not considered).
Nevertheless, the quantum yield of BPA photolysis is quite low (0.0075 mol BPA mol
photons-1), in such a way that the contribution of BPA photolysis could be neglected during
the H2O2/UV process, particularly for the lowest H2O2 concentration levels.
The degree of total mineralization is usually determined by measuring the difference
between the initial and final concentrations of the total organic carbon (TOC). TOC removal
for each condition was analyzed within 180 min (Figure 6.3).

70
Figure 6.3 ‒ Total organic carbon removal during the H2O2/UV experiments for different H2O2 initial
concentrations and specific photon emission rates. [TOC]0 = 38.7 ± 0.9 mg L-1. Conditions ([H2O2]0, mmol L-1 –
EP,0, ×1018 photons L-1 s-1): Exp 1 (3.6 – 3.6); Exp 2 (7.6 – 3.6); Exp 3 (9.6 – 1.4); Exp 4 (7.6 –
0.87); Exp 5 (3.6 – 0.87); Exp 6 (1.6 – 1.4); Exp 7 (5.6 – 1.4). Experiments run in duplicate.
Experiments yielded different TOC removals, with the most relevant mineralization
achieved in experiments 3 ([H2O2]0 = 9.6 mmol L-1; EP,0 = 1.4 × 10¹⁸ photons L-1 s-1) and 2
([H2O2]0 = 7.6 mmol L-1; EP,0 = 3.6 × 10¹⁸ photons L-1 s-1); the TOC removals for these
experiments were 94 and 95 %, respectively. Conversely, the TOC removals for experiments
1, 4, 5, 6, and 7 after 180 min were notably lower (73, 16, 33, 65, and 78 %, respectively).
Generally, an extended degradation time is required to accomplish complete mineralization
after the removal of the target compound (COMNINELLIS et al., 2008). These results
suggest that experiment 2 records the best conditions for BPA degradation, with high values
of the specific BPA degradation rate (0.305 min-1), BPA degradation after 15 min (99.3%),
and TOC removal of 91.5% (120 min).
Figure 6.4 shows that most H2O2 concentrations were below the detection limit after
150 min of irradiation. However, experiments 4 and 5 presented significant remaining
amounts of the oxidant at the end of reaction time, even starting with low initial H2O2
concentrations. Note that these same experiments resulted in lower TOC removals, as shown
previously. The low initial H2O2 concentrations (1.6 and 3.6 mmol L-1, respectively)
associated with lower specific photon emission rates (1.4 and 0.87 × 10¹⁸ photons L-1 s-1,
respectively) are insufficient to degrade BPA degradation products formed, even with the
presence of H2O2 during all the reaction time.

71
Figure 6.4 ‒ Time profiles of hydrogen peroxide concentrations during the H2O2/UV experiments.
Conditions ([H2O2]0, mmol L-1 – EP,0, × 1018 photons L-1 s-1): Exp 1 (3.6 – 3.6); Exp 2 (7.6 – 3.6); Exp
3 (9.6 – 1.4); Exp 4 (7.6 – 0.87); Exp 5 (3.6 – 0.87); Exp 6 (1.6 – 1.4); Exp 7 (5.6 – 1.4).
Experiments run in duplicate.
Figure 6.5 shows the time evolution of pH during the H2O2/UV experiments. For
experiments 2 and 3, pH decreased from 7 to 3 in the first 70 min, followed by an increase to
about pH 5 until the end of the experiments. Interestingly, experiments 1, 4, 5, 6, and 7
showed the same initial behaviour observed in experiments 2 and 3, whereas no substantial
pH increase was observed therein. The literature on this topic reports the formation of oxalic,
succinic, and fumaric acids from BPA degradation under the H2O2/UV process (OLMEZ-
HANCI et al., 2015). As soon as these acids are formed, they are also degraded and
mineralized to CO2 and H2O, resulting in pH increase. This is in agreement with the time-
evolution of TOC shown in Figure 6.3, which clearly indicates nearly total BPA
mineralization after 150 min.

72
Figure 6.5 ‒ Time profiles of pH during the H2O2/UV experiments.pH0 = 7.08 ± 0.47. Conditions ([H2O2]0,
mmol L-1 – EP,0, ×1018 photons L-1 s-1): Exp 1 (3.6 – 3.6); Exp 2 (7.6 – 3.6); Exp 3 (9.6 – 1.4); Exp
4 (7.6 – 0.87); Exp 5 (3.6 – 0.87); Exp 6 (1.6 – 1.4); Exp 7 (5.6 – 1.4). Experiments run in duplicate.
6.2 Statistical analysis - results of the Doehlert experimental design
Response surface models were considered, in order to find the best conditions for BPA
degradation by the H2O2/UV process. As stated in Section 4.2.3, the dependent variables
(responses) evaluated were the apparent first-order BPA degradation rate constant (Y1, min-1),
BPA degradation after 15 min (Y2, %), and TOC removal after 120 min (Y3, %). Table 6.1
lists these responses for each experimental condition ([H2O2]0 and EP,0). Table 6.2 lists the
corresponding values of the fitted coefficients of the response surface models.
Table 6.2 ‒ Response surface models obtained for the H2O2/UV process. Y1: apparent first-order specific BPA
degradation rate; Y2: BPA degradation after 15 min; Y3: TOC removal after 120 min. Codified variables X1 and
X2 refer to [H2O2]0 and EP,0, respectively. See Table 6.1 for the codified values of the Doehlert design,
corresponding to [H2O2]0 (initial hydrogen peroxide concentration) and EP,0 (specific photon emission rate).
Model Equations
Y1 (min-1) = 0.19 + 0.09X1 + 0.10X2 0.06X12 + 0.07X1X2 0.03X2
2 (I)
Y2 (%, 15 min) = 94.61 + 16.84X1 + 14.46X2 16.63X12 3.90X1X2 8.01X2
2 (II)
Y3 (%, 120 min) = 51.58 + 37.19X1 + 23.95X2 + 0.46X12 + 11.90X1X2 9.60X2
2 (III)

73
The ANOVA (Table 6.3 to Table 6.5) and the Pareto charts (Figure 6.6) indicate
significant effects of the independent variables on Y1, Y2, and Y3 at the 95% confidence level
(p-values < 0.05).
Table 6.3 ‒ Analysis of variance (ANOVA) for the apparent first-order specific BPA degradation rate (Y1, min-1).
Fisher F for 95 % confidence level. X1 and X2 are the codified independent variables corresponding to [H2O2]0
and EP,0, respectively.
Variables and
interactions
Sum of
squares
Degrees of
freedom
Mean
square
F-
ratio
p-
value
A: X1 0.048289 1 0.048289 38.74 0.0003
B: X2 0.05838 1 0.05838 46.84 0.0001
AA 0.00633363 1 0.00633363 5.08 0.0542
AB 0.00795727 1 0.00795727 6.38 0.0354
BB 0.00107985 1 0.00107985 0.87 0.3792
Total error 0.00997156 8 0.00124644
Total (corr.) 0.134681 13
R2 0.9560
Table 6.4 − Analysis of variance (ANOVA) for BPA degradation after 15 minutes (Y2, %). Fisher F for 95 %
confidence level. X1 and X2 are the codified independent variables corresponding to [H2O2]0 and EP,0,
respectively.
Variables and
interactions
Sum of
squares
Degrees of
freedom
Mean
square
F-
ratio
p-
value
A: X1 1714.71 1 1714.71 49.79 0.0001
B: X2 1224.54 1 1224.54 35.56 0.0003
AA 476.614 1 476.614 13.84 0.0059
AB 26.0841 1 26.0841 0.76 0.4095
BB 85.5898 1 85.5898 2.49 0.1536
Total error 275.512 8 34.439
Total (corr.) 3984.95 13
R2 0.9308
Table 6.5 − Analysis of variance (ANOVA) for TOC removal after 120 minutes (Y3, %). Fisher F for 95 %
confidence level. X1 and X2 are the codified independent variables corresponding to [H2O2]0 and EP,0,
respectively.
Variables and
interactions
Sum of
squares
Degrees of
freedom
Mean
square
F-
ratio
p-
value
A: X1 9507.99 1 9507.99 742.43 0.0000
B: X2 3522.46 1 3522.46 275.05 0.0000
AA 0.3631118 1 0.363118 0.03 0.8705
AB 242.344 1 242.344 18.92 0.0024
BB 122.856 1 122.856 9.59 0.0147
Total error 102.452 8 12.8066
Total (corr.) 14237.0 13
R2 0.9928

74
Figure 6.6 ‒ Pareto charts for the responses. Degrees of freedom = 8 (t = 2.31). Fisher F for 95% confidence
level. (a) Y1, apparent first-order specific BPA degradation rate (min-1). (b) Y2, BPA degradation after 15 min
(%). (c) Y3, TOC removal after 120 min (%). X1 and X2 are the codified independent variables corresponding to
[H2O2]0 and EP,0, respectively.
75
For the specific BPA degradation rate (Y1, min-1), the positive significant effects of X2
(EP,0), X1 (initial H2O2 concentration), and interaction of these two variables, X2X1, are
observed (Figure 6.6a); the determination coefficient (R2) indicates that the model as fitted
explains 95.6% of the variability of Y1 (Table 6.3). Figure 6.6b indicates significant positive
effects of X1 and X2, and the significant negative quadratic effect X12 on Y2 (BPA %
degradation after 15 min) at the 95% confidence level; R2 indicates that the model (Table 6.4)
as fitted explains 93.1% of the variability of the response. For the response Y3 (TOC removal
after 120 min), Figure 6.6c shows significant positive effects of X1, X2 and X1X2, and the
significant negative quadratic effect X22 on Y3 (% TOC removal after 120 min), and R2
confirms that the model as fitted (Table 6.5) explains 99.3% of the variability of this response.
In all cases, the residuals were randomly distributed around residue zero with zero mean
(Figure 6.7).

76
Figure 6.7 ‒ Distribution of residuals as a function of the predicted values. (a) Y1, apparent first-order specific
BPA degradation rate (min-1). (b) Y2, BPA degradation after 15 min (%). (c) Y3, TOC removal after 120 min (%).
X1 and X2 are the codified independent variables corresponding to [H2O2]0 and EP,0, respectively.

77
Figures 6.8, 6.9 and 6.10 show the two-dimensional contour plots and the response
surface for Y1, Y2 and Y3, respectively. They were designed using the data provided in Table
6.2.
Figure 6.8 ‒ (a) Response surface for Y1 (apparent first-order specific BPA degradation rate, min-1), described by
Equation I in Table 6.2. (b) Contour plots. X1 and X2 are the codified independent variables corresponding to
[H2O2]0 and EP,0, respectively.
The response surface suggests a highest value for Y1, which is 0.35 min-1. The
combination of factor levels which maximizes Y1 over the indicated region is 1.0975 and
0.866 for X1 and X2, respectively. The real values of the variables: U1 (initial H2O2
concentration) and U2 (specific rate of photons emission) are 9.6 mmol L-1 and 3.6 × 10¹⁸
photons L-1s-1, respectively. A fast increase in the specific BPA degradation rate (response Y1)
with increasing H2O2 concentration (X1) and specific photon emission rate (X2) is observed.
The upper line corresponds to Y1 = 0.34 min-1, for X1 from about 0.8 to 1.3 (8.88 to 11.64

78
mmol L-1) and X2 from about 0.8 to 0.9 (3.32 to 3.46 × 10¹⁸ photons L-1 s-1). On the other
hand, when only one of the variables is at its highest level, low values of Y1 are observed.
Figure 6.9 ‒ (a) Response surface for Y2 (BPA degradation after 15 min, %), described by Equation II in Table
6.2. (b) Contour plots. X1 and X2 are the codified independent variables corresponding to [H2O2]0 and EP,0,
respectively.
Figure 6.9a revealed a maximum value for Y2, which is ~100%. The combination of
factor levels which maximizes Y2 over the indicated region is 0.412 and 0.802 for X1 and X2,
respectively. The corresponding real values of the variables: U1 (initial H2O2 concentration)
and U2 (specific rate of photons emission) are 7.23 mmol L-1 and 3.32 × 10¹⁸ photons L-1s-1,
respectively. It is interesting to note that the H2O2 concentration considered as optimum was
close to the theoretical stoichiometric concentration (8 mmol L-1) estimated for the initial
BPA concentration adopted (50 mg L-1). An increase in the efficiency of the oxidation process
with increasing X1 and X2 is also observed, whereas in this case a region of maximum is

79
clearly distinguished, with nearly 100% BPA removal at X1 = 0.412 and X2 = 0.802; these
codified variables correspond to [H2O2]0 = 6.75 mmol L-1 and EP,0 = 3.33 × 10¹⁸ photons L-1 s-
1, respectively. Note that these results are quite similar to those observed in experiment 2,
whose conditions ([H2O2]0 = 7.6 mmol L-1 and EP,0 = 3.6 × 10¹⁸ photons L-1 s-1) were
previously suggested as the most adequate for BPA degradation. This behaviour indicates the
effects of hydrogen peroxide, also acting as an efficient hydroxyl radical scavenger,
producing water and hydroperoxyl radicals (HO2), which are less reactive than hydroxyl
radicals
Figure 6.10 ‒ (a) Response surface for Y3 (TOC removal after 120 min, %), described by Equation III in Table
6.2. (b) Contour plots. X1 and X2 are the codified independent variables corresponding to [H2O2]0 and EP,0,
respectively.
Figure 6.10a does not indicate any clear region of maximum response for Y3. Finally,
Figure 6.10b illustrates the behaviour of TOC removal after 120 min (Y3), which also
increases for increasing [H2O2]0 and EP,0. The line corresponding to 20% TOC removal is

80
found for X1 from about −0.9 to −0.1, and that of 95% for X1 from about 0.6 to 1.3. For this
response, the effect of EP,0 seems to be less significant, since high TOC removals are also
observed for lower levels of X2, as suggested by most lines (5 to 65%).
6.3 Kinetic modelling
As mentioned previously, two models that describe the lamp and its emission into the
radiation field were evaluated for our system. Each model will be discussed as regards our
experiments. Therefore, this section is divided in two. The first one is dedicated to the LSPP
model, and the second one to the LSSE model. A brief conclusion will be presented after
these both sections, stating our perceptions for each model. These sub-sections will also
present the average values for the LVRPA (⟨𝑒𝜆𝑎⟩𝑉𝑟) and the rate constants for each model.
6.3.1 PARAMETERS ESTIMATION – LSPP MODEL
A nonlinear least-square objective function minimized with the Neld-Mead simplex
algorithm (fminsearch) was applied to estimate the kinetic parameters k2 and k7, which
correspond to the reactions 𝐻2𝑂2 + 𝐻𝑂⦁𝑘2→𝐻𝑂2
⦁ +𝐻2𝑂 and 𝐵𝑃𝐴 + 𝐻𝑂⦁𝑘7→ 𝑝𝑟𝑜𝑑𝑢𝑐𝑡,
respectively. This procedure searched for values that minimize the sum of squared differences
between predicted and experimental BPA and H2O2 concentrations (Equation 6.1).
Minimize,
𝑓 = ∑[(𝐵𝑃𝐴𝑝𝑟𝑒𝑑𝑖𝑐𝑡𝑒𝑑 − 𝐵𝑃𝐴𝑒𝑥𝑝𝑒𝑟𝑖𝑚𝑒𝑛𝑡)2+ (𝐻2𝑂2𝑝𝑟𝑒𝑑𝑖𝑐𝑡𝑒𝑑 − 𝐻2𝑂2𝑒𝑥𝑝𝑒𝑟𝑖𝑚𝑒𝑛𝑡)
2] (6.1)
Subject to: 𝑑𝐶𝑖
𝑑𝑡= 𝑅𝑖(𝑥, 𝑡) (𝑖 = 𝐻2𝑂2 𝑜𝑟 𝐵𝑃𝐴)
k2 and k7 > 0
Relative H2O2 and BPA concentrations were used in order to overcome possible
drawbacks during the optimization procedure, owing to the different magnitudes of their real
values. The system of equations representing the batch reactor (Equations 5.39 and 5.40) was
implemented in MatLab® in order to gather the calculated concentrations. The mathematical

81
solution was provided by solving stiff differential equations based on Gear’s method
(ode15s).
For the numerical solution, the following information was needed:
i. The initial guesses of the kinetic constants k2 and k7 were gathered from
SIMUNOVIC et al. (2011) and FELIS et al. (2011);
ii. As previously mentioned in Section 4 – Materials and Methods, the specific
rate of photon absorption EP,0 was obtained by ferrioxalate actinometry and the
values were 1.44 × 10⁻³, 2.32 × 10⁻³, and 5.98 × 10⁻³ Einstein m-3 s-1;
iii. The molar absorption coefficient of H.O2 and its photolysis quantum yield
(ɛ𝐻2𝑂2 , ɸ𝐻2𝑂2,254𝑛𝑚 ) were obtained from the literature (Table 5.2). The
corresponding values for BPA ( ɛ𝐵𝑃𝐴, ɸ𝐵𝑃𝐴,254𝑛𝑚 ) were obtained from a
previous work (GOULART DE ARAUJO et al., 2017).
iv. The time period evaluated for the kinetic study was the first 15 min of
irradiation, since in most cases the H2O2 concentrations were below the limit of
detection after the mentioned time.
By using BPA and H2O2 concentrations versus time data, along with the nonlinear
regression algorithm described above, two parameters were adjusted (k2 and k7) and are
shown in Table 6.6.
Table 6.6 ‒ Comparison between estimated and reported values of the kinetic constants k2 and k7.
Parameters Estimated values Literature values
k2 3.4 × 10⁷ L mol-1 s-1 1.2 ‒ 4.5 × 10⁷ L mol-1 s-1
(SIMUNOVIC et al., 2011)
K7 1.84 × 10⁹ L mol-1 s-1 3.3 × 10⁹ L mol-1 s-1
(FELIS et al., 2011)
The estimated value of k2 falls within the range of measurements reported by
SIMUNOVIC et al. (2011). On the other hand, there are very few studies that have calculated
the reaction constant between BPA and the hydroxyl radical (k7), which makes it difficult to
search for intervals for this constant. However, our estimated value is of the same order of
magnitude as that calculated by FELIS et al. (2011). Figure 6. compares experimental versus
predicted values of BPA and H2O2 concentrations for all experiments.
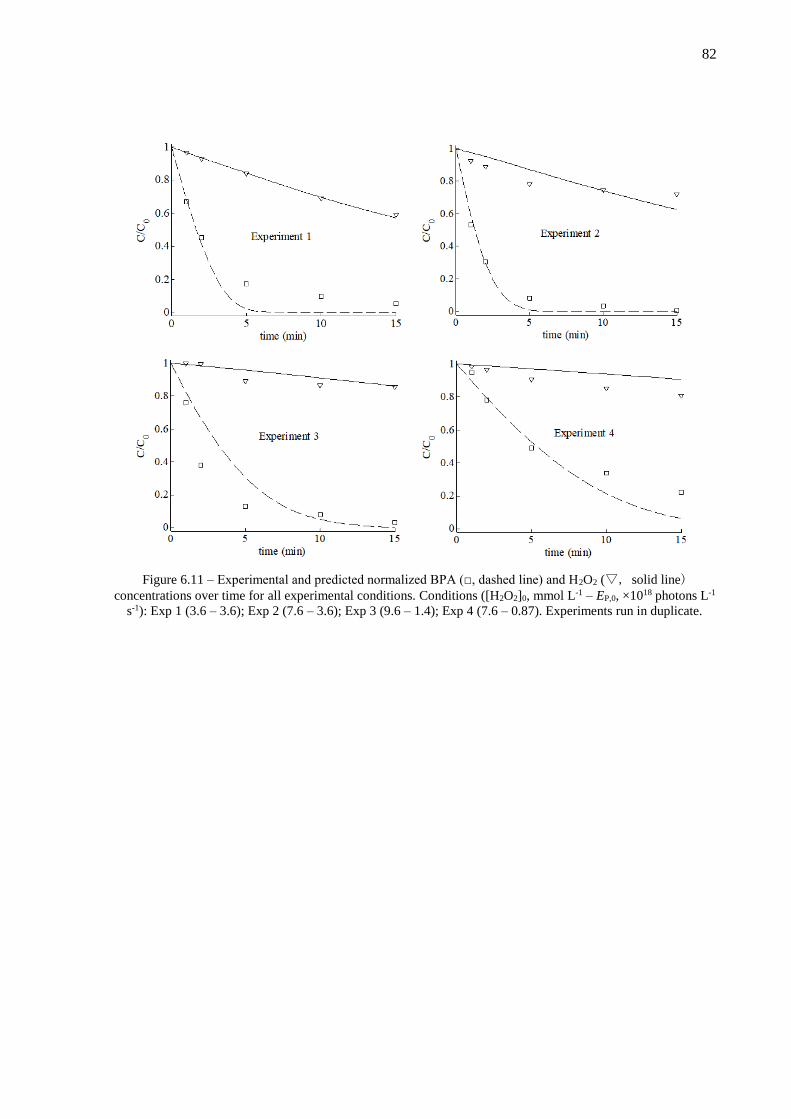
82
Figure 6.11 ‒ Experimental and predicted normalized BPA (□, dashed line) and H2O2 (▽, solid line)
concentrations over time for all experimental conditions. Conditions ([H2O2]0, mmol L-1 – EP,0, ×1018 photons L-1
s-1): Exp 1 (3.6 – 3.6); Exp 2 (7.6 – 3.6); Exp 3 (9.6 – 1.4); Exp 4 (7.6 – 0.87). Experiments run in duplicate.

83
Figure 6.11 (Cont.) ‒ Experimental and predicted normalized BPA (□, dashed line) and H2O2 (▽, solid line)
concentrations over time for all experimental conditions. Conditions ([H2O2]0, mmol L-1 – EP,0, ×1018 photons L-1
s-1): Exp 5 (3.6 – 0.87); Exp 6 (1.6 – 1.4); Exp 7 (5.6 – 1.4). Experiments run in duplicate.
84
As highlighted in Figure 6.11, a good fit of experimental data for both BPA and H2O2
concentrations over time was obtained for experiments 1, 2, 4, and 7. In such cases, the
optimized two reaction rate constants were adequate. However, for the other experiments (3,
5, and 6) the results predicted by the kinetic model were unsatisfactory, particularly when the
lowest H2O2 was employed (Exp 6). This remark indicated that the fitted model is not suitable
for the entire range of initial H2O2 concentrations.
Some considerations are made regarding these differences:
i. The initial conditions for each experiment were different. Therefore, the predicted
model will privilege some experimental runs at the expense of others; in this case, the
most impaired experimental runs were performed at either low initial hydrogen
peroxide concentration (Exp 6, [H2O2]0 = 1.6 mmol L-1), or low specific photon
emission rate (Exp 4, EP,0 = 1.44 ×10⁻³ Einstein m-3 s-1) or both variables at low values
(Exp 5, [H2O2]0 = 3.6 mmol L-1 and EP,0 = 1.44 ×10⁻³ Einstein m-3 s-1);
ii. The LSPP model considers the radiation field as uniform in the axial direction, which
may result in errors.
The root mean square error (RMSE) was used to evaluate the accuracy of the model
and it was obtained for both BPA and H2O2 concentrations. The root mean square errors
(RMSE) are 2.92 × 10⁻¹ and 2.16 × 10⁻² mmol L-1, for H2O2 and BPA concentrations,
respectively.

85
7. CONCLUSIONS AND FUTURE WORK
Bisphenol A (BPA) degradation in aqueous solution by the H2O2/UV process at 254
nm was investigated in this Thesis. Two main original contributions were accomplished. The
first is a systematic investigation on the influence of the initial H2O2 concentration ([H2O2]0)
and specific rate of photons emission (EP,0) on the apparent first-order specific BPA
degradation rate, BPA degradation after 15 min, and TOC removal after 180 min. With this
aim, a detailed approach based on a Doehlert experimental design and response surface
methodology was used. The second contribution is the proposal of a rigorous kinetic model
for the H2O2/UV-driven BPA degradation process. In this case, as far as we know, no
previous studies had employed the local volumetric rate of photons absorption explicitly in a
kinetic model.
As regards the first contribution, we found that the best conditions for BPA
degradation by the H2O2/UV process were [H2O2]0 = 7.6 mmol L-1 and EP,0 = 3.6 × 10¹⁸
photons L-1 s-1. These conditions resulted in the highest apparent first-order specific BPA
degradation rate and BPA degradation after 15 min, and the second highest TOC removal
after 180 min. Nevertheless, despite the very good results regarding BPA degradation, in most
cases less than 75% TOC removals were achieved after 180 min, with nearly 95%
mineralization observed only for the highest [H2O2]0 and EP,0 used.
Moreover, the lowest initial H2O2 concentrations (1.6 and 3.6 mmol L-1, respectively),
associated with low specific photon emission rates (1.4 and 0.87 × 10¹⁸ photons L-1 s-1,
respectively) were found to be insufficient to degrade the transformation products formed,
even in the presence of H2O2 during all the reaction time. In addition, roughly the same time
behaviour of pH was observed in all experiments, i.e., a decrease from 7 to about 3 in the first
70 min. In only two experiments pH 5 increased from about 3 to 5 until the end of the
reaction. This behaviour is well known in the field of AOPs. In fact, the formation of acidic
intermediates results in pH decrease, which under some conditions increases as a result of
BPA by-products mineralization to CO2 and H2O.
Finally, the experimental design based on the Doehlert matrix showed to be adequate
for evaluating the main effects of process variables (initial H2O2 concentrations, specific
photon emission rate) along with their interactions. Combined with the response surface
methodology, the Doehlert design enabled the determination of the most adequate conditions
for BPA degradation by the H2O2/UV process.

86
Regarding the second original contribution, a rigorous kinetic model for BPA
degradation by the H2O2/UV process in an annular photochemical reactor in batch
recirculation mode was developed, based on the line source with parallel plane emission
(LSPP) approach, in combination with the radiative transfer equation (RTE) and mass
balances. The steady-state approximation (SSA) was applied for highly reactive
intermediates, such as HO⦁ and HO2⦁ radicals, which is an adequate simplification. Two main
reaction rate constants were optimized and the values were considered adequate. By
comparing predicted and experimental data, a good representation of the BPA and H2O2
concentrations over treatment time was obtained.
The H2O2/UV process showed to be a good alternative for the treatment of aqueous streams
containing BPA. On the other hand, the optimal conditions may vary depending on the matrix
of interest, such as different types of effluents. However, this study may serve as first
guidelines for process conditions in a pilot-plant or even industrial projects. It is worth
mentioning that our kinetic study may provide useful information for studying the process
variables and consequently the system optimization and the determination of the best
parameters for process design and scaling-up. It is worth mentioning that the process could be
employed directly in BPA production sites. This could avoid high BPA concentrations in the
final industrial waste, where its treatment by H2O2/UV would be more difficult, since more
absorbent or higher concentration species may be present. In light of this, the kinetic model
proposed in this study can be appropriately applied in practice, taking into account that no
other species is being considered but only those that are particular to the H2O2/UV process
and to BPA.
Finally, further work is required. At first, other lamp emission models, such as LSSE
or ESVE, can be employed and compared with the LSPP model used in this Thesis, to check
whether they provide better fits of the experimental data. Other information that is crucial for
a complete kinetic model is the identification of intermediate by-products, which is usually
provided by detailed liquid chromatography-mass spectrometry work, in combination with
total organic carbon measurements. This helps propose degradation pathways, resulting in
extra reactions and reaction rate constants to be included in the mathematical model and
optimized. Finally, the determination of residual toxicity and endocrine activity of treated
solutions is necessary, in order to prove the applicability of the photo-oxidative process for
real water and wastewater treatment before their release to the environment.

87
8. REFERENCES
AGENSON, K. O.; URASE, T. Change in membrane performance due to organic fouling in
nanofiltration (NF)/reverse osmosis (RO) applications. Separation and Purification
Technology, v. 55, n. 2, p. 147-156, 2007.
AGRAWAL, R.; SUMAN, A. Production of Bisphenol A. Bachelor of Technology in
Chemical Engineering at Jaypee University of Engineering and Technology, India, 2012.
ALFANO, O. M.; ROMERO, R. L.; CASSANO, A. E. A cylindrical photoreactor irradiated
from the bottom - I. Radiation flux density generated by a tubular source and a parabolic
reflector. Chemical Engineering Science, v. 40, n. 11, p. 2119-2127, 1985.
ALFANO, O. M.; ROMERO, R. L.; CASSANO, A. E. A cylindrical photoreactor irradiated
from the bottom - II. Models for the local volumetric rate of energy absorption with
polychromatic radiation and their evaluation. Chemical Engineering Science, v. 41, n. 5, p.
1155-1161, 1986a.
ALFANO, O. M.; ROMERO, R. L.; CASSANO, A. E. Radiation field modelling in
photoreactors - I. Homogeneous media. Chemical Engineering Science, v. 41, n. 3, p. 421-
444, 1986.
ALFANO, O. M.; ROMERO, R. L.; NEGRO, A. C.; CASSANO, A. E. A cylindrical
photoreactor irradiated from the bottom. III. Measurement of absolute values of the local
volumetric rate of energy absorption. Experiments with polychromatic radiation. Chemical
Engineering Science, v. 41, n. 5, p. 1163-1169, 1986.
ALNAIZY, R.; AKGERMAN, A. Advanced oxidation of phenolic compounds. Advances in
Environmental Research, v. 4, n. 3, p. 233-244, 2000.
ALUM, A.; YOON, Y.; WESTERHOFF, P.; ABBASZADEGAN, M. Oxidation of bisphenol
A, 17β-estradiol, and 17α-ethynylestradiol and by product estrogenicity. Environmental
Toxicology, v. 19, n. 3, p. 257-264, 2004.
ANDREOZZI, R., CAPRIO, V., INSOLA, A., MAROTTA, R. Advanced oxidation processes
(AOP) for water purification and recovery. Catalysis Today, v. 53, n. 1, p. 51-59, 1999.
88
ANDREOZZI, R.; CAPRIO, V.; INSOLA, A.; MAROTTA, R.; SANCHIRICO, R. Advanced
oxidation processes for the treatment of mineral oil-contaminated wastewaters. Water
Research, v. 34, n. 2, p. 620-628, 2000.
ARAUJO, L. G.; SANTOS, F. S.; TEIXEIRA, A. C. S. C. Degradation of bisphenol A by the
UV and UV/H2O2 processes: Evaluation of process variables through experimental design.
The Canadian Journal of Chemical Engineering, v. 95, n. 12, p. 2278-2285, 2017.
ARP, H. P. Compilation of Norwegian screening data for selected contaminants (2002–2012).
Oslo, Norwegian Climate and Pollution Agency (Statlig program for
forurensningsovervåking. Rapport n. 1133/2012. TA-2982/2012).
ASAKURA, H.; MATSUTO, T.; TANAKA, N. Behavior of endocrine-disrupting chemicals
in leachate from MSW landfill sites in Japan. Waste Management, v. 24, n. 6, p. 613-622,
2004.
BAEZA, C.; KNAPPE, D. R. Transformation kinetics of biochemically active compounds in
low-pressure UV photolysis and H2O2/UV advanced oxidation processes. Water Research,
v. 45, n. 15, p. 4531-4543, 2011.
BENZAQUÉN, T. B.; ISLA, M. A.; ALFANO, O. M. Fenton and photo‐Fenton processes for
the degradation of atrazine: a kinetic study. Journal of Chemical Technology and
Biotechnology, v. 90, n. 3, p. 459-467, 2015.
BENZAQUÉN, T. B.; ISLA, M. A.; ALFANO, O. M. Quantum efficiencies of the photo-
Fenton degradation of atrazine in water. Water Science and Technology, v. 66, n. 10, p.
2209-2216, 2012.
BIELSKI, B. H.; CABELLI, D. E.; ARUDI, R. L.; ROSS, A. B. Reactivity of HO2/O2-
radicals in aqueous solution. Journal of Physical and Chemical Reference Data, v. 14, n. 4,
p. 1041-1100, 1985.
BIRD, R. B.; STEWART, W. E.; LIGHTFOOT, E. N. Transport Phenomena. 1960.
Madison, USA, 1960.
BRAUN, A. M.; JAKOB, L.; OLIVEROS, E.; NASCIMENTO, C. A. O. D. Up-scaling
photochemical reactions. Advances in Photochemistry, v. 18, p. 235-314, 1993.

89
BRAUN, A. M.; MAURETTE, M. T.; OLIVEROS, E. Photochemical Technology. John
Wiley & Son Ltd, 1991.
BROTONS, J. A.; OLEA-SERRANO, M. F.; VILLALOBOS, M.; PEDRAZA, V.; OLEA, N.
Xenoestrogens released from lacquer coatings in food cans. Environmental Health
Perspectives, v. 103, n. 6, p. 608-612, 1995.
BUXTON, G. V.; GREENSTOCK, C. L.; HELMAN, W. P.; ROSS, A. B. Critical review of
rate constants for reactions of hydrated electrons, hydrogen atoms and hydroxyl radicals
(OH/O−) in aqueous solution. Journal of Physical and Chemical Reference Data, v. 17, n.
2, p. 513-886, 1988.
CALAFAT, A. M.; KUKLENYIK, Z.; REIDY, J. A.; CAUDILL, S. P.; EKONG, J.;
NEEDHAM, L. L. Urinary concentrations of bisphenol A and 4-nonylphenol in a human
reference population. Environmental Health Perspectives, v. 113, n. 4, p. 391-395, 2005.
CAMPAÑA, A. G.; RODRÍGUEZ, L. C.; GONZÁLEZ, A. L.; BARRERO, F. A.; CEBA, M.
R. Sequential response surface methodology for multi optimization in analytical chemistry
with three-variable Doehlert designs. Analytica Chimica Acta, v. 348, n. 1, p. 237-246,
1997.
CASSANO, A. E.; MARTIN, C. A.; BRANDI, R. J.; ALFANO, O. M. Photoreactor analysis
and design: fundamentals and applications. Industrial & Engineering Chemistry Research,
v. 34, n. 7, p. 2155-2201, 1995.
CERDA, J.; MARCHETTI, J. L.; CASSANO, A. E. The use of simple radiation models for
the case of direct irradiation of photochemical reactors. Latin America Journal of Chemical
Engineering and Applied Chemistry, v. 8, p. 15-25, 1978.
CHEN, M. Y.; IKE, M.; FUJITA, M. Acute toxicity, mutagenicity, and estrogenicity of
bisphenol-A and other bisphenols. Environmental Toxicology, v. 17, n. 1, p. 80-86, 2002.
CHEN, P. J.; LINDEN, K. G.; HINTON, D. E.; KASHIWADA, S.; ROSENFELDT, E. J.;
KULLMAN, S. W. Biological assessment of bisphenol A degradation in water following
direct photolysis and UV advanced oxidation. Chemosphere, v. 65, n. 7, p. 1094-1102, 2006.

90
CHEN, P. J.; ROSENFELDT, E. J.; KULLMAN, S. W.; HINTON, D. E.; LINDEN, K. G.
Biological assessments of a mixture of endocrine disruptors at environmentally relevant
concentrations in water following H2O2/UV oxidation. Science of the Total Environment, v.
376, n. 1, p. 18-26, 2007.
CHENG, M.; ZENG, G.; HUANG, D.; LAI, C.; XU, P.; ZHANG, C.; LIU, Y. Hydroxyl
radicals based advanced oxidation processes (AOPs) for remediation of soils contaminated
with organic compounds: a review. Chemical Engineering Journal, v. 284, p. 582-598,
2016.
COMNINELLIS, C.; KAPALKA, A.; MALATO, S.; PARSONS, S. A.; POULIOS, I.;
MANTZAVINOS, D. Advanced oxidation processes for water treatment: advances and trends
for R&D. Journal of Chemical Technology and Biotechnology, v. 83, n. 6, p. 769-776,
2008.
CONTRERAS, S.; RODRIGUEZ, M.; AL MOMANI, F.; SANS, C.; ESPLUGAS, S.
Contribution of the ozonation pre-treatment to the biodegradation of aqueous solutions of 2,
4-dichlorophenol. Water Research, v. 37, n. 13, p. 3164-3171, 2003.
COORS, A.; JONES, P. D.; GIESY, J. P.; RATTE, H. T. Removal of estrogenic activity from
municipal waste landfill leachate assessed with a bioassay based on reporter gene expression.
Environmental Science & Technology, v. 37, n. 15, p. 3430-3434, 2003.
CRITTENDEN, J. C.; HUA, S.; HAND, D. W.; GREEN, S. A. A kinetic model for H2O2/UV
process in a completely mixed batch reactor. Water Research, v. 33, n. 10, p. 2315-2328.
1999.
DE LAAT, J.; GALLARD, H.; ANCELIN, S.; LEGUBE, B. Comparative study of the
oxidation of atrazine and acetone by H2O2/UV, Fe (III)/UV, Fe (III)/H2O2/UV and Fe (II) or
Fe (III)/H2O2. Chemosphere, v. 39, n. 15, p. 2693-2706, 1999.
DIAMANTI-KANDARAKIS, E.; BOURGUIGNON, J. P.; GIUDICE, L. C.; HAUSER, R.;
PRINS, G. S.; SOTO, A. M.; ZOELLER, R. T.; GORE, A. C. Endocrine-disrupting
chemicals: an Endocrine Society scientific statement. Endocrine Reviews, v. 30, n. 4, p. 293-
342, 2009.

91
DODDS, E. C.; LAWSON, W. Synthetic estrogenic agents without the phenanthrene nucleus.
Nature, v. 137, n. 3476, p. 996, 1936.
DOMÈNECH, X.; JARDIM, W. F.; LITTER, M. I. Procesos avanzados de oxidación para la
eliminación de contaminantes. Eliminación de Contaminantes por Fotocatálisis
Heterogénea, cap, v. 1, 2001.
DORN, P. B.; CHOU, C. S.; GENTEMPO, J. J. Degradation of bisphenol A in natural waters.
Chemosphere, v. 16, n. 7, p. 1501-1507, 1987.
EDALATMANESH, M.; DHIB, R.; MEHRVAR, M.. Kinetic modeling of aqueous phenol
degradation by H2O2/UV process. International Journal of Chemical Kinetics, v. 40, n. 1,
p. 34-43, 2008.
EPA, U. S. Special report on Environmental endocrine disruption: An effects assessment
and analysis office of research and development. REPA/630/R-96/012. In: Washington
DC, 1997.
ERICKSON, M. L. Steroidal hormones and other endocrine active compounds in shallow
groundwater in nonagricultural areas of Minnesota - Study design, methods, and data,
2012. 2009–10: U.S. Geological Survey Data Series 663, p. 9.
https://pubs.usgs.gov/ds/663/pdf/ds663.pdf.
ERICKSON, M. L.; LANGER, S. K.; ROTH, J. L.; KROENING, S. E. Contaminants of
emerging concern in ambient groundwater in urbanized areas of Minnesota, 2014.
2009–12 (ver. 1.2, September 2014): U.S. Geological Survey Scientific Investigations Report
2014–5096, p. 38, with appendix, http://dx.doi.org/10.3133/sir20145096
EUROPEAN UNION, Risk Assessment Report, CAS: 80-05-7 EINECS No: 201-245-8,
Environment Addendum of April 2008, 4,4'-ISOPROPYLIDENEDIPHENOL (Bisphenol-
A), Part 1 Environment, 2012.
FELIS, E.; LEDAKOWICZ, S.; MILLER, J. S. Degradation of bisphenol A using UV and
H2O2/UV processes. Water Environment Research, v. 83, n. 12, p. 2154-2158, 2011.
FENT, G.; HEIN, W. J.; MOENDEL, M. J.; KUBIAK, R. Fate of 14 C-bisphenol A in soils.
Chemosphere, v. 51, n. 8, p. 735-746, 2003.

92
FROMME, H.; KÜCHLER, T.; OTTO, T.; PILZ, K.; MÜLLER, J.; WENZEL, A.
Occurrence of phthalates and bisphenol A and F in the environment. Water Research, v. 36,
n. 6, p. 1429-1438, 2002.
FÜRHACKER, M.; SCHARF, S.; WEBER, H. Bisphenol A: emissions from point sources.
Chemosphere, v. 41, n. 5, p. 751-756, 2000.
GAERTNER, R. F.; KENT, J. A. Conversion in a continuous photochemical reactor.
Industrial & Engineering Chemistry, v. 50, n. 9, p. 1223-1226, 1958.
GATIDOU, G.; THOMAIDIS, N. S.; STASINAKIS, A. S.; LEKKAS, T. D. Simultaneous
determination of the endocrine disrupting compounds nonylphenol, nonylphenolethoxylates,
triclosan and bisphenol A in wastewater and sewage sludge by gas chromatography–mass
spectrometry. Journal of Chromatography A, v. 1138, n. 1, p. 32-41, 2007.
GUNNARSSON, L.; JAUHIAINEN, A.; KRISTIANSSON, E.; NERMAN, O.; LARSSON,
D. J. Evolutionary conservation of human drug targets in organisms used for environmental
risk assessments. Environmental Science & Technology, v. 42, n. 15, p. 5807-5813, 2008.
HAGER, D. G. UV-catalyzed hydrogen peroxide chemical oxidation of organic contaminants
in water. IN: Innovative Hazardous Waste Treatment Technology Series., v. 2, 1990.
HARRIS, P. R.; DRANOFF, J. S. A study of perfectly mixed photochemical reactors. AIChE
Journal, v. 11, n. 3, p. 497-502, 1965.
HAYNES, William M. (Ed.). CRC handbook of chemistry and physics. CRC press, 2014.
HUANG, C. R.; SHU, H. Y. The reaction kinetics, decomposition pathways and intermediate
formations of phenol in ozonation, UV/O3 and H2O2/UV processes. Journal of Hazardous
Materials, v. 41, n. 1, p. 47-64, 1995.
IJPELAAR, G. F.; HARMSEN, D. J.; BEERENDONK, E. F.; VAN LEERDAM, R. C.;
METZ, D. H.; KNOL, A. H.; FULMER, A.; KRIJNEN, S. Comparison of low pressure and
medium pressure UV lamps for H2O2/UV treatment of natural waters containing micro
pollutants. Ozone: Science & Engineering, v. 32, n. 5, p. 329-337, 2010.

93
IKEZUKI, Y.; TSUTSUMI, O.; TAKAI, Y.; KAMEI, Y.; TAKETANI, Y. Determination of
bisphenol A concentrations in human biological fluids reveals significant early prenatal
exposure. Human Reproduction, v. 17, n. 11, p. 2839-2841, 2002.
IMOBERDORF, G. E.; IRAZOQUI, H. A.; ALFANO, O. M.; CASSANO, A. E. Scaling-up
from first principles of a photocatalytic reactor for air pollution remediation. Chemical
Engineering Science, v. 62, n. 3, p. 793-804, 2007.
INGERSLEV, F.; HALLING-SØRENSEN, B. Evaluation of analytical chemical methods
for detection of estrogens in the environment. Danish Ministry of the Environment, Danish
Environmental Protection Agency, 2003.
IRAZOQUI, H. A.; CERDÁ, J.; CASSANO, A. E. Radiation profiles in an empty annular
photoreactor with a source of finite spatial dimensions. AICHE Journal, v. 19, n. 3, p. 460-
467, 1973.
JACOB, S. M; DRANOFF, J. S. Design and analysis of perfectly mixed photochemical
reactors. Chemical Engineering Progress Symposium Series, v. 89, p. 47-63, 1966.
JAMIL, T. S.; ROLAND, H.; MICHAEL, H.; JENS-UWE, R. Homogeneous photocatalytic
processes for degradation of some endocrine disturbing chemicals under UV irradiation.
Journal of Water Process Engineering, v. 18, p. 159-168, 2017.
KANG, N.; LEE, D. S.; YOON, J. Kinetic modeling of Fenton oxidation of phenol and
monochlorophenols. Chemosphere, v. 47, n. 9, p. 915-924, 2002.
KATSUMATA, H.; KAWABE, S.; KANECO, S.; SUZUKI, T.; OHTA, K. Degradation of
bisphenol A in water by the photo-Fenton reaction. Journal of Photochemistry and
Photobiology A: Chemistry, v. 162, n. 2, p. 297-305, 2004.
KAWAGOSHI, Y.; FUJITA, Y.; KISHI, I.; FUKUNAGA, I. Estrogenic chemicals and
estrogenic activity in leachate from municipal waste landfill determined by yeast two-hybrid
assay. Journal of Environmental Monitoring, v. 5, n. 2, p. 269-274, 2003.
KIM, Y. H.; KIM, C. S.; PARK, S.; HAN, S. Y.; PYO, M. Y.; YANG, M. Gender differences
in the levels of bisphenol A metabolites in urine. Biochemical and Biophysical Research
Communications, v. 312, n. 2, p. 441-448, 2003.
94
KLECKA, G. M.; STAPLES, C. A.; CLARK, K. E.; VAN DER HOEVEN, N.; THOMAS,
D. E.; HENTGES, S. G. Exposure analysis of bisphenol A in surface water systems in North
America and Europe. Environmental Science & Technology, v. 43, n. 16, p. 6145-6150,
2009.
KOLPIN, D. W.; FURLONG, E. T.; MEYER, M. T.; THURMAN, E. M.; ZAUGG, S. D.;
BARBER, L. B.; BUXTON, H. T. Pharmaceuticals, hormones, and other organic wastewater
contaminants in US streams, 1999-2000: A national reconnaissance. Environmental Science
& Technology, v. 36, n. 6, p. 1202-1211, 2002.
KOMESLI, O. T.; MUZ, M.; AK, M. S.; BAKIRDERE, S.; GOKCAY, C. F. Occurrence, fate
and removal of endocrine disrupting compounds (EDCs) in Turkish wastewater treatment
plants. Chemical Engineering Journal, v. 277, p. 202-208, 2015.
KURATA, Y.; ONO, Y.; ONO, Y. Occurrence of phenols in leachates from municipal solid
waste landfill sites in Japan. Journal of Material Cycles and Waste Management, v. 10, n.
2, p. 144-152, 2008.
KUSVURAN, E.; YILDIRIM, D. Degradation of bisphenol A by ozonation and
determination of degradation intermediates by gas chromatography–mass spectrometry and
liquid chromatography–mass spectrometry. Chemical Engineering Journal, v. 220, p. 6-14,
2013.
LAU, T. K.; CHU, W.; GRAHAM, N. J. The aqueous degradation of butylated
hydroxyanisole by UV/S2O82-: study of reaction mechanisms via dimerization and
mineralization. Environmental Science & Technology, v. 41, n. 2, p. 613-619, 2007.
LEE K. E.; SCHOENFUSS H. L.; BARBER L. B.; WRITER J. H.; BLAZER V. S.;
KIESLING R. L.; FERREY M. L. Endocrine active chemicals and endocrine disruption in
Minnesota streams and lakes - implications for aquatic resources, 1994-2008. 2010. U.S.
Geological Survey Scientific Investigations Report 2010–5107, 47 p. with Appendixes,
https://pubs.usgs.gov/sir/2010/5107/pdf/sir2010-5107.pdf.(2007)
LEE, K. E.; LANGER, S. K.; BARBER, L. B.; WRITER, J. H.; FERREY, M. L.;
SCHOENFUSS, H. L.; FURLONG, E. T.; FOREMAN, W. T.; GRAY, J. L.; REVELLO, R.
C.; MARTINOVIC, D.; WOODRUFF, O. P.; KEEFE, S. H.; BROWN, G. K.; TAYLOR, H.

95
E.; FERRER, I.; THURMAN, E. M. Endocrine active chemicals, pharmaceuticals, and
other chemicals of concern in surface water, wastewater-treatment plant effluent, and
bed sediment, and biological characteristics in selected streams. Minnesota - design,
methods, and data, 2011. 2009: U.S. Geological Survey Data Series 575, p. 54, with
appendixes, https://pubs.usgs.gov/ds/575/pdf/ds575.pdf.
LEGRINI, O.; OLIVEROS, E.; BRAUN, A. M. Photochemical processes for water treatment.
Chemical Reviews, v. 93, n. 2, p. 671-698, 1993.
LI, Y. M.; ZENG, Q. L.; YANG, S. J. Removal and fate of estrogens in an anaerobic-anoxic-
oxic activated sludge system. Water Science and Technology, v. 63, n. 1, p. 51-56, 2011.
LIU, Z. H.; KANJO, Y.; MIZUTANI, S. Removal mechanisms for endocrine disrupting
compounds (EDCs) in wastewater treatment - physical means, biodegradation, and chemical
advanced oxidation: a review. Science of the Total Environment, v. 407, n. 2, p. 731-748,
2009.
MAJCEN-LE MARECHAL, A.; SLOKAR, Y. M.; TAUFER, T. Decoloration of
chlorotriazine reactive azo dyes with H2O2/UV. Dyes and Pigments, v. 33, n. 4, p. 281-298.
1997.
MCGROUP. Bisphenol A (BPA): 2015 World Market Outlook and Forecast up to 2019. July,
2015, accessed on 7 September 2015, http://mcgroup.co.uk/news/20131108/bpa-production-
grew-372000-tonnes.html.
MOHAJERANI, M.; MEHRVAR, M.; EIN-MOZAFFARI, F. Computational Fluid Dynamics
(CFD) Modeling of Photochemical Reactors. In: Applied Computational Fluid Dynamics.
InTech, 2012.
MOHAPATRA, D. P.; BRAR, S. K.; TYAGI, R. D.; SURAMPALLI, R. Y. Concomitant
degradation of bisphenol A during ultrasonication and Fenton oxidation and production of
biofertilizer from wastewater sludge. Ultrasonics Sonochemistry, v. 18, n. 5, p. 1018-1027,
2011.
MORIN, N.; ARP, H. P. H.; HALE, S. E. Bisphenol A in solid waste materials, leachate
water, and air particles from Norwegian waste-handling facilities: presence and partitioning
behavior. Environmental Science & Technology, v. 49, n. 13, p. 7675-7683, 2015.
96
NAKASHIMA, T.; OHKO, Y.; KUBOTA, Y.; FUJISHIMA, A. Photocatalytic
decomposition of estrogens in aquatic environment by reciprocating immersion of TiO2-
modified polytetrafluoroethylene mesh sheets. Journal of Photochemistry and
Photobiology A: Chemistry, v. 160, n. 1, p. 115-120, 2003.
NICK, K.; SCHÖLER, H. F.; MARK, G.; SÖYLEMEZ, T.; AKHLAQ, M. S.;
SCHUCHMANN, H. P.; VON SONNTAG, C. Degradation of some triazine herbicides by
UV radiation such as used in the UV disinfection of drinking water. Aqua - Journal of
Water Supply: Research and Technology, v. 41, n. 2, p. 82-87, 1992.
OCHOA, T. J. A.; WHITAKER, S. El Método del promedio volumétrico para el estudio de
difusión en sistemas de varias componentes. Revista Mexicana de Física, v. 41, n. 3, p. 451-
470, 1995.
OLEA, N.; PULGAR, R.; PÉREZ, P.; OLEA-SERRANO, F.; RIVAS, A.; NOVILLO-
FERTRELL, A.; PEDRAZA, V.; SOTO, A. M.; SONNENSCHEIN, C. Estrogenicity of
resin-based composites and sealants used in dentistry. Environmental Health Perspectives,
v. 104, n. 3, p. 298-305, 1996.
OLMEZ-HANCI, T.; DURSUN, D.; AYDIN, E.; ARSLAN-ALATON, I.; GIRIT, B., MITA,
L.; DIANO, N.; MITA, D. G.; GUIDA, M. S2O82−/UV-C and H2O2/UV-C treatment of
Bisphenol A: Assessment of toxicity, estrogenic activity, degradation products and results in
real water. Chemosphere, v. 119, p. S115-S123, 2015.
OPPENLÄNDER, T. Photochemical purification of water and air: advanced oxidation
processes (AOPs)-principles, reaction mechanisms, reactor concepts. John Wiley & Sons,
2003.
ÖZIŞIK, M. N. Radiative transfer and interactions with conduction and convection.
Werbel & Peck, 1973.
PARK, C. G.; CHOI, E. S.; JEON, H. W.; LEE, J. H.; SUNG, B. W.; CHO, Y. H.; KO, K. B.
Effect of nitrate on the degradation of bisphenol A by H2O2/UV and ozone/H2O2 oxidation in
aqueous solution. Desalination and Water Treatment, v. 52, n. 4-6, p. 797-804, 2014.
PARSONS, S. (Ed.). Advanced oxidation processes for water and wastewater treatment.
IWA publishing, 2004.

97
PERA-TITUS, M.; GARCIA-MOLINA, V.; BAÑOS, M. A.; GIMÉNEZ, J.; ESPLUGAS, S.
Degradation of chlorophenols by means of advanced oxidation processes: a general review.
Applied Catalysis B: Environmental, v. 47, n. 4, p. 219-256, 2004.
PERES, J. C. G.; SILVIO, U. D.; TEIXEIRA, A. C. S.; GUARDANI, R. Study of an Annular
Photoreactor with Tangential Inlet and Outlet: I. Fluid Dynamics. Chemical Engineering &
Technology, v. 38, n. 2, p. 311-318, 2015.
PLANT, L.; JEFF, M. Hydrogen peroxide: a potent force to destroy organics in wastewater.
Chemical Engineering, p. EE16, 1994.
POLYCARBONATE/BPA GLOBAL GROUP, About Bisphenol A, Bisphenol A, 2003,
accessed on 9 September 2017, http://www.bisphenol-a.org/about/bpa-info/bpa-
synthesis.html.
PUMA, G. L.; PUDDU, V.; TSANG, H. K.; GORA, A.; TOEPFER, B. Photocatalytic
oxidation of multicomponent mixtures of estrogens (estrone (E1), 17β-estradiol (E2), 17α-
ethynylestradiol (EE2) and estriol (E3)) under UVA and UVC radiation: photon absorption,
quantum yields and rate constants independent of photon absorption. Applied Catalysis B:
Environmental, v. 99, n. 3, p. 388-397, 2010.
QUAN, Y.; PEHKONEN, S. O.; RAY, M. B. Evaluation of three different lamp emission
models using novel application of potassium ferrioxalate actinometry. Industrial &
Engineering Chemistry Research, v. 43, n. 4, p. 948-955, 2004.
RDC RESOLUTION n. 41/2011. Ministério da Saúde. ANVISA, 16 September 2011. Dispõe
sobre a proibição de uso de bisfenol A em mamadeiras destinadas a alimentação de lactentes
e dá outras providências, 2011, accessed in 10 September 2017,
http://bvsms.saude.gov.br/bvs/saudelegis/anvisa/2011/res0041_16_09_2011.html. (In
Portuguese)
RODRÍGUEZ, E. M.; FERNÁNDEZ, G.; KLAMERTH, N.; MALDONADO, M. I.;
ÁLVAREZ, P. M.; MALATO, S. Efficiency of different solar advanced oxidation processes
on the oxidation of bisphenol A in water. Applied Catalysis B: Environmental, v. 95, n. 3,
p. 228-237, 2010.

98
ROMERO, R. L.; ALFANO, O. M.; MARCHETTI, J. L.; CASSANO, A. E. Modelling and
parametric sensitivity of an annular photoreactor with complex kinetics. Chemical
Engineering Science, v. 38, n. 9, p. 1593-1605, 1983.
ROSENFELDT, E. J.; CHEN, P. J.; KULLMAN, S.; LINDEN, K. G. Destruction of
estrogenic activity in water using UV advanced oxidation. Science of the Total
Environment, v. 377, n. 1, p. 105-113, 2007.
ROSENFELDT, E. J.; LINDEN, K. G. Degradation of endocrine disrupting chemicals
bisphenol A, ethinylestradiol, and estradiol during UV photolysis and advanced oxidation
processes. Environmental Science & Technology, v. 38, n. 20, p. 5476-5483, 2004.
ROSSETTI, G. H.; ALBIZZATI, E. D.; ALFANO, O. M. Decomposition of formic acid in a
water solution employing the photo-Fenton reaction. Industrial & Engineering Chemistry
Research, v. 41, n. 6, p. 1436-1444, 2002.
RUPPERT, G.; BAUER, R.; HEISLER, G. UV-O3, UV-H2O2, UV-TiO2 and the photo-
Fenton reaction-comparison of advanced oxidation processes for wastewater treatment.
Chemosphere, v. 28, n.8, p. 1447-1454, 1994.
SAKAMOTO, H.; FUKUI, H.; SOUTA, I.; KANEKO, K. Studies on Bisphenol A and its
origins in leachates from solid waste landfills. Japan Society of Waste Management
Experts, v. 15, p. 511-520, 2004.
SCRIMSHAW, M. D.; LESTER. J. N. Fate and behavior of endocrine disruptors in
sludge treatment and disposal. Endocrine Disruptors in Wastewater and Sludge Treatment
Processes, CRC Press LLC and IWA Publishing, pp. 145-176, 2003.
SEHESTED, K.; RASMUSSEN, O. L.; FRICKE, H. Rate constants of OH with HO2, O2-, and
H2O2+ from hydrogen peroxide formation in pulse-irradiated oxygenated water. The Journal
of Physical Chemistry, v. 72, n. 2, p. 626-631, 1968.
SHARMA, J.; MISHRA, I. M.; KUMAR, V. Degradation and mineralization of Bisphenol A
(BPA) in aqueous solution using advanced oxidation processes: H2O2/UV and oxidation
systems. Journal of Environmental Management, v. 156, p. 266-275, 2015.

99
SHARMA, J.; MISHRA, I. M.; KUMAR, V. Mechanistic study of photo-oxidation of
Bisphenol-A (BPA) with hydrogen peroxide (H2O2) and sodium persulfate (SPS). Journal of
Environmental Management, v. 166, p. 12-22, 2016.
SHARMA, S.; RUPARELIA, J. P.; PATEL, M. L. A general review on advanced oxidation
processes for waste water treatment. In: Nirma University International Conference,
Ahmedabad, Gujarat. 2011.
SILVA, M. P.; DOS SANTOS BATISTA, A. P.; BORRELY, S. I.; SILVA, V. H. O.;
TEIXEIRA, A. C. S. C. Photolysis of atrazine in aqueous solution: role of process variables
and reactive oxygen species. Environmental Science and Pollution Research, v. 21, n. 21,
p. 12135-12142, 2014.
SIMUNOVIC, M.; KUSIC, H.; KOPRIVANAC, N.; BOZIC, A. L. Treatment of simulated
industrial wastewater by photo-Fenton process: Part II. The development of mechanistic
model. Chemical Engineering Journal, v. 173, n. 2, p. 280-289, 2011.
SIN, J. C.; LAM, S. M.; MOHAMED, A. R.; LEE, K. T. Degrading Endocrine Disrupting
Chemicals from Wastewater by TiO2 Photocatalysis: A Review. International Journal of
Photoenergy, p. 1-23, 2012.
SODRÉ, F. F.; MONTAGNER, C. C.; LOCATELLI, M. A. F.; JARDIM, W. F. Ocorrência
de interferentes endócrinos e produtos farmacêuticos em águas superficiais da região de
Campinas (SP, Brasil). Journal of Brazilian Society of Ecotoxicology, v. 2, n. 2, p. 187-196,
2007.
STAEHELIN, J.; HOIGNE, J. Decomposition of ozone in water in the presence of organic
solutes acting as promoters and inhibitors of radical chain reactions. Environmental Science
& Technology, v. 19, n. 12, p. 1206-1213, 1985.
STAPLES, C. A.; DOME, P. B.; KLECKA, G. M.; OBLOCK, S. T.; HARRIS, L. R. A
review of the environmental fate, effects, and exposures of bisphenol A. Chemosphere, v. 36,
n. 10, p. 2149-2173, 1998.
SUN, Y.; IRIE, M.; KISHIKAWA, N.; WADA, M.; KURODA, N.; NAKASHIMA, K.
Determination of bisphenol A in human breast milk by HPLC with column switching and
fluorescence detection. Biomedical Chromatography, v. 18, n. 8, p. 501-507, 2004.

100
SURI, R. P.; NAYAK, M.; DEVAIAH, U.; HELMIG, E. Ultrasound assisted destruction of
estrogen hormones in aqueous solution: effect of power density, power intensity and reactor
configuration. Journal of Hazardous Materials, v. 146, n. 3, p. 472-478, 2007.
TAO, H.; HAO, S.; CHANG, F.; WANG, L.; ZHANG, Y.; CAI, X. Photodegradation of
bisphenol A by titana nanoparticles in mesoporous MCM-41. Water, Air, & Soil Pollution,
v. 214, n. 1-4, p. 491-498, 2011.
TERNES, T. A.; STÜBER, J.; HERRMANN, N.; MCDOWELL, D.; RIED, A.;
KAMPMANN, M.; TEISER, B. Ozonation: a tool for removal of pharmaceuticals, contrast
media and musk fragrances from wastewater? Water Research, v. 37, n. 8, p. 1976-1982,
2003.
TIJANI, J. O.; FATOBA, O. O.; PETRIK, L. F. A review of pharmaceuticals and endocrine-
disrupting compounds: sources, effects, removal, and detections. Water, Air, & Soil
Pollution, v. 224, n. 11, p. 1770-1794, 2013.
TORRES, R. A.; SARANTAKOS, G.; COMBET, E.; PÉTRIER, C.; PULGARIN, C.
Sequential helio-photo-Fenton and sonication processes for the treatment of bisphenol A.
Journal of Photochemistry and Photobiology A: Chemistry, v. 199, n. 2, p. 197-203, 2008.
UMAR, M.; RODDICK, F.; FAN, L.; AZIZ, H. A. Application of ozone for the removal of
bisphenol A from water and wastewater–a review. Chemosphere, v. 90, n. 8, p. 2197-2207,
2013.
UNITED STATES ENVIRONMENTAL PROTECTION AGENCY, BPA action plan, 2010,
accessed on, https://www.epa.gov/sites/production/files/2015-
09/documents/bpa_action_plan.pdf
URASE, T.; MIYASHITA, K. I. Factors affecting the concentration of bisphenol A in
leachates from solid waste disposal sites and its fate in treatment processes. Journal of
Material Cycles and Waste Management, v. 5, n. 1, p. 77-82. 2003.
VANDENBERG, L. N.; HAUSER, R.; MARCUS, M.; OLEA, N.; WELSHONS, W. V.
Human exposure to bisphenol A (BPA). Reproductive Toxicology, v. 24, n. 2, p. 139-177,
2007.

101
VERHOEVEN, J. W. Glossary of terms used in photochemistry (IUPAC Recommendations
1996). Pure and Applied Chemistry, v. 68, n. 12, p. 2223-2286, 1996.
XU, J.; WU, L.; CHANG, A. C. Degradation and adsorption of selected pharmaceuticals and
personal care products (PPCPs) in agricultural soils. Chemosphere, v. 77, n. 10, p. 1299-
1305, 2009.
YAMADA, K.; URASE, T.; MATSUO, T.; SUZUKI, N. Constituents of organic pollutants in
leachates from different types of landfill sites and their fate in the treatment processes.
Journal Japan Society on Water Environment, v. 22, p. 40-45, 1999.
YAMAMOTO, T.; YASUHARA, A.; SHIRAISHI, H.; NAKASUGI, O. Bisphenol A in
hazardous waste landfill leachates. Chemosphere, v. 42, n. 4, p. 415-418, 2001.
YASUHARA, A.; SHIRAISHI, H.; NISHIKAWA, M.; YAMAMOTO, T.; UEHIRO, T.;
NAKASUGI, O.; OKUMURA, T.; KENMOTSU, K.; FUKUI, H.; NAGASE, M.; ONO, Y.
Determination of organic components in leachates from hazardous waste disposal sites in
Japan by gas chromatography–mass spectrometry. Journal of Chromatography A, v. 774, n.
1, p. 321-332, 1997
YUE, P. L. Modelling of kinetics and reactor for water purification by photo-oxidation.
Chemical Engineering Science, v. 48, n. 1, p. 1-11, 1993.
ZAHORODNA, M.; BOGOCZEK, R.; OLIVEROS, E.; BRAUN, A. M. Application of the
Fenton process to the dissolution and mineralization of ion exchange resins. Catalysis Today,
v. 129, n. 1, p. 200-206, 2007.
ZENG, G.; ZHANG, C.; HUANG, G.; YU, J.; WANG, Q.; LI, J.; XI, B.; LIU, H. Adsorption
behavior of bisphenol A on sediments in Xiangjiang River, Central-south China.
Chemosphere, v. 65, n. 9, p. 1490-1499, 2006.
ZEPP, R. G.; CLINE, D. M. Rates of direct photolysis in aquatic environment.
Environmental Science & Technology, v. 11, n. 4, p. 359-366, 1977.
ZHANG, A.; LI, Y. Removal of phenolic endocrine disrupting compounds from waste
activated sludge using UV, H2O2, and H2O2/UV oxidation processes: effects of reaction
conditions and sludge matrix. Science of the Total Environment, v. 493, p. 307-323, 2014.

102
ZHANG, Y.; ZHOU, J. L.; NING, B. Photodegradation of estrone and 17β-estradiol in water.
Water Research, v. 41, n. 1, p. 19-26, 2007.


