Ana Cristina Rocha da Silva Cortez das Neves Licenciada em Ciências de Engenharia do Ambiente Photochemical degradation of triclosan: a comparison between different light sources Dissertação para obtenção do Grau de Mestre em Engenharia do Ambiente, perfil Engenharia Sanitária Orientador: Profª. Doutora Ana Isabel Espinha da Silveira, Professora Auxiliar, Faculdade de Ciências e Tecnologias – Universidade Nova de Lisboa Co-orientador: Prof. Doutor Roberto Raga, Assistant Professor, DII – Università degli Studi di Padova Júri: Presidente: Profª. Doutora Maria da Conceição Raimundo dos Santos Arguente: Doutor Eduardo Manuel Hipólito Pires Mateus Vogal: Profª. Doutora Ana Isabel Espinha da Silveira Dezembro 2014
Transcript
Ana Cristina Rocha da Silva Cortez das Neves
Licenciada em Ciências de Engenharia do Ambiente
Photochemical degradation of triclosan: a comparison between different light
sources
Dissertação para obtenção do Grau de Mestre em Engenharia do Ambiente, perfil Engenharia Sanitária
Orientador: Profª. Doutora Ana Isabel Espinha da Silveira, Professora Auxiliar, Faculdade de Ciências e Tecnologias – Universidade Nova de Lisboa
Co-orientador: Prof. Doutor Roberto Raga, Assistant Professor, DII – Università degli Studi di Padova
Júri:
Presidente: Profª. Doutora Maria da Conceição Raimundo dos Santos Arguente: Doutor Eduardo Manuel Hipólito Pires Mateus Vogal: Profª. Doutora Ana Isabel Espinha da Silveira
Dezembro 2014
v
Photochemical degradation of triclosan: a comparison between different light sources
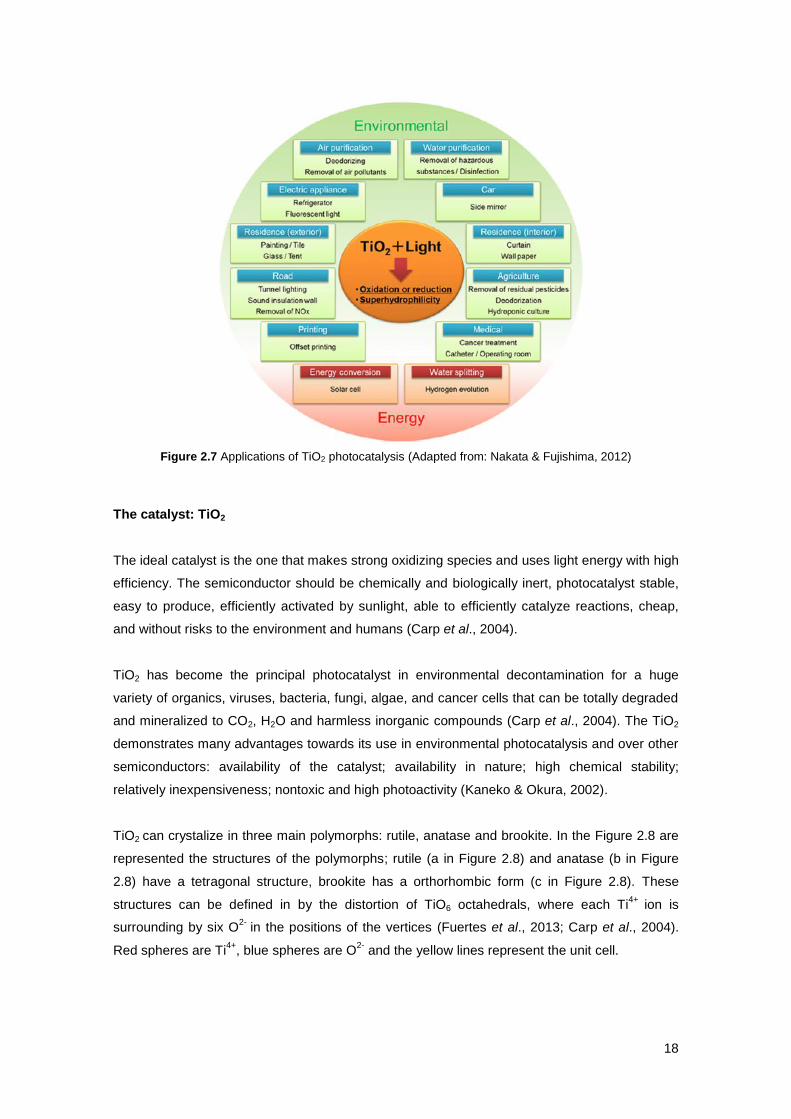
The ideal catalyst is the one that makes strong oxidizing species and uses light energy with high
efficiency. The semiconductor should be chemically and biologically inert, photocatalyst stable,
easy to produce, efficiently activated by sunlight, able to efficiently catalyze reactions, cheap,
and without risks to the environment and humans (Carp et al., 2004).
TiO2 has become the principal photocatalyst in environmental decontamination for a huge
variety of organics, viruses, bacteria, fungi, algae, and cancer cells that can be totally degraded
and mineralized to CO2, H2O and harmless inorganic compounds (Carp et al., 2004). The TiO2
demonstrates many advantages towards its use in environmental photocatalysis and over other
semiconductors: availability of the catalyst; availability in nature; high chemical stability;
relatively inexpensiveness; nontoxic and high photoactivity (Kaneko & Okura, 2002).
TiO2 can crystalize in three main polymorphs: rutile, anatase and brookite. In the Figure 2.8 are
represented the structures of the polymorphs; rutile (a in Figure 2.8) and anatase (b in Figure
2.8) have a tetragonal structure, brookite has a orthorhombic form (c in Figure 2.8). These
structures can be defined in by the distortion of TiO6 octahedrals, where each Ti4+
ion is
surrounding by six O2-
in the positions of the vertices (Fuertes et al., 2013; Carp et al., 2004).
Red spheres are Ti4+
, blue spheres are O2-
and the yellow lines represent the unit cell.
19
Figure 2.8 Crystal structures of TiO2 polymorphs, (a) rutile, (b) anatase and (c) brookite (Adapted from:
Fuertes et al., 2013).
Differences in lattice structures are responsible for different mass densities and electronic band
structures among the polymorphs (Fuertes et al., 2013). Anatase has a larger photocatalytic
activity, explained by a higher band gap then rutile, as reported in Table 2.9.
Nevertheless a mixture of anatase and rutile, like commercial Degussa “TiO2 P25”, is claimed to
be more active than anatase (Sun & Xu, 2010; Kaneko & Okura, 2002).
Table 2.9 Some properties of the main polymorphs of TiO2 (Adapted from: Carp et al., 2004)
Rutile Anatase Brookite
Polymorph form tetragonal tetragonal orthorhombic
Density (kg/m3) 4240 3830 4170
Band Gap (eV) 3,05 3,26 -
20
21
3 Methodology
3.1 Experimental setup
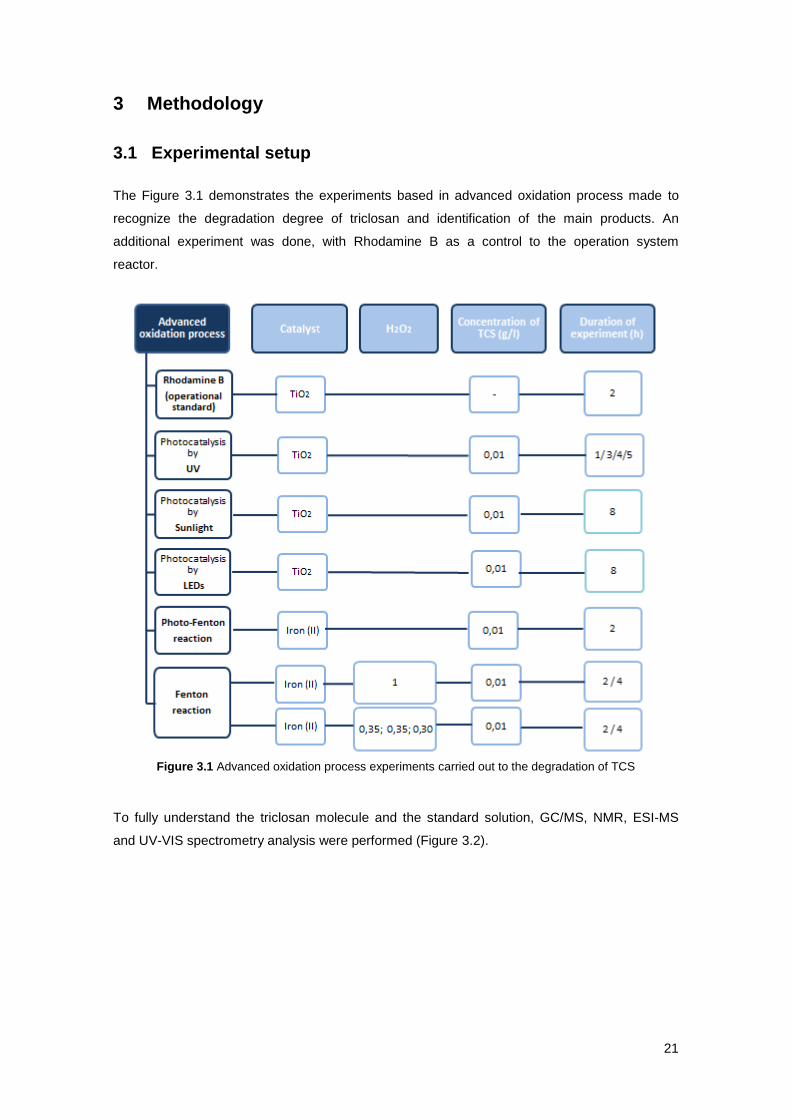
The Figure 3.1 demonstrates the experiments based in advanced oxidation process made to
recognize the degradation degree of triclosan and identification of the main products. An
additional experiment was done, with Rhodamine B as a control to the operation system
reactor.
Figure 3.1 Advanced oxidation process experiments carried out to the degradation of TCS
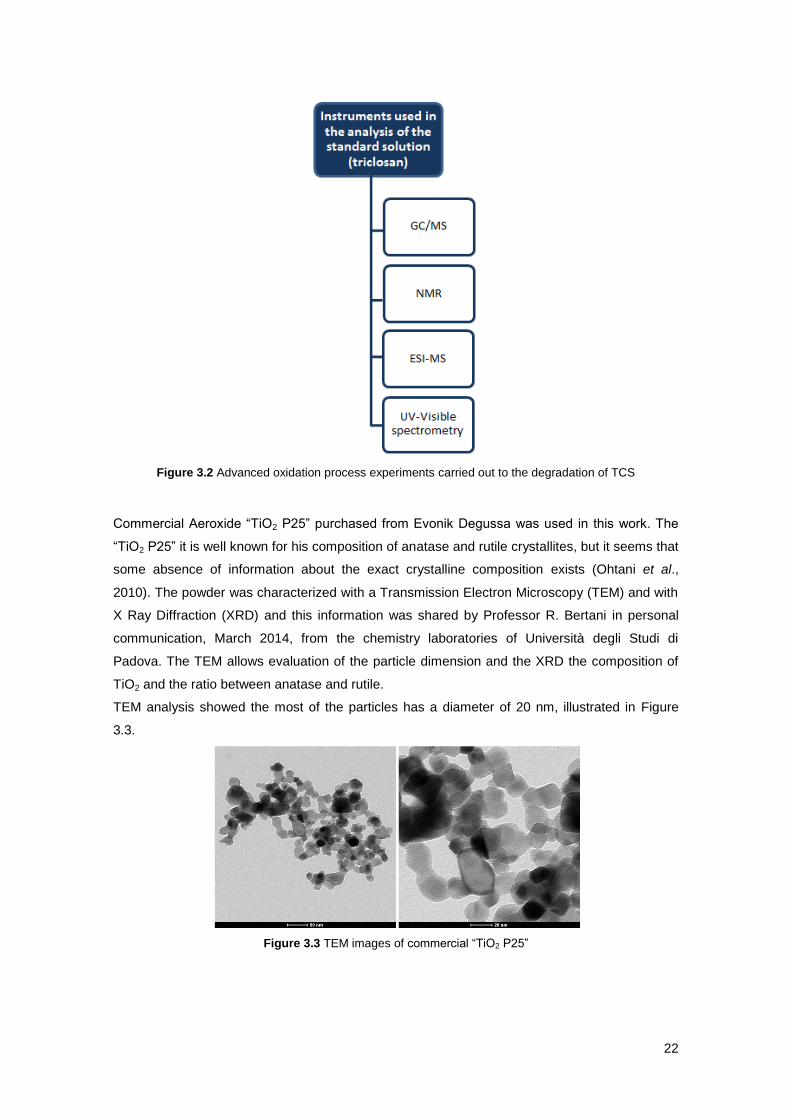
To fully understand the triclosan molecule and the standard solution, GC/MS, NMR, ESI-MS
and UV-VIS spectrometry analysis were performed (Figure 3.2).
22
Figure 3.2 Advanced oxidation process experiments carried out to the degradation of TCS
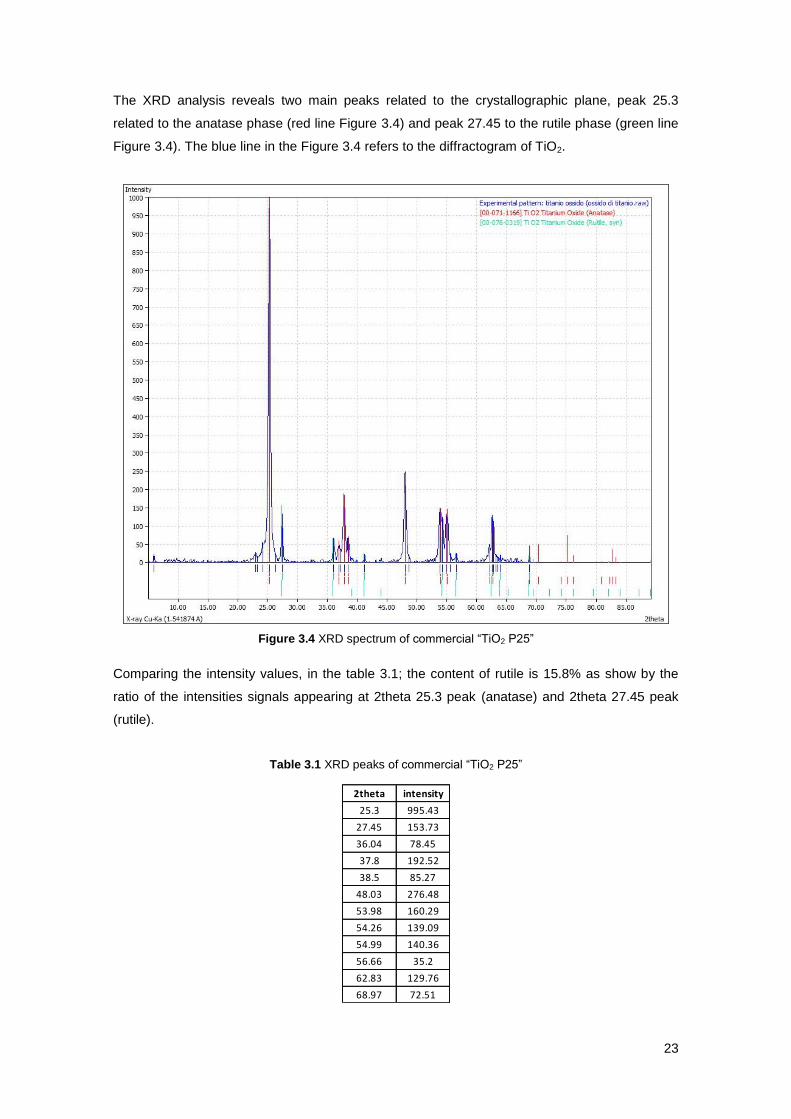
Commercial Aeroxide “TiO2 P25” purchased from Evonik Degussa was used in this work. The
“TiO2 P25” it is well known for his composition of anatase and rutile crystallites, but it seems that
some absence of information about the exact crystalline composition exists (Ohtani et al.,
2010). The powder was characterized with a Transmission Electron Microscopy (TEM) and with
X Ray Diffraction (XRD) and this information was shared by Professor R. Bertani in personal
communication, March 2014, from the chemistry laboratories of Università degli Studi di
Padova. The TEM allows evaluation of the particle dimension and the XRD the composition of
TiO2 and the ratio between anatase and rutile.
TEM analysis showed the most of the particles has a diameter of 20 nm, illustrated in Figure
3.3.
Figure 3.3 TEM images of commercial “TiO2 P25”
23
The XRD analysis reveals two main peaks related to the crystallographic plane, peak 25.3
related to the anatase phase (red line Figure 3.4) and peak 27.45 to the rutile phase (green line
Figure 3.4). The blue line in the Figure 3.4 refers to the diffractogram of TiO2.
Figure 3.4 XRD spectrum of commercial “TiO2 P25”
Comparing the intensity values, in the table 3.1; the content of rutile is 15.8% as show by the
ratio of the intensities signals appearing at 2theta 25.3 peak (anatase) and 2theta 27.45 peak
(rutile).
Table 3.1 XRD peaks of commercial “TiO2 P25”
2theta intensity
25.3 995.43
27.45 153.73
36.04 78.45
37.8 192.52
38.5 85.27
48.03 276.48
53.98 160.29
54.26 139.09
54.99 140.36
56.66 35.2
62.83 129.76
68.97 72.51
24
According to the information in the label product the specific surface area is 50 ± 15 m2/g, the
percentage in weight of TiO2 is 99.5% and the typical crystalline composition was 70-78%
anatase, 10-15% rutile and 7-20% amorphous phase.
In all the experiments the maximal amount of solubility of TCS in water was chosen given the
difficulties of determination in the GC/MS analysis. The maximum solubility of TCS in distilled
water is 0,01 g/l at 20ºC (SCCS, 2010; Yu et al., 2006).
The amount of TiO2 was chosen based on literature, Rafqah et al., 2006, compared different
concentrations of commercial “TiO2 P25” (0.2, 0.5, 1, and 2.5 g/l) concluded that the most
efficient concentration was 1 g/l. Since the concentration of 0,5 g/l in this study yielded
approximated values of efficiency has the concentration 1 g/l, the concentration of 0,5 g/l of
TiO2 was used. The standard solution was prepared by dissolving triclosan in deionized
laboratory water.
3.1.1 Rhodamine B as operational control Photocatalytic degradation of Rhodamine B To verify the efficiency of the photocatalytic system constructed a first experiment was done
with Rhodamine B. This experiment was common to students who were using the same system
created for photocatalysis but were studying other proposed selections.
The degradation of the Rhodamine B by photocatalysis using commercial “TiO2 P25” from
Degussa was proven by Aliabadi & Sagharigar, (2011), the Rhodamine B changed color in
function of the UV exposition time due of it destruction. Therefore the same was tried to confirm
if the system worked. The Rhodamine B aqueous solution was placed in the beaker with 100
mg of TiO2 and placed in the reactor (a) in Figure 3.5). A continuous mixing was ensure by the
magnetic stirred. The experiment had a duration of 2 hours (b) in Figure 3.5) and samples of 1
ml were collected every 5 min.
25
Figure 3.5 Picture of the photocatalytic degradation of Rhodamine B, a) in the beginning with UV lights of,
b) in the end of the experiment
Two blanks experiments were effectuated in the same conditions although blank 1 was
performed on an dark room and blank 2 was performed in the absence of TiO2. The blank
experiments were run during 2 hours and every 30 minutes 1 ml of solution was collected.
The conditions that have been respected for the elaboration of the assay were:
Volume of solution: 100 ml
Concentration of Rhodamine B: 48 g/l
Concentration of TiO2: 1 g/l
Time of experiment: 2 hours
3.1.2 Photocatalysis by UV light The photocatalytic degradation under UV light was performed in a glass structure, covert with a
quartz plaque. A beaker, containing the suspension was placed inside the glass structure
(Figure 3.6). Two parallel lamps at a distance of 5,5 cm from each other and at 23,5 cm to the
surface of the suspension were placed on the top of the quartz plaque (a) and b) in Figure 3.7).
The lamps used were from Philips model PL –S 9W /01 /2P 1CT with maximum wavelength at
310 nm corresponding to 90 µW/mm2 (c) in Figure 3.7). Technical manufacture features are
presented in the Figure 3.8. The quartz plaque permits the transmission of UV light inside the
glass structure.
26
Figure 3.6 Picture in detail of the glass structure, beaker and quartz plaque used in the reactor
Figure 3.7 Pictures of the reactor under the photocatalysis by UV experiment and detail of the UV lamps,
a) experimental setup with UV lights on, b) experimental set up with UV lights of, c) UV lamps
Figure 3.8 Emission spectra of the UV lamps used and technical features according to the manufacture
27
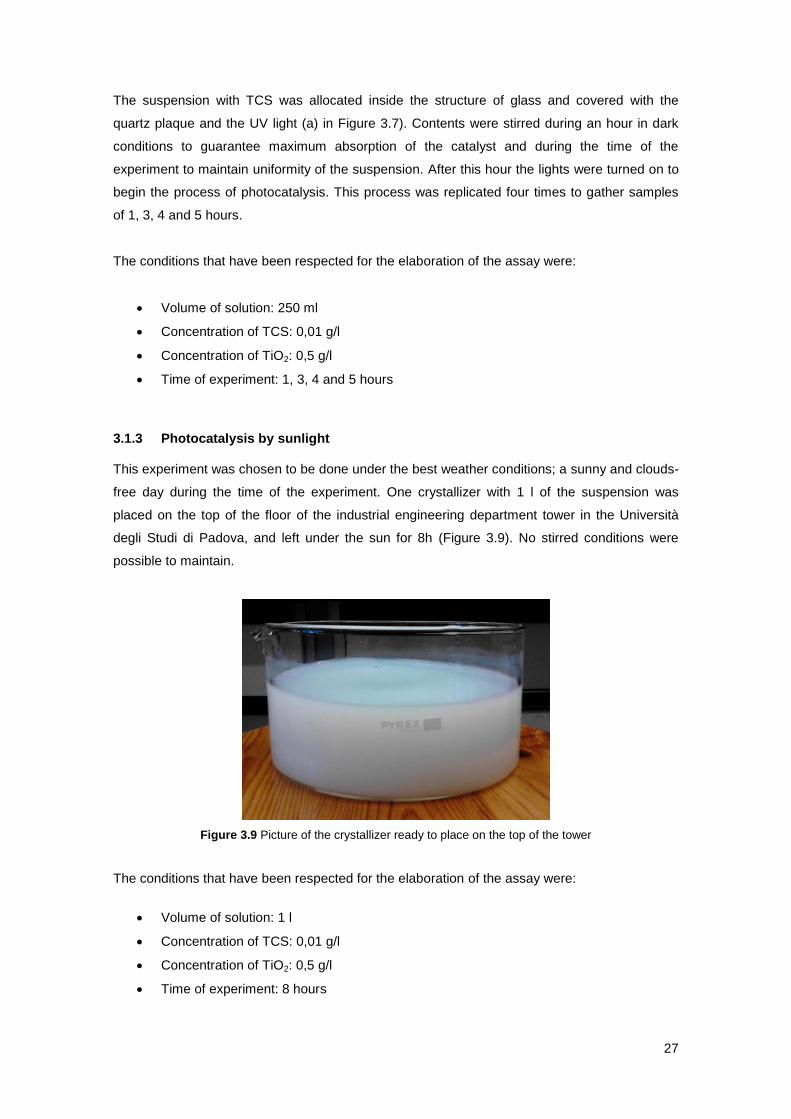
The suspension with TCS was allocated inside the structure of glass and covered with the
quartz plaque and the UV light (a) in Figure 3.7). Contents were stirred during an hour in dark
conditions to guarantee maximum absorption of the catalyst and during the time of the
experiment to maintain uniformity of the suspension. After this hour the lights were turned on to
begin the process of photocatalysis. This process was replicated four times to gather samples
of 1, 3, 4 and 5 hours.
The conditions that have been respected for the elaboration of the assay were:
Volume of solution: 250 ml
Concentration of TCS: 0,01 g/l
Concentration of TiO2: 0,5 g/l
Time of experiment: 1, 3, 4 and 5 hours
3.1.3 Photocatalysis by sunlight This experiment was chosen to be done under the best weather conditions; a sunny and clouds-
free day during the time of the experiment. One crystallizer with 1 l of the suspension was
placed on the top of the floor of the industrial engineering department tower in the Università
degli Studi di Padova, and left under the sun for 8h (Figure 3.9). No stirred conditions were
possible to maintain.
Figure 3.9 Picture of the crystallizer ready to place on the top of the tower
The conditions that have been respected for the elaboration of the assay were:
Volume of solution: 1 l
Concentration of TCS: 0,01 g/l
Concentration of TiO2: 0,5 g/l
Time of experiment: 8 hours
28
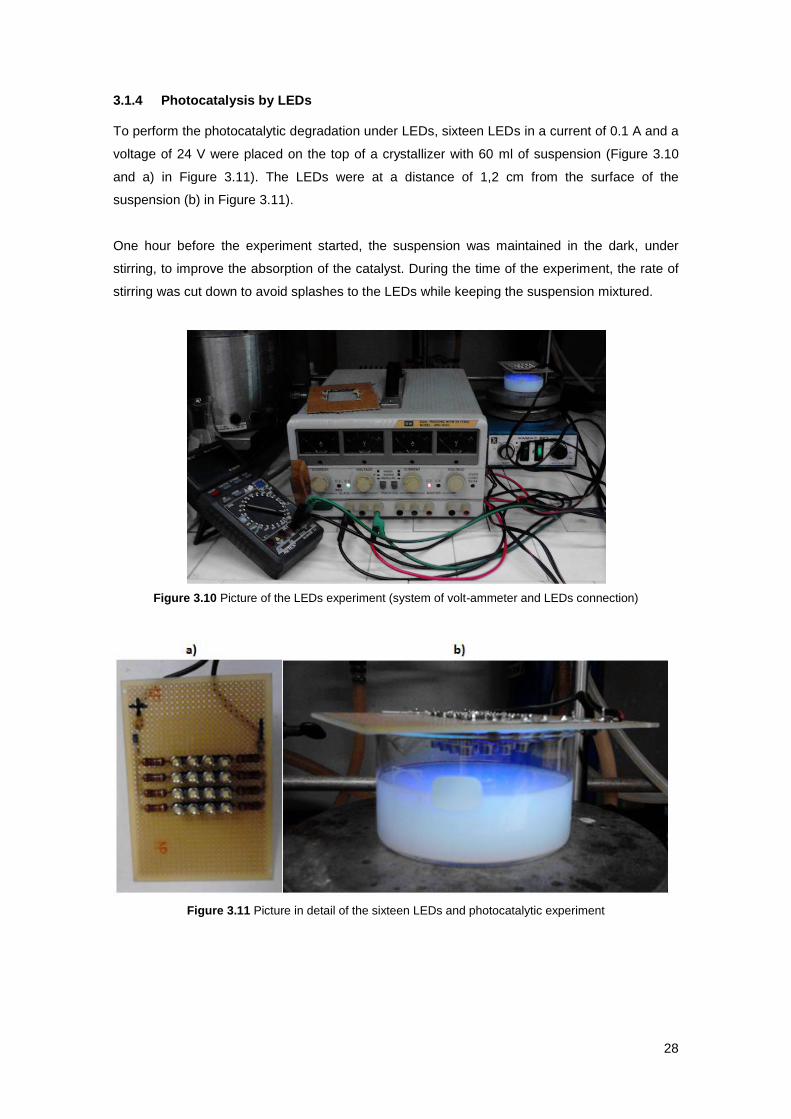
3.1.4 Photocatalysis by LEDs To perform the photocatalytic degradation under LEDs, sixteen LEDs in a current of 0.1 A and a
voltage of 24 V were placed on the top of a crystallizer with 60 ml of suspension (Figure 3.10
and a) in Figure 3.11). The LEDs were at a distance of 1,2 cm from the surface of the
suspension (b) in Figure 3.11).
One hour before the experiment started, the suspension was maintained in the dark, under
stirring, to improve the absorption of the catalyst. During the time of the experiment, the rate of
stirring was cut down to avoid splashes to the LEDs while keeping the suspension mixtured.
Figure 3.10 Picture of the LEDs experiment (system of volt-ammeter and LEDs connection)
Figure 3.11 Picture in detail of the sixteen LEDs and photocatalytic experiment
29
The conditions that have been respected for the elaboration of the assay were:
Volume of solution: 60 ml
Concentration of TCS: 0,01 g/l
Concentration of TiO2: 0,5 g/l
Time of experiment: 8 hours
3.1.5 Photo-Fenton reaction A beaker was ready with a solution of TCS and FeSO4.7H2O. The pH was measured by a
universal pH indicator stripes and is dropped until around 3 by adding H2SO4 96%. H2O2 30% is
added to the suspension and UV lights are turn on for 2 hours of experiment.
The conditions that have been respected for the elaboration of the assay were:
Volume of solution: 250 ml
Concentration of TCS: 0,01 g/l
FeSO4.7H2O: 77,7 mg
H2O2 (30%): 1 ml
Time of experiment: 2 hours
3.1.6 Fenton Reaction - Degradation under addition of H2O2 at once
The FeSO4.7H2O was weighed and placed in a balloon and 250 ml of volume suspension was
added to the balloon (Figure 3.12). The Fenton-reaction was initiated. A magnetic stirrer device
was turned on to ensure complete mixing of the reagents during the time of the experiments.
The pH was measured by a universal pH indicator stripe and the pH was decreased about 3 by
adding H2SO4 96%, respecting the optimal pH for the Fenton reaction found in the literature
(between 2-4) (Júnior et al.,2012; Bauer & Fallmann, 1997). The addition of H2O2 at 30%
ensued. The reaction stopped when the extraction with n-hexane began. The Fenton reaction
was replicated to gather samples for 2 and 4 hours.
30
Figure 3.12 Picture of the development of the Fenton reaction experiment
The conditions that have been respected for the elaboration of the assay were:
Volume of solution: 250 ml
Concentration of TCS: 0,01 g/l
FeSO4.7H2O: 77,7 mg
H2O2 (30%): 1 ml
Time of experiment: 2 and 4 hours
- Degradation under addition of H2O2 in 3 instants of time
The FeSO4.7H2O was weigh and placed in a balloon, 250 ml of volume suspension was added
to the balloon. The magnetic stirrer device ensured complete mixing of the reagents during the
experiments time (2 and 4 hours). The pH was measured by a universal pH indicator stripe and
is dropped until around 3 by adding H2SO4 96% and the addition of H2O2 30% was made in 3
separate times during the duration of the experiment. For instance in the 2h experiment, the
addition of H2O2 was made at 20 min (0,35 ml), 60 min (0,35 ml) and at 100 min (0,30 ml).
The concentration of FeSO4.7H2O and H2O2 are based on the concentrations adopted in the
studies of I. Casalatina (I. Casalatina, personal communication, May 2014) in the Laboratory of
the Università degli Studi di Padova and it was respected in the photo-Fenton and Fenton
reaction to maintain uniformity in the experiments.
31
The conditions that have been respected for the elaboration of the assay were:
Volume of solution: 250 ml
Concentration of TCS: 0,01 g/l
FeSO4.7H2O: 77,7 mg
H2O2 (30%): 1 ml (0,35 ml + 0,35 ml + 0,30 ml)
Time of experiment: 2 and 4 hours
3.2 Determination of phenols and TCS by GC/MS
On the analytical determination of phenols, specifically triclosan, one obstacle was encountered
in the collection of the results:
Derivatization: the OH group can be attached to the internal solid phase of the GC/MS;
the strong iteration can interdict the OH group to leave the column and consequently
not show in the mass spectra. To avoid this problem, derivatization is necessary.
Several methods of treatment of analysis based in the literature were tested in this work but did
not succeed, like: chloroform extraction by Yu et al., 2006; n-hexane extraction and addition of
NaCl to facilitate the extraction and passage of the organic phase in Na2SO4 by Gómez et al.,
2009; n-hexane extraction and derivatization with N-Methyl-N Trifluoroacetamida (MSTFA) by
Catrinescu et al., 2012. The analytical method founded that suit better are described hereafter.
- Derivatization with acetic anhydride acid
The best method found for identification of triclosan and respective byproducts was in
Czaplicka, (2001). In all experiments all the volume was treated to analysis in the GC/MS.
Firstly, in the end of the experiments and after measurement of the pH, the volume of solution
was filtered with a filtering round paper (pore size 4 - 7 μm) (Whatman filter n° 597) to remove
TiO2. This step was not taken in experiments without TiO2. The pH was measured in each
experiment by a universal pH indicator stripes of Macherey – Nagel, reference 921 10, pH from
0 to 14.
32
This method encloses extraction, derivatization and quantitative/qualitative determination using
GC/MS.
Extraction
Three extractions of the solution with n-hexane were performed. The n-hexane quantity was
chosen respecting a ratio of 2:1 (volume of solution / volume n-hexane) divided by the three
extractions. The remaining aqueous solution was discarded, while combined n-hexane extracts
were concentrated in a nitrogen stream until a volume of 2 ml was reached.
Derivatization
To the n-hexane extract sample after nitrogen concentration, 3 ml of 0.1 M K2CO3 were added,
followed by 2 ml of n-hexane containing 100 µl of acetic anhydride. Triclosan molecule contains
a phenolic hydroxyl group. The hydroxyl group was functionalized with acetic anhydride acid.
The solution was mixed intensively and then was left to settle until the layers were separated.
After 30 minutes the layer of water was discarded. The n-hexane layer was dried and
concentrated in a stream of nitrogen to 200 µl and then analyzed.
Quantitative and qualitative determination on GC/MS
To perform the quantitative analysis, 1µl of benzonitrile (the internal standard) was added in all
samples, having a retention time of about 4 minutes, ensuring that the peak did not coelute. The
integration of the area of the peaks and a comparison with the area of the internal standard
allowed a quantitative analysis. The retention time and the respective mass spectra of the
peaks allowed a qualitative analysis.
3.3 Instruments
3.3.1 GC/MS: Gas chromatography/mass spectrometer
Gas chromatography is based upon the partition of the analyte between a gaseous mobile
phase and a liquid phase immobilized on the surface of an inert solid by adsorption or chemical
bonding. Mass spectrometer measures the mass to charge ratio (m/z) of ions produced from the
sample. The GC/MS is a hyphenated technique; it is an analytical method in which two
instrumental techniques are coupled combining the separation capabilities of chromatography
with the capacity detection of electrical or spectral methods (Skoog et al., 2004).
33
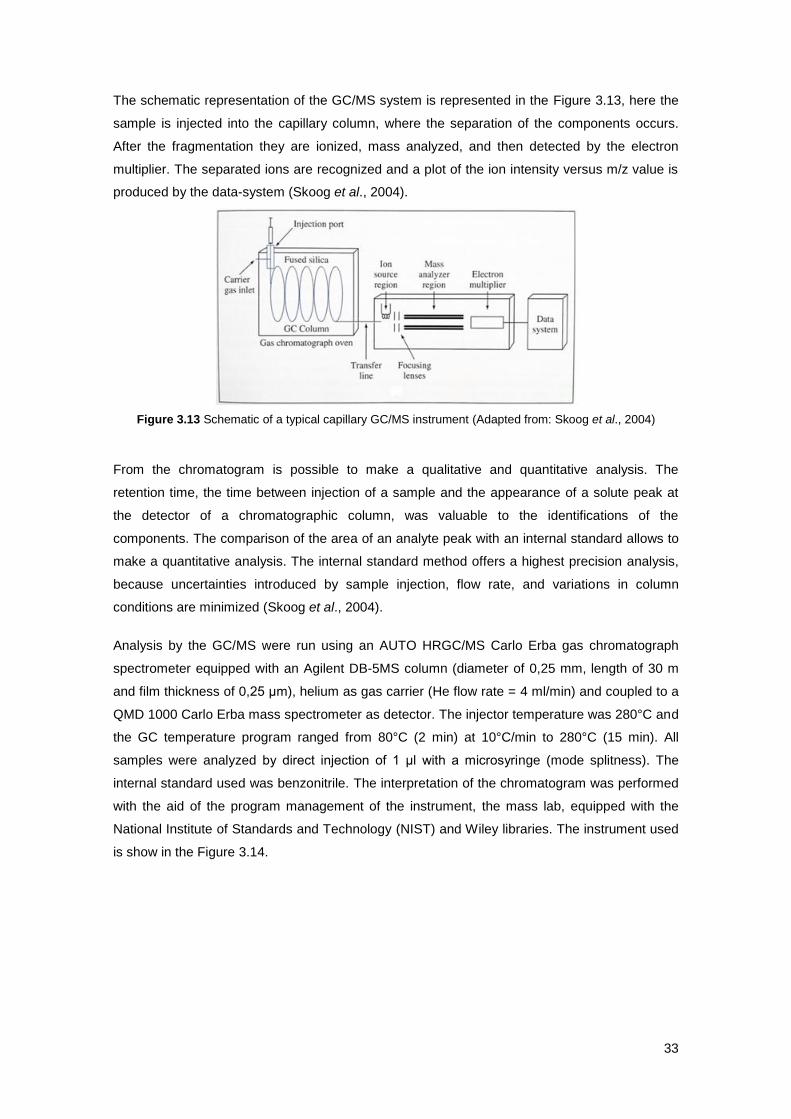
The schematic representation of the GC/MS system is represented in the Figure 3.13, here the
sample is injected into the capillary column, where the separation of the components occurs.
After the fragmentation they are ionized, mass analyzed, and then detected by the electron
multiplier. The separated ions are recognized and a plot of the ion intensity versus m/z value is
produced by the data-system (Skoog et al., 2004).
Figure 3.13 Schematic of a typical capillary GC/MS instrument (Adapted from: Skoog et al., 2004)
From the chromatogram is possible to make a qualitative and quantitative analysis. The
retention time, the time between injection of a sample and the appearance of a solute peak at
the detector of a chromatographic column, was valuable to the identifications of the
components. The comparison of the area of an analyte peak with an internal standard allows to
make a quantitative analysis. The internal standard method offers a highest precision analysis,
because uncertainties introduced by sample injection, flow rate, and variations in column
conditions are minimized (Skoog et al., 2004).
Analysis by the GC/MS were run using an AUTO HRGC/MS Carlo Erba gas chromatograph
spectrometer equipped with an Agilent DB-5MS column (diameter of 0,25 mm, length of 30 m
and film thickness of 0,25 μm), helium as gas carrier (He flow rate = 4 ml/min) and coupled to a
QMD 1000 Carlo Erba mass spectrometer as detector. The injector temperature was 280°C and
the GC temperature program ranged from 80°C (2 min) at 10°C/min to 280°C (15 min). All
samples were analyzed by direct injection of 1 μl with a microsyringe (mode splitness). The
internal standard used was benzonitrile. The interpretation of the chromatogram was performed
with the aid of the program management of the instrument, the mass lab, equipped with the
National Institute of Standards and Technology (NIST) and Wiley libraries. The instrument used
is show in the Figure 3.14.
34
Figure 3.14 Carlo Erba GC/MS
3.3.2 ESI–MS: Electrospray ionization mass spectrometry
ESI uses electrical energy to assist the transfer of ions from solution into the gaseous phase
before they are subjected to mass spectrum analysis (Ho et al., 2003).
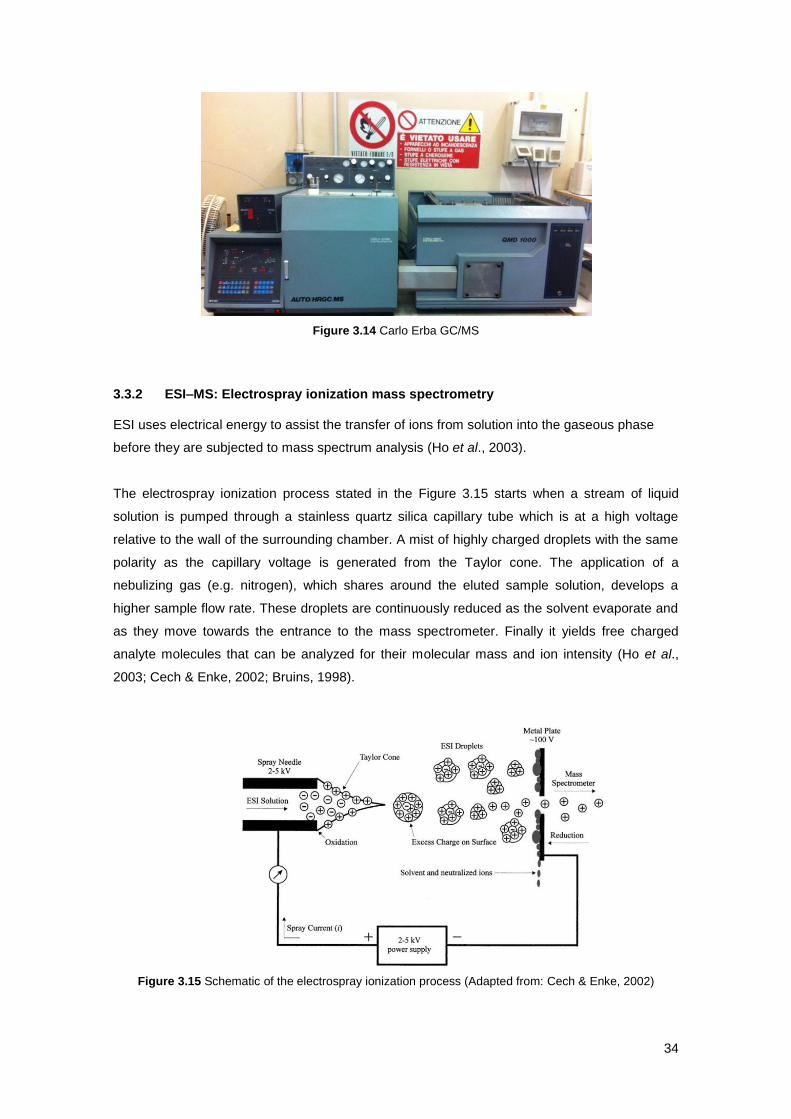
The electrospray ionization process stated in the Figure 3.15 starts when a stream of liquid
solution is pumped through a stainless quartz silica capillary tube which is at a high voltage
relative to the wall of the surrounding chamber. A mist of highly charged droplets with the same
polarity as the capillary voltage is generated from the Taylor cone. The application of a
nebulizing gas (e.g. nitrogen), which shares around the eluted sample solution, develops a
higher sample flow rate. These droplets are continuously reduced as the solvent evaporate and
as they move towards the entrance to the mass spectrometer. Finally it yields free charged
analyte molecules that can be analyzed for their molecular mass and ion intensity (Ho et al.,
2003; Cech & Enke, 2002; Bruins, 1998).
Figure 3.15 Schematic of the electrospray ionization process (Adapted from: Cech & Enke, 2002)
35
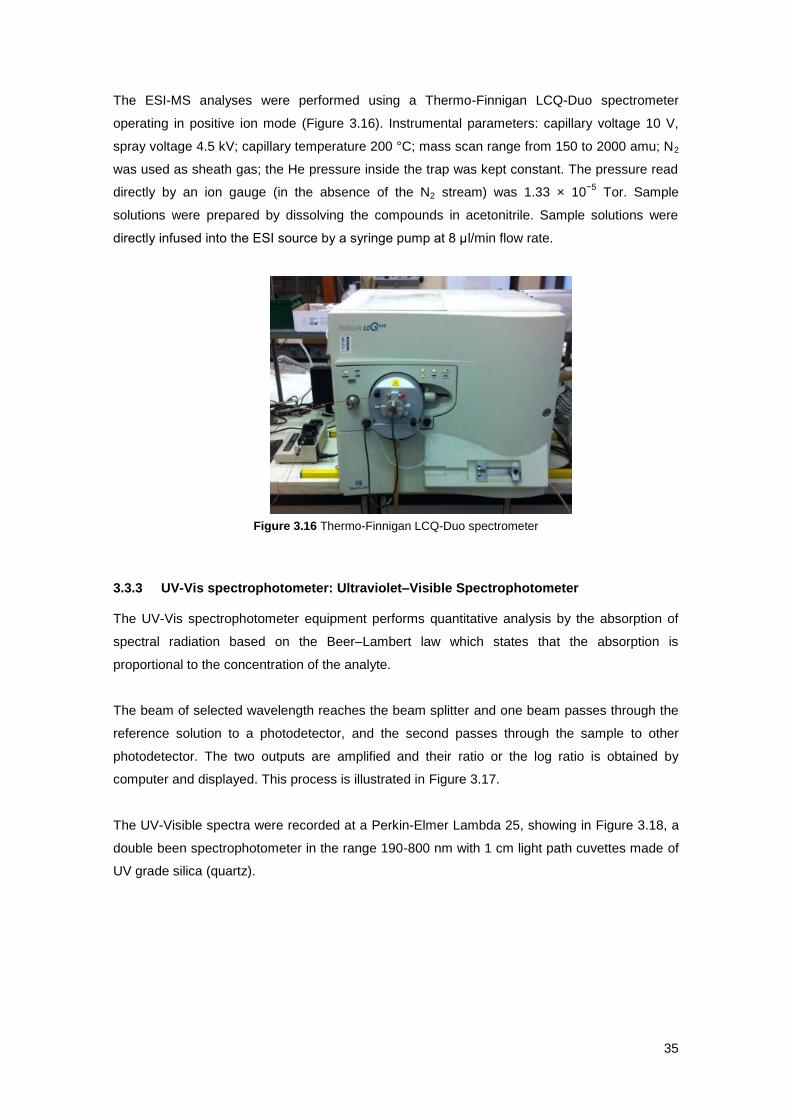
The ESI-MS analyses were performed using a Thermo-Finnigan LCQ-Duo spectrometer
operating in positive ion mode (Figure 3.16). Instrumental parameters: capillary voltage 10 V,
spray voltage 4.5 kV; capillary temperature 200 °C; mass scan range from 150 to 2000 amu; N2
was used as sheath gas; the He pressure inside the trap was kept constant. The pressure read
directly by an ion gauge (in the absence of the N2 stream) was 1.33 × 10⁻⁵
Tor. Sample
solutions were prepared by dissolving the compounds in acetonitrile. Sample solutions were
directly infused into the ESI source by a syringe pump at 8 μl/min flow rate.
The UV-Vis spectrophotometer equipment performs quantitative analysis by the absorption of
spectral radiation based on the Beer–Lambert law which states that the absorption is
proportional to the concentration of the analyte.
The beam of selected wavelength reaches the beam splitter and one beam passes through the
reference solution to a photodetector, and the second passes through the sample to other
photodetector. The two outputs are amplified and their ratio or the log ratio is obtained by
computer and displayed. This process is illustrated in Figure 3.17.
The UV-Visible spectra were recorded at a Perkin-Elmer Lambda 25, showing in Figure 3.18, a
double been spectrophotometer in the range 190-800 nm with 1 cm light path cuvettes made of
UV grade silica (quartz).
36
Figure 3.17 Optical Path in UV-Vis spectrophotometer (Adapted from: Skoog et al., 2004)
Figure 3.18 Perkin-Elmer Lambda 25
3.3.4 1H NMR Spectrometry: Proton Nuclear Magnetic Spectrometry
Nuclear magnetic resonance (NMR) is another form of absorption spectrometry. All nuclei carry
a charge and a mass; some isomers possess spin or angular momentum. Spinning charge on
proton generates magnetic field, where there is associated an magnetic moment (Silverstein et
al., 2005).
The magnetic moment of the spinning charge can be described in terms of its quantum spin
number. The spin number determines the number of orientations a nucleus can assume in an
external nuclear field. For a nucleus with spin ½, two levels of energy are possible. In the
absence of magnetic field the state of energy returns to the ground state (Silverstein et al.,
2005; Bovey et al., 1988).
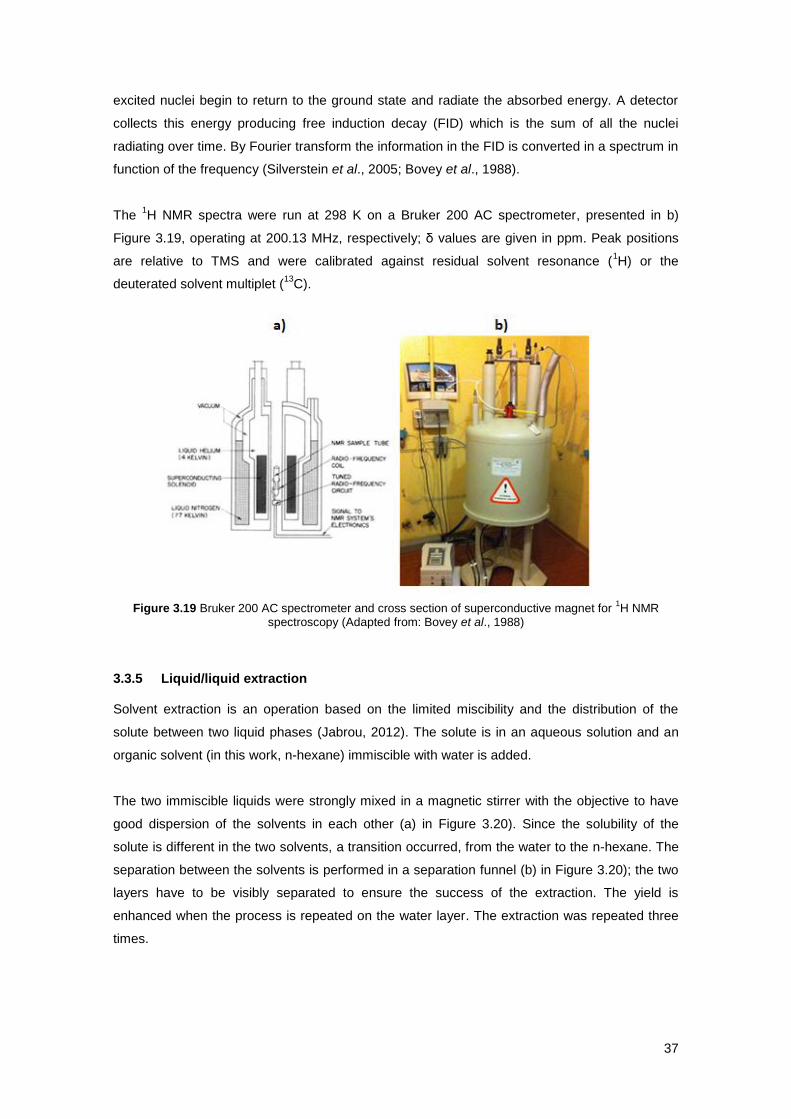
In the schematic presented in a) Figure 3.19, the sample tube is placed in the field of a strong
magnet (the superconducting solenoid), then radio frequency transmitter applies a radio
frequency sufficiently wide to cover the entire range of magnetic field strength. This pulse
simultaneously excites all of the nuclei in the sample. Immediately following this pulse, the
37
excited nuclei begin to return to the ground state and radiate the absorbed energy. A detector
collects this energy producing free induction decay (FID) which is the sum of all the nuclei
radiating over time. By Fourier transform the information in the FID is converted in a spectrum in
function of the frequency (Silverstein et al., 2005; Bovey et al., 1988).
The 1H NMR spectra were run at 298 K on a Bruker 200 AC spectrometer, presented in b)
Figure 3.19, operating at 200.13 MHz, respectively; δ values are given in ppm. Peak positions
are relative to TMS and were calibrated against residual solvent resonance (1H) or the
deuterated solvent multiplet (13
C).
Figure 3.19 Bruker 200 AC spectrometer and cross section of superconductive magnet for 1H NMR
spectroscopy (Adapted from: Bovey et al., 1988)
3.3.5 Liquid/liquid extraction Solvent extraction is an operation based on the limited miscibility and the distribution of the
solute between two liquid phases (Jabrou, 2012). The solute is in an aqueous solution and an
organic solvent (in this work, n-hexane) immiscible with water is added.
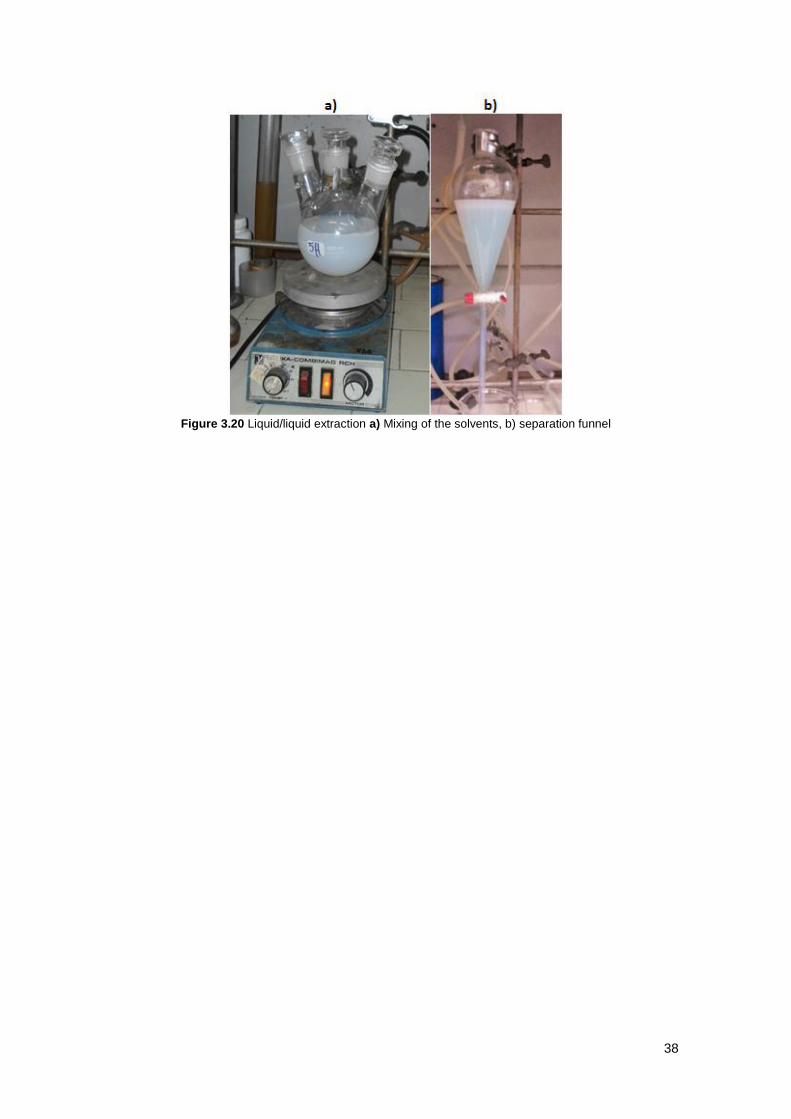
The two immiscible liquids were strongly mixed in a magnetic stirrer with the objective to have
good dispersion of the solvents in each other (a) in Figure 3.20). Since the solubility of the
solute is different in the two solvents, a transition occurred, from the water to the n-hexane. The
separation between the solvents is performed in a separation funnel (b) in Figure 3.20); the two
layers have to be visibly separated to ensure the success of the extraction. The yield is
enhanced when the process is repeated on the water layer. The extraction was repeated three
times.
38
Figure 3.20 Liquid/liquid extraction a) Mixing of the solvents, b) separation funnel
39
4 Results and discussion
4.1 Characterization of the TCS standard solution by analytical
instruments
To fully understand the triclosan molecule and the standard solution, GC/MS, 1H NMR, ESI-MS
and UV-Vis spectrometry analysis were performed. The standard solution consisted in water
and triclosan in a concentration of 0,01 g/l (maximum solubility of TCS in water at 20°C).
GC/MS
The GC/MS analysis of TCS (Figure 4.1), shows two major peaks at the retention time 20.396
and 21.046 min in the abundance of 100% and 50%. Other two peaks of lower strength appear
in the retention times 18.812 and 19.863 min with 8% and 11%. All these peaks reveal very
similar mass spectra, the mass spectra of the most abundant species are presented in Figure
4.2 and 4.3. The less abundance peaks mass spectra are in the Figure I.1 and I.2, in the
Appendix I. As an example, the presence of one chloride is visible in the TCS (C12H7Cl3O2),
mass spectrum characterized by the base peaks ions m/z 288 and 290, corresponding to the
molecular ions [M]+ and [M + 2]
+, which represent a typical chlorine signature.
The ion peak m/z 218 and 220 reveal the presence of other chloride. Mezcua et al., 2004 made
a GC/MS analysis under electron impact ionization, the same performed in this work, the
resulting mass spectrum is illustrated in the Figure 4.4 and shows the stronger base peaks ions
at m/z 288, 290 and 218. The ions peaks of m/z 51, 63, 114 and 146 are always present in both
analysis, also characterizing the TCS compound.
Presence of the same molecular base peak ions in all the mass spectra, determined the
presence of isomers which constitute the commercial mixture.
Figure 4.1 Triclosan chromatogram
40
Figure 4.2 Peak at 20.396
Figure 4.3 Peak at 21.046
Figure 4.4 Triclosan chromatogram by Mezcua et al., 2004
1H NMR Spectroscopy
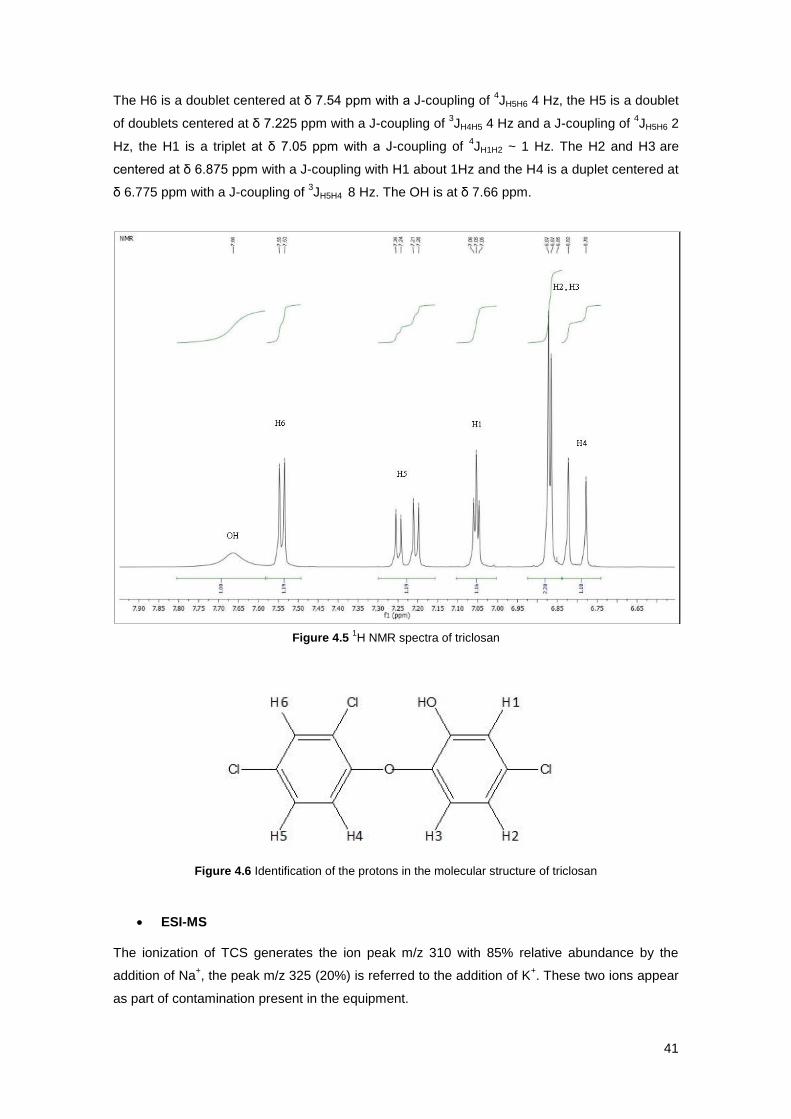
The analysis of the
1H NMR spectra of the TCS (Figure 4.5) reveals six protons plus one
referring to the OH group. Only the signals due to the most abundant isomer are visible in the
spectrum.
The six protons were identified and located in the molecular structure of triclosan reported in
Figure 4.6, as H1, H2, H3, H4, H5 and H6.
The J-coupling is the frequency difference in Hz between the component peaks. The J-coupling
is calculated by the following equation:
(eq. 4.1)
41
The H6 is a doublet centered at δ 7.54 ppm with a J-coupling of 4JH5H6 4 Hz, the H5 is a doublet
of doublets centered at δ 7.225 ppm with a J-coupling of 3JH4H5 4 Hz and a J-coupling of
4JH5H6 2
Hz, the H1 is a triplet at δ 7.05 ppm with a J-coupling of 4JH1H2 ~ 1 Hz. The H2 and H3 are
centered at δ 6.875 ppm with a J-coupling with H1 about 1Hz and the H4 is a duplet centered at
δ 6.775 ppm with a J-coupling of 3JH5H4 8 Hz. The OH is at δ 7.66 ppm.
Figure 4.5 1H NMR spectra of triclosan
Figure 4.6 Identification of the protons in the molecular structure of triclosan
ESI-MS
The ionization of TCS generates the ion peak m/z 310 with 85% relative abundance by the
addition of Na+, the peak m/z 325 (20%) is referred to the addition of K
+. These two ions appear
as part of contamination present in the equipment.
42
The ion peak m/z 287 characterized the radical TCS with the abundance of 45%. The loss of a
Cl (M–35) gives the peak m/z 255 (70% relative abundance) from here there is a loss of a CO
(M–28), respecting the ion peak of m/z 227 with 25% relative abundance. The ion peak m/z 191
is regarding the loss of a HCL (M–36) with the relative abundance of 25%. The tallest peak in
the chromatogram is the addition of a OH● in the ion base peak m/z 304 with the highest relative
abundance, 100%. The chromatogram is exposed in the Figure 4.7.
Figure 4.7 Chromatogram of TCS in positive ion mode
UV-Vis spectrophotometer
A solution with the concentration of TCS of 10-4
M was prepared for analysis in the UV–Visible
spectrophotometer. One peak appears in the range of 280 to 340 nm and the maximum peak is
established approximately between 300 and 310 nm. The UV-Visible spectrum of TCS is
showed in the Figure 4.8.
43
Figure 4.8 Emission spectra of TCS
4.2 TCS degradation and by-products by GC/MS
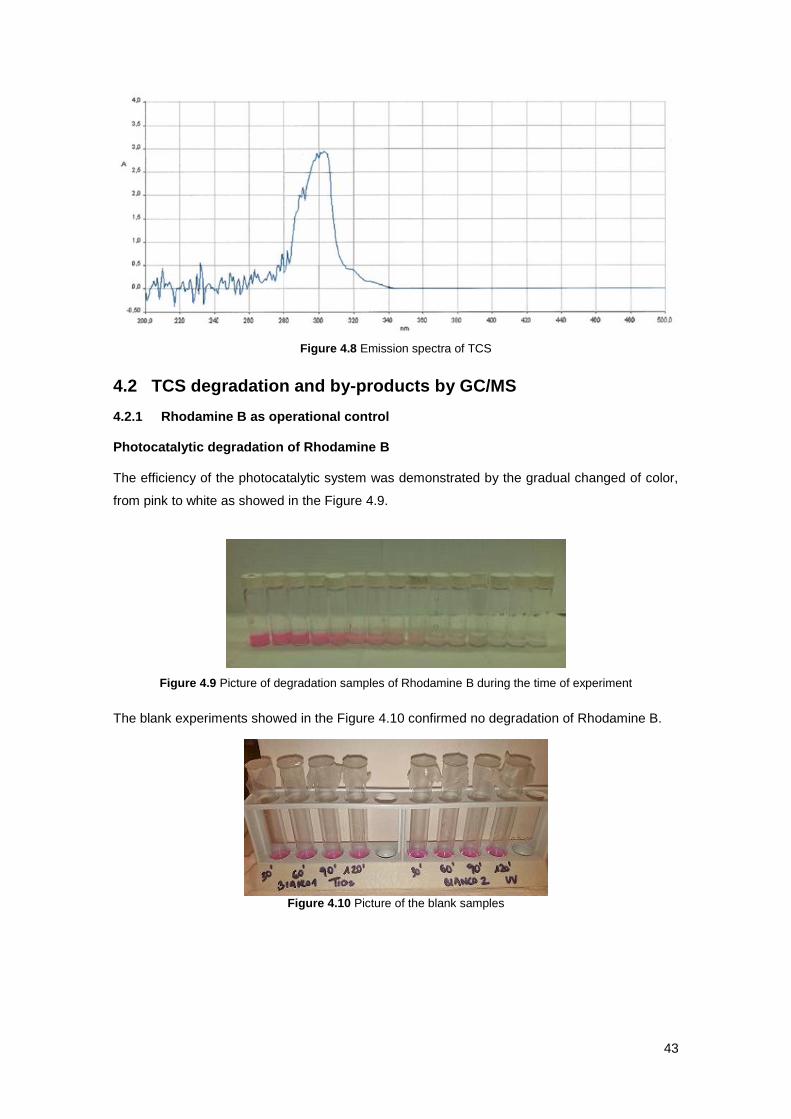
4.2.1 Rhodamine B as operational control Photocatalytic degradation of Rhodamine B The efficiency of the photocatalytic system was demonstrated by the gradual changed of color,
from pink to white as showed in the Figure 4.9.
Figure 4.9 Picture of degradation samples of Rhodamine B during the time of experiment
The blank experiments showed in the Figure 4.10 confirmed no degradation of Rhodamine B.
Figure 4.10 Picture of the blank samples
44
4.2.2 Photocatalysis by UV light
1 hour
The chromatograph resulting from the photocatalytic degradation with UV lamps reveals 5
peaks, two higher peaks in the retention time 20.361 and 20.995 with the abundance of 100%
and 70% (Figure 4.11). The other 3 peaks are at the retention time 10.477, 12.227 and 17.461
with the respective abundance of 12, 7 and 19%. In order to confirm if the small peaks that
appear between the retention time 9 and 19 min are significant, an amplification was performed.
This chromatograph is exposed in the Appendix II, Figure II.1. The degradation during this first
hour achieved 68% of removals of TCS, (Figure III.1, Appendix III).
Figure 4.11 Chromatogram of the UV lamps degradation of 1 hour experiment
→ Peak at the retention time 10.477:
The peak in the retention time 10.477 min has been identified has C8H6Cl2O2, this compound
was a result of 2,4–DCP and acetic anhydride reaction.
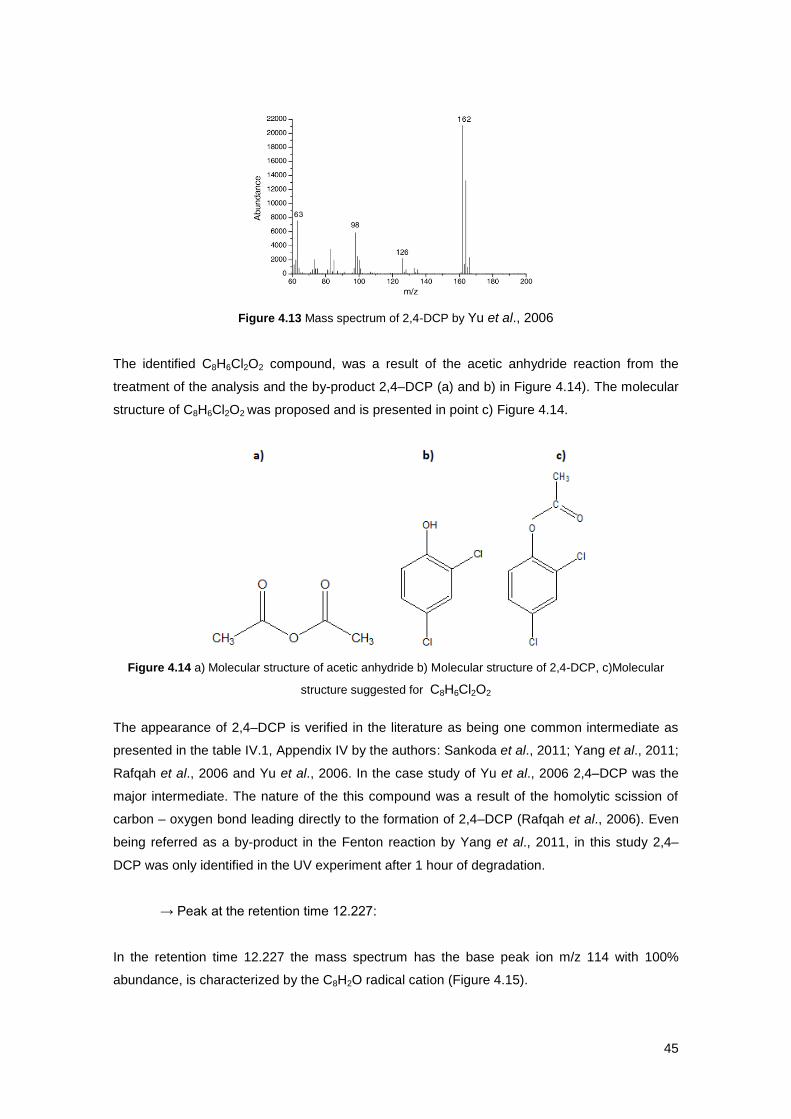
The base peak ions typical of 2,4–DCP are m/z 162 (100% abundance) and the 164 (about
60%) (Figure 4.12). A comparison with the mass spectrum of 2,4-DCP obtained by Yu et al.,
2006 confirms the 2,4-DCP presence (Figure 4.13). The ratio between the m/z 162, 164 and
166, the m/z 63, 98 and 126 are also visible in both mass spectra. The final compound
C8H6Cl2O2 is characterized by the base peaks ions 204 and 206.
Figure 4.12 Peak 10.477: C8H6Cl2O2
45
Figure 4.13 Mass spectrum of 2,4-DCP by Yu et al., 2006
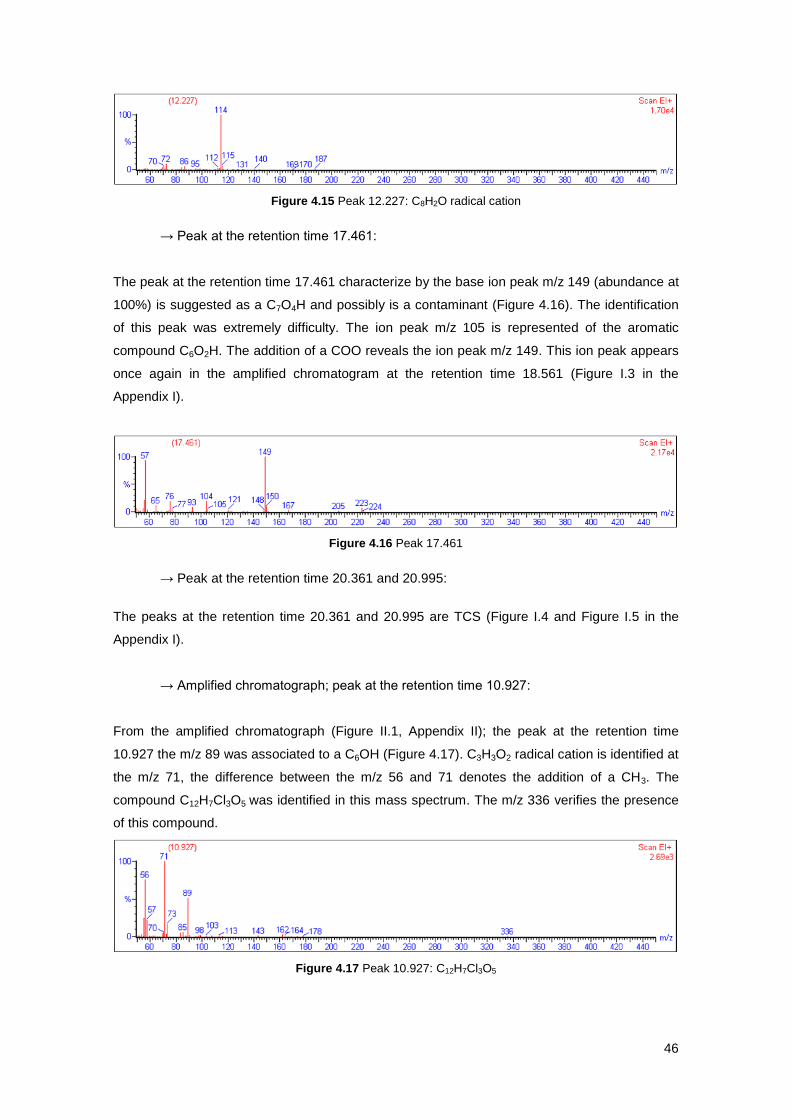
The identified C8H6Cl2O2 compound, was a result of the acetic anhydride reaction from the
treatment of the analysis and the by-product 2,4–DCP (a) and b) in Figure 4.14). The molecular
structure of C8H6Cl2O2 was proposed and is presented in point c) Figure 4.14.
Figure 4.14 a) Molecular structure of acetic anhydride b) Molecular structure of 2,4-DCP, c)Molecular
structure suggested for C8H6Cl2O2
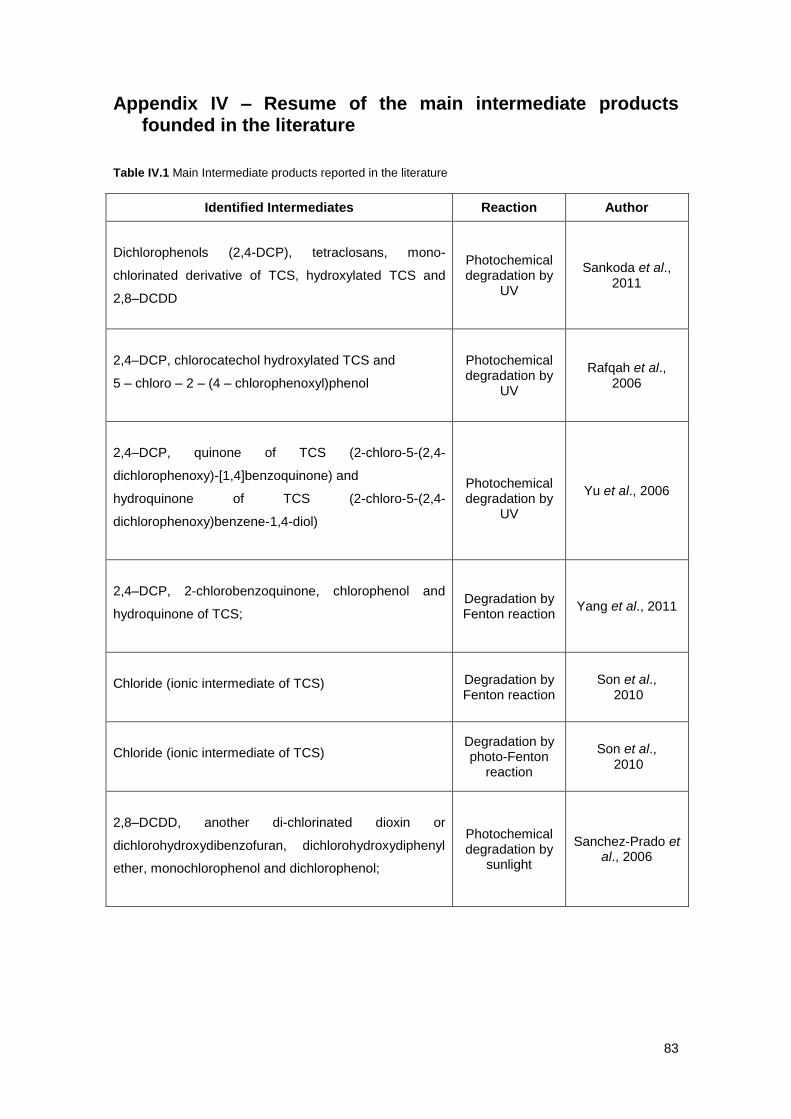
The appearance of 2,4–DCP is verified in the literature as being one common intermediate as
presented in the table IV.1, Appendix IV by the authors: Sankoda et al., 2011; Yang et al., 2011;
Rafqah et al., 2006 and Yu et al., 2006. In the case study of Yu et al., 2006 2,4–DCP was the
major intermediate. The nature of the this compound was a result of the homolytic scission of
carbon – oxygen bond leading directly to the formation of 2,4–DCP (Rafqah et al., 2006). Even
being referred as a by-product in the Fenton reaction by Yang et al., 2011, in this study 2,4–
DCP was only identified in the UV experiment after 1 hour of degradation.
→ Peak at the retention time 12.227:
In the retention time 12.227 the mass spectrum has the base peak ion m/z 114 with 100%
abundance, is characterized by the C8H2O radical cation (Figure 4.15).
46
Figure 4.15 Peak 12.227: C8H2O radical cation
→ Peak at the retention time 17.461:
The peak at the retention time 17.461 characterize by the base ion peak m/z 149 (abundance at
100%) is suggested as a C7O4H and possibly is a contaminant (Figure 4.16). The identification
of this peak was extremely difficulty. The ion peak m/z 105 is represented of the aromatic
compound C6O2H. The addition of a COO reveals the ion peak m/z 149. This ion peak appears
once again in the amplified chromatogram at the retention time 18.561 (Figure I.3 in the
Appendix I).
Figure 4.16 Peak 17.461
→ Peak at the retention time 20.361 and 20.995:
The peaks at the retention time 20.361 and 20.995 are TCS (Figure I.4 and Figure I.5 in the
Appendix I).
→ Amplified chromatograph; peak at the retention time 10.927:
From the amplified chromatograph (Figure II.1, Appendix II); the peak at the retention time
10.927 the m/z 89 was associated to a C6OH (Figure 4.17). C3H3O2 radical cation is identified at
the m/z 71, the difference between the m/z 56 and 71 denotes the addition of a CH3. The
compound C12H7Cl3O5 was identified in this mass spectrum. The m/z 336 verifies the presence
of this compound.
Figure 4.17 Peak 10.927: C12H7Cl3O5
47
Based in the article of Rafqah et al., 2006 this compound probably is the result of successive
oxidations. The proposal structure (a) in Figure 4.18) and the molecular base peak ion (m/z
336) belong to the type of product identified in the article of Rafqah et al., 2006 (b) in Figure
4.18). These species are hydroquinone’s and are formed due to the very few protons found in
the presence of a lot of fragments.
Figure 4.18 Hydroquinine`s species, a) Proposal structure b) Proposal structure by Rafqah et al., 2006
Other two peaks present the amplified chromatogram; at retention time 12.177 and 14.011 min.
→ Amplified chromatograph; peak at the retention time 12.177:
By the retention time 12.177 the ion base peak m/z 57 (100% abundance) denotes the
presence of a C2HO2 (Figure 4.19).
Figure 4.19 Peak 12.177: C2HO2
→ Amplified chromatograph; peak at the retention time 14.011:
The ion peak m/z 71 at the peak in the retention time 14.011 correspond to C3H3O2 radical
cation. Here the difference between the m/z 56 and 71 represents a CH3 (Figure 4.20).
Figure 4.20 Peak 14.011: C3H3O2 radical cation
48
3 hours After 3 hours of degradation, four peaks appear at the retention times 14.011, 17.461, 20.345
and 20.995 with respective abundance of 11, 62, 100 and 91% (Figure 4.21). The major
abundance peaks (retention time 20.345 and 20.995) match TCS peaks as portrayed in the
Figure I.8 and I.9 from the Appendix I.
In the peak in the retention time 14.011 the mass spectrum revealed the base peak ion m/z 71
in the abundance of 100%, identified as C3H3O2 radical cation. Here the difference between the
m/z 56 and 71 represents a CH3. The mass spectrum is presented in the Appendix I, Figure I.6.
The peak in the retention time 17.461 is characterized by the mass spectrum with a base peak
ion m/z 149 in the abundance of 100% (Appendix I, Figure I.7). The C7O4H compound is
recognized to be a contaminant.
Figure 4.21 Chromatogram of the UV lamps degradation of 3 hours experiment
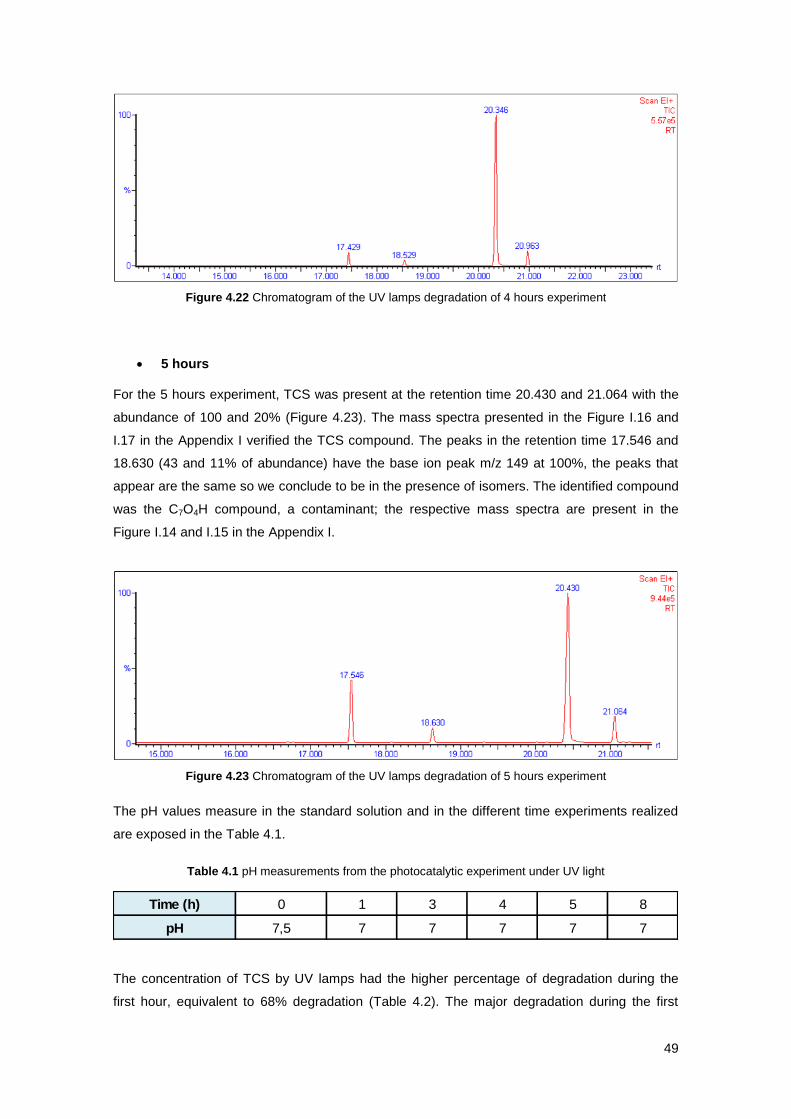
4 hours In the 4 hour experiment the chromatograph showed 4 peaks (Figure 4.22). The peaks in the
retention time 20.346 and 20.963 with the respective abundance of 100 and 11% are TCS as
the matching mass spectrum reveals in the Figure I.12 and I.13 in the Appendix I. The two
peaks at the retention time 17.429 and 18.529 with the abundance of 11 and 4% have the same
peaks in the mass spectra; the base ion peak of m/z 149 is identical in the abundance of 100%.
These peaks are identified has C7O4H compound as contaminant. The respective mass
spectrum is exposed in the Figure I.10 and I.11 in the Appendix I.
49
Figure 4.22 Chromatogram of the UV lamps degradation of 4 hours experiment
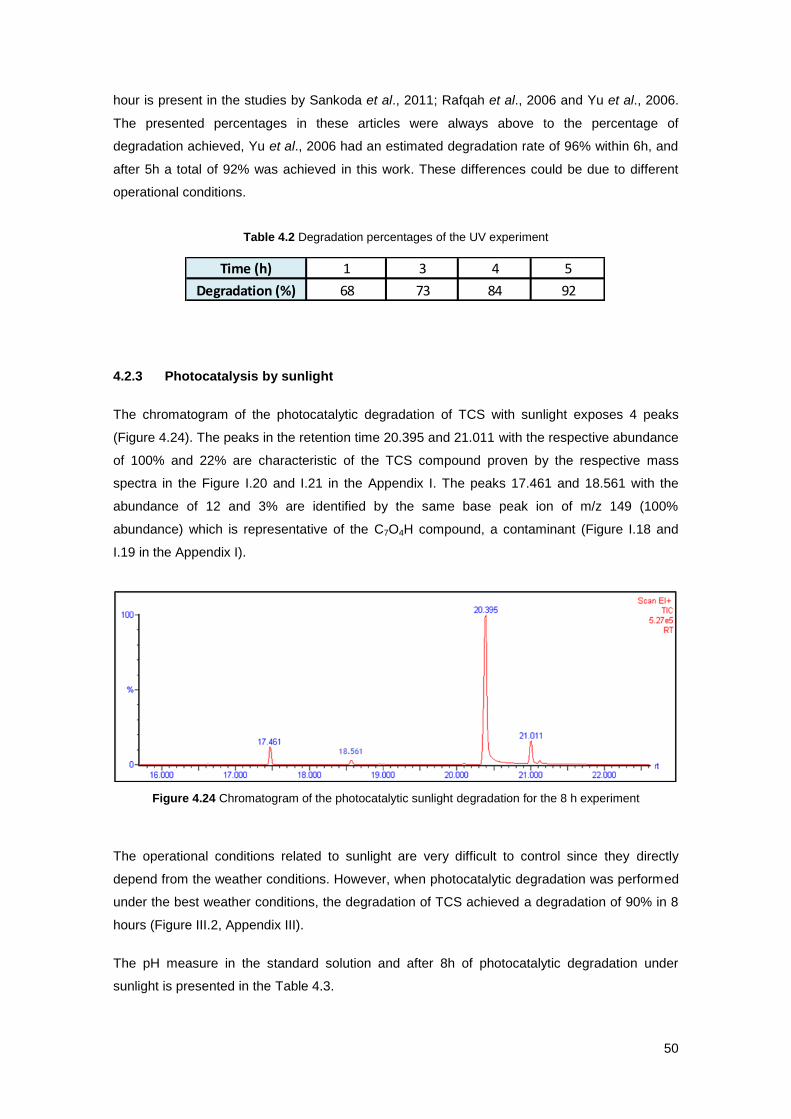
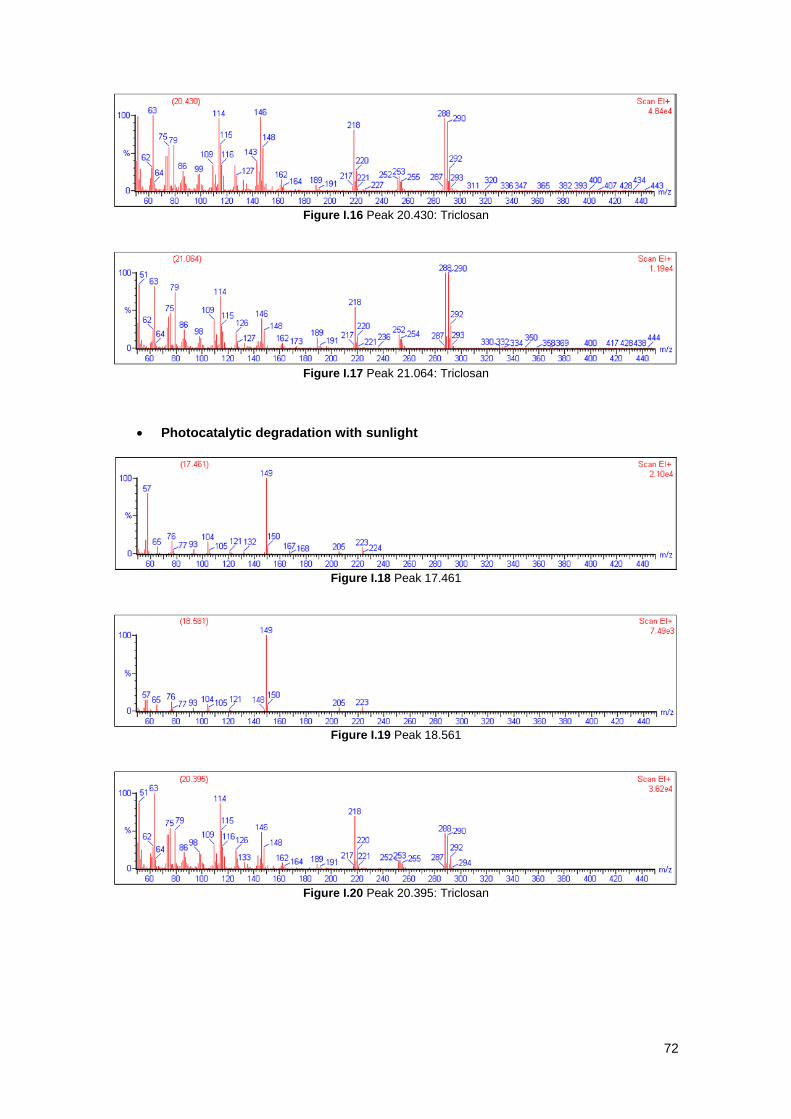
5 hours For the 5 hours experiment, TCS was present at the retention time 20.430 and 21.064 with the
abundance of 100 and 20% (Figure 4.23). The mass spectra presented in the Figure I.16 and
I.17 in the Appendix I verified the TCS compound. The peaks in the retention time 17.546 and
18.630 (43 and 11% of abundance) have the base ion peak m/z 149 at 100%, the peaks that
appear are the same so we conclude to be in the presence of isomers. The identified compound
was the C7O4H compound, a contaminant; the respective mass spectra are present in the
Figure I.14 and I.15 in the Appendix I.
Figure 4.23 Chromatogram of the UV lamps degradation of 5 hours experiment
The pH values measure in the standard solution and in the different time experiments realized
are exposed in the Table 4.1.
Table 4.1 pH measurements from the photocatalytic experiment under UV light
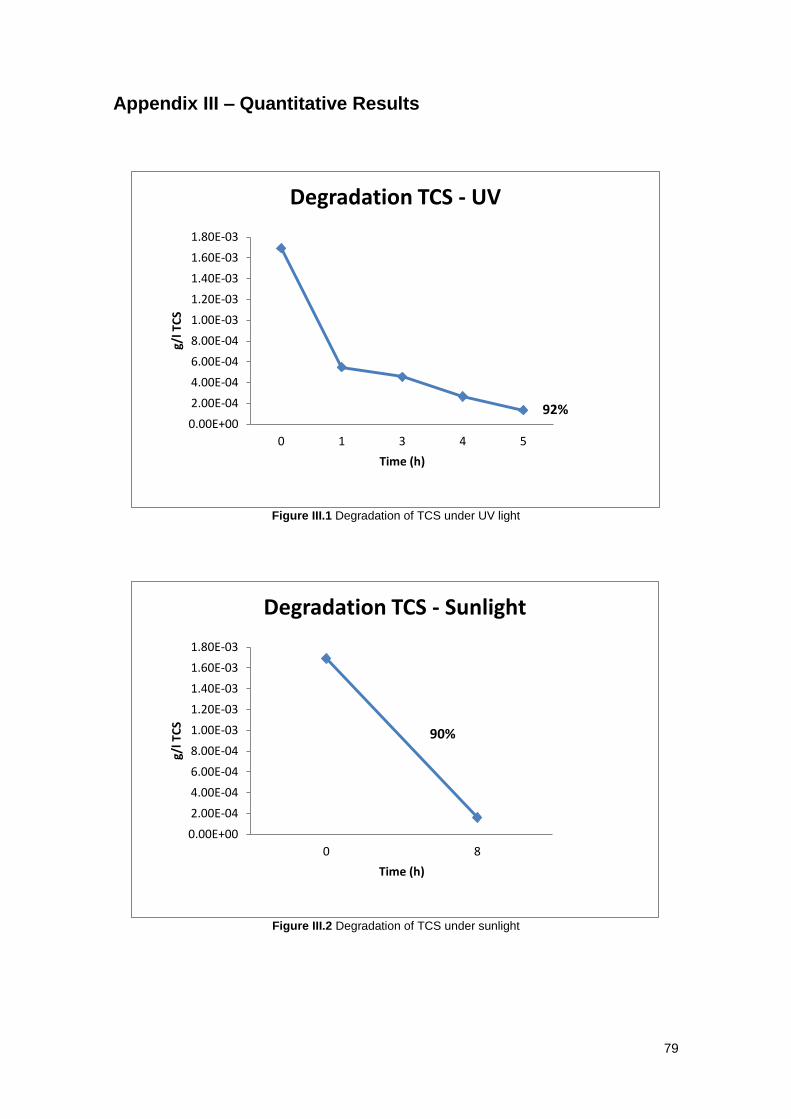
The concentration of TCS by UV lamps had the higher percentage of degradation during the
first hour, equivalent to 68% degradation (Table 4.2). The major degradation during the first
Time (h) 0 1 3 4 5 8
pH 7,5 7 7 7 7 7
50
hour is present in the studies by Sankoda et al., 2011; Rafqah et al., 2006 and Yu et al., 2006.
The presented percentages in these articles were always above to the percentage of
degradation achieved, Yu et al., 2006 had an estimated degradation rate of 96% within 6h, and
after 5h a total of 92% was achieved in this work. These differences could be due to different
operational conditions.
Table 4.2 Degradation percentages of the UV experiment
4.2.3 Photocatalysis by sunlight
The chromatogram of the photocatalytic degradation of TCS with sunlight exposes 4 peaks
(Figure 4.24). The peaks in the retention time 20.395 and 21.011 with the respective abundance
of 100% and 22% are characteristic of the TCS compound proven by the respective mass
spectra in the Figure I.20 and I.21 in the Appendix I. The peaks 17.461 and 18.561 with the
abundance of 12 and 3% are identified by the same base peak ion of m/z 149 (100%
abundance) which is representative of the C7O4H compound, a contaminant (Figure I.18 and
I.19 in the Appendix I).
Figure 4.24 Chromatogram of the photocatalytic sunlight degradation for the 8 h experiment
The operational conditions related to sunlight are very difficult to control since they directly
depend from the weather conditions. However, when photocatalytic degradation was performed
under the best weather conditions, the degradation of TCS achieved a degradation of 90% in 8
hours (Figure III.2, Appendix III).
The pH measure in the standard solution and after 8h of photocatalytic degradation under
sunlight is presented in the Table 4.3.
1 3 4 5
68 73 84 92
Time (h)
Degradation (%)
51
Table 4.3 pH measurement under photocatalytic degradation under sunlight
4.2.4 Photocatalysis by LEDs
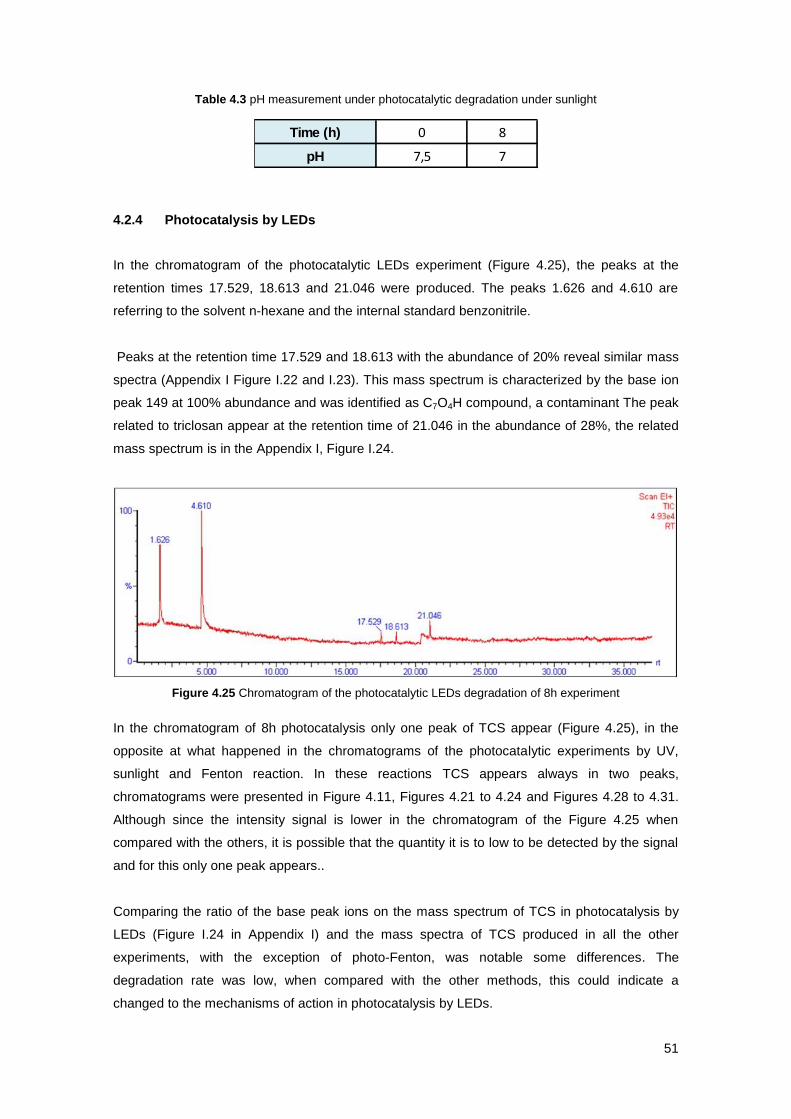
In the chromatogram of the photocatalytic LEDs experiment (Figure 4.25), the peaks at the
retention times 17.529, 18.613 and 21.046 were produced. The peaks 1.626 and 4.610 are
referring to the solvent n-hexane and the internal standard benzonitrile.
Peaks at the retention time 17.529 and 18.613 with the abundance of 20% reveal similar mass
spectra (Appendix I Figure I.22 and I.23). This mass spectrum is characterized by the base ion
peak 149 at 100% abundance and was identified as C7O4H compound, a contaminant The peak
related to triclosan appear at the retention time of 21.046 in the abundance of 28%, the related
mass spectrum is in the Appendix I, Figure I.24.
Figure 4.25 Chromatogram of the photocatalytic LEDs degradation of 8h experiment
In the chromatogram of 8h photocatalysis only one peak of TCS appear (Figure 4.25), in the
opposite at what happened in the chromatograms of the photocatalytic experiments by UV,
sunlight and Fenton reaction. In these reactions TCS appears always in two peaks,
chromatograms were presented in Figure 4.11, Figures 4.21 to 4.24 and Figures 4.28 to 4.31.
Although since the intensity signal is lower in the chromatogram of the Figure 4.25 when
compared with the others, it is possible that the quantity it is to low to be detected by the signal
and for this only one peak appears..
Comparing the ratio of the base peak ions on the mass spectrum of TCS in photocatalysis by
LEDs (Figure I.24 in Appendix I) and the mass spectra of TCS produced in all the other
experiments, with the exception of photo-Fenton, was notable some differences. The
degradation rate was low, when compared with the other methods, this could indicate a
changed to the mechanisms of action in photocatalysis by LEDs.
Time (h) 0 8
pH 7,5 7
52
The pH measure in the standard solution and after 8h of photocatalytic degradation under LEDs
is presented in the Table 4.4.
Table 4.4 pH measurement under photocatalytic degradation under LEDs
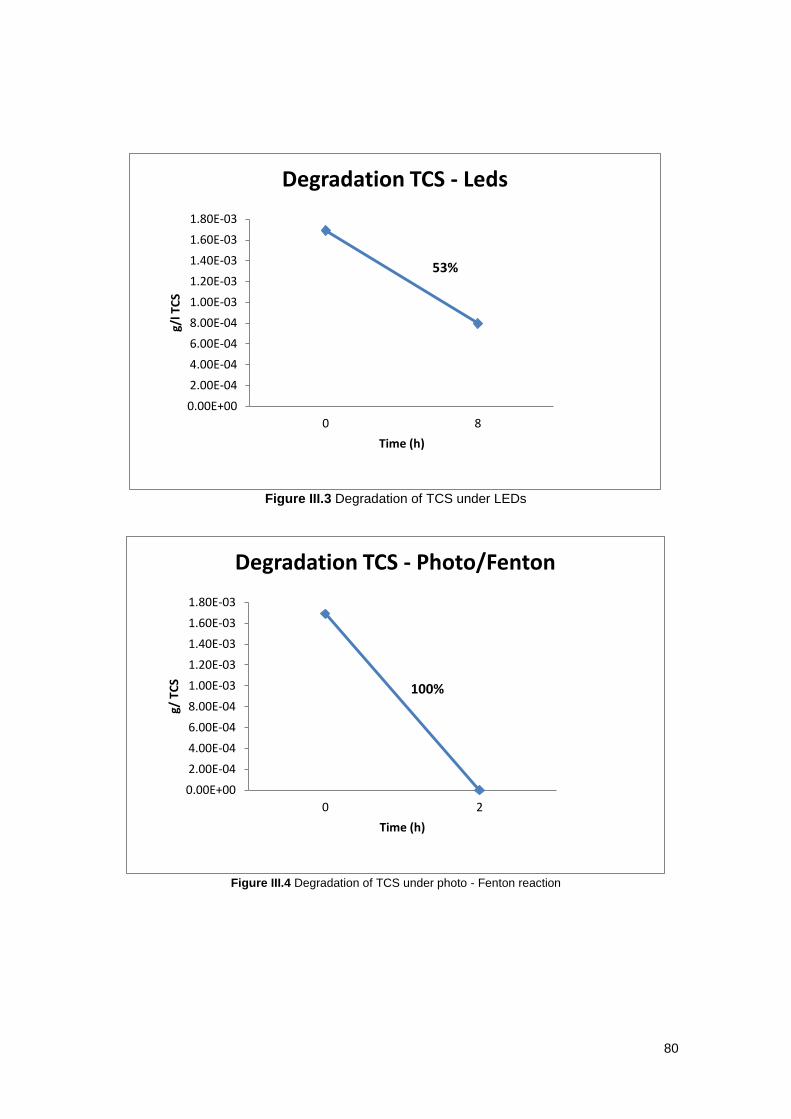
The degradation of TCS on photocatalysis by TiO2 with LEDs was possible and the rate of
removal reached 53% after 8h (Figure III.3, Appendix III). By comparing the degradation rate of
LEDs with sunlight, LEDs yield almost twice less degradation than sunlight.
There are only a limited number of papers that study the LED photocatalysis applied in the field
of environmental engineering (Yu et al., 2013). No paper on LED photocatalysis performed in
triclosan was found at the time of this written study.
LED photocatalytic degradation of phenols, specifically of 4–chlorophenol (4-CP) and 2,4–DCP
might be a good approximation to what could happen with TCS. These compounds are
structurally related to TCS due to its aromatic character and phenol presence. Yu et al., 2013
had percentages of removal of 4-CP and 2,4–DCP in the order of 25% and 28% after 1 hour of
irradiation, showed in the Table 4.5.
Table 4.5 Percentage of removal of pesticides (4 - CP and 2,4-DCP) (Adapted from: Yu et al., 2014)
When comparing LEDs with UV lamps, LEDs confirmed to be more energy-efficient and the
emissions of LEDs have the advantage that they can be matched with the absorption band of
TiO2 (Yu et al., 2013).
Different authors studied the feasibility of the application of LEDs in the degradation of
hazardous compounds through photocatalysis (Jo & Tayade, 2014; Yu et al., 2013 ; Levine et
al., 2011; Ghosh et al., 2009; Shie et al., 2008; Wang & Ku, 2006; Han et al., 2004). The
degradation always occurred, demonstrating that LEDs are a viable photon source for
photocatalytic process. Even if the rates of removal are minor than fluorescent lamps the
potential of LEDs could be improved by optimizing operational conditions, such as the light
distribution over the catalyst, like TiO2 nanotubes, is a good solution to increase the contact
surface with the catalyst (Levine et al., 2011).
Time (h) 0 8
pH 7,5 7
Pesticides 4-CP 2,4-DCP
Degradation (%) 25 28
53
4.2.5 Photo-Fenton reaction The chromatogram resulted of the degradation by photo–Fenton reaction experiment showed
no peaks in the area expected for the retention time of triclosan (Figure 4.26). Two peaks
appeared which resulted from the treatment for analysis, the extraction and derivatization made
with hexane arises at the retention time 1.526 min and the adding of the internal standard at the
retention time of 4,410 min. The initial pH of the suspension with FeSO4.7H2O and TCS before
the drop by the addition of H2SO4 was 6, and after 3.
Figure 4.26 Chromatogram of the photo-Fenton reaction experiment
In the photo-Fenton experiment no degradation products were detected, evidencing that there
was a complete degradation of the products and a high conversion to CO2. One option is the
fast degradation that makes harder the follow-up of the evolution products. Klamerth et al., 2009
only gathered two experimental points due to the rapid evolution of the compounds during
photo-Fenton reaction. Bear in attention that this chromatogram has a very high signal when
compared with all the others.
The photo-Fenton reaction revealed a full degradation of the TCS compound by the end of the
2nd
hour (Figure III.4 in Appendix III). In Son et al., 2010 photo-Fenton reaction experiment,
triclosan was almost completely removed within the 1st hour. The photo-Fenton experiment
performed by Klamerth et al., 2009 by sunlight over a mixture of emerging contaminants
sulfamethoxazole, and triclosan), showed degradation of TCS in 20 minutes in demineralized
water and degradation of the total of the other contaminants over 38 minutes.
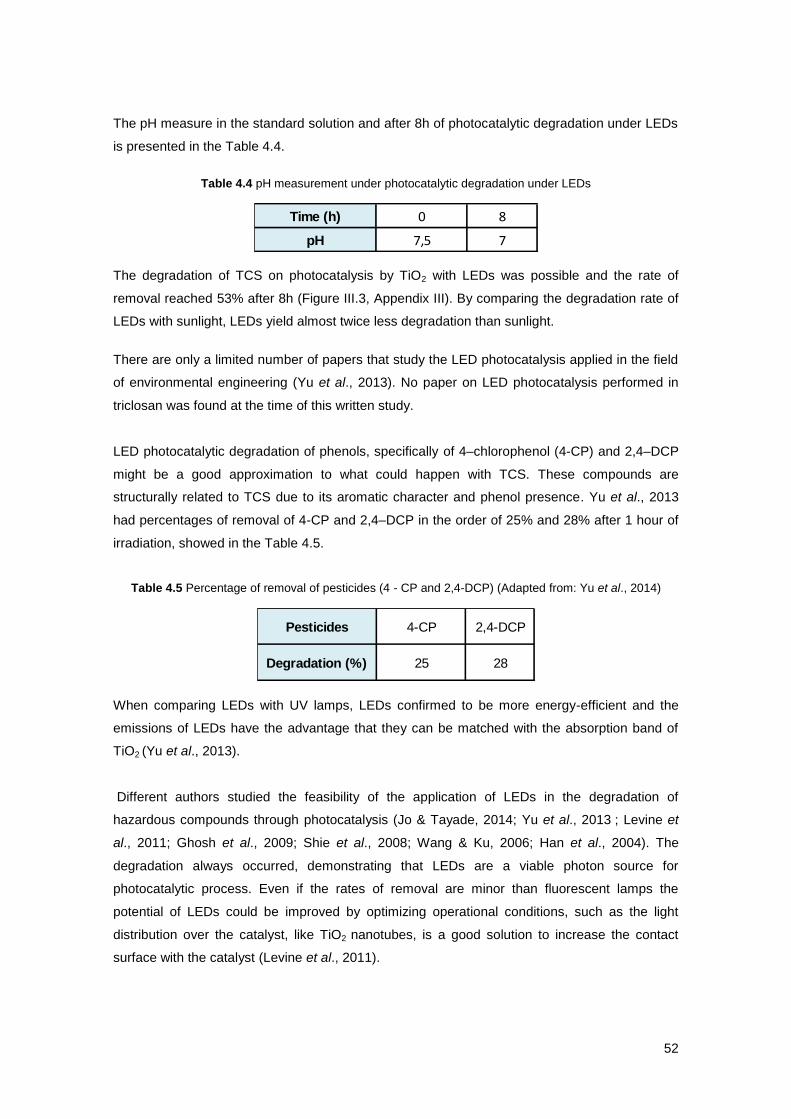
Bauer & Fallmann, (1997) compared the systems UV/O2/Fe2+
, UV/TiO2, UV/O3/Fe2+
and
UV/H2O2/ Fe2+
(photo-Fenton reaction), in the degradation of 10-3
mol/l 4-CP). The degradation
was followed by total organic carbon analysis, results are exposed in the Figure 4.27. The
photo-Fenton reaction was the most effective method in the degradation of 4-CP.
54
Figure 4.27 Degradation of 10-3
mol/l 4-CP by different AOPs (Adapted from Bauer & Fallmann, 1997)
Once again, photo-Fenton achieved removals of 96,4% in dipyrone, an analgesic drug with
aromatic character, having the best degradation rate when compared with Fenton reaction,
UV/H2O2 photolysis and UV/TiO2 photocatalysis in the study performed by Giri & Golder, (2014).
Photo–Fenton reaction has proven to be a method that brings rapid and complete degradation
of the compounds even in different operational conditions.
4.2.6 Fenton Reaction
Single addition of H2O2 The Fenton experiment with the addition of H2O2 with all the volume released at once was
performed twice, firstly for the duration of 2 hour experiment and then for 4 hours experiment. In
both no peaks appear apart from TCS peaks.
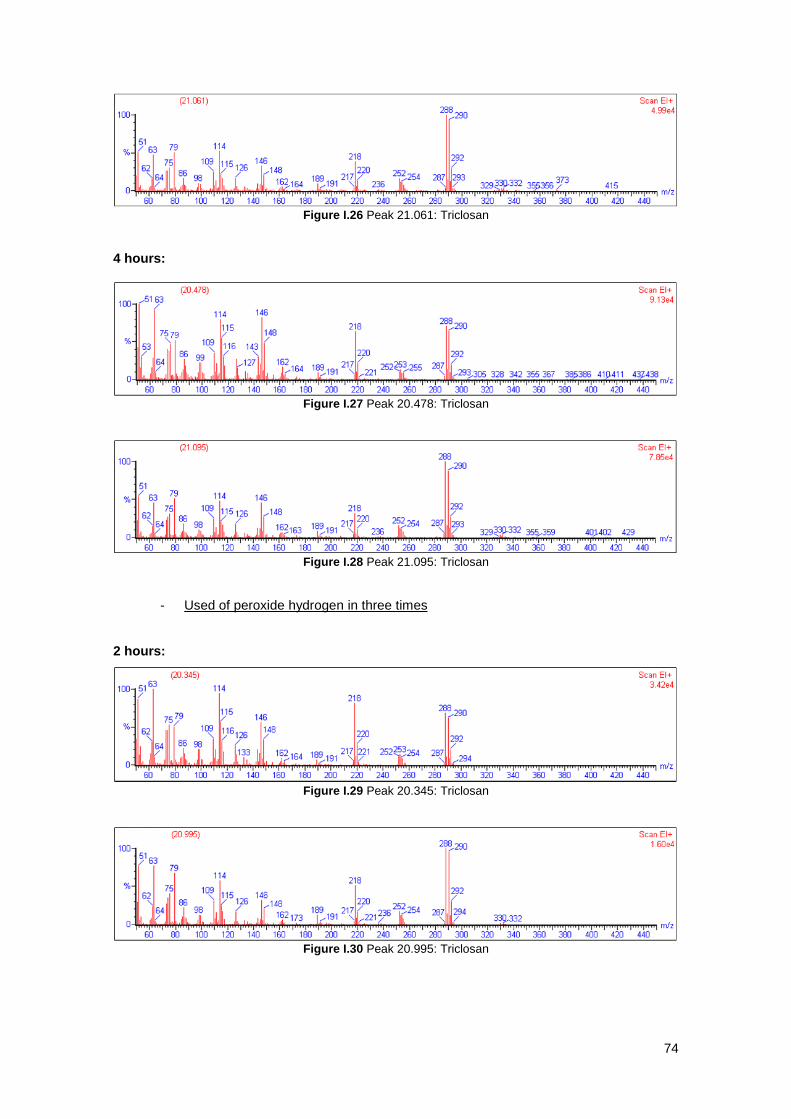
At the 2 hours experiment TCS appears at the retention time 20.395 and 21.061 (Figure 4.28).
For the 4h experiment, TCS appears at the retention time 20.478 and 21.095 (Figure 4.29).
The mass spectra that allowed to confirm the TCS identification, are exposed in Figure I.25,
I.26, I.27 and I.28 of the Appendix I. The initial pH of before the drop of the suspension with
FeSO4.7H2O and TCS by the addition of H2SO4 was 6, and after 2.8, and had the same values
in the experiment of 2 and 4 hours. After 2 hours, the degradation of TCS achieved 92%, at the
end of the 4th hour, it was 95% (Figure III.5, Appendix III).
55
Figure 4.28 Chromatogram of the Fenton reaction of 2 hour experiment
Figure 4.29 Chromatogram of the Fenton reaction of 4 hour experiment
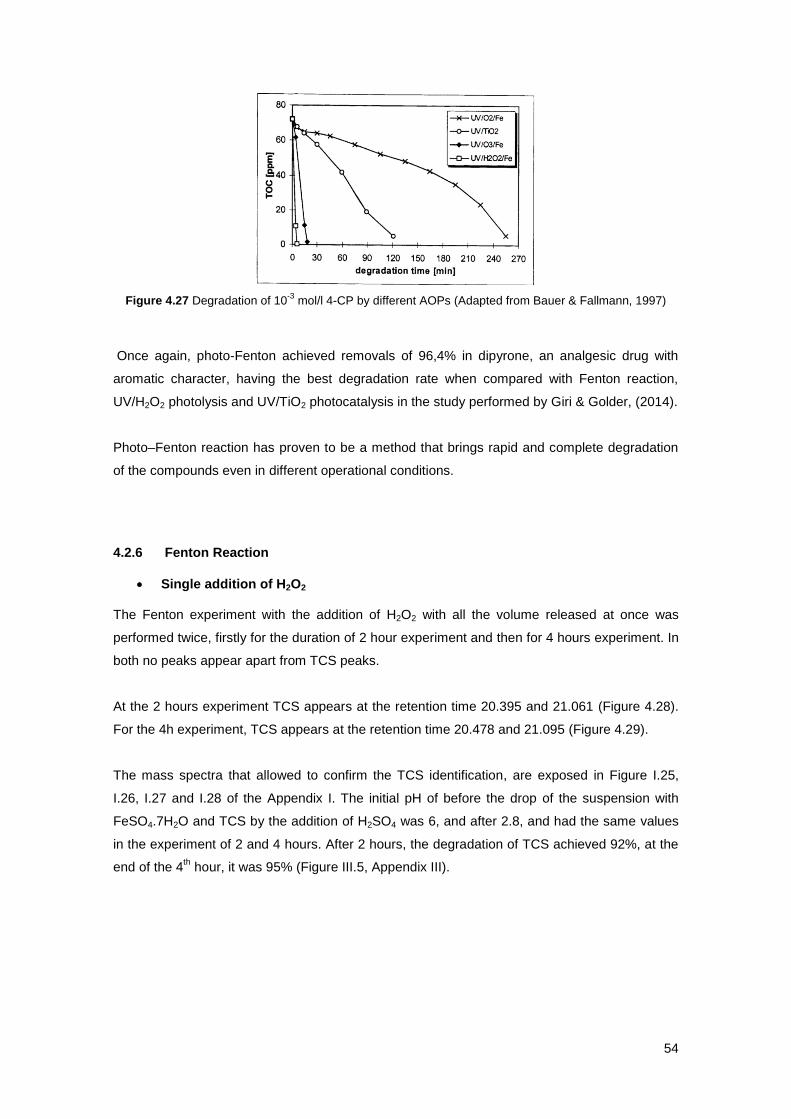
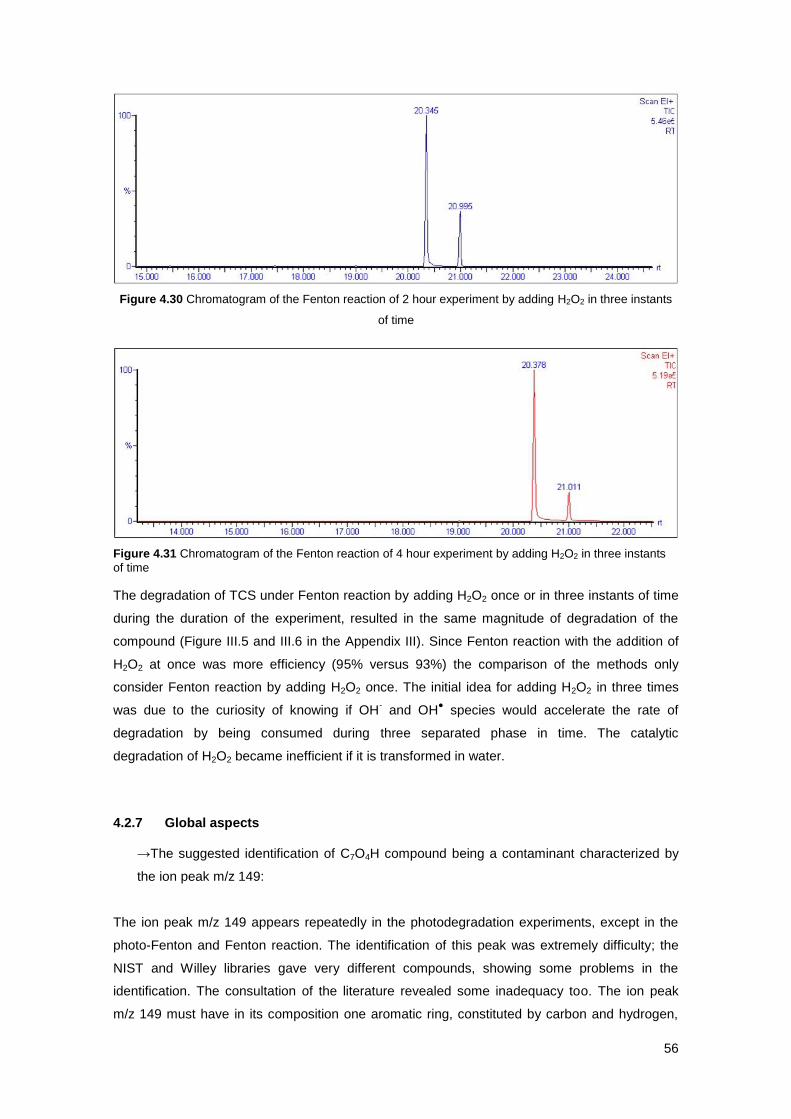
Triple addition of H2O2 The Fenton reaction experiment performed in 2 and 4 hours, by adding H2O2 in three instants
throughout the duration of the experiment; exposed only TCS peaks. The 2 hour experiment
showed TCS peaks at the retention time 20.345 and 20.995 in the abundance of 100% and
38% (Figure 4.30). The 4 hour experiment revealed the TCS peaks at the retention time 20.378
and 21.011 with the respectively abundance of 100% and 22% (Figure 4.31).
The corresponding peaks mass spectra are present in the Figures I.29, I.30, I.31 and I.32 in the
Appendix I. The initial pH of the FeSO4.7H2O and TCS suspension was 6, after the addition of
H2SO4, was 2.8, and had the same values in the experiment of 2 and 4 hours. After 2 hours, the
degradation of TCS achieved 90%, at the end of the 4th hour, it was 93% (Figure III.6, Appendix
III).
56
Figure 4.30 Chromatogram of the Fenton reaction of 2 hour experiment by adding H2O2 in three instants
of time
Figure 4.31 Chromatogram of the Fenton reaction of 4 hour experiment by adding H2O2 in three instants
of time
The degradation of TCS under Fenton reaction by adding H2O2 once or in three instants of time
during the duration of the experiment, resulted in the same magnitude of degradation of the
compound (Figure III.5 and III.6 in the Appendix III). Since Fenton reaction with the addition of
H2O2 at once was more efficiency (95% versus 93%) the comparison of the methods only
consider Fenton reaction by adding H2O2 once. The initial idea for adding H2O2 in three times
was due to the curiosity of knowing if OH- and OH
● species would accelerate the rate of
degradation by being consumed during three separated phase in time. The catalytic
degradation of H2O2 became inefficient if it is transformed in water.
4.2.7 Global aspects
→The suggested identification of C7O4H compound being a contaminant characterized by
the ion peak m/z 149:
The ion peak m/z 149 appears repeatedly in the photodegradation experiments, except in the
photo-Fenton and Fenton reaction. The identification of this peak was extremely difficulty; the
NIST and Willey libraries gave very different compounds, showing some problems in the
identification. The consultation of the literature revealed some inadequacy too. The ion peak
m/z 149 must have in its composition one aromatic ring, constituted by carbon and hydrogen,
57
with the typical signature of chloride not present (M-2 and M-4). The final proposal is based on
the assumption the ion peak m/z 105 is an aromatic compound of formula C6O2H and the
addition of a COO presented the peak m/z 149 giving the C7O4H compound (Table 4.6). This
compound is suspected to be a contaminant.
Table 4.6 Mass spectrum of the ion peak m/z 149 in the different experiments
→ Dioxins
Dioxins are the by-products of the degradation of TCS that cause more general concern.
According to the literature, dioxins are formed in the first minutes of irradiation (Latch et al.,
2003), although after 1 hour in the UV experiment and all the others performed, no dioxins were
detected.
Rafqah et al., 2006 defends dioxins only are formed if triclosan in its anionic form absorbs light
at waveleght inferior of 300 nm. The technical features of fabrication of the model of the UV
lamps indicates that the maximum wavelength is 310 nm, the UV–Visible spectra from the
manufacturer show a narrow peak in this wavelength so no irradiation is emitted under 300 nm.
Yu et al., 2006 detected chlorinated dibenzo-p-dioxin in samples exposed to 254 nm UV light
but in the samples exposed to 365 nm no chlorinated dibenzo-p-dioxin congener was found.
The wavelength of the LEDs was not measured and no manufacturer features existed, the LED
system was built in the Università degli Studi di Padova, and for the same reason either the
Hours (h) Retention times Descriptive Figure
17.461 Figure 4.16
18.561 Figure I.3, Appendix I
17.429 Figure I.10, Appendix I
18.529 Figure I.11, Appendix I
17.546 Figure I.14, Appendix I
18.630 Figure I.15, Appendix I
Descriptive Figure
Figure I.18, Appendix I
Figure I.19, Appendix I
Descriptive Figure
Figure I. 22, Appendix I
Figure I. 23, Appendix I
17.529
18.613
1
3 17.461 Figure I.7, Appendix I
4
5
Photocatalytic degradation by sunlight
Retention time
17.461
18.561
Photocatalytic degradation by LEDs
Retention time
Photocatalytic degradation by UV
58
wavelength of the LEDs is higher than 300 nm or dioxins were produced in the first hour and
were destroyed by the end of the experiment, which might account to no dioxins being visible.
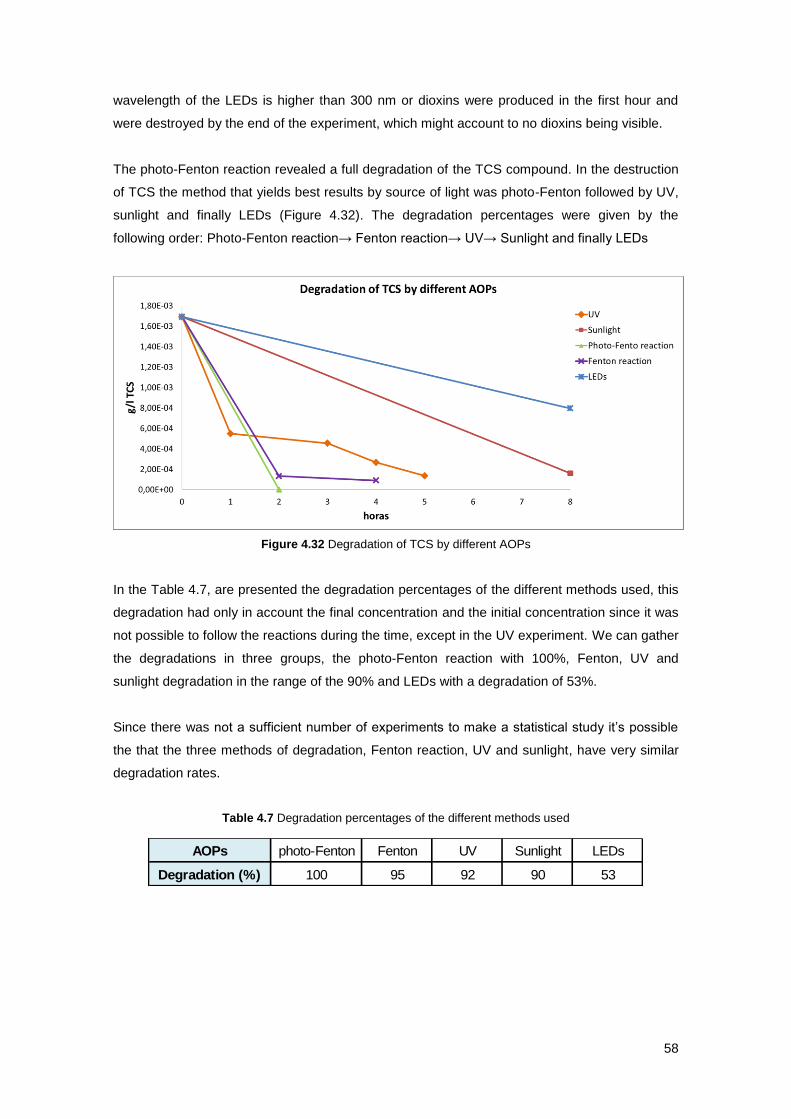
The photo-Fenton reaction revealed a full degradation of the TCS compound. In the destruction
of TCS the method that yields best results by source of light was photo-Fenton followed by UV,
sunlight and finally LEDs (Figure 4.32). The degradation percentages were given by the
following order: Photo-Fenton reaction→ Fenton reaction→ UV→ Sunlight and finally LEDs
Figure 4.32 Degradation of TCS by different AOPs
In the Table 4.7, are presented the degradation percentages of the different methods used, this
degradation had only in account the final concentration and the initial concentration since it was
not possible to follow the reactions during the time, except in the UV experiment. We can gather
the degradations in three groups, the photo-Fenton reaction with 100%, Fenton, UV and
sunlight degradation in the range of the 90% and LEDs with a degradation of 53%.
Since there was not a sufficient number of experiments to make a statistical study it’s possible
the that the three methods of degradation, Fenton reaction, UV and sunlight, have very similar
degradation rates.
Table 4.7 Degradation percentages of the different methods used
AOPs photo-Fenton Fenton UV Sunlight LEDs
Degradation (%) 100 95 92 90 53
59
5 Conclusions and future work
Throughout the course of this study, several methods of degradation of TCS, known as AOPs
were evaluated. The analysis of the result and literature lead to the following conclusions:
Photon-Fenton reaction was the best AOPs, having a degradation rate of 100% of TCS
within 2 hours, and no by-products were detected;
The degradation was given by the following order: photo-Fenton → Fenton reaction →
UV → Sunlight → LEDs;
The photocatalytic degradation under UV produced by-products after the first hour. It
was not possible to compare with the other methods since samples were not gathered
after one hour;
Hydroquinone specie and 2,4–DCP intermediates were identified in the first hour of the
photocatalytic degradation under UV;
A common contaminant, identified has C7O4H compound, was present at the
degradation by UV, sunlight and LEDs;
Photocatalytic degradation by using LEDs is a viable possibility in the destruction of
TCS. The degradation percentage was 53% after 8h;
Photocatalytic degradation under LEDs could follow different mechanisms of action
when comparing the degradation rate with other degradation sources;
The addition of H2O2 once or in three separate times gave the same magnitude of
degradation of the TCS;
No dioxins where detected in the operational conditions used.
Future work and recommendations:
The study work with LEDs is worthwhile to continue given the advantages of long
durability and low consumption of energy making the future potential for these lamps
very high; fluorescent lamps in the ending of their life cycle carry the risk of spread of
mercury in the environment and as governments make these lamps unavailable new
solutions are required; Fenton and photo-Fenton reaction can be also a costly process
due to the reagents cost used.
More studies in the use of LEDs should be performed in order to better define the
kinetics reactions;
LEDs allowed a variable possibility to design devices. An industrial scale pilot can be
used to research;
Improve the extraction and derivatization techniques to understand the degradation
products;
60
Following degradation of TCS through time in different AOPs and the by–products
generated is an interesting point to have in considerer;
In the case of photo-Fenton process, possibly high quantities of TCS were transformed
in CO2; the measurement of CO2 levels can be quantified on the absorption of CO2 by
sodium hydroxide.
61
6 References
Adolfsson-Erici, M., Pettersson, M., Parkkonen, J. & Sturve, J. (2002). Triclosan, a commonly used bactericide found in human milk and in the aquatic environment in Sweden. Chemosphere, 46(9-10), 1485–1489.
Aguillon, C., Newman, J. & Machado, A. (2010). Pharmaceuticals and Personal Care Products (PPCPs):triclosan. http://www.csun.edu/~vchsc006/triclosan.pdf.
Aliabadi, M. & Sagharigar, T. (2011). Photocatalytic removal of Rhodamine B from aqueous solutions using TiO2 nanocatalyst. Journal of Applied Environmental and Biological Sciences, 1(12), 620–626.
Allmyr, M., Adolfsson-Erici, M., McLachlan, M. S. & Sandborgh-Englund, G. (2006). Triclosan in plasma and milk from Swedish nursing mothers and their exposure via personal care products. Science of the Total Environment, 372(1), 87–93.
Aranami, K. & Readman, J. W. (2007). Photolytic degradation of triclosan in freshwater and seawater. Chemosphere, 66(6), 1052–1056.
Bauer, R. & Fallmann, H. (1997). The photo-Fenton oxidation — A cheap and efficient wastewater treatment method. Research on Chemical Intermediates, 23(4), 341–354.
Bester, K. (2003). Triclosan in a sewage treatment process-balances and monitoring data. Water Research, 37(16), 3891–3896.
Bhargava, H. N. & Leonard, P. A. (1996). Triclosan : Applications and safety. American Journal of Infection Control, 24(3), 209 – 218.
Bovey, F. A., Mirau, P. A. & Gutowsky, H. S. (1988). Nuclear Magnetic Resonance Spectroscopy: Academic Press, INC.
Bruins, A. P. (1998). Mechanistic aspects of electrospray ionization. Journal of Chromatography A, 794(1), 345–357.
Carp, O., Huisman, C. L. & Reller, A. (2004). Photoinduced reactivity of titanium dioxide. Progress in Solid State Chemistry, 32, 33–177.
Catrinescu, C., Arsene, D., Apopei, P. & Teodosiu, C. (2012). Degradation of 4-chlorophenol from wastewater through heterogeneous Fenton and photo-Fenton process, catalyzed by Al–Fe PILC. Applied Clay Science, 58, 96–101.
Cech, N. B. & Enke, C. G. (2002). Practical implications of some recent studies in electrospray ionization fundamentals. Mass Spectrometry Reviews, 20, 362–387.
Chalew, T. E. A. & Halden, R. U. (2009). Environmental exposure of aquatic and terrestrial biota to triclosan and triclocarban. Journal of the American Water Resources Association, 45(1), 4–13.
Coogan, M. A., Edziyie, R. E., La Point, T. W. & Venables, B. J. (2007). Algal bioaccumulation of triclocarban, triclosan, and methyl-triclosan in a North Texas wastewater treatment plant receiving stream. Chemosphere, 67, 1911–1918.
Czaplicka, M. (2001). Determination of phenols and chlorophenols in bottom sediments. Chromatographia, 53, 470–473.
62
Dann, A. B. & Hontela, A. (2011). Triclosan: environmental exposure, toxicity and mechanisms of action. Journal of Applied Toxicology, 31, 285–311.
Dayan, A. D. (2007). Risk assessment of triclosan [Irgasan] in human breast milk. Food and Chemical Toxicology , 45(1), 125–129.
Fang, J.L., Stingley, R. L., Beland, F. A., Harrouk, W., Lumpkins, D. L. & Howard, P. (2010). Occurrence, efficacy, metabolism and toxicity of triclosan. Journal of Environmental Science and Health. Part C, Environmental Carcinogenesis & Ecotoxicology Reviews, 28(3), 147–171.
Foran, C. M., Bennett, E. R. & Benson, W. H. (2000). Developmental evaluation of a potential non-steroidal estrogen: triclosan. Marine Environmental Research, 50,153–156.
Fuertes, V. C., Negre, C. F. A., Oviedo, M. B., Bonafé, F. P., Oliva, F. Y. & Sánchez, C. G. (2013). A theoretical study of the optical properties of nanostructured TiO2. Journal of Physics: Condensed Matter, 25, 1-7.
Fujishima, A. & Murakami, T. (2010). Expanding industrialization of photocatalysts. Sangakukan, 6.
Ghosh, J. P., Sui, R., Langford, C. H., Achari, G. & Berlinguette, C. P. (2009). A comparison of several nanoscale photocatalysts in the degradation of a common pollutant using LEDs and conventional UV light. Water Research, 43, 4499–4506.
Giri, A. S. & Golder, A. K. (2014). Fenton, photo-Fenton, H2O2 photolysis, and TiO2 photocatalysis for dipyrone oxidation : drug removal, mineralization, biodegradability and degradation mechanism. Industrial & Engineering Chemistry Research, 53, 1351 - 1358.
Glaser, A. (2004). The Ubiquitous Triclosan A common antibacterial agent exposed. Pesticides and You, 24(3), 12-17.
Gómez, M. J., Gómez-Ramos, M. M., Agüera, A., Mezcua, M., Herrera, S. & Fernández-Alba, A. R. (2009). A new gas chromatography/mass spectrometry method for the simultaneous analysis of target and non-target organic contaminants in waters. Journal of Chromatography A, 1216, 4071–4082.
Hakura, A., Suzuki, S., Sawada, S., Motooka, S. & Satoh, T. (2002). An improvement of the Ames test using a modified human liver S9 preparation. Jornal of Pharmacological Methods, 46, 169-172.
Hakura, A., Suzuki, S. & Satoh, T. (1999). Advantage of the use of human liver S9 in the Ames test. Mutation Research, 438, 29-36.
Halden, R. U. (2014). On the need and speed of regulating triclosan and triclocarban in the United States. Environmental Science & Technology, 48, 3603–3611.
Han, W., Zhu, W., Zhang, P., Zhang, Y. & Li, L. (2004). Photocatalytic degradation of phenols in aqueous solution under irradiation of 254 and 185nm UV light. Catalysis Today, 90, 319–324.
Heath, R. J., Rubin, J. R., Holland, D. R., Zhang, E., Snow, M. E. & Rock, C. O. (1999). Mechanism of triclosan inhibition of bacterial fatty acid synthesis. The Journal of Biological Chemistry, 274(16), 11110–11114.
Heidler, J. & Halden, R. U. (2007). Mass balance assessment of triclosan removal during conventional sewage treatment. Chemosphere, 66(2), 362–369.
63
Ho, C. S., Lam, C. W. K., Chan, M. H. M., Cheung, R. C. K., Law, L. K., Lit, L. C. W., Ng, K. F., Suen, M. W. M. & Tai, H. L. (2003). Electrospray ionisation mass spectrometry: principles and clinical applications. The Clinical Biochemist Reviews, 24(1), 3–12.
Hontela, A. & Habibi, H. R. (2013). 8 - Personal care products in the aquatic environment: a case study on the effects of triclosan in fish. In Organic Chemical Toxicology of Fishes (pp. 411– 437): Academic Press.
Jabrou, S. N. (2012). Extraction of phenol from industrial water using different solvents. Research Journal of Chemical Sciences, 2(4), 1–12.
Jo, W. & Tayade, R. J. (2014). New generation energy-efficient light source for photocatalysis : LEDs for environmental applications. Industrial & Engineering Chemistry Research, 53, 2073-2084.
Júnior, A., Quina, F., Gozzi, F., Silva, V., Friedrich, L. & Moraes, J. (2012). Fundamental mechanistic studies of the photo-Fenton reaction for the degradation of the organic pollutants. In T. Puzyn (Ed.), Organic Pollutants Ten Years After the Stockholm Convention - Environmental and Analytical Update: Intech.
Kaneko, M. & Okura, I. (2002). Photocatalysis: science and technology. Japan: Kodansha/ Springer.
Katz, D. R., Cantwell, M. G., Sullivan, J. C., Perron, M. M., Burgess, R. M., Ho, K. T. & Charpentier, M. A. (2013). Factors regulating the accumulation and spatial distribution of the emerging contaminant triclosan in the sediments of an urbanized estuary: Greenwich Bay, Rhode Island, USA. Science of the Total Environment, 443, 123–133.
Kim, K., Park, H., Yang, W. & Lee, J. H. (2011). Urinary concentrations of bisphenol A and triclosan and associations with demographic factors in the Korean population. Environmental Research, 111(8), 1280–1285.
Klamerth, N., Miranda, N., Malato, S., Agüera, A., Fernández-Alba, A. R., Maldonado, M. I. & Coronado, J. M. (2009). Degradation of emerging contaminants at low concentrations in MWTPs effluents with mild solar photo-Fenton and TiO2. Catalysis Today, 144(1-2), 124–130.
Kola, R. K., Rasheed, A. & Yalavarthy, P. D. (2013). Evaluation of antibacterial activity of triclosan against human patogens. The Ecoscan, 4, 273–276.
Kudo, A. & Miseki, Y. (2009). Heterogeneous photocatalyst materials for water splitting. Chemical Society Reviews, 38(1), 253–278.
Latch, D. E., Packer, J. L., Arnold, W. A. & McNeill, K. (2003). Photochemical conversion of triclosan to 2,8-dichlorodibenzo-p-dioxin in aqueous solution. Journal of Photochemistry and Photobiology A: Chemistry, 158, 63–66.
Levine, L. H., Richards, J. T., Coutts, J. L., Soler, R., Maxik, F. & Wheeler, R. M. (2011). Feasibility of ultraviolet-light-emitting diodes as an alternative light source for photocatalysis. Journal of the Air & Waste Management Association, 61(9), 932–940.
Li, X., Ying, G., Zhao, J., Chen, Z., Lai, H. & Su, H. (2013). 4-Nonylphenol, bisphenol-A and triclosan levels in human urine of children and students in China, and the effects of drinking these bottled materials on the levels. Environment International, 52, 81–86.
Ling, L., Xian, J., Ali, S., Geng, B., Fan, J., Mills, D. M., Arvanites, A.C., Orgueira, H., Ashwell, M. A., Carmel, G., Xiang, Y. & Moir D. T. (2004). Identification and characterization of
64
inhibitors of bacterial enoyl-acyl carrier protein reductase. Antimicrobial agents and chemotherapy, 48(5), 1541-1547.
Liu, F., Ying, G., Yang, L. & Zhou, Q. (2009). Terrestrial ecotoxicological effects of the antimicrobial agent triclosan. Ecotoxicology and Environmental Safety, 72, 86–92.
McAvoy, D. C., Schatowitz, B., Jacob, M., Hauk, A. & Eckhoff, W. S. (2002). Measurement of triclosan in wastewater treatment systems. Environmental Toxicology and Chemistry, 21(7), 1323–1329.
Mezcua, M., Gómez, M. J., Ferrer, I., Aguera, A., Hernando, M. D. & Fernández-Alba, A. R. (2004). Evidence of 2,7/2,8-dibenzodichloro-p-dioxin as a photodegradation product of triclosan in water and wastewater samples. Analytica Chimica Acta, 524, 241–247.
Mortelmans K. & Zeiger E. (2000). The Ames Salmonella/microsome mutagenicity assay. Mutation Research, 455(1-2), 29-60.
Nakata, K. & Fujishima, A. (2012). TiO2 photocatalysis: design and applications. Journal of Photochemistry and Photobiology C: Photochemistry Reviews, 13(3), 169–189.
Nassef, M., Matsumoto, S., Seki, M., Khalil, F., Kang, I. J., Shimasaki, Y., Oshima, Y. & Honjo, T. (2010). Acute effects of triclosan, diclofenac and carbamazepine on feeding performance of Japanese medaka fish (Oryzias latipes). Chemosphere, 80, 1095–1100.
Australian Government - Department of Health and Ageing/ National Industrial Chemicals Notification and Assessment Scheme. (2009). Triclosan. Priority Existing Chemical Assessment Report nr.30.
Ohtani, B., Prieto-Mahaney, O. O., Li, D. & Abe, R. (2010). What is Degussa (Evonik) P25? Crystalline composition analysis, reconstruction from isolated pure particles and photocatalytic activity test. Journal of Photochemistry and Photobiology A: Chemistry, 216, 179–182.
Orvos, D. R., Versteeg, D. J., Inauen, J., Capdevielle, M., Rothenstein, A. & Cunningham, V. (2002). Aquatic toxicity of triclosan. Environmental Toxicology and Chemistry, 21(7), 1338–1349.
Rafqah, S., Wong-Wah-Chung, P., Nelieu, S., Einhorn, J. & Sarakha, M. (2006). Phototransformation of triclosan in the presence of TiO2 in aqueous suspension : mechanistic approach. Applied Catalysis B: Environmental, 66, 119–125.
Ricart, M., Guasch, H., Alberch, M., Barceló, D., Bonnineau, C., Geiszinger, A., la Farré, M., Ferrer, J., Ricciardi, F., Romaní, A. M., Morin, S., Proia, L., Sala, L., Sureda, D. & Sabater, S. (2010). Triclosan persistence through wastewater treatment plants and its potential toxic effects on river biofilms. Aquatic Toxicology, 100, 346–353.
Russel, A.D. (2004). Whither triclosan?Journal of Antimicrobial Chemotherapy, 53, 693-695.
Sanchez-Prado, L., Llompart, M., Lores, M., García-Jares, C., Bayona, J. M. & Cela, R. (2006). Monitoring the photochemical degradation of triclosan in wastewater by UV light and sunlight using solid-phase microextraction. Chemosphere, 65, 1338–1347.
Sankoda, K., Matsuo, H., Ito, M., Nomiyama, K., Arizono, K. & Shinohara, R. (2011). Identification of triclosan intermediates produced by oxidative degradation using TiO2 in pure water and their endocrine disrupting activities. Bulletin of Environmental Contamination and Toxicology, 86, 470–475.
65
SCCS. (2010). Opinion on triclosan: antimicrobial resistance (Publication No. 1251/09). European Commission, Brussels: Angerer, J., Bernauer, U., Chambers, C., Chaudhry, Q., Degen, G., Eisenbrand, G., Platzek, T., Rastogi, S. C., Rogiers, V., Rousselle, C., Sanner, T., Savolainen, K., Engelen, J., Vinardell, M. P., Waring, R. & White, I. R.
Shie, J., Lee, C., Chiou, C., Chang, C., Chang, C. & Chang, C. (2008). Photodegradation kinetics of formaldehyde using light sources of UVA, UVC and UVLED in the presence of composed silver titanium oxide photocatalyst. Journal of Hazardous Materials, 155, 164–72.
Silverstein, R. M., Webster, F. X. & Kiemble, D. J. (2005). Spectrometric identification of organic compounds. United States of America, USA: Jon Willey & Sons, INC.
Singer, H., Müller, S., Tixier, C. & Pillonel, L. (2002). Triclosan: occurrence and fate of a widely used biocide in the aquatic environment: field measurements in wastewater treatment plants, surface waters, and lake sediments. Environmental Science & Technology, 36(23), 4998–5004.
Skoog, D., West, D., Holler, F. & Crouch, S. (2004). Fundamentals of Analytical Chemistry. United States of America, USA: Thomson Brooks/Cole.
Son, H., Khim, J. & Zoh, K. (2010). Degradation of triclosan in the combined reaction of Fe2+
and UV-C: Comparison with the Fenton and photolytic reactions. Environmental Progress & Sustainable Energy, 29(4), 415–420.
Song, Z., Wang, N., Zhu, L., Huang, A., Zhao, X. & Tang, H. (2012). Efficient oxidative degradation of triclosan by using an enhanced Fenton-like process. Chemical Engineering Journal, 198-199, 379-387.
Sun, Q. & Xu, Y. (2010). Evaluating intrinsic photocatalytic activities of anatase and rutile TiO2 for organic degradation in water. Journal of Physical Chemistry, 114(44), 18911–18918.
Tatarazako, N., Ishibashi, H., Teshima, K., Kishi, K. & Arizono, K. (2004). Effects of triclosan on various aquatic organisms. Environmental Sciences, 11(2), 133–140.
Thompson, A., Griffin, P., Stuetz, R. & Cartmell, E. (2005). The fate and removal of triclosan during wastewater treatment. Water Environment Research, 77(1), 63–67.
Tixier, C., Singer, H. P., Canonica, S. & Müller, S. R. (2002). Phototransformation of triclosan in surface waters: a relevant elimination process for this widely used biocide-laboratory studies, field measurements and modeling. Environmental Science & Technology, 36(16), 3482–3489.
Toms, L. L., Allmyr, M., Mueller, J. F., Adolfsson-Erici, M., McLachlan, M., Murby, J. & Harden, F. A. (2011). Triclosan in individual human milk samples from Australia. Chemosphere, 85, 1682–1686.
Villalaín, J., Mateo, C. R., Aranda, F. J., Shapiro, S. & Micol, V. (2001). Membranotropic effects of the antibacterial agent triclosan. Archives of Biochemistry and Biophysics, 390(1), 128–136.
Waller, N. J. & Kookana, R. S. (2009). Effect of triclosan on microbial activity in Australian soils. Environmental Toxicology and Chemistry, 28(1), 65–70.
Wang, L., Falany, C. N. & James, M. O. (2004). Triclosan as a substrate and inhibitor of 3` -phosphoadenosine 5` - phosphosulfate-sulfotransferase and udp-glucuronosyl transferase in human liver fractions, The American Society for Pharmacology and Experimental Therapeutics, 32(10), 1162–1169.
Wang, W. & Ku, Y. (2006). Photocatalytic degradation of Reactive Red 22 in aqueous solution by UV-LED radiation. Water Research, 40, 2249–2258.
Xie, Z., Ebinghaus, R., Flöser, G., Caba, A. & Ruck, W. (2008). Occurrence and distribution of triclosan in the German Bight (North Sea). Environmental Pollution, 156, 1190–1195.
Yang, B., Ying, G., Zhao, J., Zhang, L., Fang, Y. & Nghiem, L. (2011). Oxidation of triclosan by ferrate: reaction kinetics, products identification and toxicity evaluation. Journal of Hazardous Materials, 186, 227–235.
Yazdankhah, S. P., Scheie, A. A., Hoiby, E. A., Lunestad, B. T., Heir, E., Fotland, T. O., Naterstand, K. & Kruse, H. (2006). Triclosan and antimicrobial resistance in bacteria: an overview. Microbial Drug Resistance, 12(2), 83 – 90.
Ying, G. & Kookana, R. S. (2007). Triclosan in wastewaters and biosolids from Australian wastewater treatment plants. Environment International, 33, 199–205.
Yu, J. C., Kwong, T. Y., Luo, Q. & Cai, Z. (2006). Photocatalytic oxidation of triclosan. Chemosphere, 65, 390–399.
Yu, L., Achari, G. & Langford, C. H. (2013). LED-based photocatalytic treatment of pesticides and chlorophenols. Journal of Environmental Engineering, 139, 1146–1151.
67
Appendixes
68
69
Appendix I – Mass spectra Characterization of the standard solution
GC/MS
Figure I.1 Peak at 18.812: Triclosan isomer
Figure I.2 Peak at 19.863: Triclosan isomer
Photocatalytic degradation with UV lamps 1 hour:
Figure I.3 Peak 18.561
Figure I.4 Peak 20.361: Triclosan
Figure I.5 Peak 20.995: Triclosan
70
3 hours:
Figure I.6 Peak 14.011: C3H3O2 radical cation
Figure I.7 Peak 17.461
Figure I.8 Peak 20.345: Triclosan
Figure I.9 Peak 20.995: Triclosan
4 hours:
Figure I.10 Peak 17.429
71
Figure I.11 Peak 18.529
Figure I.12 Peak 20.346: Triclosan
Figure I.13 Peak 20.963: Triclosan
5 hours:
Figure I.14. Peak 17.546
Figure I.15 Peak 18.630
72
Figure I.16 Peak 20.430: Triclosan
Figure I.17 Peak 21.064: Triclosan
Photocatalytic degradation with sunlight
Figure I.18 Peak 17.461
Figure I.19 Peak 18.561
Figure I.20 Peak 20.395: Triclosan
73
Figure I.21 Peak 21.011: Triclosan
Photocatalytic degradation with LEDs
Figure I.22 Peak at 17.529
Figure I.23 Peak at 18.613
Figure I.24 Peak 21.046: Triclosan
Degradation by the Fenton reaction
- Used of H2O2 at once:
2 hours:
Figure I.25 Peak 20.395: Triclosan
74
Figure I.26 Peak 21.061: Triclosan
4 hours:
Figure I.27 Peak 20.478: Triclosan
Figure I.28 Peak 21.095: Triclosan
- Used of peroxide hydrogen in three times
2 hours:
Figure I.29 Peak 20.345: Triclosan
Figure I.30 Peak 20.995: Triclosan
75
4 hours:
Figure I.31 Peak 20.378: Triclosan
Figure I.32 Peak 21.011: Triclosan
76
77
Appendix II – Chromatograms
Figure II.1 Amplified chromatogram of the photocatalytic degradation by UV lamps experiment between
the retention time 9 and 19 min
78
79
Appendix III – Quantitative Results
Figure III.1 Degradation of TCS under UV light
Figure III.2 Degradation of TCS under sunlight
0.00E+00
2.00E-04
4.00E-04
6.00E-04
8.00E-04
1.00E-03
1.20E-03
1.40E-03
1.60E-03
1.80E-03
0 1 3 4 5
g/l T
CS
Time (h)
Degradation TCS - UV
92%
0.00E+00
2.00E-04
4.00E-04
6.00E-04
8.00E-04
1.00E-03
1.20E-03
1.40E-03
1.60E-03
1.80E-03
0 8
g/l T
CS
Time (h)
Degradation TCS - Sunlight
90%
80
Figure III.3 Degradation of TCS under LEDs
Figure III.4 Degradation of TCS under photo - Fenton reaction
0.00E+00
2.00E-04
4.00E-04
6.00E-04
8.00E-04
1.00E-03
1.20E-03
1.40E-03
1.60E-03
1.80E-03
0 8
g/l T
CS
Time (h)
Degradation TCS - Leds
0.00E+00
2.00E-04
4.00E-04
6.00E-04
8.00E-04
1.00E-03
1.20E-03
1.40E-03
1.60E-03
1.80E-03
0 2
g/ T
CS
Time (h)
Degradation TCS - Photo/Fenton
100%
53%
81
Figure III.5 Degradation of TCS under Fenton reaction (addition of H2O2 at once)
Figure III.6 Degradation of TCS under Fenton reaction (addition of H2O2 in 3 instants of time)
0.00E+00
2.00E-04
4.00E-04
6.00E-04
8.00E-04
1.00E-03
1.20E-03
1.40E-03
1.60E-03
1.80E-03
0 2 4
g/l
TCS
Time (h)
Degradation TCS - Fenton
92%
95%
0.00E+00
2.00E-04
4.00E-04
6.00E-04
8.00E-04
1.00E-03
1.20E-03
1.40E-03
1.60E-03
1.80E-03
0 2 4
g/l
TCS
Time (h)
Degradation TCS - Fenton
90%
93%
82
83
Appendix IV – Resume of the main intermediate products founded in the literature
Table IV.1 Main Intermediate products reported in the literature
Identified Intermediates Reaction Author
Dichlorophenols (2,4-DCP), tetraclosans, mono-
chlorinated derivative of TCS, hydroxylated TCS and