The Astrophysical Journal, 799:14 (20pp), 2015 January 20 doi:10.1088/0004-637X/799/1/14 C 2015. The American Astronomical Society. All rights reserved. PHOTOCHEMISTRY OF POLYCYCLIC AROMATIC HYDROCARBONS IN COSMIC WATER ICE: THEROLE OF PAH IONIZATION AND CONCENTRATION Amanda M. Cook 1 , Alessandra Ricca 2 , Andrew L. Mattioda 1 , Jordy Bouwman 3 , Joseph Roser 1 , Harold Linnartz 4 , Jonathan Bregman 1 , and Louis J. Allamandola 2 1 NASA Ames Research Center, PO Box 1, M/S 245–6, Moffett Field, CA 94035, USA 2 SETI Institute, 189 North Bernardo Avenue, Mountain View, CA 94043, USA 3 Radboud University Nijmegen, Institute for Molecules and Materials, Toernooiveld 5, 6525 ED Nijmegen, The Netherlands 4 Sackler Laboratory for Astrophysics, Leiden Observatory, University of Leiden, PO Box 9513, NL2300 RA Leiden, The Netherlands Received 2014 September 6; accepted 2014 November 5; published 2015 January 12 ABSTRACT Infrared spectroscopic studies of ultraviolet (UV) irradiated, water-rich, cosmic ice analogs containing small polycyclic aromatic hydrocarbons (PAHs) are described. The irradiation studies of anthracene:H 2 O, pyrene:H 2 O, and benzo[ghi]perylene:H 2 O ices (14 K) at various concentrations reported by Bouwman et al. are extended. While aromatic alcohols and ketones have been reported in residues after irradiated PAH:H 2 O ices were warmed to 270 K, it was not known if they formed during ice irradiation or during warm-up when reactants interact as H 2 O sublimes. Recent work has shown that they form in low temperature ice. Using DFT computed IR spectra to identify photoproducts and PAH cations, we tentatively identify the production of specific alcohols [PAH(OH) n ] and quinones [PAH(O) n ] for all PAH:H 2 O ices considered here. Little evidence is found for hydrogenation at 14 K, consistent with the findings of Gudipati & Yang. Addition of O and OH to the parent PAH is the dominant photochemical reaction, but PAH erosion to smaller PAHs (producing CO 2 and H 2 CO) is also important. DFT spectra are used to assess the contribution of PAH-related species to interstellar absorption features from 5 to 9 μm. The case is made that PAH cations are important contributors to the C2 component and PAH(OH) n and PAH(O) n to the C5 component described by Boogert et al. Thus, interstellar ices should contain neutral and ionized PAHs, alcohols, ketones and quinones at the ∼2%–4% level relative to H 2 O. PAHs, their photoproducts, and ion-mediated processes should therefore be considered when modeling interstellar ice processes. Key words: astrochemistry – ISM: abundances – ISM: clouds – ISM: molecules – molecular data – molecular processes 1. INTRODUCTION Infrared (IR) astronomical observations indicate that photon- dominated regions (PDRs) contain large abundances of poly- cyclic aromatic hydrocarbons (PAHs), as evidenced by strong gas-phase PAH emission (Peeters et al. 2004; van Dishoeck 2004; Tielens 2008, and references therein). However, PAH emission is suppressed and ultimately extinguished moving into denser regions of the ISM where gas-phase species like PAHs condense onto very cold grains (T 30 K), largely as neutral PAHs frozen in H 2 O-rich mantles. IR absorption features de- tected at 3.3 μm (Smith et al. 1989; Sellgren et al. 1995; Brooke et al. 1999), 6.2 μm (Chiar et al. 2000; Keane et al. 2001), and 11.3 μm (Bregman et al. 2000) in the spectra of a limited number of young stellar objects (YSOs) have been attributed to PAHs. Hardegree-Ullman et al. (2014) suggest that frozen neutral PAHs account for 2%–9% of the unidentified absorption in the 5–8 μm spectral region of YSOs. Furthermore, the ice mantles frozen out onto the dust grains in dense clouds are subjected to irradiation by the attenuated UV photon field as well as cosmic ray impacts (e.g., Garozzo et al. 2011; Chang & Herbst 2014). These sources of energy can drive chemistry within the ice mantles by breaking molecular bonds, ionizing adsorbed molecules, or by locally heating the ice mantle. If these dust grains subsequently diffuse into regions with strong UV radiation fields, the ice mantles will be sublimated and contribute a chemically enriched population of molecules to the gas-phase chemistry. It is expected that PAHs and PAH-derived molecules also play a role in this enriched gas-phase chemistry. Laboratory studies have been performed to measure the IR spectra of neutral PAHs in water ices (Sandford et al. 2004; Bernstein et al. 2005a, 2005b) and of PAH cations in solid H 2 O (Bernstein et al. 2007) with the goal of helping in the detection of PAHs in dense interstellar clouds. Due to the presence of very strong H 2 O ice bands overwhelming the much weaker PAH IR features, laboratory experiments typically use PAH:H 2 O concentrations that are higher than 1:50, which is estimated to be the PAH concentration in astrophysical ices (Bouwman et al. 2011b). Optical spectroscopy, which avoids this band blending, has successfully overcome this limitation. Together, these IR and optical studies have shown that PAHs in water ices subjected to UV irradiation can undergo ionization and photochemical reactions to produce oxidized aromatic compounds (Bernstein et al. 1999, 2003; Gudipati 2004; Gudipati & Allamandola 2006; Ashbourn et al. 2007; Guennoun et al. 2011a, 2011b; Bouwman et al. 2011b; Keheyan & ten Kate 2012). Computationally, Ricca & Bauschlicher (2000) have shown that the addition of the OH radical to neutral naphthalene and the naphthalene cation is barrierless. Utilizing the optical technique, Cuylle et al. (2014) recently examined the effects of PAH concentration (relative to H 2 O) on ionization efficiency. The ionization efficiency drops from over 60% at very low concentrations (1:10,000) to 15% at higher concentrations (1:1000). An earlier mid-IR study of UV photolyzed PAH:H 2 O ices (PAH = anthracene, pyrene, and 1
PHOTOCHEMISTRY OF POLYCYCLIC AROMATIC HYDROCARBONS IN COSMICWATER ICE: THE ROLE OF PAH IONIZATION AND CONCENTRATION
Amanda M. Cook1, Alessandra Ricca2, Andrew L. Mattioda1, Jordy Bouwman3, Joseph Roser1,Harold Linnartz4, Jonathan Bregman1, and Louis J. Allamandola2
1 NASA Ames Research Center, PO Box 1, M/S 245–6, Moffett Field, CA 94035, USA2 SETI Institute, 189 North Bernardo Avenue, Mountain View, CA 94043, USA
3 Radboud University Nijmegen, Institute for Molecules and Materials, Toernooiveld 5, 6525 ED Nijmegen, The Netherlands4 Sackler Laboratory for Astrophysics, Leiden Observatory, University of Leiden, PO Box 9513, NL2300 RA Leiden, The Netherlands
Received 2014 September 6; accepted 2014 November 5; published 2015 January 12
ABSTRACT
Infrared spectroscopic studies of ultraviolet (UV) irradiated, water-rich, cosmic ice analogs containing smallpolycyclic aromatic hydrocarbons (PAHs) are described. The irradiation studies of anthracene:H2O, pyrene:H2O,and benzo[ghi]perylene:H2O ices (14 K) at various concentrations reported by Bouwman et al. are extended.While aromatic alcohols and ketones have been reported in residues after irradiated PAH:H2O ices were warmedto 270 K, it was not known if they formed during ice irradiation or during warm-up when reactants interact asH2O sublimes. Recent work has shown that they form in low temperature ice. Using DFT computed IR spectra toidentify photoproducts and PAH cations, we tentatively identify the production of specific alcohols [PAH(OH)n]and quinones [PAH(O)n] for all PAH:H2O ices considered here. Little evidence is found for hydrogenation at14 K, consistent with the findings of Gudipati & Yang. Addition of O and OH to the parent PAH is the dominantphotochemical reaction, but PAH erosion to smaller PAHs (producing CO2 and H2CO) is also important. DFTspectra are used to assess the contribution of PAH-related species to interstellar absorption features from 5 to 9 μm.The case is made that PAH cations are important contributors to the C2 component and PAH(OH)n and PAH(O)nto the C5 component described by Boogert et al. Thus, interstellar ices should contain neutral and ionized PAHs,alcohols, ketones and quinones at the ∼2%–4% level relative to H2O. PAHs, their photoproducts, and ion-mediatedprocesses should therefore be considered when modeling interstellar ice processes.
Infrared (IR) astronomical observations indicate that photon-dominated regions (PDRs) contain large abundances of poly-cyclic aromatic hydrocarbons (PAHs), as evidenced by stronggas-phase PAH emission (Peeters et al. 2004; van Dishoeck2004; Tielens 2008, and references therein). However, PAHemission is suppressed and ultimately extinguished moving intodenser regions of the ISM where gas-phase species like PAHscondense onto very cold grains (T � 30 K), largely as neutralPAHs frozen in H2O-rich mantles. IR absorption features de-tected at 3.3 μm (Smith et al. 1989; Sellgren et al. 1995; Brookeet al. 1999), 6.2 μm (Chiar et al. 2000; Keane et al. 2001),and 11.3 μm (Bregman et al. 2000) in the spectra of a limitednumber of young stellar objects (YSOs) have been attributedto PAHs. Hardegree-Ullman et al. (2014) suggest that frozenneutral PAHs account for 2%–9% of the unidentified absorptionin the 5–8 μm spectral region of YSOs.
Furthermore, the ice mantles frozen out onto the dust grainsin dense clouds are subjected to irradiation by the attenuatedUV photon field as well as cosmic ray impacts (e.g., Garozzoet al. 2011; Chang & Herbst 2014). These sources of energy candrive chemistry within the ice mantles by breaking molecularbonds, ionizing adsorbed molecules, or by locally heatingthe ice mantle. If these dust grains subsequently diffuse intoregions with strong UV radiation fields, the ice mantles will besublimated and contribute a chemically enriched population ofmolecules to the gas-phase chemistry. It is expected that PAHs
and PAH-derived molecules also play a role in this enrichedgas-phase chemistry.
Laboratory studies have been performed to measure the IRspectra of neutral PAHs in water ices (Sandford et al. 2004;Bernstein et al. 2005a, 2005b) and of PAH cations in solid H2O(Bernstein et al. 2007) with the goal of helping in the detection ofPAHs in dense interstellar clouds. Due to the presence of verystrong H2O ice bands overwhelming the much weaker PAHIR features, laboratory experiments typically use PAH:H2Oconcentrations that are higher than 1:50, which is estimated tobe the PAH concentration in astrophysical ices (Bouwman et al.2011b). Optical spectroscopy, which avoids this band blending,has successfully overcome this limitation. Together, these IR andoptical studies have shown that PAHs in water ices subjectedto UV irradiation can undergo ionization and photochemicalreactions to produce oxidized aromatic compounds (Bernsteinet al. 1999, 2003; Gudipati 2004; Gudipati & Allamandola 2006;Ashbourn et al. 2007; Guennoun et al. 2011a, 2011b; Bouwmanet al. 2011b; Keheyan & ten Kate 2012). Computationally, Ricca& Bauschlicher (2000) have shown that the addition of the OHradical to neutral naphthalene and the naphthalene cation isbarrierless.
Utilizing the optical technique, Cuylle et al. (2014) recentlyexamined the effects of PAH concentration (relative to H2O)on ionization efficiency. The ionization efficiency drops fromover 60% at very low concentrations (1:10,000) to 15% athigher concentrations (1:1000). An earlier mid-IR study of UVphotolyzed PAH:H2O ices (PAH = anthracene, pyrene, and
The Astrophysical Journal, 799:14 (20pp), 2015 January 20 Cook et al.
benzo[ghi]perylene) showed that the production of PAH pho-toproducts is also dependent on PAH concentration (Bouwmanet al. 2011b).
The present work extends the Bouwman et al. (2011b)study by characterizing the types of photoproducts formed bycomparing experimental spectra with DFT computed spectra. Inaddition, this work also quantifies the concentration dependenceof two main aspects of PAH reactivity in H2O ice:the formationof aromatic photoproducts that do not degrade the parent PAH,and PAH erosion to form CO2 and H2CO. We primarily focusupon varying the concentration of anthracene in water ice forUV irradiation studies and use similar UV irradiation of pyreneand benzo[ghi]preylene in water ice at high concentration ascomparison experiments.
This extensive study, which includes theoretically calculatedspectra of predicted photoproducts, quantifies the most impor-tant factors for the evolution of PAHs in astrophysical ices:ionization, oxygenation, hydroxylation, and erosion to smallerPAHs and stable end products. The laboratory and theoreticalspectra presented here provide deep insight to the interpretationof IR absorption bands observed in the dense interstellar medium(Gibb & Whittet 2002; Boogert et al. 2008), particularly from5–9 μm.
2. EXPERIMENTAL TECHNIQUE ANDTHEORETICAL METHODS
2.1. Laboratory Methods
The experimental techniques used for this study have been de-scribed elsewhere (Hudgins et al. 1994; Bouwman et al. 2011b).Here we describe the details relevant for this particular work.Samples were prepared by vapor co-deposition of H2O and a sin-gle PAH species onto a cryogenically cooled, IR-transparent CsIwindow suspended in vacuum (P � 10−8 Torr) with the windowtemperature held at 15 K throughout the experiment. Water va-por is Milli-Q grade filtered, deionized water with contaminantgases removed by three freeze–pump–thaw cycles. PAH vaporwas thermally sublimated from a sample kept within a pyrextube hermetically sealed to the vacuum chamber. To preparedifferent levels of PAH:H2O concentrations, the PAH deposi-tion temperature was varied between experiments, while theH2O flow remained constant.
The column density of H2O deposited onto the window ineach experiment was calculated as in Bouwman et al. (2011b),using H2O band strength values from Hudgins et al. (1993).Three different PAH molecules are considered here, namelyanthracene (“Anth” C14H10, Aldrich, 100%), pyrene (“Py”,C16,H10, Aldrich, 99%), and benzo[ghi]perylene (“BghiP”,C22H12, Aldrich, 98%). Their structures are shown in Figure 1,labeled a1, p1 and b1, respectively. The PAH column density isdetermined using the average of four or five of the strongest PAHbands for each PAH and the absolute band intensities calculatedby Bouwman et al. (2011b).
Once ice deposition was complete, the mid-IR spectrum ofthe neutral (i.e., un-photolyzed) PAH:ice sample was measuredfor each sample. Next, each ice sample was photolyzed withUV radiation from a flowing-H2, microwave discharge lamp.The reported radiation spectrum from this type of lamp in-cludes Lyα (121.6 nm) and a complex of molecular H2 linescentered at 160 nm; we assume a total UV photon flux of∼1015 photons cm−2 s−1 at the ice surface based on mea-surements of analogous lamp models and parameters (Warneck1962; Allamandola et al. 1988; Cook et al. 2014).
A BioRad Excalibur FTS 4000 FTIR spectrometer with a KBrbeamsplitter and a liquid-N2 cooled MCT detector was used tomeasure absorption spectra, in transmission, of the depositedices. Each spectrum reported here represents 512 co-addedspectral scans recorded at 0.5 cm−1 resolution. Backgroundspectra were collected just before ice deposition. Additionalspectra were recorded after 0, 5, 10, 15, 30, 60, 120, and (usually)180 minutes of cumulative UV exposure of the newly depositedice layer.
2.2. Continuum Determination and Baseline Correction
Integration of PAH bands requires careful attention to con-tinuum determination, particularly since our continua are dom-inated by strong H2O bands.
The underlying continuum is typically smooth for neutral iceswith PAH bands in the 1650–1000 cm−1 region and can be ap-proximated with a spline fit to regions with no absorption bands.However, some of the weaker photoproducts can be difficult topick out of the continuum once the ices are photolyzed. It ismuch easier to discern photoproduct bands when a spectrum ofthe neutral species is subtracted from the photolyzed spectrum.It is possible, in principle, to subtract a multiplicative factor of agiven neutral spectrum from a photolyzed spectrum, fine tuningthe subtraction factor so that all neutral species are perfectlyremoved. However, we note that this fine-tuning often resultsin a difficult comparison of the spectra as different photolysistimes are investigated for a given experiment; sometimes it isunclear whether weakly observed features (particularly thosethat appear near strong neutral bands) are the result of varyingsubtraction factors, or whether they are real photoproduct bandsgrowing in. Therefore, to remove this confusion, the subtractionfactor of one was used for all of our neutral-subtracted spectra.
Once neutral spectra are subtracted from photolyzed spec-tra, the positive bands should be the result of photoproducts.However, both the narrow individual bands and the broad wa-ter bands that form the underlying continuum are affected byphotolysis. The region around 1600 cm−1 requires special at-tention because the H–O–H bending mode of water shifts tohigher frequencies upon photolysis. Consequently, subtractingthe neutral spectrum from the photolyzed spectrum introducessome artifacts. For this reason, many of the neutral-subtractedspectra presented in this paper are not baseline-corrected in theregion from 1640 to 1500 cm−1. By skipping the baseline correc-tion for this region, we can more easily identify oversubtractionartifacts and baseline shifting artifacts. Baseline correction isgenerally possible for neutral-subtracted spectra at frequenciesbelow 1500 cm−1, as reflected in our figures.
2.3. Theoretical Methods
2.3.1. Computed PAH IR Spectra
The structures for each of the three PAHs studied here werefully optimized by finding the three-dimensional arrangementof the atoms that minimizes the total energy and the harmonicfrequencies computed using density functional theory (DFT).We used the hybrid B3LYP functional (Becke 1993; Stephenset al. 1994) in conjunction with the 6–31G∗ basis set of Frischet al. (1984). The computed B3LYP/6–31G∗ harmonic frequen-cies were scaled to lower frequencies using two scale factors,namely 0.972 for non-C–H stretches and 0.96 for C–H stretches,as required for agreement with the measured experimentalfundamental frequencies of PAH molecules isolated in argonmatrices (Bauschlicher & Ricca 2010).
2
The Astrophysical Journal, 799:14 (20pp), 2015 January 20 Cook et al.
Figure 1. Structures of the PAHs and PAH-related species computationally considered here: anthracene (“a”), pyrene (“p”), and benzo[ghi]perylene (“b”), their cations,and predicted UV photoproducts due to OH- and O-substitution. Corresponding calculated spectra are shown in Figure 3.
The positions of the non-C–H stretching vibrational modescomputed using the 6–31G∗ basis set have an averageabsolute error of 7.1 cm−1 and a maximum absolute errorof 22.4 cm−1. The positions of the C–H stretching vibra-tional modes have an average absolute error of 2.5 cm−1
and a maximum absolute error of 5 cm−1 (Bauschlicher &Ricca 2010). The ketone stretching frequencies (νC−O) have
larger errors than the other functional groups and need to bescaled by 0.952 to match experiment. To aid visual compar-ison with the experimental spectra, we broadened our com-puted results with a 5 cm−1 FWHM, Gaussian profile for allbands.
All calculations were performed using the Gaussian 09program (Frisch et al. 2009) and the interactive molecular
3
The Astrophysical Journal, 799:14 (20pp), 2015 January 20 Cook et al.
graphics tool MOLEKEL (Flukiger et al. 2000) was used toaid the analysis of the vibrational modes.
2.3.2. Computed PAH Monomer and Aggregate Fractions
The monomer fraction has been estimated using the modeldescribed in Roser et al. (2014), in which each PAH molecule ismodeled as the union of sphere-swept disks, one for each ring inthe aromatic structure. Numerical results are developed in threesteps. First, trial molecules are randomly distributed throughouta cubic trial space with each molecule given a random orien-tation. Second, a procedure to resolve overlapped molecules isapplied. Finally, the volume fraction occupied by the survivingPAH molecules and the monomer fraction (i.e. the number ofsurviving molecules with no nearest neighbor within a cut-offdistance of 5 Å) is computed using only the interior volumeof original trial space to avoid edge effects. To connect experi-mental results to the model output, we assume that the volumefraction occupied by PAH molecules is simply proportional tothe PAH:H2O column density ratio by a factor of 6.45 for an-thracene, 7.15 for pyrene, and 9.50 for benzo[ghi]perylene. Themonomer fraction for the experimental matrix deposits is thendetermined by fitting an exponential curve to the computedmonomer fraction as a function of one minus the filled volumefraction and then interpolating. Applying this model (Roser et al.2014) shows that the monomer fraction for anthracene is approx-imately: 67% for PAH:H2O = 1:770, 59% for 1:590, 28% for1:260, 0.4% for 1:80 and 0% for 1:20. The monomer fractionfor pyrene is approximately 4% for 1:110, 1% for 1:90 and 0%for 1:70. For benzo[ghi]perylene, the monomer fraction is 28%for 1:310, 5% for 1:150, and 0% for 1:70. These results indicatePAH monomers will be important at low PAH concentrations.Conversely, PAH clusters become very important at high PAHconcentrations.
3. RESULTS
3.1. Theoretically Calculated IR Spectra of PAH Photoproducts
As will be shown below, the principle PAH-related photo-products initially formed include PAH cations, alcohols, andketones. After first generating PAH cations, UV photolysis ofPAHs in water ice is expected to produce aromatic alcoholsas the first chemical photoproducts within the ice; with in-creasing photolysis time, these aromatic alcohols are then ex-pected to transform into ketones (Gudipati 2004; Gudipati &Allamandola 2006; Ashbourn et al. 2007; Guennnon et al.2011a, 2011b; Gudipati & Yang 2012; Yang & Gudipati 2014).For example, the UV irradiation of phenol, the simplest aromaticalcohol, induces the breaking of the O−H bond to form a phe-noxyl radical (Giuliano et al. 2012); see Figure 2. If hydrogenatoms are present, as expected from the UV-irradiated H2O aswell as the other phenols in the ice, they can recombine with thephenoxyl radical to form either the phenol or a ketone (Guen-noun et al. 2011a, 2011b). From this step, two ketone isomerscan then form, namely 2,4- or 2,5-cyclohexadienone. Decompo-sition of the ketone occurs via the 2,4-cyclohexadienone isomer,which is a photochemically unstable α-ketone and undergoes aring opening to form a ketene. Ketenes are unstable and can thenfurther decompose either by losing a CO molecule (Dauben et al.1975; Giuliano et al. 2012) or form an alcohol.
Spectroscopically, aromatic alcohols have three main charac-teristic modes in the 1400–1000 cm−1 region as exemplified byphenol, the simplest of the aromatic alcohols (Michalska et al.1996; Giuliano et al. 2012). First, the O−H in-plane bending
Figure 2. Schematic showing the decomposition of phenol, the simplestaromatic alcohol, upon UV photolysis (see Section 3.1).
mode (δO−H, near 8.3 μm) usually has a strong intensity. It cou-ples with the skeletal C−C stretching (νC−C) and the in-planeC−H bending (δC−H) modes to produce a second band denotedas νC−C + δC−H + δO−H, which falls near 8 μm. Third, theX-sensitive mode (Xsens), where X represents the substitutedgroup or atom, involves the motion of both the phenyl ring andthe attached group; this mode falls near 7.6 μm.
PAH cations are also known to have much stronger bands inthe 1650–1000 cm−1 range than their neutral counterparts (e.g.,Allamandola et al. 1999, and references therein). Replacing anH atom on the periphery of a PAH with an electron-withdrawingsubstituent, such as OH or double bonded O, creates a positivecharge localized on the attached carbon in the ring, but has littleeffect on the charge of the remaining carbon atoms. This hasthe effect of increasing the intensities of the modes involvingthe C−X bond.
To characterize the PAH photoproducts produced in ourexperiments we compute the IR spectra of several isomers ofOH-substituted(alcohol) and CO-substituted (ketone)Anth, Py,and BghiP, which are shown in Figure 1 (structures) and Figure 3(spectra). For simplicity, we denote Anth as “a”, Py as “p”,and BghiP as “b”. Other mono-substituted ketones besides a6have been computed for Anth (including the photochemicallyunstable α-ketones shown in Figure 2). However, these speciesonly produced weak bands in the 1650–1000 cm−1 region andare not shown in Figure 3. In Figure 3, the spectra of neutral Anth(a1), Py (p1), and BghiP (b1) are multiplied by a factor of fiveor six since the neutral band intensities in the 1650–1000 cm−1
range are considerably smaller than the band intensities of cationstructures a2, p2, and b2.
Our theoretical studies are focused on the 1650–1000 cm−1
spectral region, to compare with experimental data that does notsuffer from overlap with the broad H2O bands.
All of the mono-substituted alcohols shown in Figure 3have their strongest bands in the 1350–1100 cm−1 region. Theposition of the δO−H, Xsensand νC−C + δC−H + δO−H bands
4
The Astrophysical Journal, 799:14 (20pp), 2015 January 20 Cook et al.
Figure 3. Theoretically calculated IR spectra for neutral and ionized Anth, Py, and BghiP, along with theoretical spectra of predicted photoproducts resulting from OH(alcohols)- and O-(ketones and quinones) substitution. See Figure 1 for the structures corresponding to the spectral identification a1, a2, . . . , a8, etc. Band frequencies >
∼30 km mol−1 are listed in Tables 1–3.
5
The Astrophysical Journal, 799:14 (20pp), 2015 January 20 Cook et al.
Table 1Anthracene Photoproduct Bands
Position Position I. A. in H2O after Theoretically Predicted Bands Band Strengths of Possible Photoproduct(cm−1) H2O (cm−1) Argona 15 minutes of UVb within ±/−20 cm−1 of measured Theoretical Bands Species (modes: δ, x, ν)
Notes. Theoretical spectra from 1650–1000 cm−1 are shown in Figure 3. The abbreviation “sh” stands for shoulder. These bands are manifested as a shoulder on theside of another nearby band. The abbreviation I.A. stands for integrated absorbance.a From Bouwman et al. (2011a). Columns with a “–” were not reported or sought in Bouwman et al. (2011a).b The integrated absorbances (I.A.) reported here correspond to the Anth:H2O = 1:590 mixture.c Only predicted bands with band strengths >30 km mol−1 are reported.d CO stretch of H2CO has a band strength of 9.6e-18 cm per molecule, from Schutte et al. (1996).δ δO−H band.x Xsens band.ν νC−C + δC−H + δO−H band.
varies depending on the position of the substitution. The finalcolumns of Tables 1–3 highlight these particular vibrationalmodes with “δ,” “x”, and “ν” superscripts, for the δO−H, Xsensand νC−C + δC−H + δO−H bands, respectively.
Overall, the δO−H and the Xsens modes are those with thestrongest intensities. The δO−H bands occur between 1170 and1230 cm−1 for Anth and Py. For BghiP, which has more sitesavailable for substitutions, the range in positions is greater, from1130 to 1290 cm−1. The Xsens bands usually fall between 1200and 1350 cm−1. The νC−C + δC−H + δO−H bands fall between1350 and 1450 cm−1.
For the aromatic ketones, the peak with the strongest intensityin the 1200–1300 cm−1 range is due to a δCH mode which iscoupled, in most cases, with the CH2 wag. For Anth this peakfalls short of 1300 cm−1 and for Py the position ranges between1240 and 1280 cm−1. As shown in Figure 3, BghiP has severalpeaks with similar intensities between 1200 and 1400 cm−1.The strongest aromatic ketone band, the C=O stretch, generallyfalls in the 1600–1700 cm−1 region, the region obscured by theH−O−H bending mode in our experiments.
As shown in Figure 3 and discussed above, the frequencies ofvarious functional groups can be distinct for a single molecular
species. However the mid-IR region becomes increasinglycomplex when the possibility exists for multiple photoproductsto form, as is the case here. Given the overlapping functionalgroup vibrational frequencies, we have utilized various datareduction techniques to extract as much information as possiblefrom the experimental spectra in this region. These techniques,described below, include correlation plots comparing variousphotolysis-induced band growth rates. If separate, distinct bandsare correlated in their growth rates, they are assumed to comefrom the same photoproduct.
3.2. Experimental Results
3.2.1. PAH Neutral and Photoproduct Spectra
As shown below, many of the theoretical photoproduct spec-tra discussed in Section 3.1 contain bands which either overlapwith, or are very close to, other photoproduct bands in the IRwindows accessible to our investigation (i.e., 1000–1650 cm−1).This is due to the fact that this region corresponds to theC−C and C–H in-plane motions. In addition, the intensityof these bands is significantly increased by heteratom sub-stitution, sidegroup addition, or ionization (Langhoff 1996;
6
The Astrophysical Journal, 799:14 (20pp), 2015 January 20 Cook et al.
Table 2Pyrene Photoproduct Bands
Position Position I. A. in H2O after Theoretically Predicted Bands Band Strengths of Possible Photoproduct(cm−1) H2O (cm−1) Argona 15 minutes of UVb within ±/−20 cm−1 of measured Theoretical Bands Species (modes: δ, x, ν)
Notes. Theoretical spectra from 1650–1000 cm−1 are shown in Figure 3. The abbreviation I.A. stands for integrated absorbance.a From Bouwman et al. (2011a). Columns with a “–” were not reported or sought in Bouwman et al. (2011a).b The integrated absorbances (I.A.) reported here correspond to the Py:H2O = 1:110 mixture.c Only predicted bands with band strengths >30 km mol−1 are reported.d CO stretch of H2CO has a band strength of 9.6e-18 cm per molecule, from Schutte et al. (1996).δ δO−H band.x Xsens band.
Bauschlicher & Langhoff 1997; Mattioda et al. 2003, 2005;Hudgins et al. 2005). The PAH electron distribution is disruptedin all cases, resulting in larger dipole derivatives associated withthe vibration of the C−C and C−H in-plane modes.
To narrow down the identity of specific photoproducts,we focus on vibrational regions that are specific to cer-tain photoproduct chemical classes and seek correlations be-tween bands belonging to a specific photoproduct. As noted inSection 3.1 and Figure 3, the overlap of predicted photoprod-uct bands makes them challenging to distinguish in experi-mental spectra. The panels above the experimental spectra inFigure 4 illustrate this: cations, alcohols, ketones, and quinoneshave many bands with very similar frequencies. In each panel,vertical lines represent the positions of theoretically predictedbands. Red, cyan, and gray lines represent predicted positionsof cations (PAH + ), alcohols (PAH(OH)n), and quinones andketones (PAH(O)n), respectively. Only theoretically calculatedbands with strengths larger than ∼30 km mol−1 are included;we do not expect to be able to detect many of the weaker(<30 km mol−1) bands in our experimental spectra. The posi-tions of these vertical lines correspond directly to the positionsshown in Figure 3, and listed in Tables 1–3. These serve to illus-trate the wide range of possibilities for assignment of the actualphotoproducts.
Each panel of Figure 4 shows spectra of neutral, photolyzed,and neutral-subtracted (photolyzed spectrum minus neutralspectrum) PAH:H2O ice samples for both a low- (black traces)and high- (blue traces) PAH concentration case. Photoproductbands are detected most strongly in ice mixtures with low PAHconcentrations. As Figure 4 shows, many of the photoproductbands are not detectable at high PAH concentrations, perhaps
due to very low abundance (not necessarily absence) in thoseices. Despite the crowding of theoretical band positions, someconclusions can be drawn from the experimental spectra.
The first column of Tables 1–3 lists the photoproduct bands(including cations) in H2O ice, and the second column showsthe corresponding wavelengths of those photoproducts in argonmatrices, reported by Bouwman et al. (2011b). Note that bandstend to shift depending on the surrounding matrix material.
In the third column of Tables 1–3, we list theoretically pre-dicted bands (only those with band strengths A > 30 km mole−1)within ±20 cm−1 of the detected photoproduct bands. The fourthcolumn lists the band strengths for each of the theoretical bands.Presumably, species with larger band strengths contribute moresignificantly to the detected photoproduct bands. The possibleassignments for detected photoproducts are listed in the finalcolumns of Tables 1–3. These are not unambiguous assign-ments. The abbreviations refer to the theoretical structures andspectra shown in Figures 1 and 3.
3.2.1.1. Anthracene
Low- and high-concentration anthracene spectra inFigure 4(a) correspond to monomer fractions of 28% and 0%respectively (computed as described in Section 3.2.1). Two ofthe cation bands are somewhat isolated, i.e., not crowded byother predicted photoproduct bands, falling at 1542 cm−1 and1584 cm−1. The corresponding experimental band positionsin H2O ices are at 1541 and 1589 cm−1. These cation bandsappear most clearly in the experimental spectra of the pho-tolyzed, Anth:H2O low PAH concentration ices (e.g., top blacktrace). Evidence for these cation bands in the Anth:H2O highPAH concentration ices (e.g., top blue trace) is very weak.
7
Th
eA
strophysical
Journ
al,799:14(20pp),2015
January20
Cook
etal.
Table 3Benzo[ghi]perylene Photoproducts
Position Position I. A. in H2O after Theoretically Predicted Bands Band Strengths of Possible Photoproduct(cm−1) H2O (cm−1) Argona 15 minutes of UVb within ±/−20 cm−1 of measured Theoretical Bands Species (modes: δ, x, ν)
Notes. Theoretical spectra from 1650–1000 cm−1 are shown in Figure 3. The abbreviation I.A. stands for integrated absorbance.a From Bouwman et al. (2011a). Columns with a “–” were not reported or sought in Bouwman et al. (2011a).b The integrated absorbances (I.A.) reported here correspond to the Bghi:H2O = 1:310 mixture.c Only predicted bands with band strengths >30 km mol−1 are reported.d CO stretch of H2CO has a band strength of 9.6e-18 cm per molecule, from Schutte et al. (1996).δ δO−H band.x Xsens band.ν νC−C + δC−H + δO−H band.
8
The Astrophysical Journal, 799:14 (20pp), 2015 January 20 Cook et al.
(a)
(b)
(c)
Figure 4. Laboratory IR spectra for neutral and UV-photolyzed PAH:H2O ices: (a) black traces are Anth:H2O 1:590 and blue traces are Anth:H2O 1:20, (b) Py:H2O1:110 in black, and Py:H2O 1:70 in blue, (c) BghiP:H2O 1:310 in black, and BghiP:H2O 1:70 in blue. The key to the spectra labels to the right of the plot are: (i)–(iii)neutral (0), photolyzed (UV) for 15 minutes, and neutral-subtracted (UV-0) high PAH concentration ice mixtures respectively; and (iv)–(vi) neutral, photolyzed for15 minutes, and neutral-subtracted low PAH concentration ice mixtures, respectively. In the panels above each set of spectra, vertical red, cyan, and gray lines arethe DFT computed positions of cation bands, PAH-derived alcohols, and PAH-derived ketones/quinones, respectively. Only computed band positions with predictedband strengths larger than ∼30 km mol−1 are included. The vertical green lines within the panels of spectra indicate positions of detected photoproduct features;other apparently “new features” that are unmarked by vertical lines are either the result of over-subtraction around strong neutral bands or due to baseline shift. SeeSection 2.2 for details on spectral subtraction and baseline determination.
Although the vertical red (cation) lines at 1190, 1352, 1407 and1460 cm−1 overlap with cyan (OH-substituted) and gray (CO-substituted) lines, based on band strengths, we attribute the bulkof the 1190, 1340, 1419, 1459 cm−1 bands to the anthracenecation.
Apart from these few bands that can be assigned withreasonable confidence to the cations, bands that arise from thesame species can be identified using correlation plots. This isillustrated in Figure 5, which shows that a correlation exists(R = 0.98) for the growth of the 1157 and 1326 cm−1 bands,
9
The Astrophysical Journal, 799:14 (20pp), 2015 January 20 Cook et al.
Figure 5. Example of how photoproduct correlations are identified. Black datapoints (and black axes) show similar growth patterns between the 1157 and1326 cm−1 bands in photolyzed Anth; the correlation (R = 0.98) between thesebands indicates that they form in tandem. Red data points (and red axes) showa similar kind of correlation in the growth of the 1142 and 1232 cm−1 bands inphotolyzed Py (R = 0.92). See Section 3.2.1.1 for discussion.
at UV photolysis times of 10 through 180 minutes (black datapoints). Both of these bands appear to reach their maximumstrength around 60 minutes of photolysis time, and then start todecrease. This correlation points to anthraquinone (“a8,” fromFigure 2) as the carrier.
Using similar correlation plots, the bands in H2O at 1424(shoulder) and 1468 cm−1 can be assigned to the theoreticalbands at 1426 (OH) and 1469 (OH) cm−1 for 9-anthrol and2-anthrol (a4 and a5). Likewise, the experimental bands at 1389,1394 and 1459 cm−1 can be assigned to 1,4-dianthranone (“a7”).However, as we cannot detect the νC−O stretch band around1660 cm−1 and the O−H stretch around 3600 cm−1 due tothe overlap with the broad H2O–ice features we cannot fullyascertain if these specific anthrols and anthrones are present.The formation of anthrols and anthranones in our experimentsis consistent with the IR studies of Guennoun et al. (2011a,2011b) who showed that the near-UV photolysis of pyrene andcoronene with water in several matrices at low temperaturesproduced aromatic ketones and alcohols.
Several photoproduct bands also appear that are not directlyPAH-related, but most likely come from PAH photolysis prod-ucts. Bands due to CO2 (2341 cm−1 asymmetric stretch and649 cm−1 bending), CO (2136 cm−1) and C3O2 (2275 cm−1;Gerakines & Moore 2001), as well as a distinct features at2850 cm−1 and 1717 cm−1 grow in with photolysis. These arediscussed further in Sections 3.3 and 3.4.
3.2.1.2. Pyrene
Figure 4(b) shows the spectra for a 1:110 and a 1:70 Py:H2Oice; both fall in the high PAH:H2O concentration regime, withmonomer fractions of 4% and 0%, respectively. Both sets ofexperimental spectra confirm the presence of the Py cation afterphotolysis; theory predicts Py + lines at 1237, 1350, 1436, and1550 cm−1, with the 1350 and 1550 cm−1 bands having thelargest band strengths. We attribute the lines in our experimentalspectra at 1247, 1359, and 1553 cm−1 to the cation as theyare well within the uncertainties inherent in the theoreticalpredictions and the unknown shifts induced by the H2O–icematrix. The cation band predicted at 1436 cm−1 is not detected,
presumably because it falls in a region that is obscured by astrong, over-subtracted neutral Py band.
Table 2 also lists the noncation Py photoproduct bands,along with the theoretical lines that may correspond to thosedetections. Based on correlation plots as shown in Figure 5,all of the photoproduct bands below 1235 cm−1 appear tocorrespond to predicted positions for OH-substituted Py species(cyan lines in Figure 4(b)). Figure 5 shows that a correlationexists for the growth of the 1142 and 1232 cm−1 bands (red datapoints). The two bands appear to reach their maximum strengthat about 60 minutes of photolysis time. The trends are tightlycorrelated, with R = 0.92, and both are theoretically associatedwith the 2-hydroxypyrene and 4-hydroxypyrene, “p5” and “p3”in Figure 1. These two hydroxypyrenes are among the threesuggested by Guennoun et al. (2011a) as key intermediates inthe formation of the ketone end products in their photochemicalstudies of Py:H2O = 1:10, Py deposited on amorphous H2O,and Py:H2O:Ar (variable:1:50) deposited at 10 K followed byin situ photolysis with near UV radiation, λ > 235 nm.
Most of the Py photoproduct bands between 1320 and1600 cm−1 are attributed to Py + and Py ketones. The bandsat 1394 and 1483 cm−1 can be attributed to two forms of4-pyrenone, “p7” and “p8” in Figure 1. The 1318 cm−1 bandcan be attributed to the PyOH band at 1308 cm−1 (p3). The bandat 1340 cm−1 has contributions from both PyOH and Py=O.
As with anthracene, several photoproduct bands also appearin the Py:H2O ices that are not directly PAH-related, but prob-ably come from PAH photolysis products. Bands due to CO2(2341 cm−1 asymmetric stretch and 649 cm−1 bending), CO(2136 cm−1) and C3O2 (2275 cm−1; Gerakines & Moore 2001),as well as distinct features at 2850 cm−1 and 1717 cm−1 growin with photolysis. These are discussed further in Sections 3.3and 3.4.
3.2.1.3. Benzo[ghi]perylene
Figure 4(c) shows the spectra for low- and high-concentrationBghiP:H2O ices, with monomer fractions of 28% and 0%respectively. Due to the larger size of the molecule, and its morecomplex molecular structure, more possibilities exist for OHand CO isomers than for anthracene and pyrene. Consequently,significantly more photoproduct bands are expected, as reflectedin the panel above the spectra, which is quite crowded comparedto the corresponding panels for Anth and Py.
All eight of the predicted cation bands at 1218, 1220, 1311,1343, 1345, 1400, 1559, and 1571 cm−1 are visible in thephotolyzed spectra. As with the Anth:H2O ices, the BghiP cationbands appear most clearly in low concentration BghiP:H2O ices(e.g., top black trace). We tentatively assign the predicted bandsto the following experimental bands that grow with photolysis:1223, 1232, 1300, 1339, 1352, 1403, 1550, and 1578 cm−1.However, note that the experimental bands may also be partiallyexplained by the presence of other photoproducts. A goodexample is the photoproduct band at 1300 cm−1. While a cationband is predicted at 1311 cm−1, there are also many otherspecies, primarily ketones, that have bands in this region thatcould overlap with the cation band. The largest band strengthof a predicted feature that lies within ±20 cm−1 of the detectedband, is 118 km mol−1. It is from 1,6-benzo[ghi]perylene-one,at 1287 cm−1 (“b16” in Figures 1 and 3).
All the photoproduct bands listed in Table 3 between 1080and 1153 cm−1 are due to BghiP–OH photoproducts. Based onband strengths and correlations like those shown in Figure 5,the b3 and b6 forms shown in Figure 1 are expected to be the
10
The Astrophysical Journal, 799:14 (20pp), 2015 January 20 Cook et al.
Figure 6. Spectra of Anth:H2O (1:260) showing the growth of (a) the 2341 cm−1
CO2 band and (b) the 1717 cm−1 H2CO band with increasing photolysis time.See Sections 3.3 and 3.4 for discussion.
dominant alcohols. The experimental band at 1253 cm−1 can beattributed to both BghiP–OH and BghiP=O photoproducts.
As with anthracene and pyrene, several photoproduct bandsalso appear in the BghiP:H2O ices that are not directly PAH-related, but likely come from PAH photolysis products. Bandsdue to CO2 (2341 cm−1 asymmetric stretch and 649 cm−1
bending), CO (2136 cm−1) and C3O2 (2275 cm−1; Gerakines& Moore 2001), as well as distinct features at 2850 cm−1 and1717 cm−1 grow in with photolysis. These are discussed furtherin Sections 3.3 and 3.4.
3.3. CO2 Formation Yield as a Proxy for PAH Erosion
As discussed in Section 3.1 and illustrated in Figure 2, inaddition to stable aromatic alcohol and ketone formation, PAHoxidation by the water photoproducts, O and OH, can lead toedge ring rupture and, ultimately, CO production within theice. This CO can then react with the water photoproduct, OH, toform CO2 and release H (Noble et al. 2011). Therefore, CO2 pro-duction can be used as a proxy for PAH photo-decomposition,unlike the formation rates of aromatic alcohols and ketones,which track PAH modification. We use the 2341 cm−1 CO2band to track this process instead of the 2143 cm−1 band due tothe primary photoproduct CO for three reasons. The 2341 cm−1
CO2 band is clear and unperturbed in all of the photolysis spec-tra, it possesses an extraordinarily large integrated band strength(ACO2 ∼ 2 × 10⁻¹⁶ cm molecule−1 versus ACO ∼ 1 × 10⁻¹⁷ cmmolecule−1, e.g., Hudgins et al. 1993 and references therein.),and CO2 seems to be the major end product. Figure 6(a) showsthe growth of this band with photolysis in the Anth:H2O = 1:260ice. Figure 7 shows the growth in the integrated area of this bandplotted versus photolysis time for the different PAH:H2O con-centrations studied. The first observation to be drawn from theseplots is that, regardless of the PAH:H2O ratio, CO2 abundanceincreases with increasing photolysis time.
This behavior is similar to a trend observed by Oba et al.(2010) for the production of CO2 from CO molecules and OHradicals codeposited onto an aluminum substrate at differenttemperatures. At substrate temperatures of 10 K and 20 K, theyobserved a growth in CO2 up to a saturation point, an effect thatthey attributed to the very low mobility of CO and OH on thesurface at temperatures below 20 K, and by the growth in thenumber of trapping sites in the H2O ice layer that form duringtheir experiments.
Figure 7. Growth of the 2341 cm−1 CO2 band with photolysis time, for allPAH:H2O ice ratios studied here. All growth curves have been normalized tozero band area at 5 minutes of UV exposure. For PAH:H2O ratios above about1:300, lowering PAH concentrations results in higher CO2 production rates andhence higher erosion rates for the PAHs. However, panel (a) reveals that foreven lower PAH concentrations, CO2 formation drops.
The second conclusion to be drawn from the plots in Figure 7is that the rates of CO2 production increase with decreasingPAH:H2O concentration (that is, with more H2O) for all threePAHs, when concentrations range from tens of water moleculesper PAH molecule to ∼300 water molecules per PAH molecule.
11
The Astrophysical Journal, 799:14 (20pp), 2015 January 20 Cook et al.
Table 4Slopes of the Growth of the 2341 cm−1 CO2 Band Area as a Function of Photolysis Time and Concentration Shown in Figure 6
Anth:H2O ratio Slope Py:H2O ratio Slope BghiP:H2O ratio Slope(cm−1 min−1) (cm−1 min−1) (cm−1 min−1)
Table 4 lists the slopes derived from linear fits to the datashown in Figure 7. Perusal of Figure 7 shows anthracene andbenzo[ghi]perylene exhibit a similar, almost linear, absoluteCO2 growth pattern, with increasing slope values (see Table 4)from a PAH:H2O concentration of 1:20 to about 1:300. The CO2growth curves for pyrene show similar, but much less markedbehavior, presumably because they span a smaller concentrationrange. After 3 hr of UV irradiation, roughly 10% of the totalnumber of carbon atoms available in the Anth:H2O (1:260)ice is converted to CO2. At the start of the experiment therewere 6.3 × 10¹⁵ Anth0 cm−2. Since Anth contains 14 carbonatoms, the carbon atom reservoir is 8.8 × 1016 cm−2. After3 hr of photolysis, 2.5 × 10¹⁵ neutral anthracene moleculesremain (40% of the starting amount) and 1016 CO2 moleculeshave formed.
The results for anthracene shown in Figure 7(a) (see alsoTable 4) indicate that the trend of steepening slopes peaksfor PAH:H2O concentrations between about 1:300 and 1:600.For Anth:H2O = 1:590 and 1:770, the CO2 production ratedrops by about 10% at each step. After 2 hr of UV irradiation,roughly 1% of the total number of carbon atoms available in theAnth:H2O (1:770) ice are converted to CO2. At the start of theexperiment there were 2.7 × 10¹⁷Anth0 cm−2. Since each Anthmolecule contains 14 carbon atoms, the carbon atom reservoiris 3.9 × 1018 cm−2. After 2 hr of photolysis, 2.7 × 10¹⁵ neutralanthracene molecules remain (∼1% of the starting amount) and5 × 1015 CO2 molecules have formed.
Unfortunately, the studies for pyrene and benzo[ghi]perylenewere limited to higher PAH concentrations, so any turning pointswith respect to lower PAH concentration were not measured forthese species.
3.4. The Unusual 2850 cm−1 Band
Figure 8 shows the 3100–2700 cm−1 region of the spectrafor several Anth-, Py-, and BghiP- H2O ice mixtures to illustratethat a weak, broad feature centered near 2850 cm−1 grows inwith increasing photolysis time. The feature spans the regionfrom 2900 to 2800 cm−1 (FWHH ∼ 50 cm−1) and is evident, invarying strength, at all concentrations for the three PAHs stud-ied. Figure 9 plots the integrated band area of this feature versusphotolysis time for the different Anth:H2O concentrations stud-ied, similar to the presentation of the 2341 cm−1 CO2 band inFigure 7. In preparing Figure 9, all band areas for each concen-tration are normalized to the area of the band after five minutesof photolysis, when the band first appears. Since production ofthe 2850 cm−1 band carrier is very low in the high PAH con-centration ices, the data sets for the higher PAH concentrationcases have the largest errors due to the inherent difficulty in es-tablishing a stable baseline. The overall trend indicates that the2850 cm−1 band grows very slowly (if at all) with decreasingAnth concentration from Anth:H2O = 1:20 to 1:260, and that it
jumps dramatically between Anth:H2O = 1:260 and 1:590. Sim-ilar behavior is found for the high PAH concentration, Py:H2Oand BghiP:H2O ices. As noted above, the studies for pyrene andbenzo[ghi]perylene were limited to higher PAH concentrations,so any turning points with respect to lower PAH concentrationwere not measured for these species.
While both the 2850 and 2341 cm−1 bands are clearlyassociated with PAH photoproducts, comparing the behaviorof the 2850 cm−1 band for the anth:H2O ices in Figure 9 withthe behavior of the 2341 cm−1 band in Figure 7 indicates thatCO2 and the 2850 cm−1 band carrier form by very differentreaction networks that appear to be associated with either highor low PAH concentration ices. After 3 hr of UV irradiationfor all high PAH concentration ices (PAH:H2O 1:18 to 1:310)studied, the 2850 cm−1 feature is barely discernable, reaching amaximum, normalized “band’ area of less than 0.02. In contrast,the 2341 cm−1 CO2 band reaches a maximum that is between afactor of 10 and 40 times higher in these same ices. For the lowconcentration Anth:H2O = 1:593 and 1:765 ices, the behaviorreverses, with the 2850 cm−1 feature growing two to three timesfaster while CO2 production efficiency drops by some 10%.Since the 2850 cm−1 band falls in the region associated with CHstretching vibrations, its carrier must be produced by the reactionof PAHs and PAH photoproducts with H radicals. However, asshown below, the chemical nature of the carrier is far from clear.
While at first glance the 2850 cm−1 feature suggests a run-of-the-mill aliphatic carrier, close inspection rules out purealiphatic hydrocarbons. The top spectrum in Figure 8(c) showsthat the band is structureless, with endpoints that break fromthe continuum near 2910 and 2780 cm−1. This is not consis-tent with aliphatic materials containing methyl and methylenegroups. The symmetric and asymmetric CH stretching modes inmethyl (-CH3) and methylene (-CH2-) groups give rise to fourbands between roughly 2980 and 2840 cm−1, with the strongestlying between 2910 and 2980 cm−1, well outside the rangeof the 2850 cm−1 feature (e.g., Bellamy 1958; Silverstein &Bassler 1963). This holds for methyl- and methylene- contain-ing materials in the gas phase, condensed as low temperaturesolids, and trapped in water-rich ices (e.g., d’Hendecourt et al.1986; Allamandola et al. 1988 and references therein). This alsoholds for cyclic aliphatics such as cyclo-hexane (d’Hendecourtet al. 1986 and references therein) and hydrogenated PAHs(Hn-PAHs) containing both aromatic and aliphatic carbons(Bernstein et al. 1996). While it cannot be ruled out as cleanlyas these other aliphatic groups, the CH stretch associatedwith tertiary CH groups in pure aliphatic materials being re-sponsible for the 2850 cm−1 feature is highly unlikely. Thepeak position is a little off, 2880 cm−1 versus 2850 cm−1
(Bellamy 1958; Allamandola et al. 1992 and referencestherein) and, more importantly, it is difficult to reconcile theobservation that the 2850 cm−1 band is strongest in the dilute
12
The Astrophysical Journal, 799:14 (20pp), 2015 January 20 Cook et al.
Figure 8. 3100–2700 cm−1 spectra of different PAH:H2O ices showing the growth of the 2850 cm−1 feature as a function of UV photolysis time. Black, red,blue, cyan, magenta, chartreuse, and navy traces are spectra measured at 5, 10, 15, 30, 60, 120, and 180 minute photolysis times, respectively. Panels (a)–(c) showneutral-subtracted anthracene:H2O ices. Panels (d)–(f) show neutral-subtracted pyrene:H2O ices. Panels (g)–(i) show neutral-subtracted benzo[ghi]perylene:H2O ices.Note that the more dilute the PAHs mixtures are, the more pronounced the 2850 cm−1 bands are. See Section 3.4 for discussion.
anthracene experiments since anthracene has only 4 tertiarycarbons while pyrene and benzo(ghi)perylene have 6 and 9, re-spectively. We have found but one example of a hydrocarbonthat can produce such a feature. All the bands of the unusual
hydrocarbon 1,4,5,8,9,10-hexahydroanthracene that fall in thealiphatic CH stretching region lie between 2900 and 2800 cm−1
(Figure 9 in Sandford et al. 2013). As with tertiary CH, wealso consider this type of unusual fused ring compound as the
13
The Astrophysical Journal, 799:14 (20pp), 2015 January 20 Cook et al.
Figure 9. Growth of the 2850 cm−1 photoproduct feature with photolysis time,for each Anth:H2O ratio. All growth curves have been normalized to zero bandarea at five minutes of UV time. Anthracene shows a pronounced increase in the2850 cm−1 band area for PAH:H2O concentrations between 1:260 and 1:590.
carrier of the 2850 cm−1 highly unlikely. Inspection of aliphaticgroups adjacent to unsaturated groups such as carbonyls anddouble bonded carbon can also be ruled out (Silverstein &Bassler 1963).
Aldehydes are another type of chemical subgroup that couldbe responsible for the 2850 cm−1 feature because their CHstretching bands fall between 2900 and 2700 cm−1 (e.g.,Bellamy 1958; Silverstein & Bassler 1963). However, they havetwo bands of roughly equal intensity in this region, with onegenerally falling between 2760 and 2790 cm−1, outside theenvelope of the 2850 cm−1 feature. For example, the bands forthe simplest aldehyde, formaldehyde (H2CO), fall at 2843 and2766 cm−1 when it is in the gas phase (van der Zwet et al.1985 and references therein). While this suggests H2CO is notresponsible for the 2850 cm−1 feature, these bands undergounusually large blueshifts when the molecule is trapped indifferent ices. They fall at 2853 and 2785 cm−1 when it isfrozen in water ice at 10 K, and at 2896 and 2835 cm−1 whenit is trapped in a mixed molecular, cosmic ice analog comprisedof H2CO:NH3:H2O:CO2:CO (1:1:3:5:10) at 10 K(van der Zwetet al. 1985). Associated (solid) H2CO, produces bands at 2886and 2823 cm−1 (van der Zwet et al. 1985 and references therein).Speculating, it therefore seems plausible that H2CO and closelyrelated species containing an aldehydic subgroup could betrapped in different sites within the photolyzed ice, with eachsite inducing slightly different shifts. Band blending could thenproduce a broad feature that coincides with and contributes to theenvelope of the unusual 2850 cm−1 feature. This possibility canbe tested because formaldehyde possesses four other IR activemodes, with two very strong bands in H2CO:H2O = 100:3 icesat about 1720 and 1500 cm−1 and two weak bands near 1245and 1175 cm−1 (Schutte et al. 1993). The 1719 cm−1 integratedband strength is 2–5 times larger than that of the CH stretchingbands at 2886 and 2883 cm−1, while the 1496 cm−1 band isof comparable strength. Since the integrated strengths for the1245 and 1175 cm−1 bands are less than half that of the CHstretching bands, detecting the formation and growth of a bandnear 1720 cm−1 would support the suggestion of associatedH2CO being responsible for the 2850 cm−1 feature.
Figure 6(b) shows that a distinct band near 1720 cm−1
indeed grows in with photolysis. Band–band correlation plotsas discussed above show the band near 1720 cm−1 correlateswith both CO and CO2 growth, behavior that is required if the1720 cm−1 band originates in H2CO because it and CO2 formfrom CO. If this indeed originates with H2CO, a weak featurenear 1500 cm−1 should be evident. The UV-photolyzed spectrafor the anth:H2O ice experiments in Figure 4 show the growth ofa broad, structured feature between 1500 and 1530 cm−1 withFWHH ∼ 10 cm−1. The panel of computational photoproductspectra above the experimental spectra shows this feature fallsin a region that is devoid of predicted anthracene photoproductbands. The blueshift and breadth of the broad feature centerednear 1515 cm−1 is consistent with an origin in the types ofH2CO complexes that produce the broad 2850 cm−1 featurebecause both modes involve CH vibrations; that at 2850 cm−1
is produced by shifting and overlapping of the symmetric andasymmetric CH stretches (ν1 and ν4) and that near 1500 cm−1 bythe CH2 scissoring vibration (ν3). In view of this, together withthe observation that this feature is strongest and most clear in theanthracene experiments, in which the 2820 cm−1 band is mostdistinct, we tentatively ascribe both the 1720 and 1520 cm−1
bands to complexed formaldehyde. While the growth of the1720 cm−1 band is clear for the other PAH:H2O ices studiedhere, the case for the 1520 cm−1 band is not as clearcut for thesePAHs because this region is rich in parent and photoproductbands (see Figure 4).
4. DISCUSSION
4.1. The Importance of PAH Cations and the Role of PAHConcentration in Determining Bulk Ice Reactions
Before discussing the results presented in Section 3, it isimportant to put them in the context of what is already knownabout the affects of PAH concentration on PAH photochemistry,PAH isolation, and PAH clustering in low temperature waterice. First, consider PAH photolysis in water ice. Recent, elegant,laser desorption/ionization-TOF experiments (Gudipati & Yang2012; Yang & Gudipati 2014), coupled with earlier UV–VISspectroscopic studies show that immediately upon photolysis,in situ PAH ionization and stabilization is facile and rapid,with ionization yields and final products within the ice stronglydependent on ice composition, temperature, photolysis duration(Gudipati & Allamandola 2003, 2006; Bouwman et al. 2010,2011b), and PAH concentration (Bouwman et al. 2011a; Cuylleet al. 2014). The reasons for strong PAH ionization and possiblePAH cation reaction pathways with H2O radical photoproducts(H and OH) in UV photolyzed water ice are discussed in greatdetail elsewhere (Gudipati & Allamandola 2003; Woon & Park2004; Gudipati & Allamandola 2006; Bouwman et al. 2010,2011a). Regarding concentration, careful studies by Cuylle et al.(2014) have shown that ionization efficiency increases withdecreasing PAH:H2O concentration. They show that ionizationefficiency increases from 15% at concentrations of 1:1000 andhigher to over 60% at very low concentrations of less than1:10,000. The concentrations of most of the ices studied here fallin the 15% ionization efficiency range. However, the two mostdilute Anth:H2O ices (1:770 and 1:590) fall in the transitionregion described by Cuylle et al. Since anthracene is smallerthan the PAHs studied by Cuylle et al., at these concentrations,it likely has a higher monomer fraction and, therefore, slightlyhigher ionization efficiency.
14
The Astrophysical Journal, 799:14 (20pp), 2015 January 20 Cook et al.
As the PAH concentration increases from the most dilute casesstudied, the fraction of PAH monomers to PAH aggregates andclusters trapped within the ice decreases. As mentioned earlierin Section 2.3.2, our simple matrix isolation model suggests thatthe monomer fraction for anthracene drops from approximately67% for Anth:H2O = 1:770 to 0.4% for Anth:H2O = 1:80.Similarly, the pyrene monomer fraction is computed to dropfrom approximately 4% for Py:H2O = 1:110, to 0% forPy:H2O = 1:70. For benzo[ghi]perylene, the monomer fractionis computed to fall from 28% from BghiP:H2O = 1:310, to 0%for BghiP:H2O = 1:70.
We now discuss the results presented in Figure 7 and Table 4,considering first the high PAH concentration behavior up toPAH:H2O ∼ 300 for all three PAHs and then the two lowanth:H2O concentrations (Anth:H2O = 1:590 and 1:770).
High PAH Concentration. All the PAH:H2O > 1:300 exper-iments discussed here fall in the low PAH monomer and lowPAH ionization fraction (5%–15%) regime described by Cuylleet al. (2014). Neutral PAH reaction networks such as shown inFigure 2, along with similar studies of neutral PAHs with Hand OH (Dauben et al. 1975; Watanabe & Kouchi 2002; Obaet al. 2010; Noble et al. 2011; Giuliano et al. 2012), suggestPAH complexes and neutral PAHs dominate the chemistry thatproduces CO2. Perhaps the increase in the CO2 production slopeas the PAH concentration decreases can be rationalized in termsof the increase of PAH monomer fraction. PAH monomers willbe more reactive than the equivalent PAH moieties comprisingthe clusters simply because each PAH has more sites which areavailable for attack by excited OH and H radicals. Furthermore,besides having fewer sites available, PAH clusters should alsobe less reactive than the monomers due to shielding from the π -electrons. Thus, the more PAH monomers available, the greaterthe ultimate CO2 yield, but only up to a point. The similarityin the slopes for the pyrene case, which samples a restrictedconcentration range, supports this picture. However, if the frac-tion of PAH monomers is the only important factor determiningthe slope, the trend of increasing slope should continue for thetwo lower concentration anthracene studies. But, as shown inFigure 7(a), it does not. Instead, as discussed below, an entirelydifferent reaction network becomes dominant as PAH concen-tration drops below roughly 1:300.
Low PAH Concentration. In a recent study of the roletemperature plays in PAH:H2O ice photochemistry, Bouwmanet al. (2010) found that there are two distinct reaction pathways.At low temperatures (<50 K), the chemistry is largely governedby ion–molecule interactions and processes, and at temperaturesabove 50 K, reactions are dominated by diffusing radical species.We attribute the distinctly different behavior in CO2 productionat high and low concentrations similarly, namely the low PAHconcentration case (PAH:H2O < 1:300) favors PAH ion-drivenand ion-dominated reaction networks and processes while thehigh concentration case (PAH:H2O > 1:300) favors reactionnetworks dominated by neutral species. At face value, the twolow-concentration Anth:H2O studies (Anth:H2O = 1:590 and1:770) fall in the region where PAH ionization fraction startsto increase. However, as considered in the monomer fractionmodel used here because of its smaller size than the PAHsstudied by Cuylle et al. (2014), the anthracene monomer fractionis higher than those at the equivalent concentrations for largerPAHs because it requires fewer water molecules to isolate fromother trapped PAH molecules. In addition, determining PAHconcentrations in water ice using experimental UV–VIS bandstrengths, Hardegree-Ullman et al. (2014) recently reported
that the vibrational band strengths for pyrene are 1.5 timeshigher than the theoretically computed values used in the earlierBouwman et al. studies. If this is born out, and holds for PAHs ingeneral, the anthracene concentration should be reduced by thisfactor as well, resulting in the Anth:PAH 1:590 case droppingto <1:890 and the 1:770 case to <1:1160. Taken together, theseadjustments push the anthracene experiments into the regionwhere the PAH cation fraction starts to increase significantly(Cuylle et al. 2014). The implication from the plots shown inFigure 7(a) is that once reaction networks initiated by ionizedPAHs become important, the reaction scheme that results inPAH erosion and, ultimately, CO2 production is quenched.
These results increase our understanding of the PAH–iceproperties that determine the role concentration plays inPAH:H2O ice photochemistry. At high PAH concentrations(PAH:H2O > 1:1000) the chemistry is apparently dominatedby neutral reactions that primarily involve water photoproductsOH and H. As the concentration lowers, two factors come intoplay. First the fraction of PAH monomers to PAH clusters andcomplexes grows, increasing the number of free PAH moleculesthat can react with the radicals H and OH produced by the UVphotolysis of H2O. Second, as PAH concentration drops belowPAH:H2O ∼ 1:1000, PAH ionization and stabilization becomesincreasingly important because the number of H2O moleculesper PAH continually grows, providing an ever increasing num-ber of sites to trap electrons and add the thermodynamic stabilityassociated with the solvation energy of the isolated PAH cations(Gudipati & Allamandola 2006; Cuylle et al. 2014; Woon &Park 2004 and references therein).
Furthermore, Guennoun et al. (2011a, 2011b) showed thataromatic alcohols, ketones and quinones are formed by irradi-ating pyrene and coronene in low temperature H2O ices, notwith UV radiation, but with near-UV radiation (λ > 235 nm).This strongly supports the picture that PAH cations determinethe photochemical pathways followed in PAH:H2O ices. H2Ois transparent at wavelengths longer than about 220 nm, pro-duction of H and OH radicals is negligible at best, whilePAH ionization—provided it is in water ice—occurs readily(Gudipati & Allamandola 2003; Woon & Park 2004). The plotsof neutral anthracene loss and CO2 growth as a function of pho-tolysis time for different Anth:H2O concentrations shown inFigure 10 confirm this picture. At all concentrations, CO2growth is similar. It rises steadily and continuously with pho-tolysis time. In contrast, PAH loss behavior depends stronglyon concentration. After roughly 30 minutes of photolysis, neu-tral anthracene loss levels off at a value that is determined byconcentration. At the highest concentration (Anth:H2O = 1:20),only about 10% of the neutral anthracene is depleted whereasat the lowest concentration (Anth:H2O = 1:770), essentially allthe neutral anthracene is gone. As shown in earlier work, rapidconversion to the PAH cation accompanies, and mirrors, theinitial phase of neutral PAH loss. Thereafter, the PAH cationsignal drops (Gudipati & Allamandola 2003; Gudipati 2004,Bouwman et al. 2010, 2011a, 2011b), presumably as the finalalcohols, ketones and quinones form.
5. ASTROPHYSICAL IMPLICATIONS
Over the past 30 yr, IR spectroscopic observations madewith airborne and orbiting IR telescopes have provided greatinsight into, and a vast literature on, the ice and dust in densemolecular clouds and star forming regions (e.g., Keane et al.2001; Gibb & Whittet 2002; Schutte & Khanna 2003; Boogertet al. 2008; van Dishoeck 2004; Oberg et al. 2011 and references
15
The Astrophysical Journal, 799:14 (20pp), 2015 January 20 Cook et al.
Figure 10. Neutral anthracene loss (red squares) and CO2 growth (black squares)as a function of VUV irradiation time for the Anth:H2O ices studied here. Notethe contrast between the strong concentration dependence for neutral PAH lossand the slight concentration dependence for CO2 growth.
therein). Spectra in the 5–9 μm region have been critical tothis progress because atmospheric absorptions, combined withstrong interstellar ice and dust features, obscure much of the2.5–3.5 and 9–13 μm regions that are accessible via ground-based telescopes.
Apart from the well-known, moderately strong 6.0 and6.8 μm bands, the 5–9 μm spectra of dense clouds present manyweak to moderately strong features that vary along different linesof sight (e.g., Schutte et al. 1996; Keane et al. 2001; Gibb &Whittet 2002; Schutte & Khanna 2003; Boogert et al. 2008;Oberg et al. 2011 and references therein). Keane et al. (2001),Gibb & Whittet (2002) and Boogert et al. 2008 showed thatthe 6.0 μm band can be accounted for by the H–O–H bend inwater ice blended with an important residual contribution. Theresidual is comprised of two broad, weak features, one centerednear 5.83 μm (1715 cm−1, FWHH between 30 and 50 cm−1),the other centered near 6.3 μm (1590 cm−1, FWHM between30 and 60 cm−1; Keane et al. 2001). The 6.8 μm feature appearsto consist of at least two broad and varying components, onecentered about 6.75 μm (1480 cm−1) and one near 6.95 μm(1440 cm−1) (Keane et al. 2001; Schutte & Khanna 2003). Inaddition to these features between 5.5 and 7 μm, there are alsoseveral weak bands between 7 and 8 μm, roughly falling at7.25, 7.4, 7.58, and 7.68 μm (Schutte et al. 1996; Boogert et al.1996). In-depth, thorough discussions of these features and theirassignments are given by Keane et al. (2001), Schutte & Khanna(2003), Boogert et al. (2008), and Oberg et al. (2011).
In an elegant analysis of 5–8 μm interstellar ice spectra as-sociated with 41 low luminosity Young Stellar Objects (YSOs)measured by Spitzer, Boogert et al. (2008) removed the contri-bution of the broad 6 μm H2O–ice feature and showed that theresidual absorption consists of at least five independent spec-troscopic components, with most showing weak but significantsubstructure. Boogert et al. (2008) present an in-depth, extensivediscussion and review of the possible carriers of these compo-nents, providing an excellent portal into the literature. Theyalso conclude that all the phenomena observed for ices towardmassive YSOs are observed toward low mass YSOs as well,indicating ices in dense clouds and star forming regions havemuch in common. The five spectroscopic components identifiedby Boogert et al. (2008), labeled C1 through C5, are shown inFigure 11.
In parallel with the extensive observing programs, equally in-tense experimental programs dedicated to preparing and study-ing interstellar ice analogs have been carried out at laboratoriesaround the world. These observational and experimental studiesare the foundation of our understanding of interstellar ice com-position, chemistry, processes, and physical properties. How-ever, although PAHs are now considered to be widespread andabundant throughout the interstellar medium, few laboratorystudies have been carried out on PAH-containing, H2O-rich icesand, of these, only a handful have studied the IR spectroscopicand chemical changes induced by UV irradiation. To increaseour understanding in this area, in Section 5.1 we expand on thestudies reported earlier by Bouwman et al. (2011b) with the ad-ditional insight provided by the computational spectra presentedin Section 3.1 of different photoproducts and, in Section 5.2, bythe different photochemical pathways described in Section 4.
Figure 11 shows the five spectroscopic, residual interstellarice features identified by Boogert et al. (2008) that fall between5.3 and 7.8 μm. For comparison, the panel above contains acomposite made up of all the computed aromatic parent andphotoproduct bands between 6.1 and 9.7 μm reproduced fromthe equivalent panels in Figure 4 and listed in Tables 1–3. Thecomputed bands do not extend below 5.8 μm down to 5.3 μm
16
The Astrophysical Journal, 799:14 (20pp), 2015 January 20 Cook et al.
Figure 11. Lower three panels show the C1 through C5 components described by Boogert et al. (2008). These individual components were derived by subtracting the6.0 μm H2O feature from spectra of embedded young stellar objects. The top panel corresponds directly to the upper panels shown in Figure 4, in this case showinga superposition of the DFT computed photoproduct bands from all three PAHs studied in this work. Vertical red, cyan, and gray lines correspond to cation bands,PAH-derived alcohols, and PAH-derived ketones/quinones, respectively.
because of limitations in computing the C=O stretch in theketone forms at the B3LYP/6–31G∗ level of theory. On theother hand, the spectra of the interstellar residual componentsdo not extend beyond 7.8 μm, presumably due to severe overlapwith the blue wing of the 10 μm silicate feature.
Although the size and number of PAHs considered here aresmall, Figure 11 clearly suggests that the spectra of PAHs andtheir photoproducts in water-rich ices should be considered aspossible contributors to the components described by Boogertet al. (2008). This possibility is now examined, starting at the5.5 μm end of the spectral window. Throughout this discussion,it is assumed that band broadening and blending from a mixtureof ice-bound PAHs and their photoproducts would producebroad, slightly structured features.
Components C1, C2, and the strongest section of C5, spanthe 5.5–6.5 μm region and extend beyond the panel of computa-tional bands. Bands on the blue half of this region fall in the re-gion characteristic of the very strong C=O stretch in carbonyls.Indeed, C1 is reasonably well accounted for by overlappingC=O stretching bands of well-established, simple interstellar icespecies such as HCOOH and H2CO (see references in Boogert
et al. 2008). While the computational spectra presented here donot extend fully across the C=O stretching region because ofthe uncertainty inherent the level of theory used, in their studyof PAH photochemistry in H2O ice Guennoun et al. (2011a,2011b) computed the spectra for the several alcohol and ke-tone forms of pyrene and coronene photoproducts at the higher,B3LYP/6–3111 + + g(d, p) level of theory. For these molecules,the C=O stretch falls between roughly 5.5 and 6.25 μm (1740and 1600 cm−1) and, as with other carbonyls, the C = O stretch-ing bands are by far the strongest (see also Bellamy 1958 andSilverstein & Bassler 1963). Thus, both the relative strength ofblue end of the C5 component and its wavelength range areconsistent with a strong contribution from aromatic ketones andquinones. While C2 may have some contribution from the C=Ostretch in aromatic ketones and quinones, it is distinct from C5and is centered at the position of the very strong PAH cation CCstretch (Bauschlicher et al. 2010; Boersma et al. 2014), and thusmost likely associated with PAH cations.
Keane et al. (2001) attribute excess absorption centered near6.3 μm (the C2 component from Boogert et al. 2008) in theircollection of dense cloud spectra to the aromatic CC stretch and
17
The Astrophysical Journal, 799:14 (20pp), 2015 January 20 Cook et al.
consider several possible carriers including PAHs in the gas,PAHs condensed on grains, and carbonaceous dust. However, atthat time, it was not known that charged PAHs could be presentin ices. Attributing the 6.3 μm excess absorption to PAHs in thegas phase, Keane et al. estimated the amount of carbon tied up inPAHs. However, since the intrinsic strength of this band is verysensitive to the degree of ionization, they made two estimates,one based on the intrinsic strength of neutral PAHs, the other forPAH cations. Adopting the intrinsic strength for PAH cations,they calculated that the fraction of elemental carbon tied up inPAHs to be about 7% for NGC 7538:IRS9, an amount consistentwith that determined from the PAH IR emission bands. However,assuming neutral PAHs produce the band requires 83% of theelemental carbon. Clearly, this supports the picture that ionizedPAHs are components of interstellar ice.
Components C3, C4 and the moderately strong section of C5span the 6.5–7.8 μm region. Comparing all of these componentswith the lines in the panel shows they fall in the region of theoverlapping, weaker bands associated with aromatic alcoholsand ketones, as well as with a smaller number of strong PAHcation bands. The careful work of Keane et al. (2001) andSchutte & Khanna (2003) showed that the 6.8 μm feature ismade up of at least two components, one centered near 6.75 μm,the other at 6.95 μm. These are components C3 and C4 identifiedby Boogert et al. (2008). The computational spectra in Figure 11show that, while aromatic alcohols and ketones have bands thatcould contribute to C3, they are sparse and weak, perhaps afourth the density of the bands near 6.3 μm. On the otherhand, this position is associated with aliphatic CH deformationmodes and every Hn-PAH will have moderately strong bandshere. As with all aliphatic containing materials, these couldwell contribute to this band. The situation with C4 is similarto that of C3. C4 spans a wavelength region in which aliphaticCH deformation bands are moderately strong. The limited PAHdata set in Figure 11 shows that strong PAH cation bands mightalso contribute to C4. Moving to longer wavelengths, severalbroad, weak features near 7.24, 7.41, 7.58, and 7.68 μm havebeen known in the spectra associated with deeply embeddedprotostars for some time (e.g., Lacy et al. 1991; Schutte et al.1996; Boogert et al. 1996; Keane et al. 2001) and these allcontribute to the 6.5–7.8 μm portion of C5. Figure 11 showsthat even this simple mixture of small, pure PAHs, PAH cations,aromatic alcohols and ketones produces a very rich spectrumbetween 6.5 and 7.8 μm. Together with the property that thesebands are intrinsically weaker than the CC PAH cation andC = O stretching bands indicates that PAHs could be importantcontributors to C5.
The presence of aromatic alcohols, ketones, ethers andHn-PAHs in the residues that remained after UV irradiatedPAH:H2O ices were warmed to room temperature is well es-tablished (Bernstein et al. 1999; Ashbourn et al. 2007). How-ever, until quite recently, it was not at all clear if these speciesformed in the low temperature ice during irradiation or af-terward, during warm-up, when reactive species could dif-fuse through the ice. Therefore, while they might be impor-tant interstellar ice constituents, significantly influencing as-trochemistry and IR observations as discussed in Section 5.1above, they may only play a role in regions where irradi-ated ices can warm to well above 100 K. This question isnow settled thanks to the novel two-color, laser-desorption,
laser-ionization-TOF experiments by Gudipati & Yang (2012)and Yang & Gudipati (2014). They have shown that the additionof OH and O are the primary chemical reactions that occur inPAH:H2O ices subjected to Lyα radiation at 5 K. This contrastswith the efficiency of hydrogenation which, they find, is higherat 100 K than at 5 K. Consider also the knowledge summarizedin Section 4.1 that PAH cation formation is the first step uponexposure to UV radiation and that aromatic alcohols, ketonesand quinones are also formed in low temperature PAH:H2Oices irradiated with near-UV radiation (Guennoun et al. 2011a,2011b). Taken together, the overwhelming implication is that,in regions where they are subjected to UV radiation, interstellarices contain PAHs, PAH cations, PAH(-OH)n, and PAH(=O)nin addition to molecules such as CO2, CH3OH, NH3, etc.
UV-driven PAH erosion, ultimately producing CO, CO2, andH2CO from the carbon atoms making up the aromatic networkis also important. Although PAHs are likely present at only thefew percent level in ice grain mantles and the amount of CO2and H2CO formed via these pathways is small in comparisonto the amount formed by grain surface and radiation drivenbulk reactions (e.g., Oberg et al. 2010; Fuchs et al. 2009),UV-driven PAH erosion processes in water-rich interstellar icesmay help resolve the apparent “contradiction” that the PAHsdominating the IR emitting population are thought to be verylarge, (50 < Cn < 100) whereas, up to now, the PAHs extractedfrom meteorites are much smaller.
Recent studies have shown the key importance of H2O insimilar UV-driven PAH loss and CO2 growth. Radich et al.(2014) have shown that, in aqueous media, UV-generatedOH radicals trigger graphene (very large PAHs) scission intosmaller, PAH-like compounds that, with continued irradiation,produce CO2 and H2O. Likewise, Mattioda et al. (2012), whostudied PAH photochemistry in different environmental cells,show that the loss of the PAH isoviolanthrene (C34H18) withgrowth of CO2 occurs only water vapor is present in the chamber.
The UV-driven processes and PAH:H2O ice chemistry con-sidered here may well be important not only in high radiationfield environments, but wherever interstellar ices are found. In-terstellar ices experience the low level UV radiation field presentthroughout dense clouds, based on cosmic ray H ionization andrecombination rates. Ices in the vicinity of star and planet form-ing regions will be exposed to high radiation fields, and icesin protoplanetary disks, formed around the mid-plane, will bebrought to the UV-rich outer edges and back to the mid-planeby vertical mixing (e.g., Bouwman et al. 2011b; Oberg et al.2011, 2013 and references therein). Recently, by modeling anice particle’s movement throughout the disk, Ciesla & Sand-ford (2012) have shown that the total UV fluences received bythe ices in the solar nebula could be considerably greater thanexperienced by typical ices in dense molecular clouds.
The impact of the work reported here is significant. Foremostamong these results is that, in addition to the mixture of speciessuch as H2O, CH3OH, NH3, CO, etc., typical interstellar icesshould also contain neutral and ionized PAHs, aromatic alco-hols, ketones and quinones. Based on models of PAH freeze-outtimescales and different interstellar radiation fields, Bouwmanet al. (2011b) estimated that PAHs and PAH photoproducts maycomprise 2%–3% of interstellar ice mantles. Their presencewithin the ice will influence band positions and profiles throughstructural alterations and complex formation. For example, sincesome of the CO2 in an ice mantle may have been produced viathe PAH erosion process, its vibrational bands are likely tobe perturbed by the adjacent aromatic moiety, affecting band
18
The Astrophysical Journal, 799:14 (20pp), 2015 January 20 Cook et al.
profile analyses (e.g., Cook et al. 2011). PAHs and their photo-products will also participate in the chemistry that occurs withinthe ice and ultimately in the gas as the ices sublime. Similarly,these processes should occur in many other low-temperature,water-rich icy objects in the solar system because aromatics aredelivered to the surfaces of most solar system objects in signif-icant quantities by meteorites and interplanetary dust particles(IDPs; Zenobi et al. 1989; Clemett et al. 1993).
6. CONCLUSION
IR spectroscopic studies of vacuum ultraviolet (UV) irra-diated anthracene:H2O, pyrene:H2O, and benzo[ghi]perylene:H2O ices (12 K) at various concentrations are reported. UsingDFT computed IR spectra to follow the UV driven spectroscopicchanges shows that the corresponding parent PAH cations, aswell as specific mono- and di-aromatic alcohols [PAH(OH)n]and quinones [PAH(O)n] form. Little evidence is found for hy-drogenation at these temperatures, consistent with the findingsof Gudipati & Yang (2012).
PAH concentration in the water–ice matrix influences thestability of the PAHs, their photoproducts and the rates andefficiencies of photoproduct production. PAH erosion is trackedvia the final photoproducts, CO2 and H2CO. For these smallPAHs, PAH erosion and fragmentation is significant, but notas important as PAH(OH)n and PAH(O)n formation. PAHsare likely present at only the few percent level in ice grainmantles, and the amount of CO2 and H2CO formed via thesepathways is small in comparison to the amount formed bygrain surface and radiation driven bulk reactions (e.g., Oberget al. 2010; Fuchs et al. 2009). However, UV-driven PAHerosion processes in water-rich interstellar ices may help resolvethe apparent “contradiction” that the PAHs dominating the IRemitting population are thought to be very large, (50 < Cn <100) whereas, up to now, the PAHs extracted from meteoritesare much smaller. Formation of PAH-related photoproducts ismost efficient at low PAH concentrations; this is consistentwith a higher concentration of monomers, as opposed to PAHaggregates. Monomers react more readily with H and OHradicals than PAH aggregates. As PAH concentration dropsbelow PAH:H2O ∼ 1:300, PAH ionization and stabilizationbecomes increasingly important and PAH cations determine thedominant photochemical pathways followed in PAH:H2O ices.
DFT computed spectra are used to assess the contribution ofPAH-related species to the interstellar ice absorption featuresbetween 5 and 9 μm. PAH cations are important contributorsto the C2 component and PAH(OH)n and PAH(O)n to the C5component described by Boogert et al. (2008). Thus, apart fromsimple species such as CO, CO2, CH3OH, NH3, etc., typicalinterstellar ices should also contain neutral and ionized PAHs,aromatic alcohols, ketones, and quinones at the few percent levelwith respect to H2O.
PAHs, their photoproducts, and ion-mediated processesshould therefore be considered when modeling interstellar iceprocesses, spectroscopy and astrochemistry. PAHs and PAH-related processes should also be important for water-rich icyobjects in the solar system.
We are grateful to Dr. Adwin Boogert for his collabora-tion and discussion of his observational spectra. We grate-fully acknowledge support from NASA’s Astrophysics DataAnalysis, Laboratory Astrophysics and Exobiology Programs(NNH11ZDA001N-EXO), NASA’s LaboratoryAstrophysics,“Carbon in the Galaxy” consortium grant (NNH10ZDA001N),
the”Stichting voorFundamenteel Onderzoek der Materie”(FOM), “The Netherlands Research School for Astronomy”(NOVA), and NASA’s Laboratory Astrophysics and Astrobi-ology Programs.
REFERENCES
Allamandola, L. J., Hudgins, D. M., & Sandford, S. A. 1999, ApJL, 511, L119Allamandola, L. J., Sandford, S. A., & Tielens, A. G. G. M. 1992, ApJ,
399, 134Allamandola, L. J., Sandford, S. A., & Valero, G. J. 1988, Icar, 76, 225Ashbourn, S. F. M., Elsila, J. E., Dworkin, J. P., et al. 2007, M&PS, 42, 2035Bauschlicher, C. W., Jr., Boersma, C., Ricca, A., et al. 2010, ApJS, 189, 341Bauschlicher, C. W., & Langhoff, S. R. 1997, AcSpA, 53, 1225Bauschlicher, C. W., & Ricca, A. 2010, MoPh, 108, 2647Becke, A. D. 1993, JCP, 98, 5648Bellamy, L. J. 1958, The Infra-Red Spectra of Complex Molecules (London:
Methuen & Co. Ltd.)Bernstein, M. P., Mattioda, A. L., Sandford, S. A., & Hudgins, D. M. 2005a, ApJ,
626, 909Bernstein, M. P., Moore, M. H., Elsila, J. E., et al. 2003, ApJL, 582, L25Bernstein, M. P., Sandford, S. A., & Allamandola, L. J. 2005b, ApJS, 161, 53Bernstein, M. P., Sandford, S. A., & Allamandola, L. J. 1996, ApJL, 472, L127Bernstein, M. P., Sandford, S. A., Allamandola, L. J., et al. 1999, Sci, 283, 1135Bernstein, M. P., Sandford, S. A., Mattioda, A. L., & Allamandola, L. J.
2007, ApJ, 664, 1264Boersma, C., Bauschlicher, C. W., Jr., Ricca, A., et al. 2014, ApJS, 211, 8Boogert, A. C. A., Schutte, W. A., Tielens, A. G. G. M., et al. 1996, A&A,
315, L377Boogert, A., Pontoppidan, K., Knez, C., et al. 2008, ApJ, 678, 985Bouwman, J., Cuppen, H. M., Bakker, A., Allamandola, L. J., & Linnartz, H.
2010, A&A, 511, A33Bouwman, J., Cuppen, H. M., Steglich, M., Allamandola, L. J., & Linnartz, H.
2011a, A&A, 529, A426Bouwman, J., Mattioda, A. L., Linnartz, H., & Allamandola, L. J. 2011b, A&A,
525, A93Bregman, J. D., Hayward, T. L., & Sloan, G. C. 2000, ApJL, 544, L75Brooke, T. Y., Sellgren, K., & Geballe, T. R. 1999, ApJ, 517, 883Ciesla, F. J., & Sandford, S. A. 2012, Sci, 336, 452Chang, Q., & Herbst, E. 2014, ApJ, 787, 135Chiar, J. E., Tielens, A. G. G. M., Whittet, D. C. B., et al. 2000, ApJ, 537, 749Clemett, S. J., Maechling, C. R., Zare, R. N., Swan, P. D., & Walker, R. M.
1993, LPSC, 24, 309Cook, A. M., Mattioda, A. L., Quinn, R. C., et al. 2014, ApJS, 210, 15Cook, A. M., Whittet, D. C. B., Shenoy, S. S., et al. 2011, ApJ, 730, 124Cuylle, S. H., Allamandola, L. J., & Linnartz, H. 2014, A&A, 562, A22Dauben, W. G., Salem, L., & Turro, N. J. 1975, AcChR, 8, 41d’Hendecourt, L. B., Allamandola, L. J., Grim, R. J. A., & Greenberg, J. M.
1986, A&A, 158, 119Flukiger, P., Luthi, H. P., Portmann, S., & Weber, J. 2000, MOLEKEL 4.2
(Swiss Center for Scientific Computing: Manno, Switzerland)Frisch, M. J., Pople, J. A., & Binkley, J. S. 1984, JCP, 80, 3265Frisch, M. J., et al. 2009, Gaussian 09, Revision C.01 (Wallingford, CT:
Gaussian, Inc.)Fuchs, G. W., Cuppen, H. M., Ioppolo, S., et al. 2009, A&A, 505, 629Garozzo, M., La Rosa, L., Kanuchova, Z., et al. 2011, A&A, 528, A118Gerakines, P. A., & Moore, M. H. 2001, Icar, 154, 372Gibb, E. L., & Whittet, D. C. B. 2002, ApJL, 566, L113Giuliano, B. M., Reva, I., Lapinski, L., & Fausto, R. 2012, JCP, 136, 024505Gudipati, M. S. 2004, JPCA, 108, 4412Gudipati, M. S., & Allamandola, L. J. 2003, ApJL, 596, L195Gudipati, M. S., & Allamandola, L. J. 2006, ApJ, 638, 286Gudipati, M. S., & Yang, R. 2012, ApJL, 756, L24Guennoun, Z., Aupetit, C., & Mascetti, J. 2011a, PCCP, 13, 7340Guennoun, Z., Aupetit, C., & Mascetti, J. 2011b, JPCA, 115, 1844Hardegree-Ullman, E. E., Gudipati, M. S., Boogert, A. C. A., et al. 2014, ApJ,
784, 172Hudgins, D. M., Bauschlicher, C. W., & Allamandola, L. J. 2005, ApJ, 632, 316Hudgins, D. M., Sandford, S. A., & Allamandola, L. J. 1994, JPhCh, 98, 4243Hudgins, D. M., Sandford, S. A., Allamandola, L. J., & Tielens, A. G. G. M.
1993, ApJS, 86, 713Keane, J. V., Tielens, A. G. G. M., Boogert, A. C. A., Schutte, W. A., & Whittet,
D. C. B. 2001, A&A, 376, 254Keheyan, Y., & ten Kate, I. L. 2012, Orig. Life Evol. Biosph., 42, 179Lacy, J. H., Carr, J. S., Evans, N. J., II, et al. 1991, ApJ, 376, 556Langhoff, S. R. 1996, JPhCh, 100, 2819
The Astrophysical Journal, 799:14 (20pp), 2015 January 20 Cook et al.
Mattioda, A. L., Cook, A. M., Ehrenfreund, P., et al. 2012, AsBio, 12, 841Mattioda, A. L., Hudgins, D. M., & Allamandola, L. J. 2005, ApJ,
629, 1188Mattioda, A. L., Hudgins, D. M., Bauschlicher, C. W., Rosi, M., & Allamandola,
L. J. 2003, JPCA, 107, 1486Michalska, D., Bienko, D. C., Abkowicz-Bienko, A. J., & Latajka, Z. 1996, JPC,
100, 17786Noble, J. A., Dulieu, F., Congiu, E., & Fraser, H. J. 2011, ApJ, 735, 121Oba, Y., Watanabe, N., Kouchi, A., Hama, T., & Pirronello, V. 2010, ApJL,
712, L174Oberg, K. I., Boamah, M. D., Fayolle, E. F., et al. 2013, ApJ, 771, 95Oberg, K. I., Boogert, A. C. A., Pontoppidan, K. M., et al. 2011, ApJ,
740, 109Oberg, K. I., van Dishoek, E. F., Linnartz, H., & Andersson, S. 2010, ApJ,
718, 832Peeters, E., Allamandola, L. J., Hudgins, D. M., Hony, S., & Tielens, A. G. G.
M. 2004, in ASP Conf. Ser. 309, Astrophysics of Dust, ed. A. N. Witt, G. C.Clayton, & B. T. Draine (San Francisco, CA: ASP), 141
Radich, J. G., Krenselewski, A., Zhu, J., & Kamat, P. V. 2014, Chem. Mater.,26, 4662
Ricca, A., & Bauschlicher, C. W. 2000, CPL, 328, 396Roser, J. E., Ricca, A., & Allamandola, L. J. 2014, ApJ, 783, 97
Sandford, S. A., Bernstein, M. P., & Allamandola, L. J. 2004, ApJ, 607, 346Sandford, S. A., Bernstein, M. P., & Materese, C. K. 2013, ApJS, 205, 8Schutte, W. A., Allamandola, L. J., & Sandford, S. A. 1993, Icar, 104, 118Schutte, W. A., & Khanna, R. K. 2003, A&AS, 298, 1049Schutte, W. A., Tielens, A. G. G. M., Whittet, D. C. B., et al. 1996, A&A,
315, L333Sellgren, K., Brooke, T. Y., Smith, R. G., & Geballe, T. R. 1995, ApJL,
449, L69Silverstein, R. M., & Bassler, G. C. 1963, Spectrometric Identification of
Organic Compounds (New York: Wiley)Smith, R. G., Sellgren, K., & Tokunaga, A. T. 1989, ApJ, 344, 413Stephens, P. J., Devlin, F. J., Chabalowski, C. F., & Frisch, M. J. 1994, JPhCh,
98, 11623Tielens, A. G. G. M. 2008, ARA&A, 46, 289van der Zwet, G. P., Allamandola, L. J., Baas, F., & Greenberg, J. M. 1985,
A&A, 145, 262van Dishoeck, E. F. 2004, ARA&A, 42, 119Warneck, P. 1962, ApOpt, 1, 721Watanabe, M., & Kouchi, A. 2002, ApJ, 567, 651Woon, D. E., & Park, J. 2004, ApJ, 607, 342Yang, R., & Gudipati, M. S. 2014, JCP, 140, 104202Zenobi, R., Philippoz, J. M., Buseck, P. R., & Zare, R. N. 1989, Sci, 246, 1026
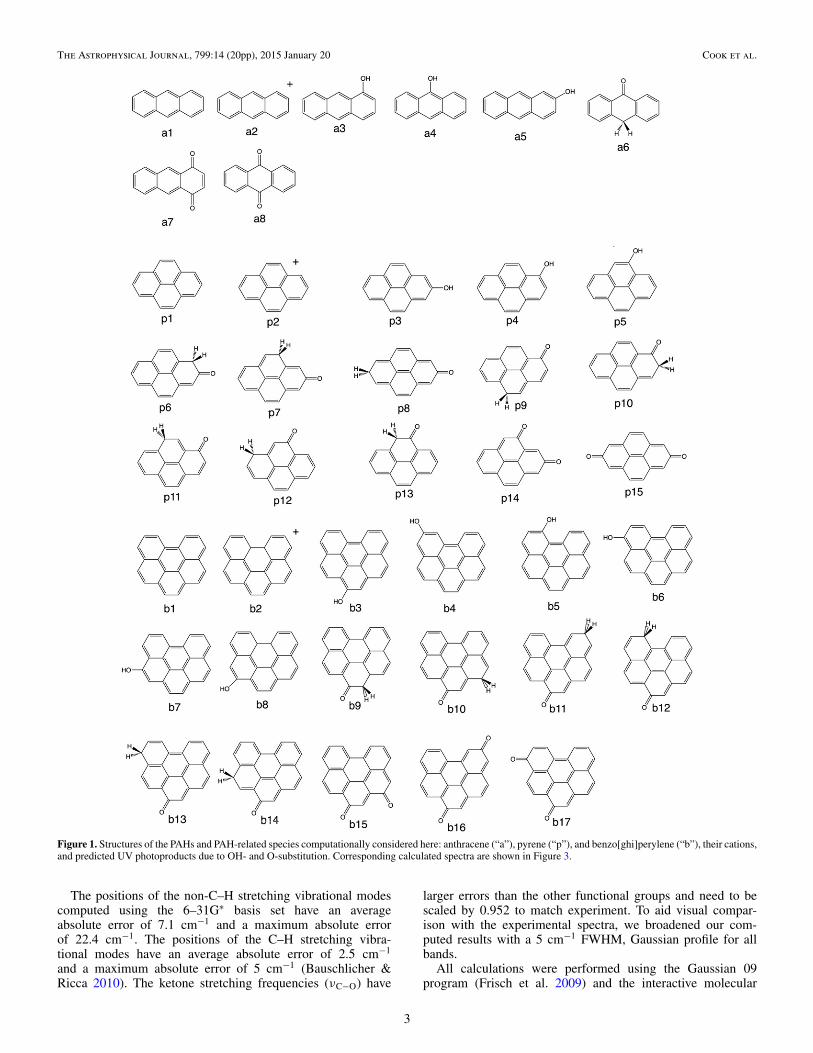
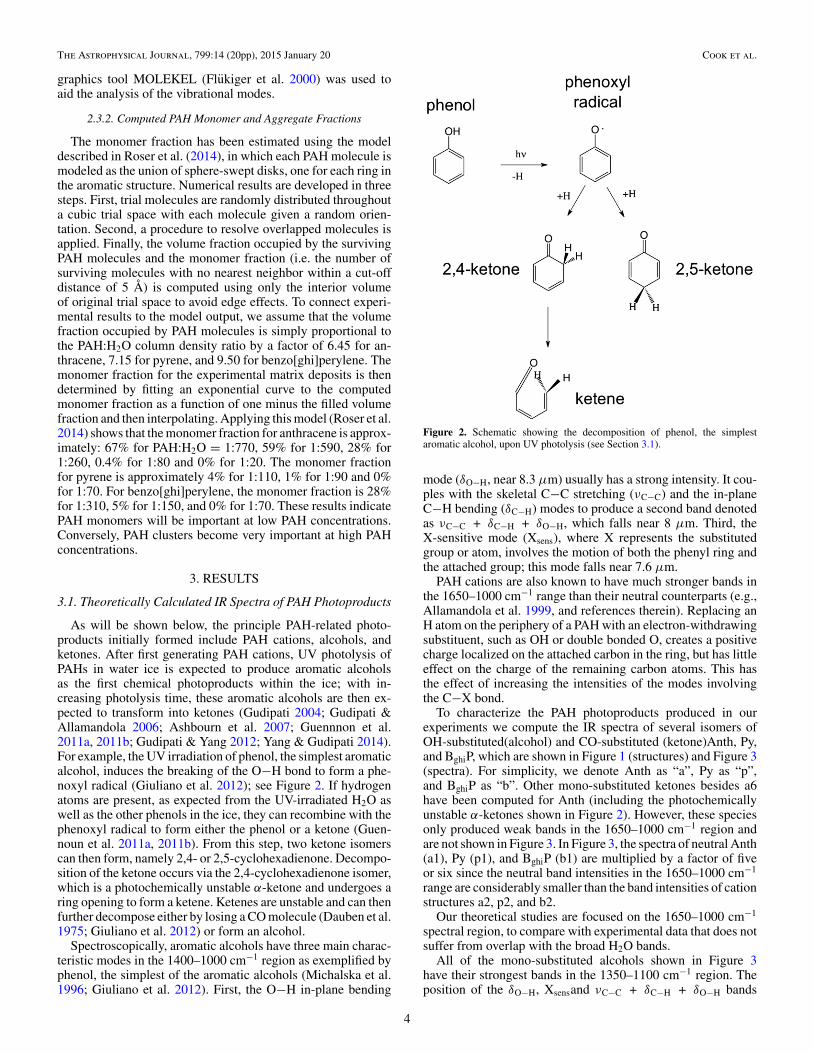
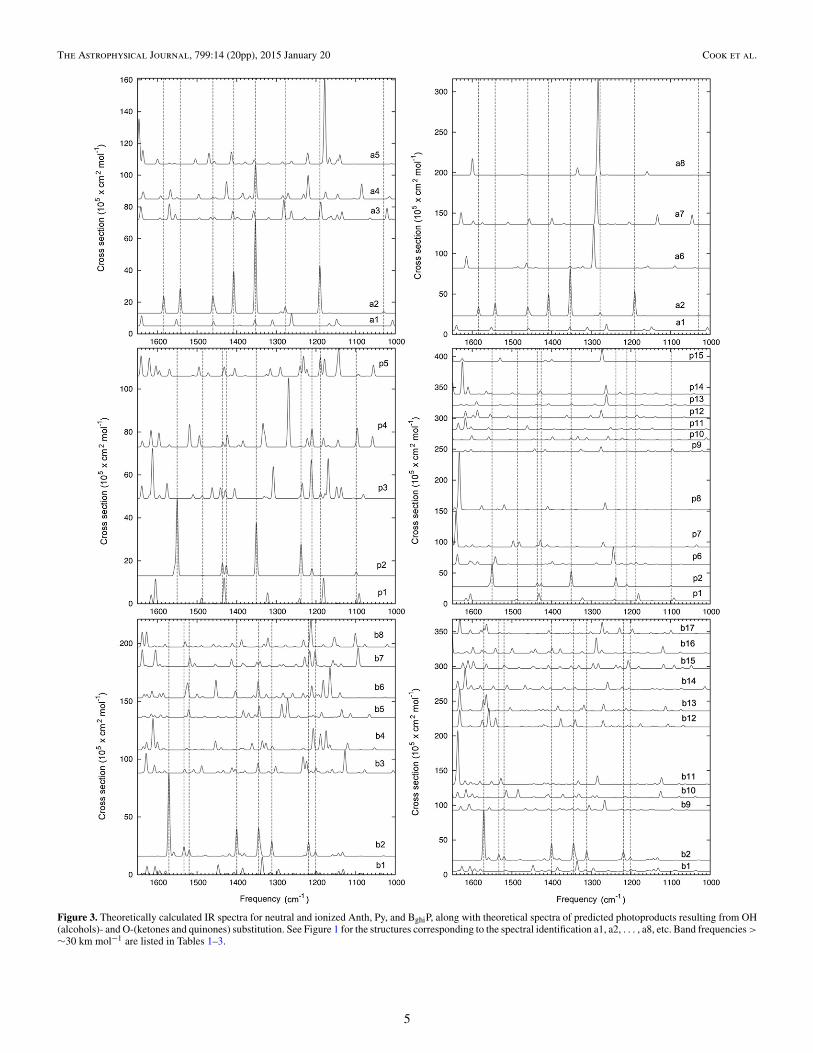
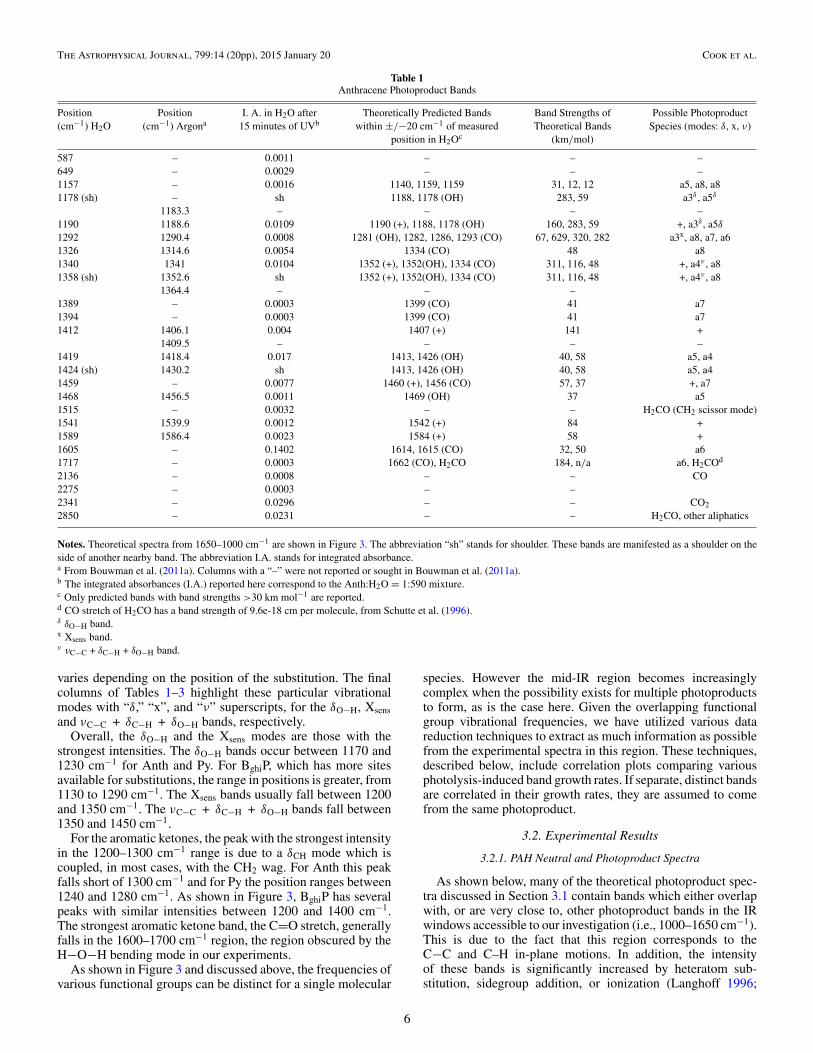
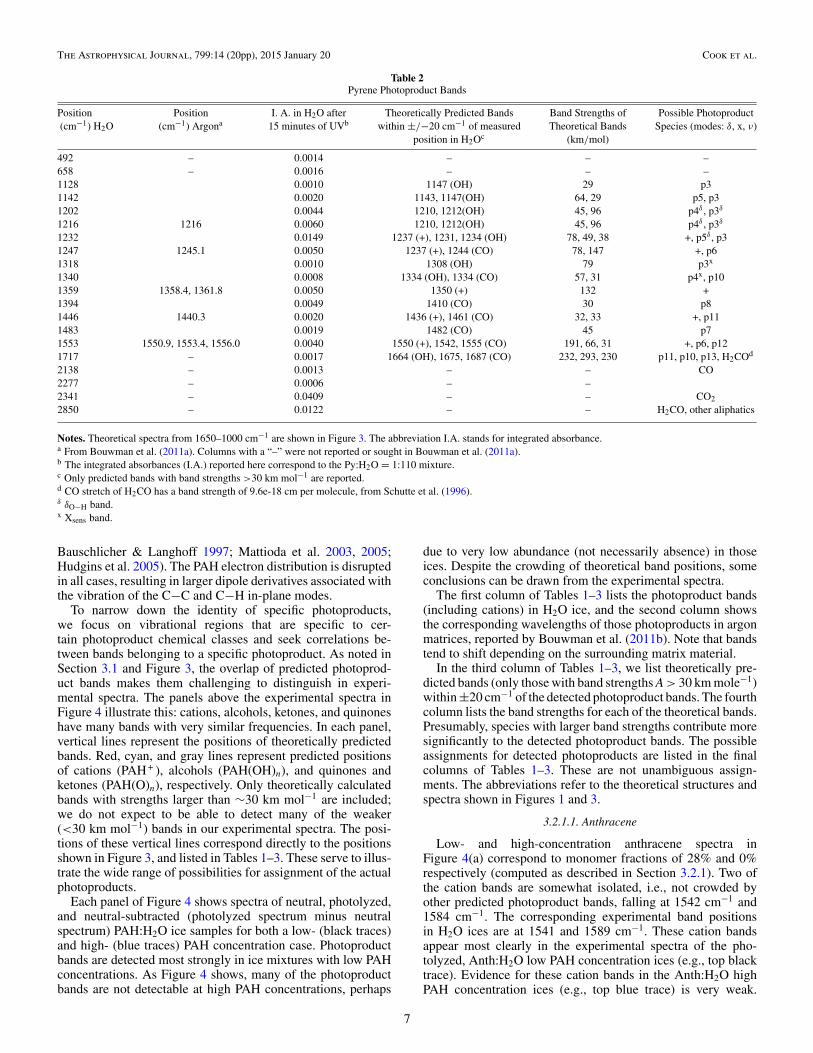
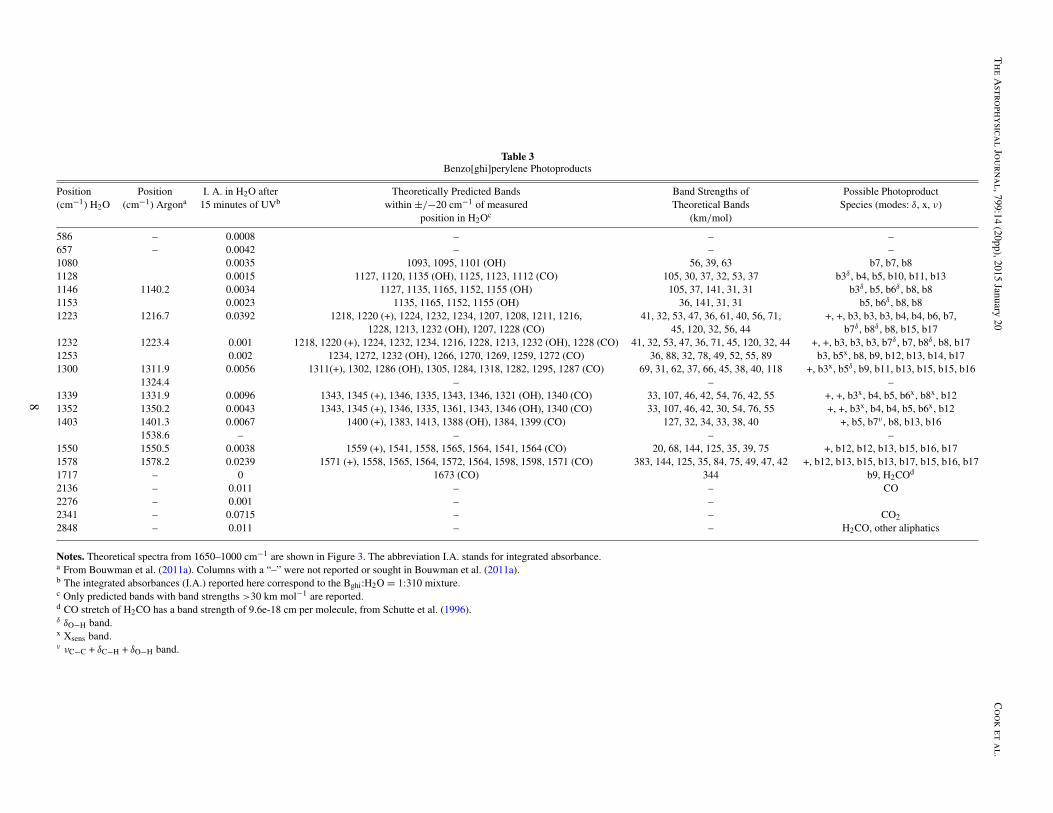
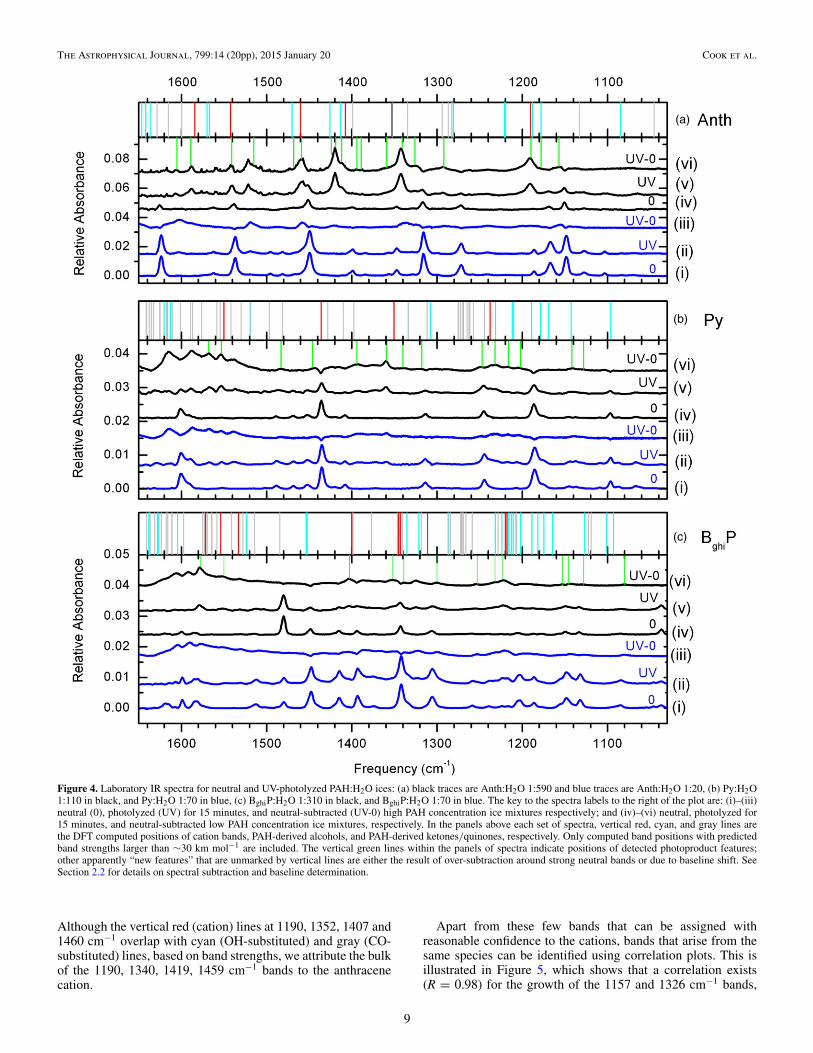
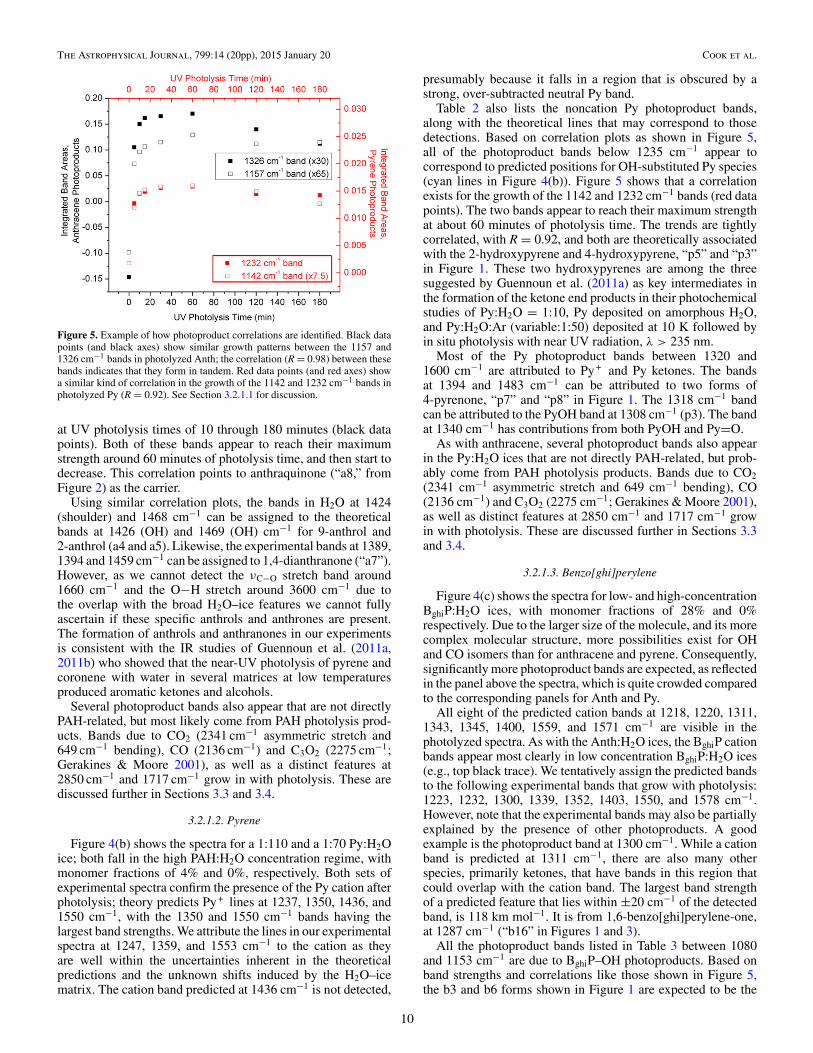
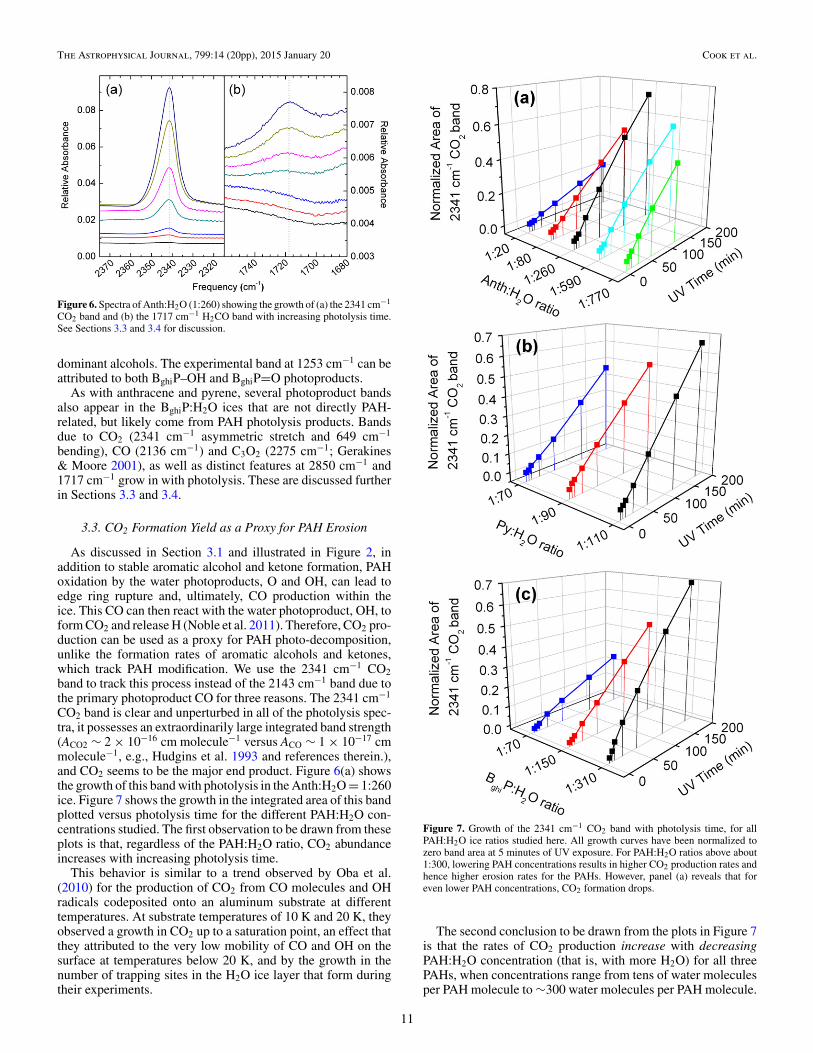
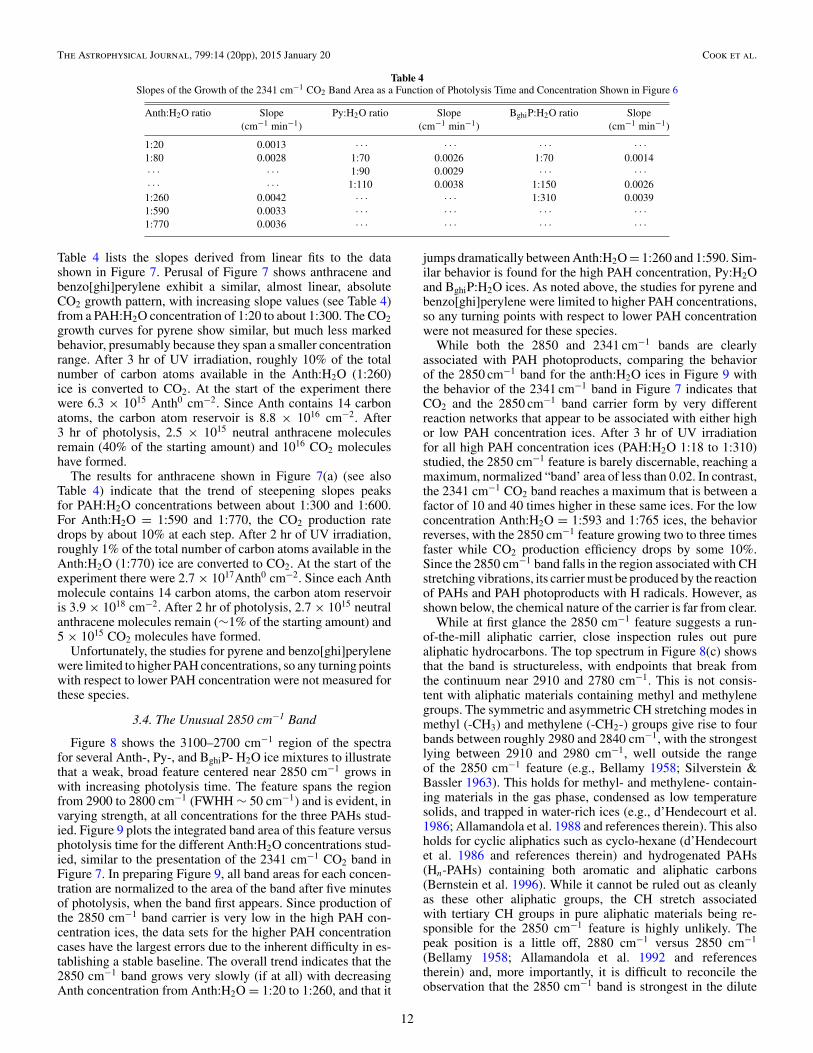
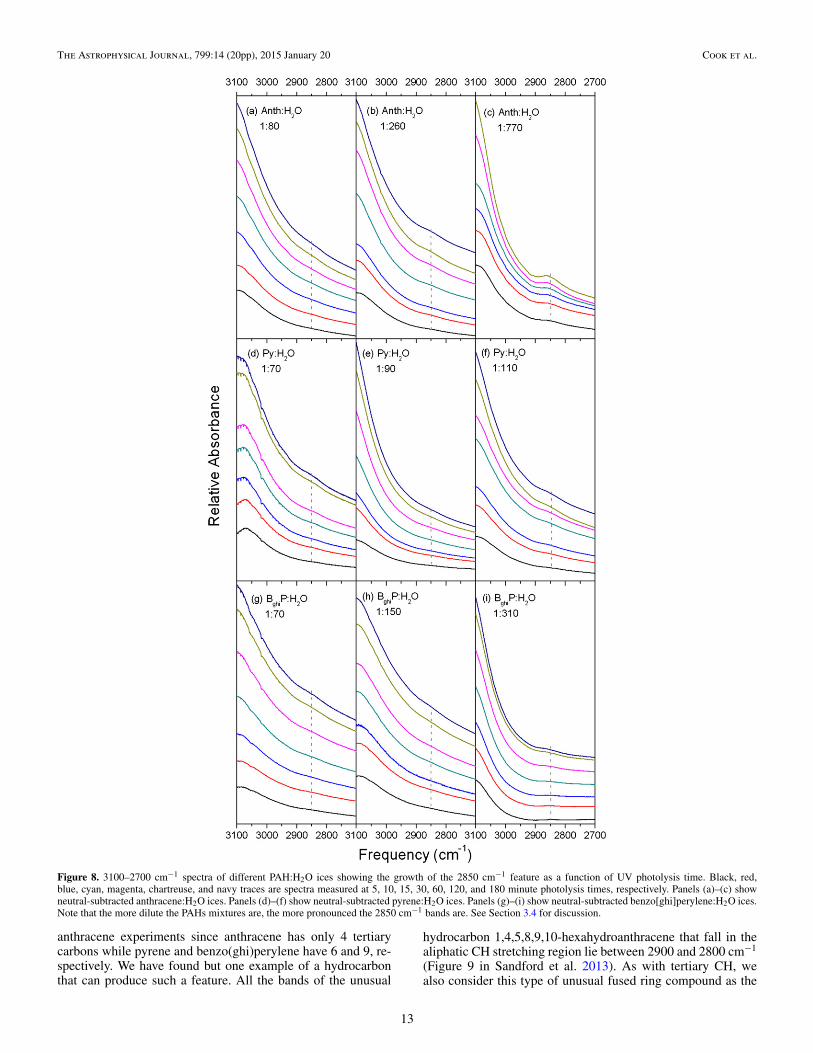
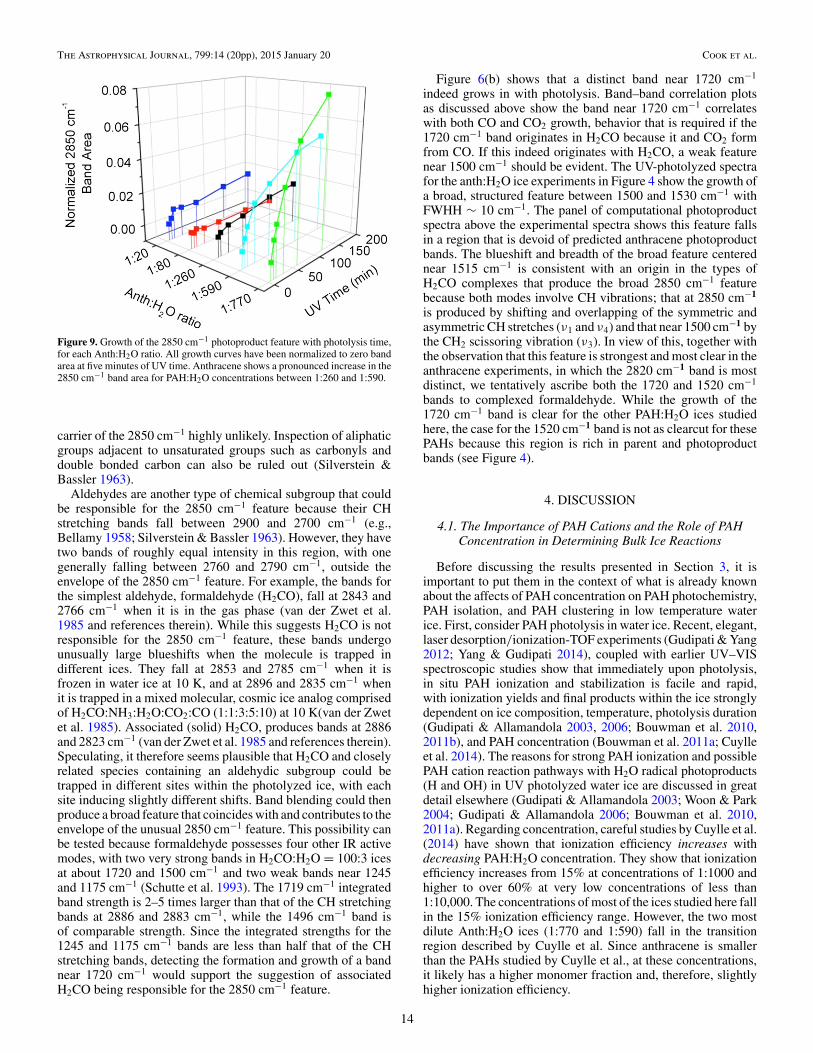
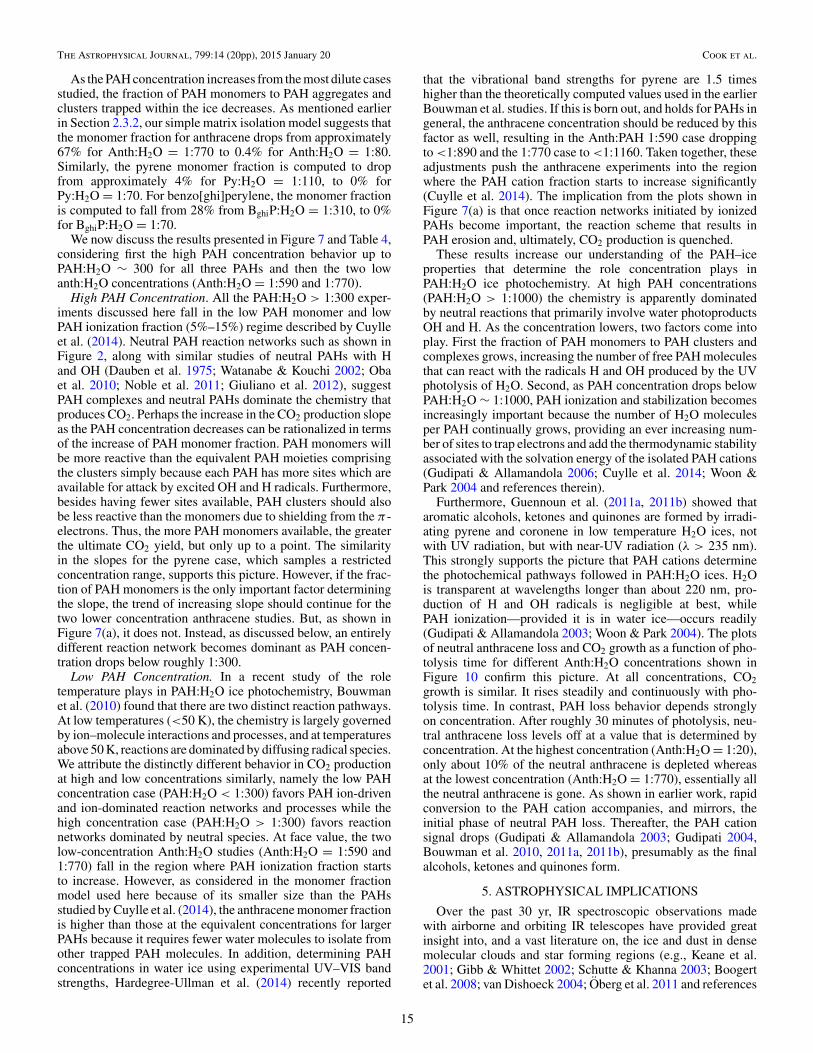
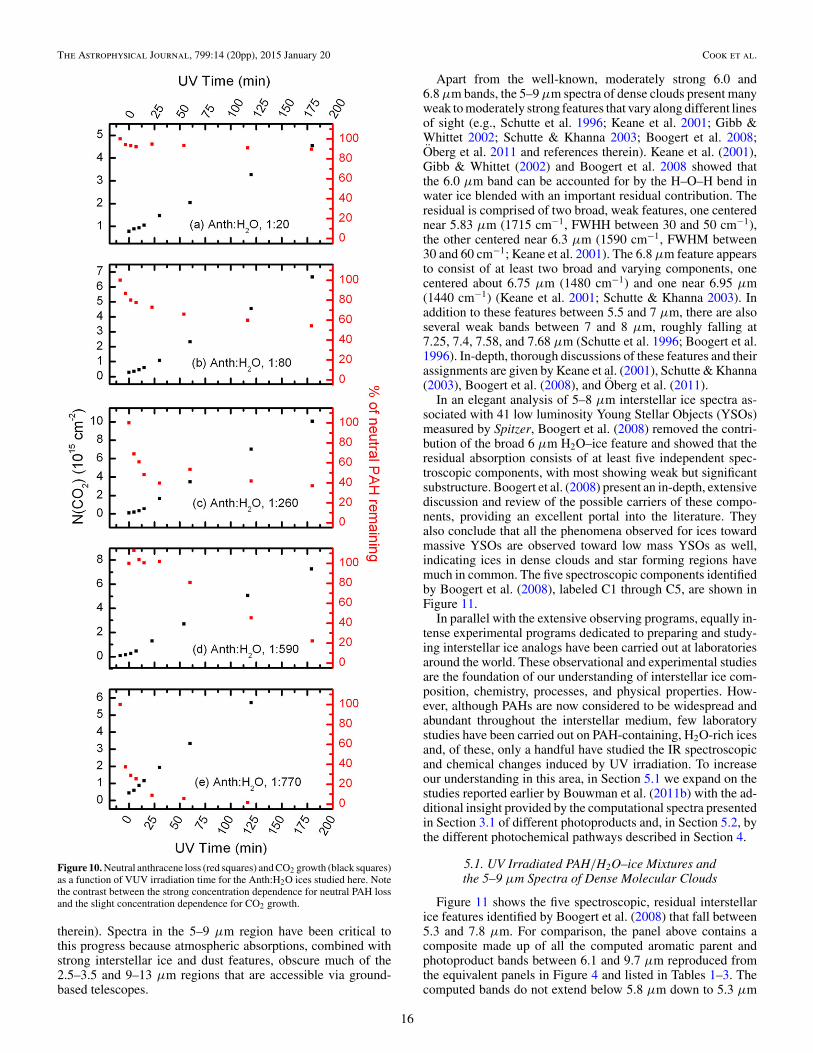
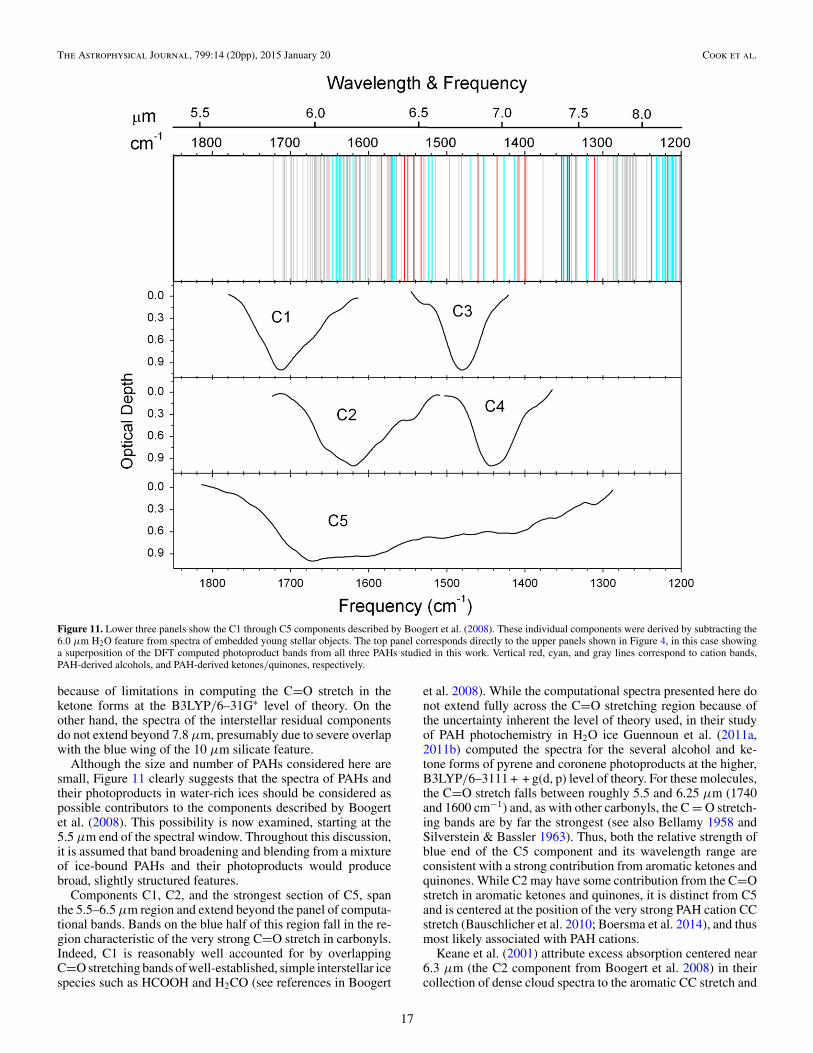


![Polycyclic aromatic hydrocarbons (PAH) guidance · Polycyclic aromatic hydrocarbons (Benzo[a]pyrene) General Information Key Points Identity The term polycyclic aromatic hydrocarbons](https://static.documents.pub/doc/80x56/5af498db7f8b9a8d1c8c6b2b/polycyclic-aromatic-hydrocarbons-pah-guidance-aromatic-hydrocarbons-benzoapyrene.jpg)


