Page 1
January 09
Fernando Nuño
European Copper Institute
[email protected]
Photovoltaic Project AnalysisUsing RETScreen software
Case study : 36 kWp installed in South of Spain, grid connected, fix structure
In cooperation with Infrysol
http://www.infrysol.com/
http://www.retscreen.net/
Page 2
www.leonardo-energy.org
Index
What a PV system consists on?
Fix Structure vs Tracking System
RETScreen Analysis– Required inputs– Computing– Results
Page 3
www.leonardo-energy.org
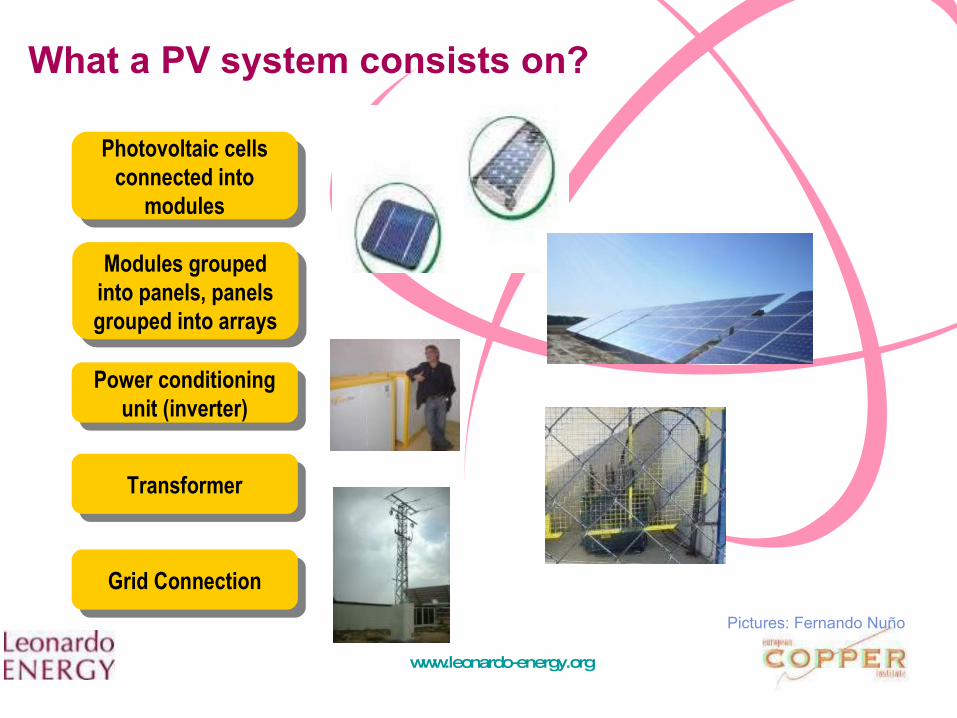
What a PV system consists on?
Photovoltaic cells connected into
modules
Modules grouped into panels, panels grouped into arrays
Power conditioning unit (inverter)
Pictures: Fernando Nuño
Transformer
Grid Connection
Page 4
www.leonardo-energy.org
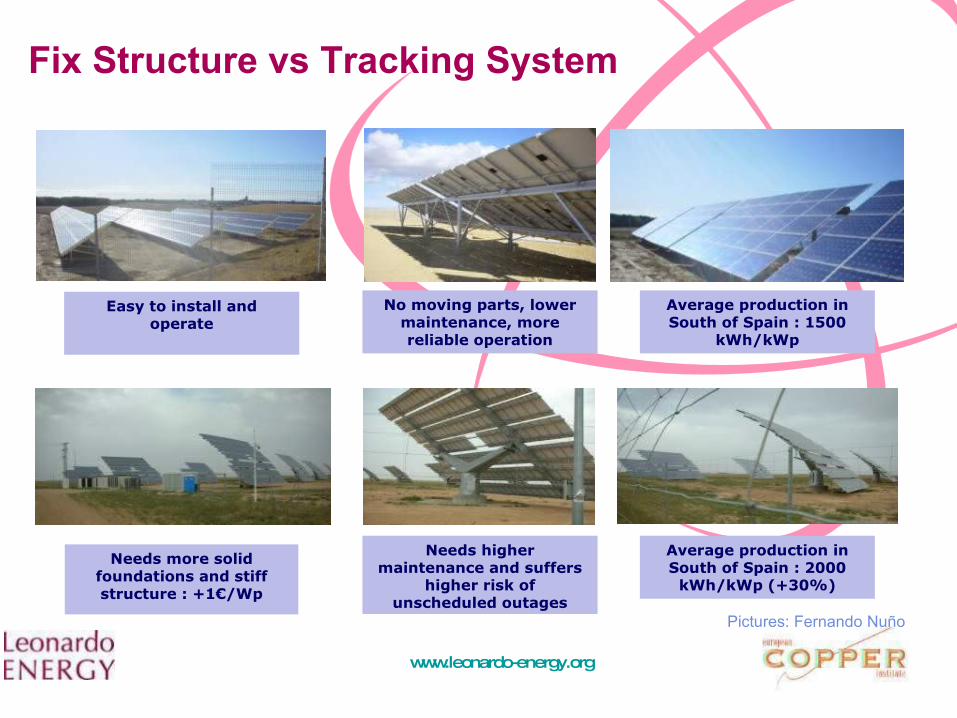
Fix Structure vs Tracking System
Pictures: Fernando Nuño
No moving parts, lower maintenance, more reliable operation
Needs higher maintenance and suffers
higher risk of unscheduled outages
Easy to install and operate
Needs more solid foundations and stiff structure : +1€/Wp
Average production in South of Spain : 1500
kWh/kWp
Average production in South of Spain : 2000
kWh/kWp (+30%)
Page 5
www.leonardo-energy.org
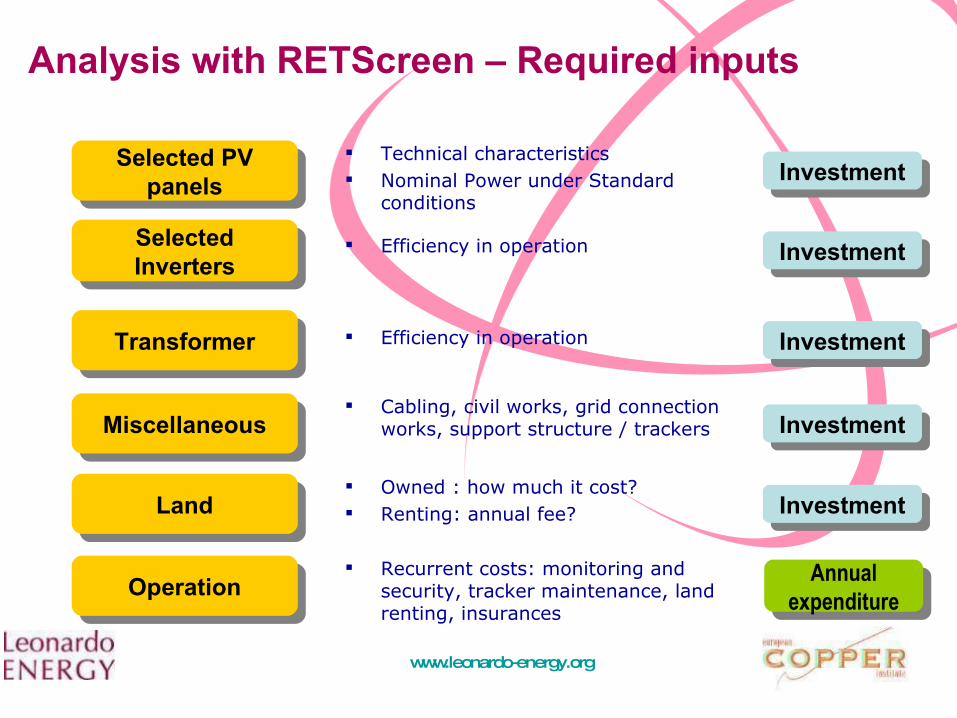
Analysis with RETScreen – Required inputs
Selected PV panels
Technical characteristics Nominal Power under Standard
conditions
Selected Inverters
Transformer
Land Owned : how much it cost? Renting: annual fee?
Operation Recurrent costs: monitoring and
security, tracker maintenance, land renting, insurances
Efficiency in operation
Efficiency in operation
Miscellaneous Cabling, civil works, grid connection
works, support structure / trackers
Investment
Investment
Investment
Investment
Investment
Annual expenditure
Page 6
www.leonardo-energy.org
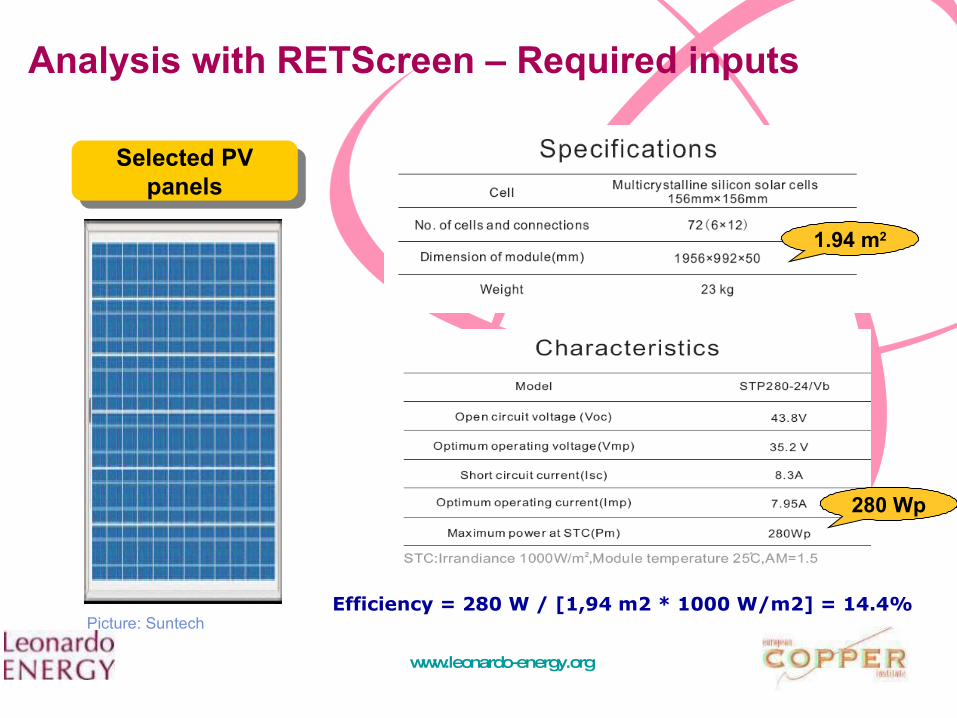
Analysis with RETScreen – Required inputs
Selected PV panels
1.94 m2
280 Wp
Picture: SuntechEfficiency = 280 W / [1,94 m2 * 1000 W/m2] = 14.4%
Page 7
www.leonardo-energy.org
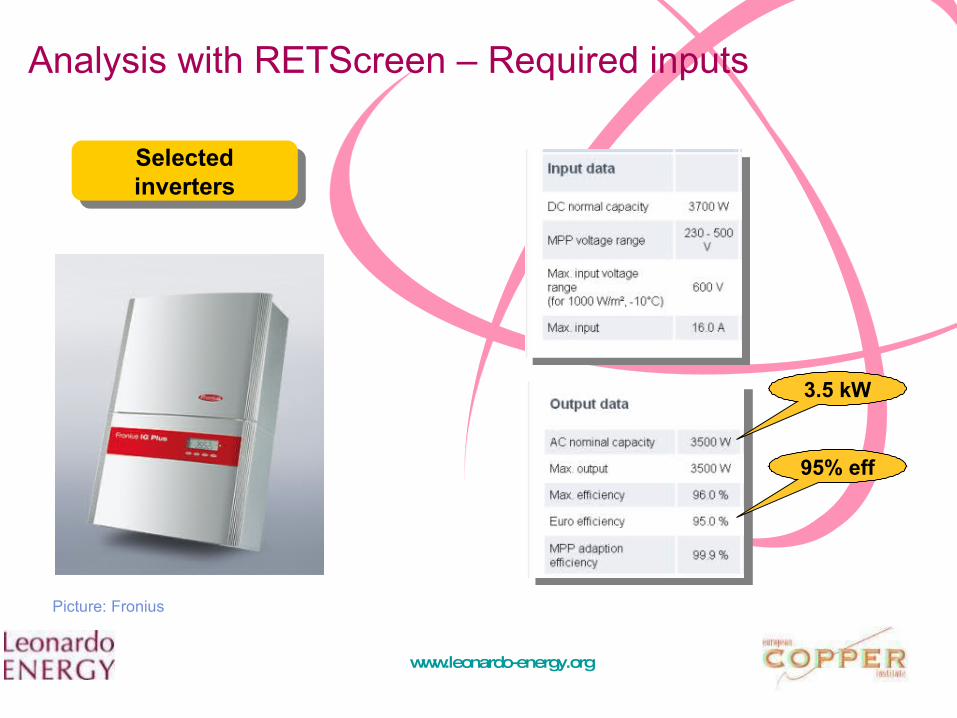
Analysis with RETScreen – Required inputs
Selected inverters
3.5 kW
95% eff
Picture: Fronius
Page 8
www.leonardo-energy.org
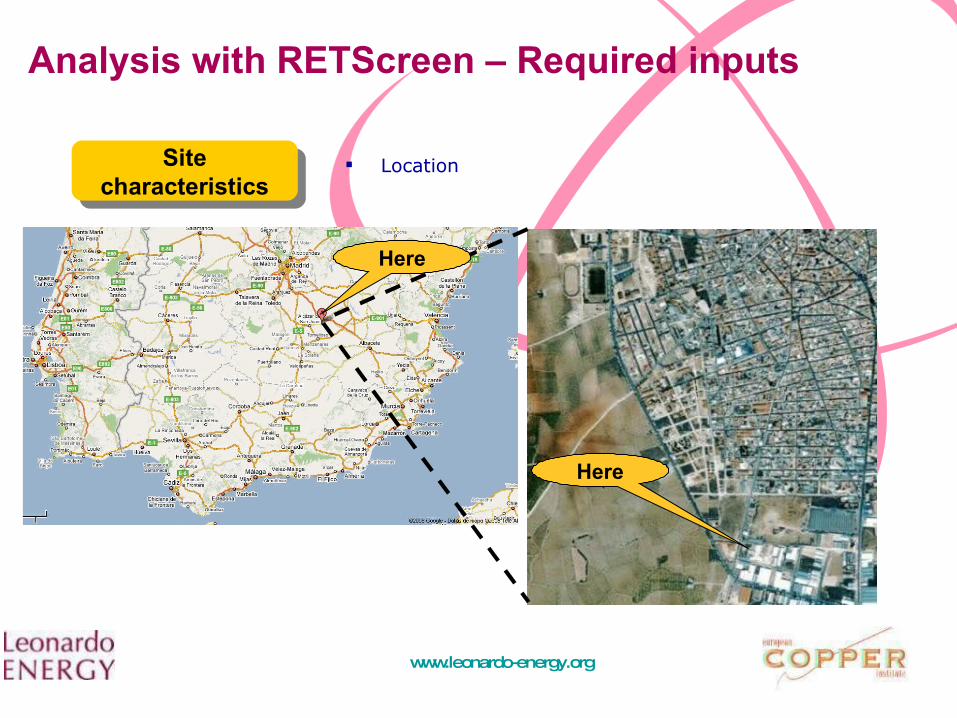
Analysis with RETScreen – Required inputs
Site characteristics
Location
Here
Here
Page 9
www.leonardo-energy.org
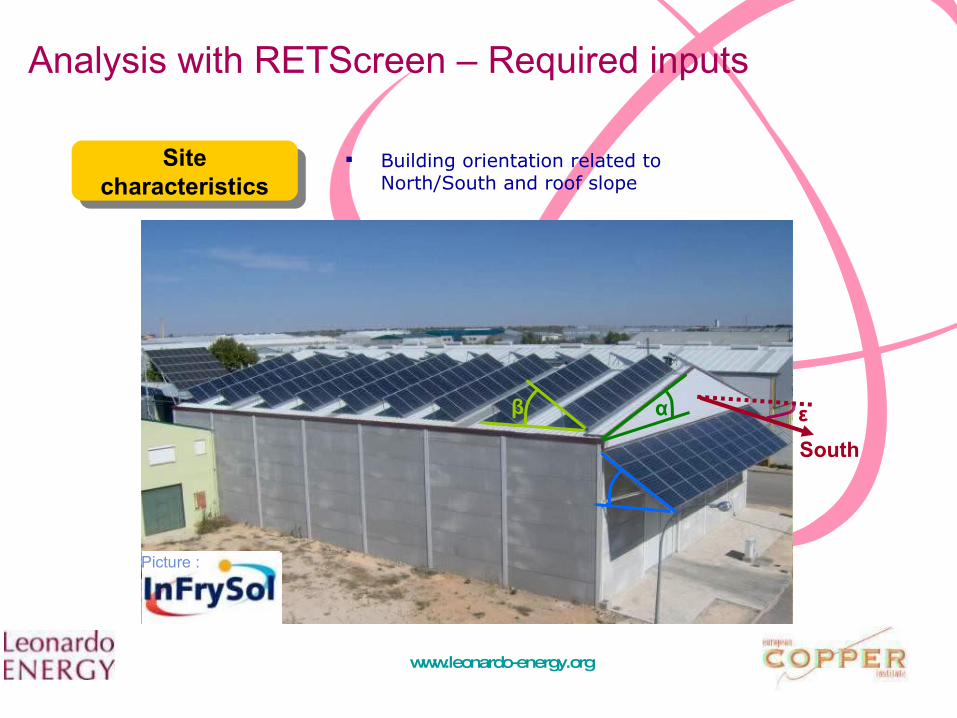
Analysis with RETScreen – Required inputs
Site characteristics
Building orientation related to North/South and roof slope
South
Picture :
εαβ
Page 10
www.leonardo-energy.org
Analysis with RETScreen – Computing
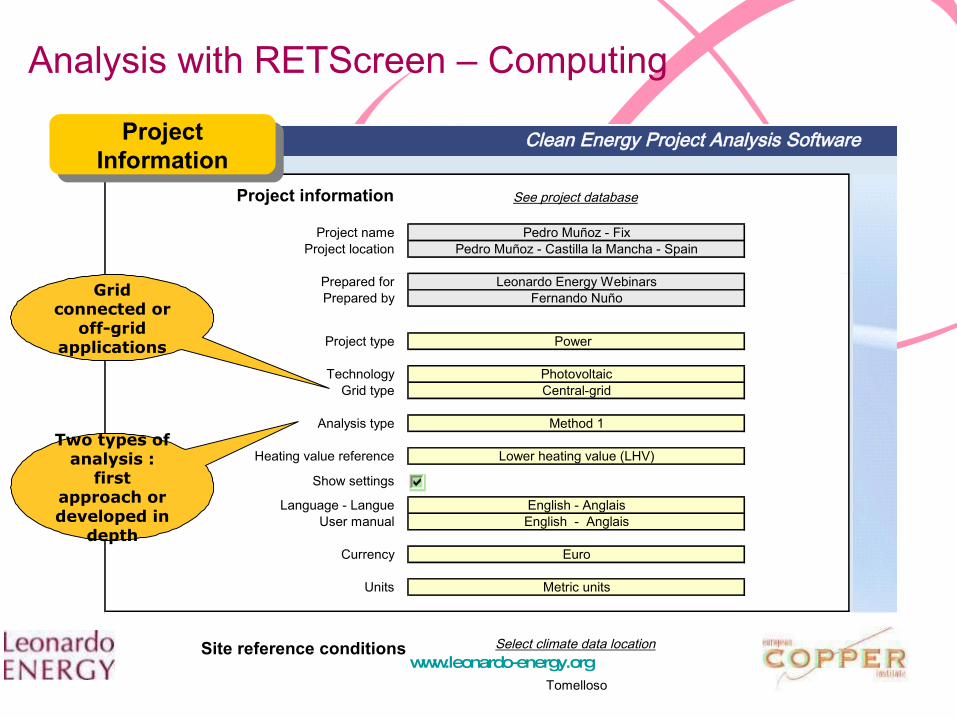
Project information
Project nameProject location
Prepared forPrepared by
Project type
TechnologyGrid type
Analysis type
Heating value reference
Show settings
Language - LangueUser manual
CurrencySymbol
Units
Climate data location
Show data
Site reference conditions
Photovoltaic
Pedro Muñoz - Fix
Clean Energy Project Analysis Software
Power
Pedro Muñoz - Castilla la Mancha - Spain
Leonardo Energy WebinarsFernando Nuño
Central-grid
Method 1
Lower heating value (LHV)
English - Anglais
Tomelloso
See project database
Select climate data location
English - Anglais
Euro
Metric units
Two types of analysis :
first approach or developed in
depth
Project Information
Grid connected or
off-grid applications
Page 11
www.leonardo-energy.org
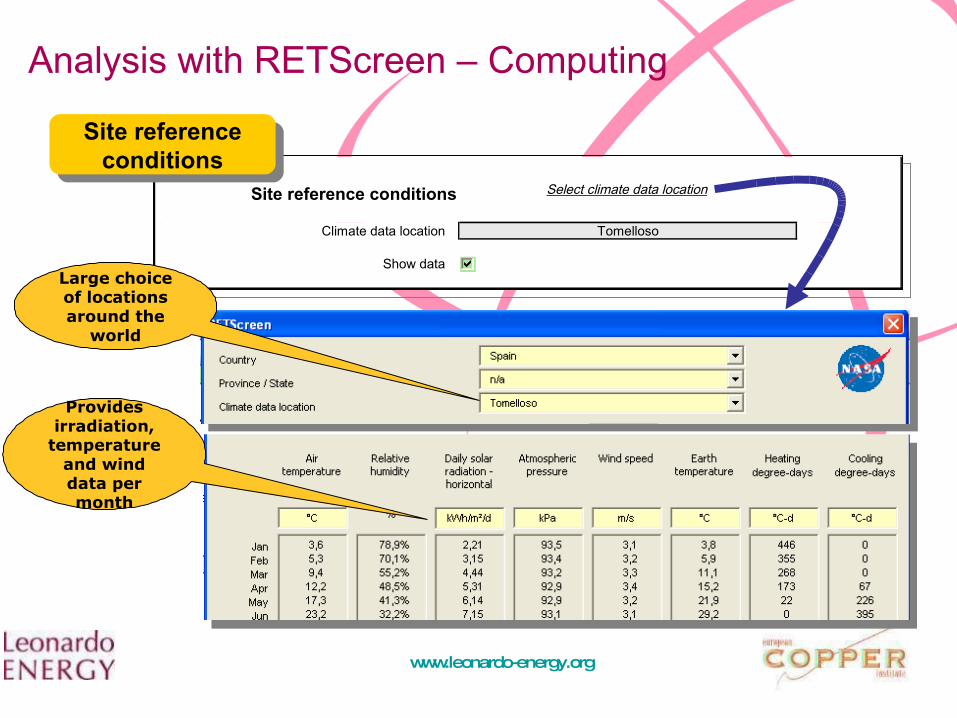
Climate data location
Show data
Site reference conditions
Tomelloso
Select climate data location
Analysis with RETScreen – Computing
Site reference conditions
Large choice of locations around the
world
Provides irradiation,
temperature and wind data per month
Page 12
www.leonardo-energy.org
Analysis with RETScreen – Computing
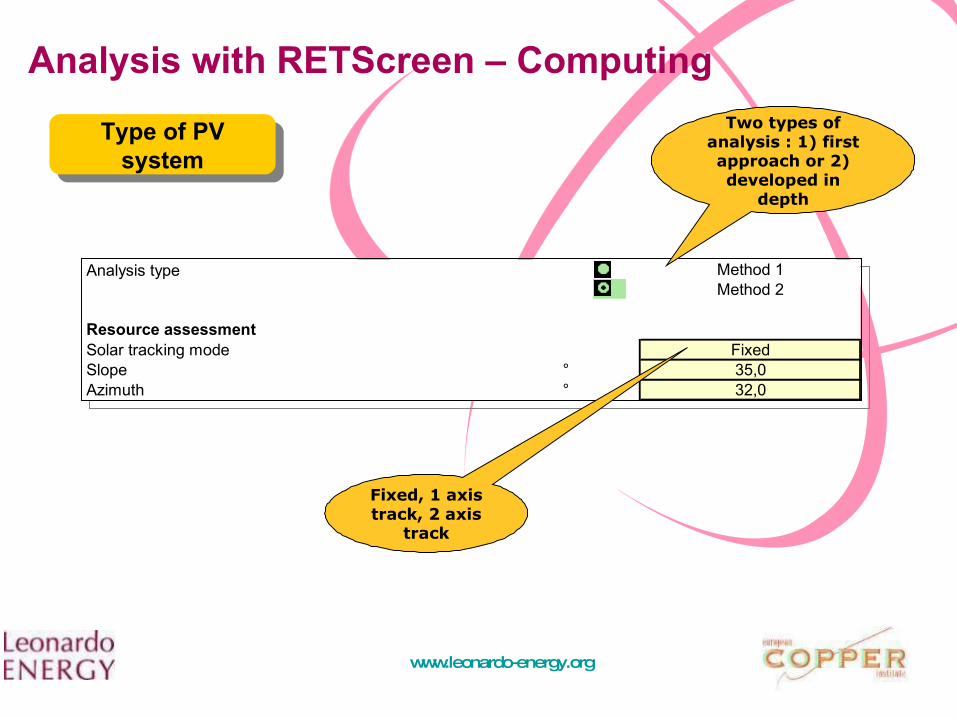
Type of PV system
Analysis type Method 1Method 2
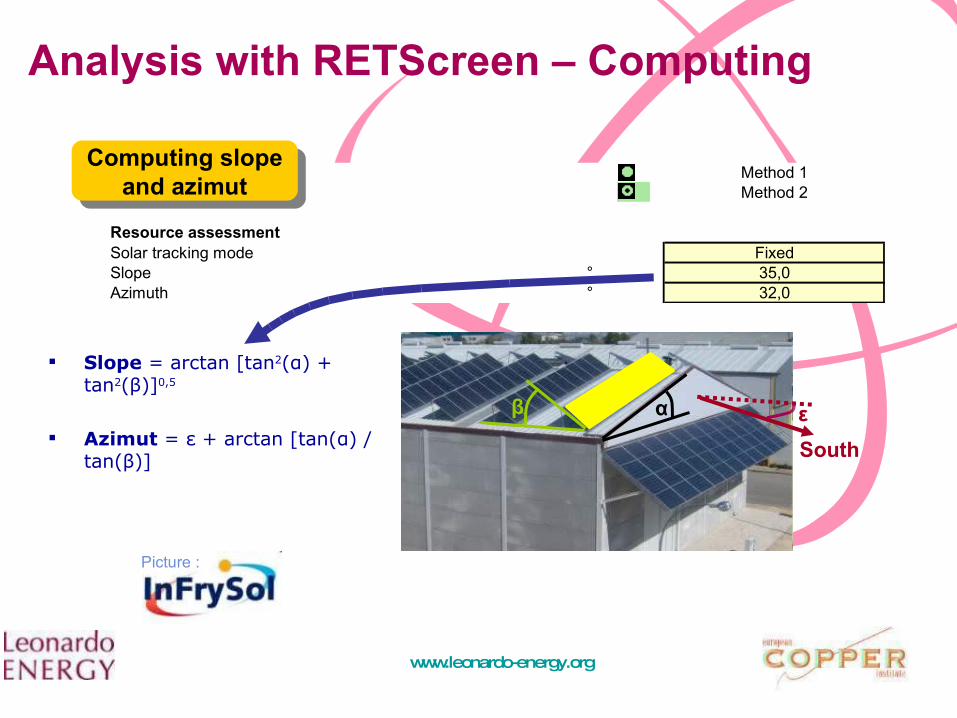
PhotovoltaicResource assessmentSolar tracking mode FixedSlope ° 35,0Azimuth ° 32,0
Two types of analysis : 1) first approach or 2) developed in
depth
Fixed, 1 axis track, 2 axis
track
Page 13
www.leonardo-energy.org
Analysis type Method 1Method 2
PhotovoltaicResource assessmentSolar tracking mode FixedSlope ° 35,0Azimuth ° 32,0
Computing slope and azimut
South
Picture :
εαβ
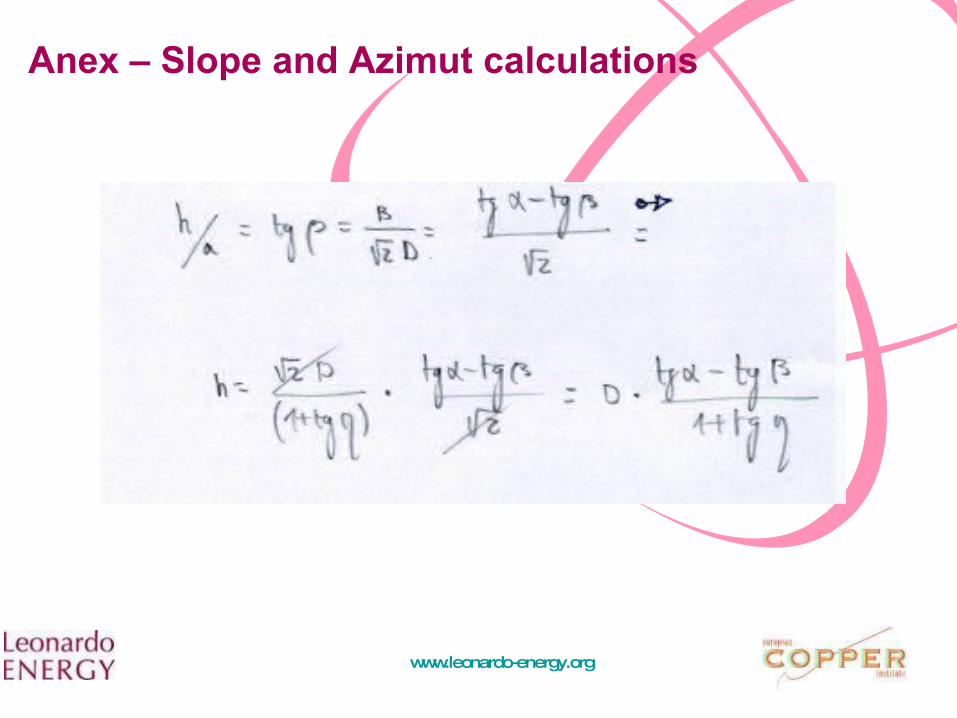
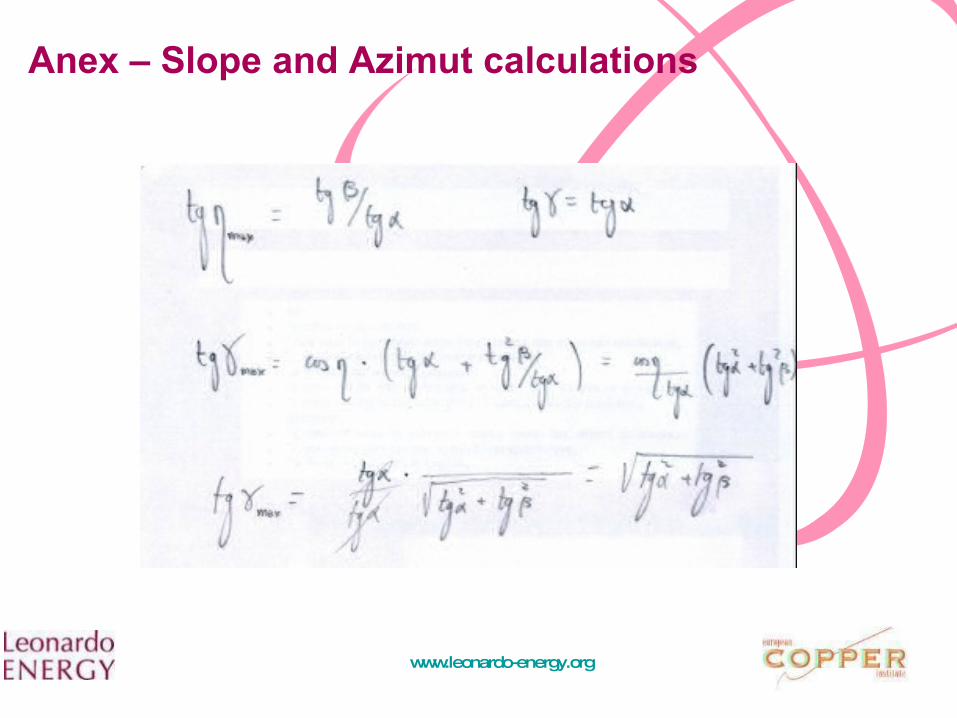
Slope = arctan [tan2(α) + tan2(β)]0,5
Azimut = ε + arctan [tan(α) / tan(β)]
Analysis with RETScreen – Computing
Page 14
www.leonardo-energy.org
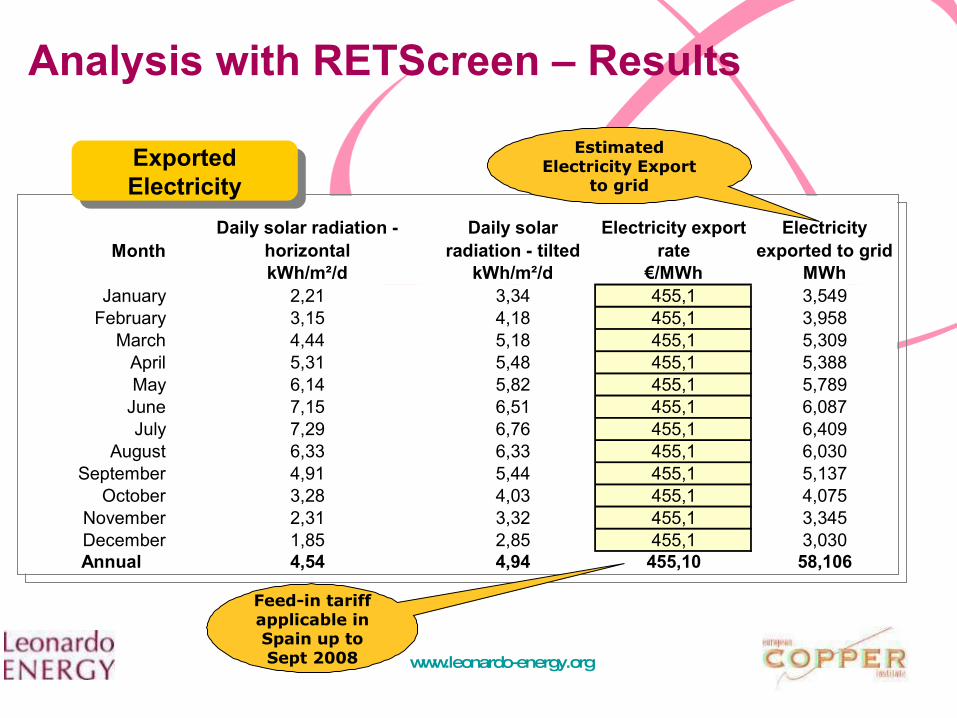
MonthDaily solar radiation -
horizontalDaily solar
radiation - tiltedElectricity export
rateElectricity
exported to gridkWh/m²/d kWh/m²/d €/MWh MWh
January 2,21 3,34 455,1 3,549February 3,15 4,18 455,1 3,958
March 4,44 5,18 455,1 5,309April 5,31 5,48 455,1 5,388May 6,14 5,82 455,1 5,789
June 7,15 6,51 455,1 6,087July 7,29 6,76 455,1 6,409
August 6,33 6,33 455,1 6,030September 4,91 5,44 455,1 5,137
October 3,28 4,03 455,1 4,075November 2,31 3,32 455,1 3,345December 1,85 2,85 455,1 3,030Annual 4,54 4,94 455,10 58,106
Analysis with RETScreen – Results
Exported Electricity
Feed-in tariff applicable in Spain up to Sept 2008
Estimated Electricity Export
to grid
Page 15
www.leonardo-energy.org
Actual - Expected Electricity Export
-35%
-30%
-25%
-20%
-15%
-10%
-5%
0%
5%
10%
15%
20%
Janu
ary
Feb
ruar
y
Mar
ch
Apr
il
May
June
July
Au
gust
Sep
tem
ber
Oct
obe
r
No
vem
ber
Dec
emb
er
Deviation %
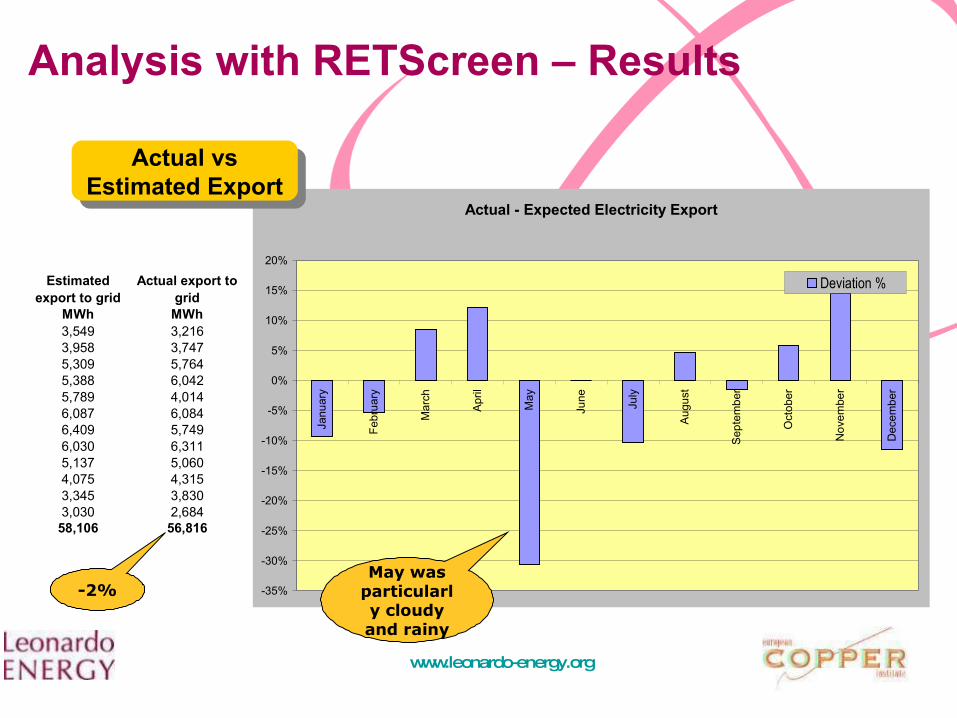
Analysis with RETScreen – Results
Actual vs Estimated Export
Estimated export to grid
Actual export to grid
MWh MWh3,549 3,2163,958 3,7475,309 5,7645,388 6,0425,789 4,0146,087 6,0846,409 5,7496,030 6,3115,137 5,0604,075 4,3153,345 3,8303,030 2,684
58,106 56,816
-2%May was
particularly cloudy and rainy
Page 16
www.leonardo-energy.org
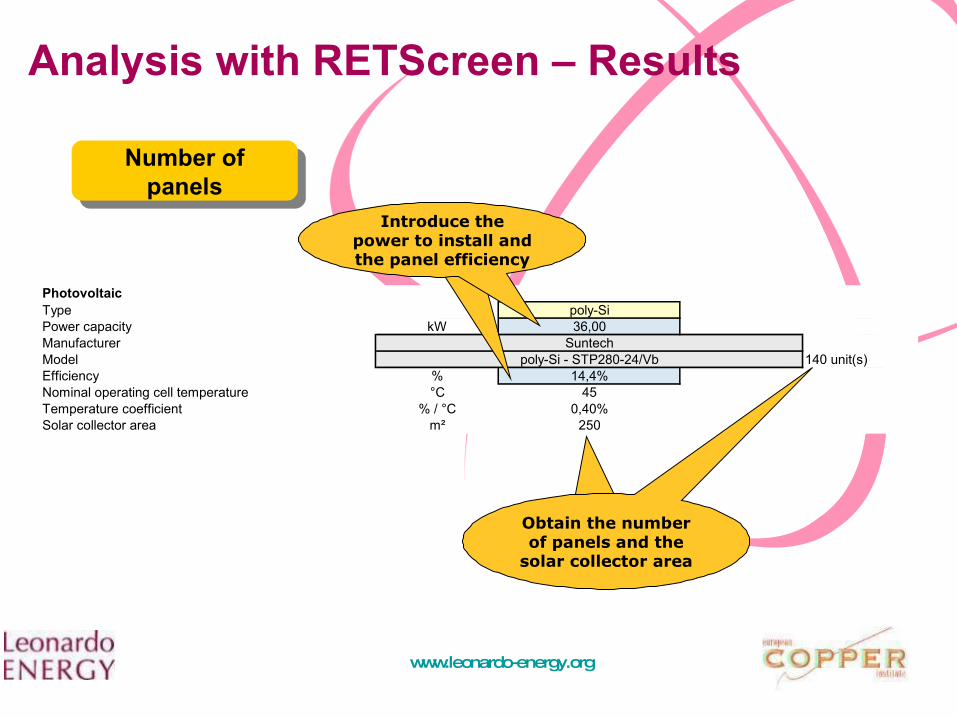
PhotovoltaicType poly-SiPower capacity kW 36,00ManufacturerModel 140 unit(s)Efficiency % 14,4%Nominal operating cell temperature °C 45Temperature coefficient % / °C 0,40%Solar collector area m² 250
Suntechpoly-Si - STP280-24/Vb
Number of panels
Introduce the power to install and the panel efficiency
Obtain the number of panels and the
solar collector area
Analysis with RETScreen – Results
Page 17
www.leonardo-energy.org
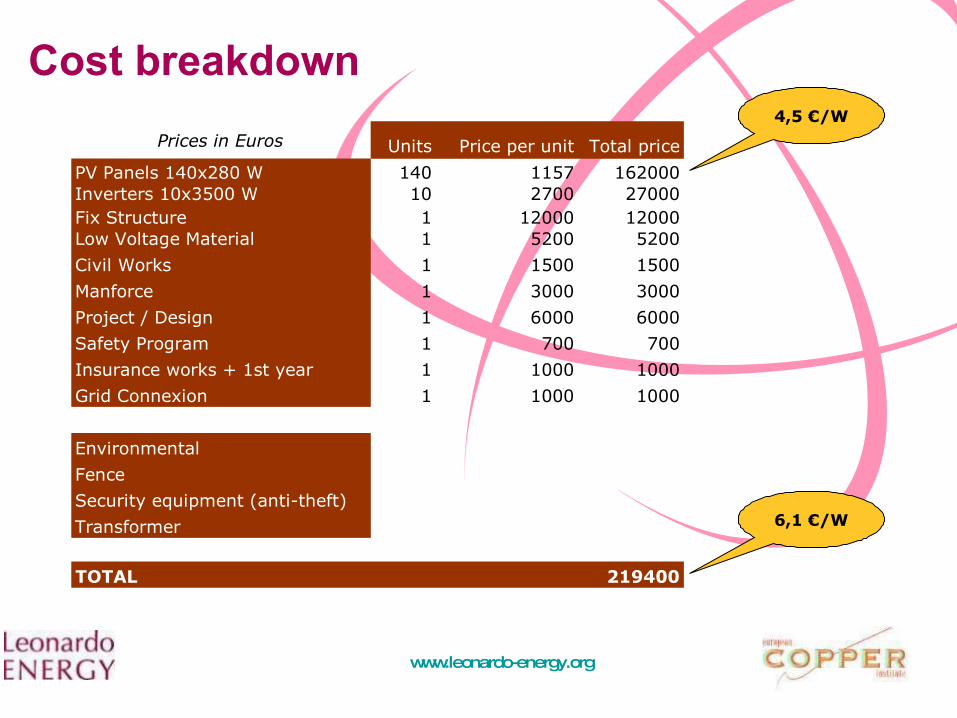
Cost breakdown4,5 €/W
6,1 €/W
Prices in Euros Units Price per unit Total price
PV Panels 140x280 W 140 1157 162000Inverters 10x3500 W 10 2700 27000Fix Structure 1 12000 12000Low Voltage Material 1 5200 5200
Civil Works 1 1500 1500
Manforce 1 3000 3000
Project / Design 1 6000 6000
Safety Program 1 700 700
Insurance works + 1st year 1 1000 1000
Grid Connexion 1 1000 1000
Environmental
Fence
Security equipment (anti-theft)
Transformer
TOTAL 219400
Page 18
www.leonardo-energy.org
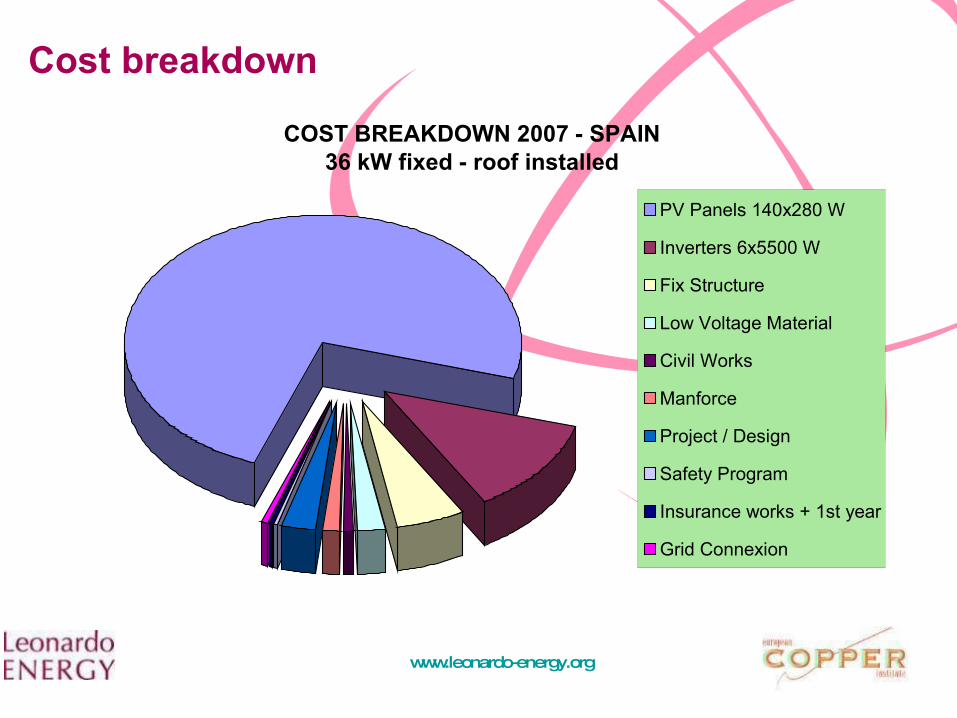
Cost breakdown
COST BREAKDOWN 2007 - SPAIN36 kW fixed - roof installed
PV Panels 140x280 W
Inverters 6x5500 W
Fix Structure
Low Voltage Material
Civil Works
Manforce
Project / Design
Safety Program
Insurance works + 1st year
Grid Connexion
Page 19
www.leonardo-energy.org
0,0% Cumulative cash flows graph
Cu
mu
lati
ve c
ash
flo
ws
(€)
Year
-100.000
0
100.000
200.000
300.000
400.000
500.000
600.000
700.000
800.000
0 1 2 3 4 5 6 7 8 9 10 11 12 13 14 15 16 17 18 19 20 21 22 23 24 25
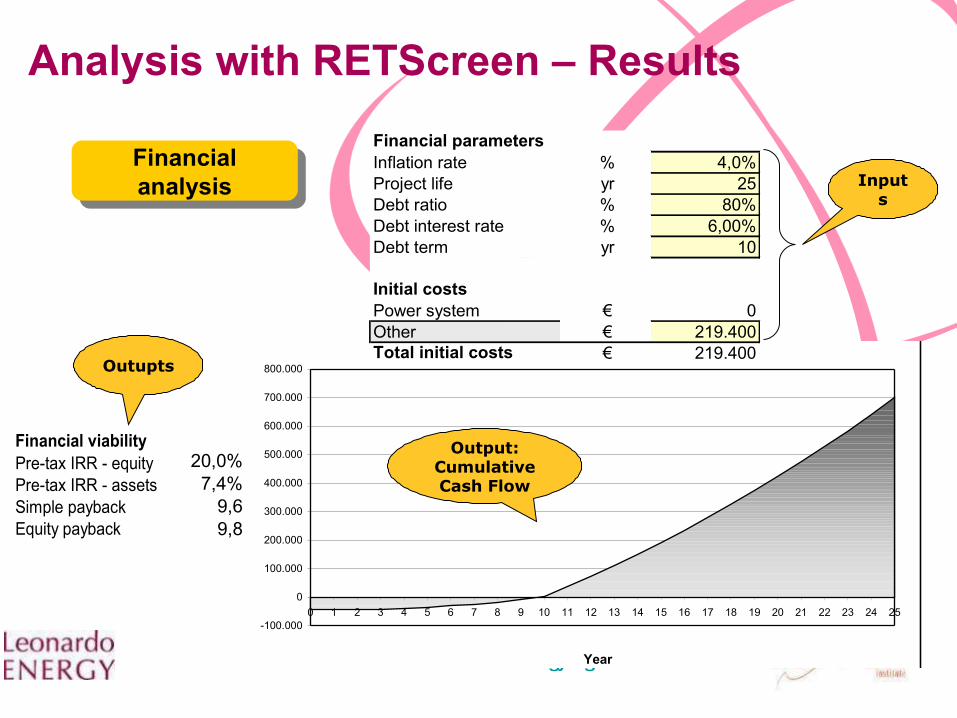
Financial analysis
Analysis with RETScreen – Results
Output: Cumulative Cash Flow
Financial viabilityPre-tax IRR - equity % 27,2%Pre-tax IRR - assets % 9,9%Simple payback yr 7,9Equity payback yr 5,6
Financial viabilityPre-tax IRR - equity % 27,2%Pre-tax IRR - assets % 9,9%Simple payback yr 7,9Equity payback yr 5,6
Inputs
Outupts
Financial parametersInflation rate % 4,0%Project life yr 25Debt ratio % 80%Debt interest rate % 6,00%Debt term yr 10
Initial costsPower system € 0Other € 219.400Total initial costs € 219.400
Financial parametersInflation rate % 4,0%Project life yr 25Debt ratio % 80%Debt interest rate % 6,00%Debt term yr 10
Initial costsPower system € 0Other € 219.400Total initial costs € 219.400
Financial parametersInflation rate % 4,0%Project life yr 25Debt ratio % 80%Debt interest rate % 6,00%Debt term yr 10
Initial costsPower system € 0Other € 219.400Total initial costs € 219.400
20,0%7,4%
9,69,8
Page 20
www.leonardo-energy.org
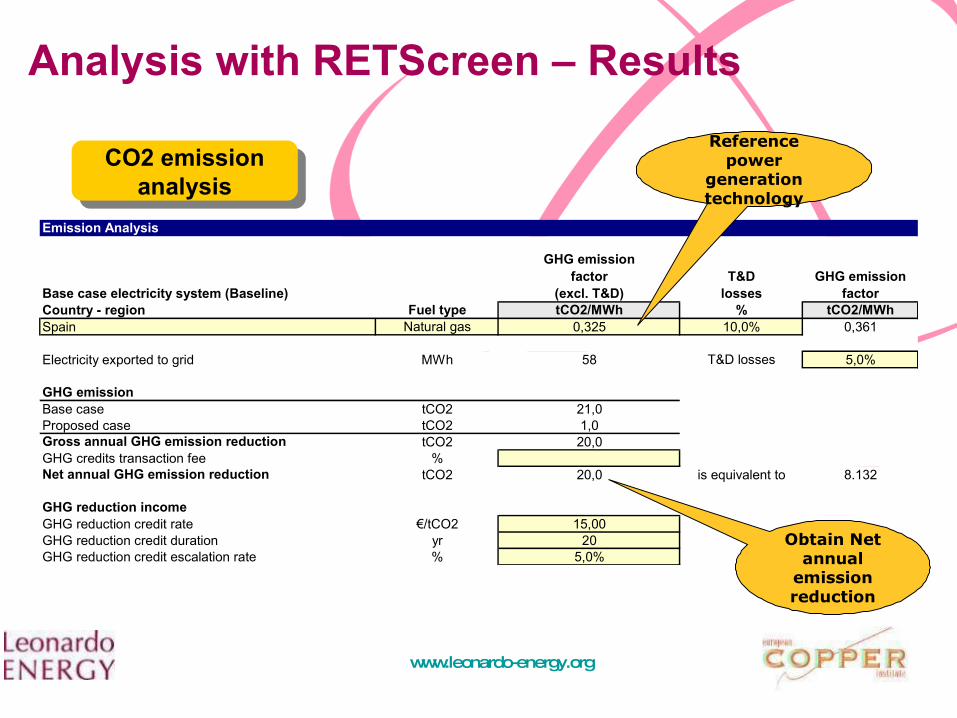
Emission Analysis
Base case electricity system (Baseline)
GHG emissionfactor
(excl. T&D)T&D
lossesGHG emission
factorCountry - region Fuel type tCO2/MWh % tCO2/MWhSpain Natural gas 0,325 10,0% 0,361
Electricity exported to grid MWh 58 T&D losses 5,0%
GHG emissionBase case tCO2 21,0Proposed case tCO2 1,0Gross annual GHG emission reduction tCO2 20,0GHG credits transaction fee %Net annual GHG emission reduction tCO2 20,0 is equivalent to 8.132
GHG reduction incomeGHG reduction credit rate €/tCO2 15,00GHG reduction credit duration yr 20GHG reduction credit escalation rate % 5,0%
CO2 emission analysis
Analysis with RETScreen – Results
Reference power
generation technology
Obtain Net annual
emission reduction
Page 21
www.leonardo-energy.org
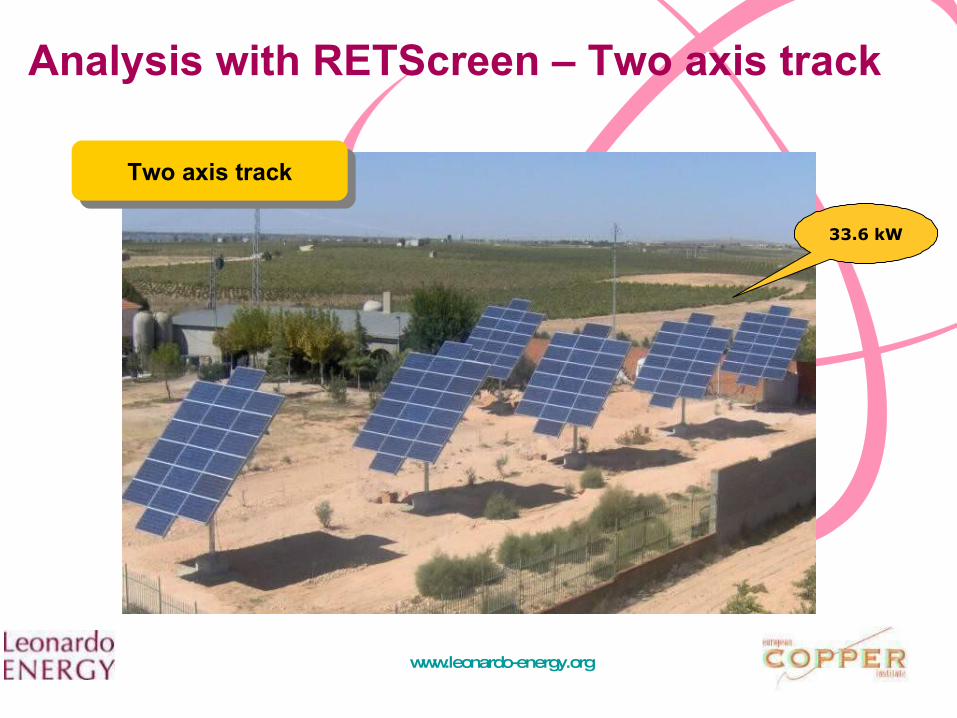
Analysis with RETScreen – Two axis track
Two axis track
33.6 kW
Page 22
www.leonardo-energy.org
Thank you!
http://www.infrysol.com/http://www.retscreen.net/
SOFTWARE CASE STUDIES by:
Page 23
www.leonardo-energy.org
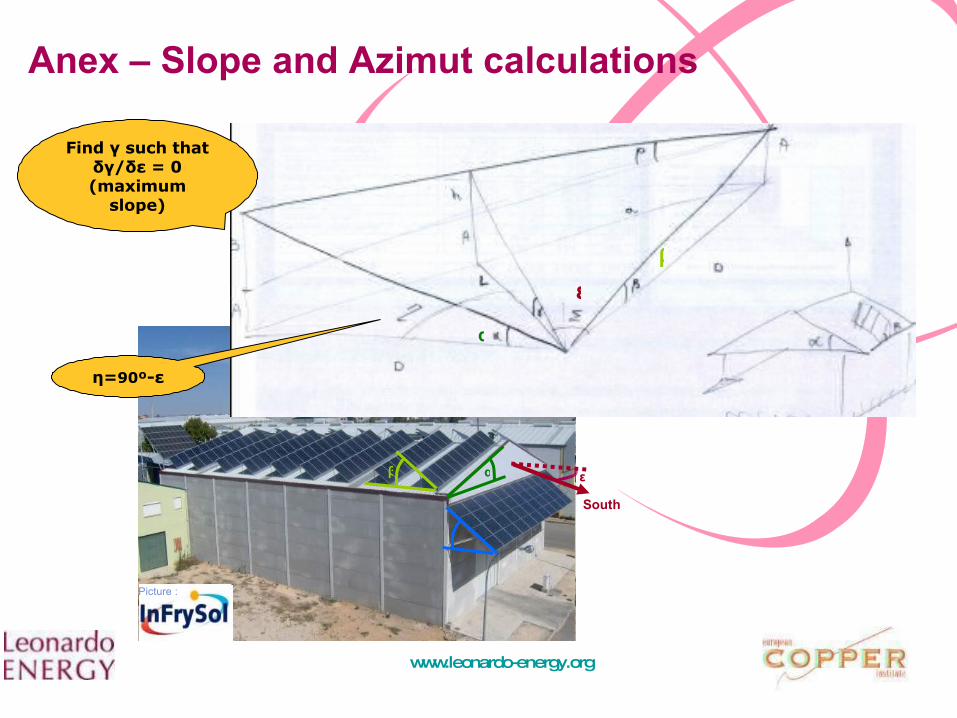
Anex – Slope and Azimut calculations
South
Picture :
εαβ
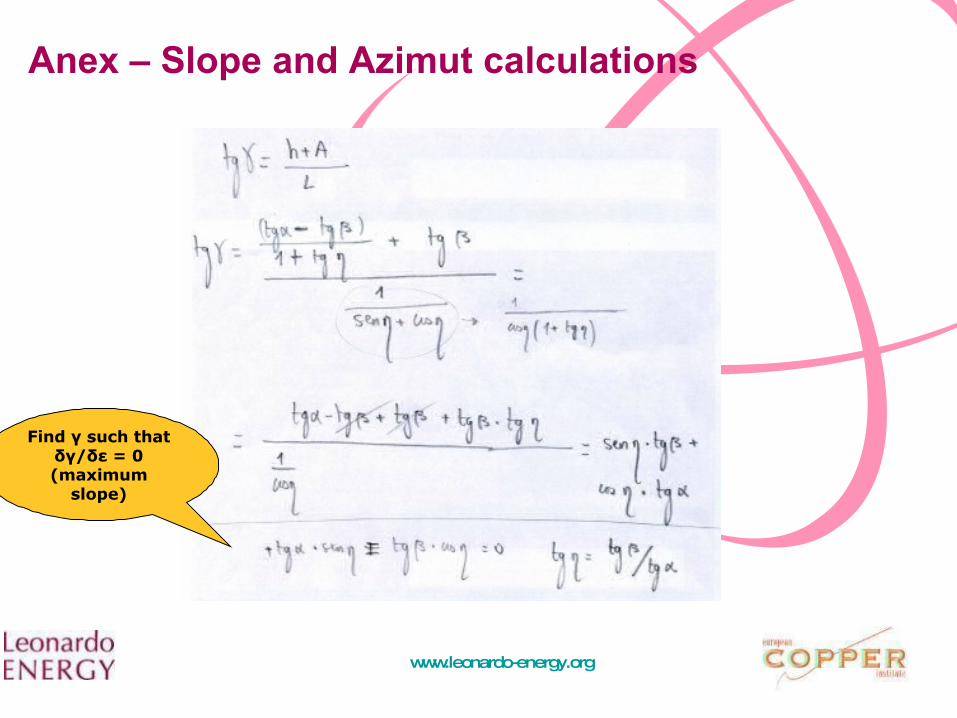
Find γ such that δγ/δε = 0 (maximum
slope)
α
β
ε
η=90º-ε
Page 24
www.leonardo-energy.org
Anex – Slope and Azimut calculations
Page 25
www.leonardo-energy.org
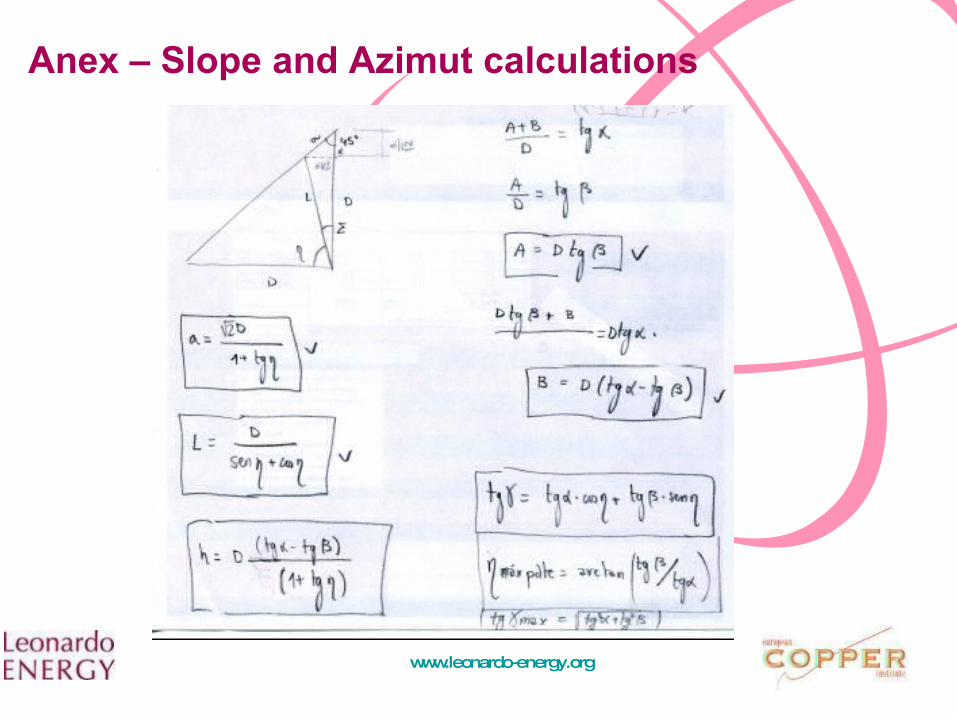
Anex – Slope and Azimut calculations
Page 26
www.leonardo-energy.org
Anex – Slope and Azimut calculations
Find γ such that δγ/δε = 0 (maximum
slope)
Page 27
www.leonardo-energy.org
Anex – Slope and Azimut calculations
Page 28
www.leonardo-energy.org
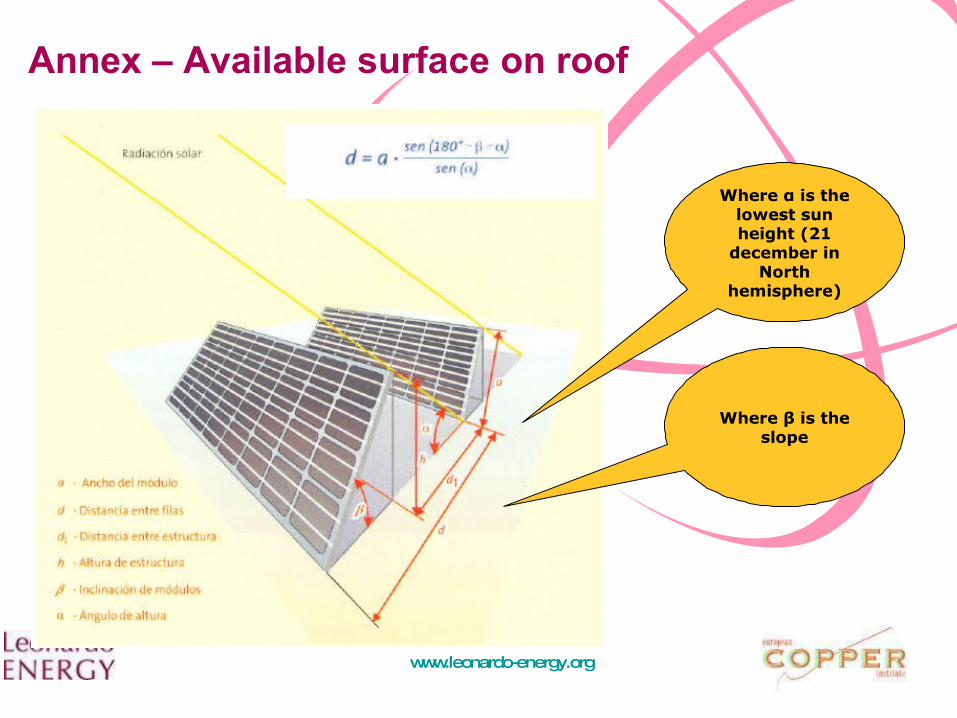
Annex – Available surface on roof
Where α is the lowest sun height (21
december in North
hemisphere)
Where β is the slope