CHAPTER 2 ....................................................................................................................... 6 Literature Review............................................................................................................ 6
2.1 Introduction ........................................................................................................... 6 2.2 Power Supply Options for Remote Areas ............................................................. 6
2.3 Hybrid Power System Configurations ................................................................ 13
2.4 System Benefits .................................................................................................. 17 2.5 Battery Storage.................................................................................................... 18 2.6 Solar Resource Characterization ......................................................................... 20 2.7 Energy dispatch strategy ..................................................................................... 23 2.8 System sizing ...................................................................................................... 24
CHAPTER 3 ..................................................................................................................... 29 RESEARCH METHODOLOGY.................................................................................. 29
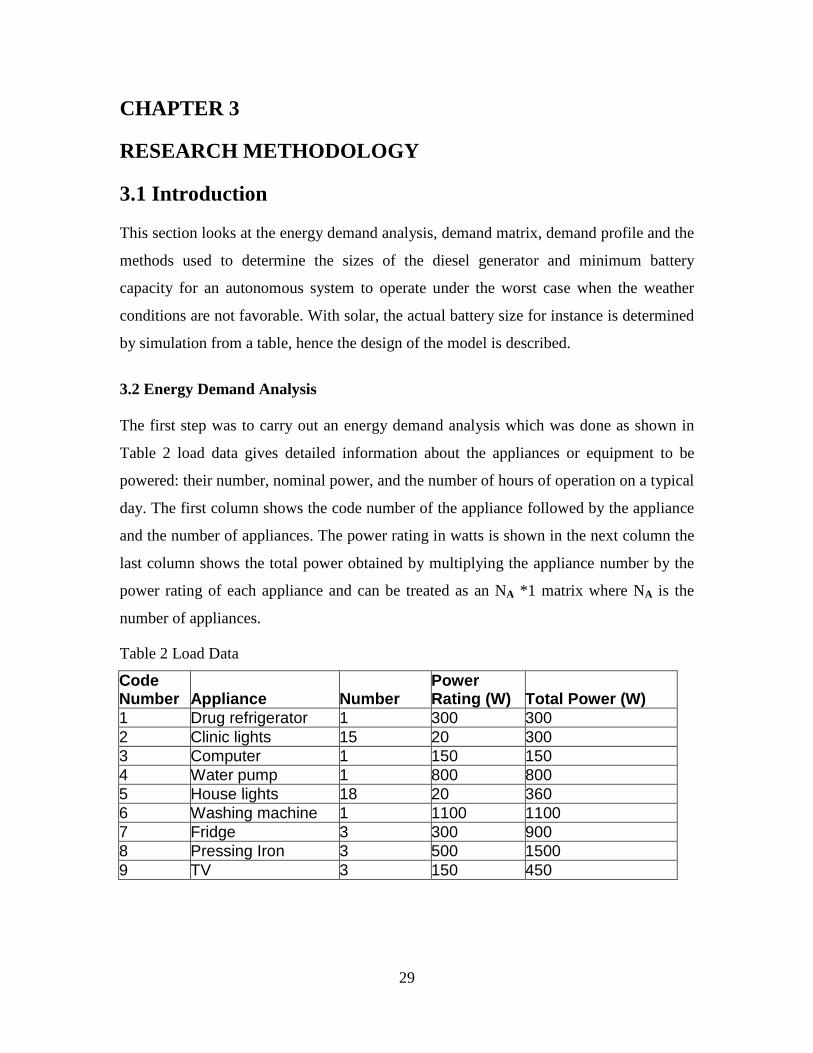
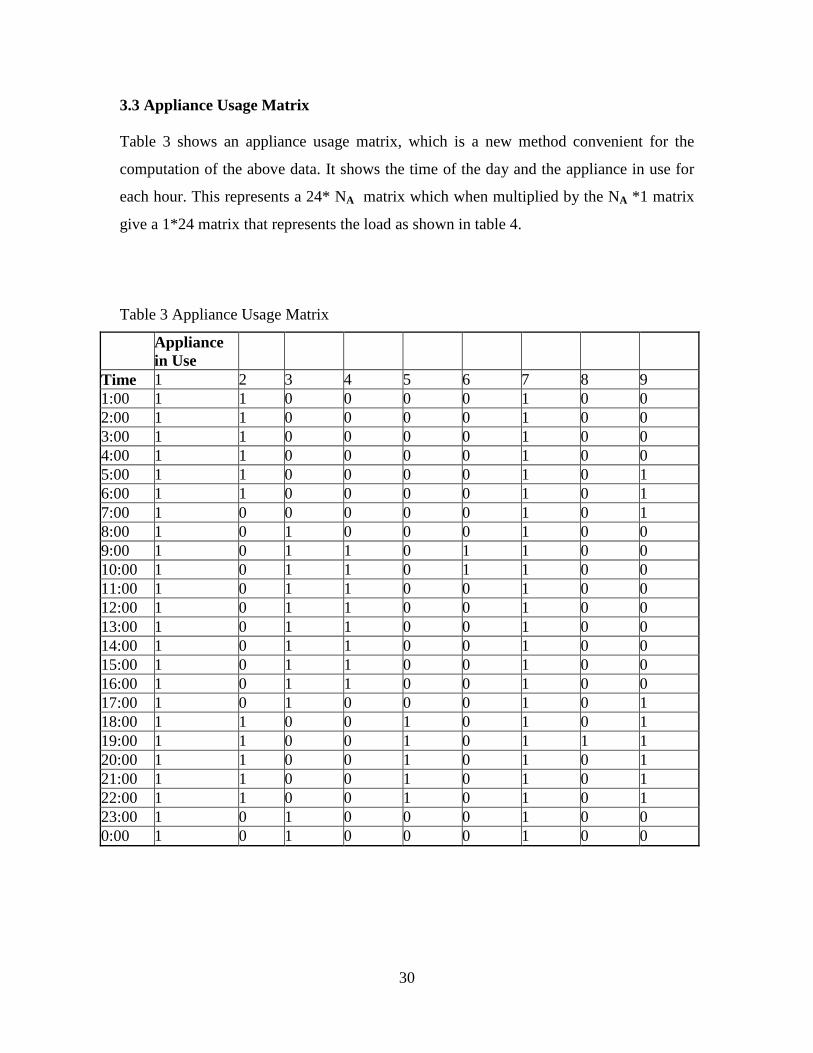
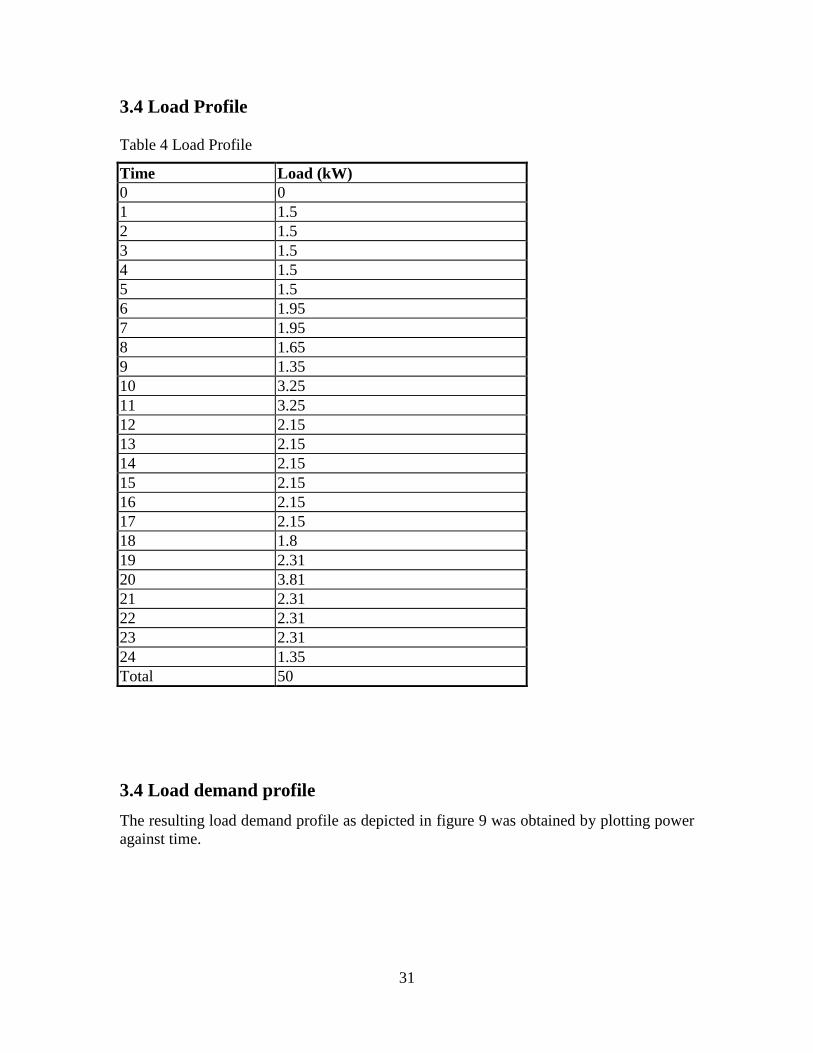
3.1 Introduction ......................................................................................................... 29 3.2 Energy Demand Analysis ................................................................................... 29 3.3 Appliance Usage Matrix ..................................................................................... 30 3.5 Sizing of System Components ............................................................................ 32 3.6 The Study Model For The PV-Diesel-Battery Power Supply System Performance Simulation............................................................................................ 35
CHAPTER 4 ..................................................................................................................... 46 Results and Analysis ..................................................................................................... 46
4.1 Introduction ......................................................................................................... 46 4.2 Load Sharing ....................................................................................................... 46 4.5 Relationship between Battery Capacity and Battery Life ................................... 54
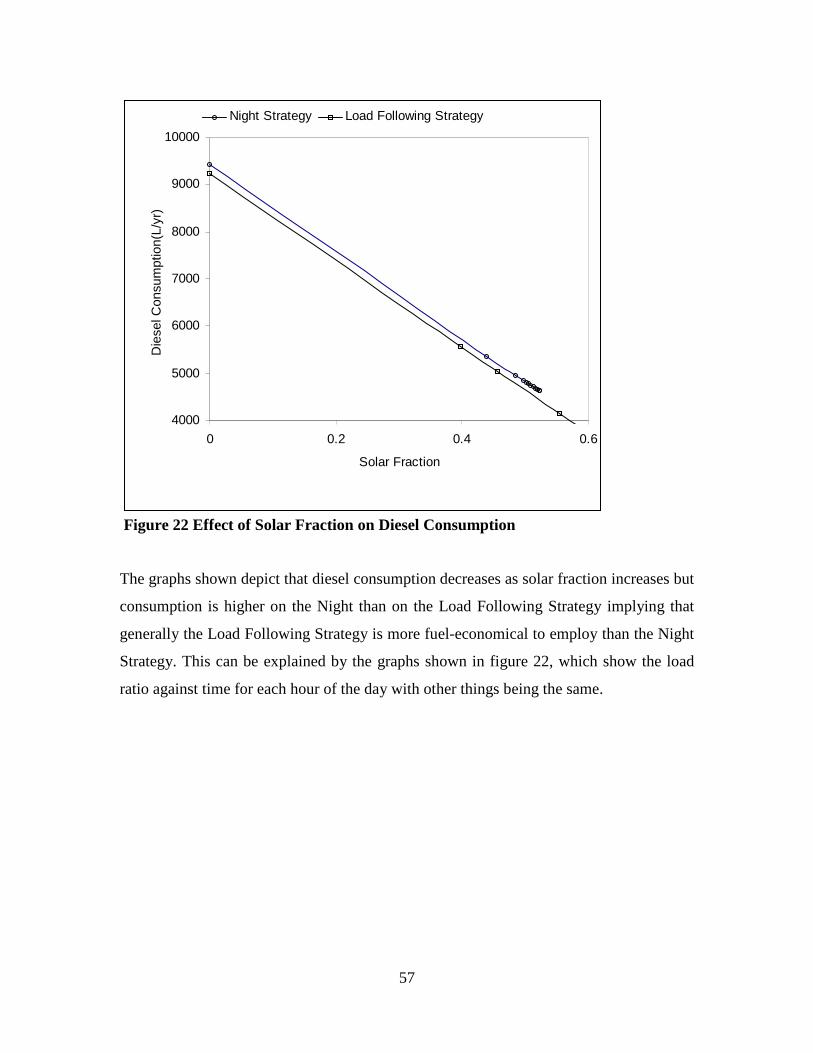
4.6 Effect of Solar Fraction on Diesel Consumption ................................................ 56
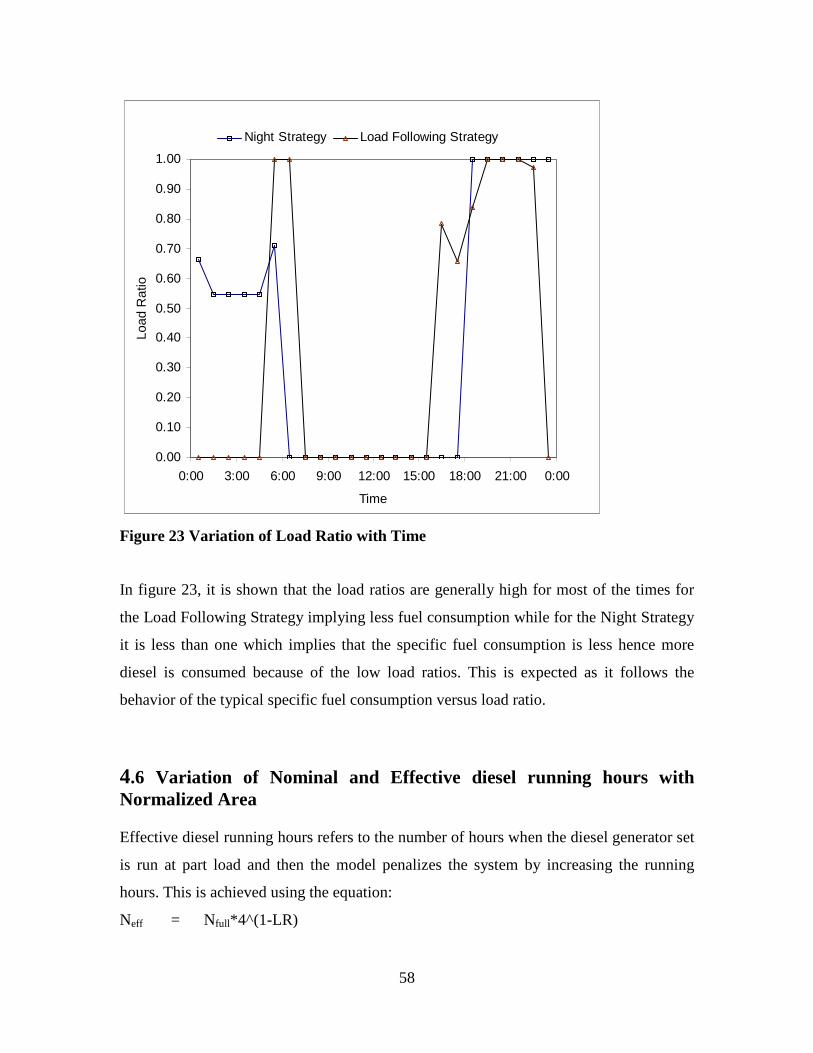
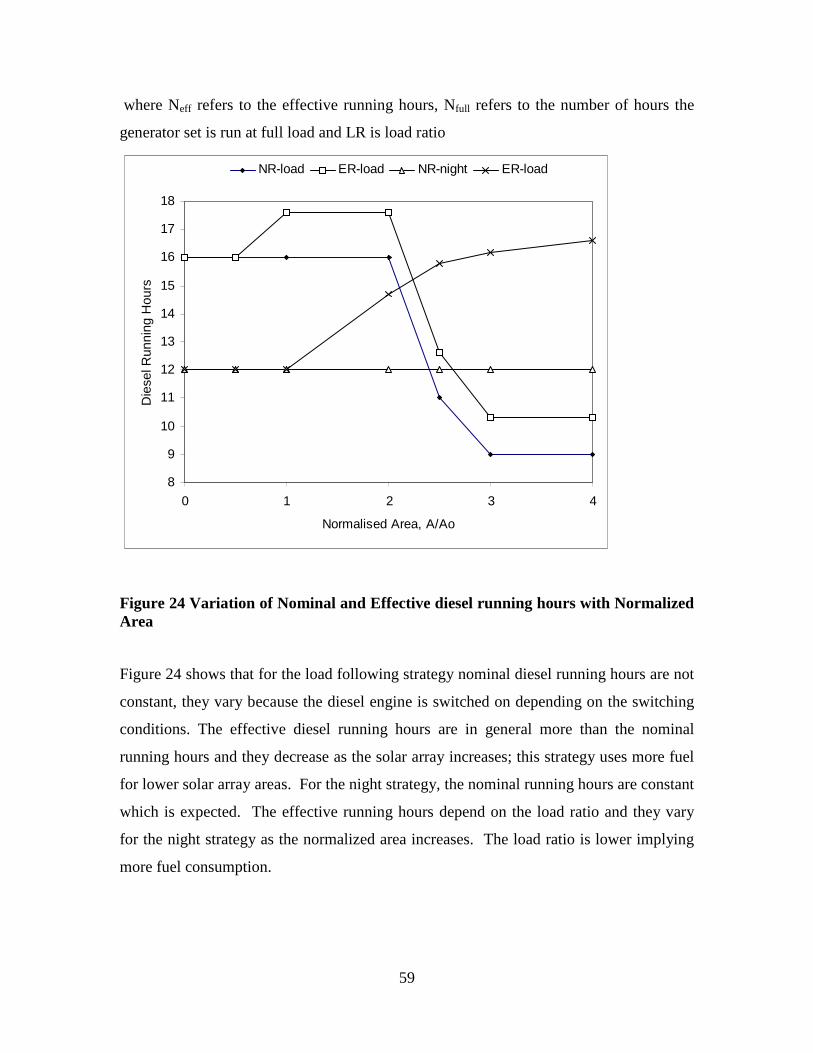
4.6 Variation of Nominal and Effective diesel running hours with Normalized Area................................................................................................................................... 58
4.7 Discussion on Findings ....................................................................................... 60 CHAPTER 5 ..................................................................................................................... 62
OPTIMAL SIZING OF THE PV/DIESEL/BATTERY HYBRID SYSTEM .............. 62 5.1 Introduction ......................................................................................................... 62 5.2 Sizing the PV array ............................................................................................. 62 5.3 Sizing the battery ................................................................................................ 65 5.4 Specifications for the battery bank ..................................................................... 67 5.5 Sizing the inverter ............................................................................................... 67 5.6 Sizing the charge Controller ............................................................................... 68 5.7 Sizing and Operating Parameters for the two dispatch strategies ....................... 69
Figure 1 Layout of a typical PV Hybrid Power Supply System ......................................... 3 Figure 2. Direct-coupled PV system. .................................................................................. 7 Figure 3 Diagram of stand-alone PV system with battery storage powering DC and AC
loads. ........................................................................................................................... 8 Figure 4 A typical curve for specific fuel consumption versus load ratio. ....................... 10 Figure 5 Diagram of photovoltaic hybrid system. ............................................................ 12 Figure 6 Series hybrid system .......................................................................................... 13 Figure 7 Switched configuration ..................................................................................... 15 Figure 8 Parallel configuration ......................................................................................... 16 Figure 9 Load Demand Profile For a Typical Rural Clinic .............................................. 32 Figure 10 Cumulative normalized load and diesel power against time ............................ 35 Figure 11 Unsatisfied Load for the Night Strategy ........................................................... 47 Figure 12 Unsatisfied Load for the Load Following Strategy ......................................... 47 Figure 13 Load Sharing for the for the Night Strategy .................................................... 48 Figure 14 Load Sharing for Load following Strategy ...................................................... 48 Figure 15 Effect of Normalized Area On Annual Solar Fraction and Diesel Consumption
................................................................................................................................... 49 Figure 16Diesel consumption against Normalized Area .................................................. 51 Figure17 Relationship between Normalized Area and Battery Life…………………… 52 Figure 18 Actual Depth of Discharge of the battery over the Rated Depth of Discharge 53 Figure 19 Actual Rate of Discharge over Rated Rate of discharge against Time ............ 54 Figure 20 Relationship Between Battery Capacity and Battery Life for the Night Strategy
................................................................................................................................... 55 Figure 21 Relationship Between Battery Capacity and Battery Life for the Load
Following Strategy .................................................................................................... 56 Figure 22 Effect of Solar Fraction on Diesel Consumption ............................................ 57 Figure 23 Variation of Load Ratio with Time .................................................................. 58 Figure 24 Variation of Nominal and Effective diesel running hours with Normalized Area
Table 1 Summary of merit and demerits of different power supply systems ................... 17 Table 2 Load Data ............................................................................................................. 29 Table 3 Appliance Usage Matrix ...................................................................................... 30 Table 4 Load Profile ......................................................................................................... 31 Table 5 Battery and Diesel generator sizing ..................................................................... 33 Table 6 Monthly Average Hourly Solar Radiation Over Bulawayo For The Year 1999 . 42 Table 7 Mean hourly ambient temperature for Bulawayo for the period 1975 - 1990 ..... 43 Table 8 PV Array Parameters ........................................................................................... 44 Table 9 Battery Parameters ............................................................................................... 44 Table 10 Diesel Generator set Parameters ........................................................................ 45
iv
Nomenclature
Ih Hourly global irradiation on a horizontal plane
Id Hourly diffuse irradiation
Ibn Hourly normal beam irradiation [ MJ/m2 ]
Ipv Instantaneous or hourly radiation on the array surface
Ipv, NOCT Hourly irradiation on the array surface [MJ/m2 ]
Hh Monthly average daily global irradiation on a horizontal
plane
rd Factor for converting monthly average diffuse irradiation to monthly
average hourly diffuse irradiation.
Id Monthly average hourly diffuse irradiation (=rdHd) [MJ/m2 ]
Ih factor for converting monthly average daily global irradiation on a
horizontal plane to monthly average hourly global irradiation on a
horizontal plane
Ipv Monthly average hourly irradiation on the array surface
ω Hour angle measured from solar non; +ve for afternoon [radians]
ωs sunset hour angle [radians]
ω’ s sunset angle on an inclined plane [radians]
φ latitude of location; +ve North, -ve South [radians]
δ the sun’s declination angle [radians]
θz angle of incidence of direct irradiance on the horizontal
plane [radians].
θarray angle of incidence of direct irradiance on the array play [radians]
s Array tilt angle from the horizontal [radians]
C Concentration ratio: radio of collector aperture to absorber area
η The efficiency of the array to convert incidence solar radiation
into electrical energy..
ηr Is the PV generator efficiency measured at reference cell temperature, Tr,
i.e. under Standard test conditions (25oC).
v
β Is a temperature coefficient for cell efficiency (typically 0.004 to
0.005/oC),
Tr Reference cell temperature for efficiency [0C]
Tc Cell temperature [OC]
Tc, NOCT Cell temperature at nominal operating cell temperature (NOCT) conditions
[ 0C]
Ta Ambient temperature [ 0C]
Ta, NOCT Ambient temperature at (NOCT) conditions [ 0C]
A PV array radiation collection area [m2 ]
A0 The array area that would be required to satisfy the daily load if the array
delivered a constant power throughout the day at reference efficiency and
reference radiation condition [m2 ].
Qpv Hourly electrical energy output of the array
Ls The hourly energy contributed to the load by solar energy
Lday Daily energy demanded by the load
Bgain Hourly energy gain of the storage battery
Bcap Effective battery capacity [kWh]
Blevel Battery energy level at beginning of hour in question [kWh
ηpv Is the efficiency of the PV generator
Tmin Minimum time the battery is allowed to discharge from full capacity to
empty [hours]
DODmax Maximum allowable depth of discharge
DA/DR The ratio of the average depth of discharge of the battery during the
discharge event (DA), to the manufacturer’s rated discharge (DR)
IA/IR The ratio of the rate of discharge during the discharge event to the
manufacturer’s rated discharge rate
QD Is the hourly diesel energy output,
vi
Lo The hourly battery charge or discharge depends on the size of the hourly
load
Qpv PV-generated power
vii
DEDICATION
I wish to express my gratitude and appreciation to the individuals who contributed
immensely to the success of this study. These include my supervisor, Mr Hove, husband
Wellington and children Ashley and Wellington (Junior). Special dedication to my late
mother, Christina Zvinowanda, may her soul rest in peace.
1
CHAPTER 1
INTRODUCTION
1.0 Introduction
Many rural areas of developing countries lack supply of electricity due to poor
distribution of grid electricity and financial resources to aid grid extension (Urmee et al,
2009). These countries usually have under capacity in electricity generation with the
scarce electricity being allocated to the more important urban sector. The relatively low
energy demand in rural areas does not compensate the cost of long-range transmission
lines from the national grid. This justifies the use of more decentralised forms of power
supply systems which need to be modular in nature and widespread in distribution so that
they can be built anywhere near the locations of use. Such power supply systems should
be able to provide uninterrupted power supply. Options for providing these include
stand-alone renewables, diesel generator sets or a combination of these forms of energy
in a hybrid system.
Wind energy, can be a good power supply option but in Zimbabwe the problem is that
wind speeds are not enough for power generation. Wind speed determines the power
output from wind generators and the output increases significantly as the wind speed
increases. A wind turbine installed in an area with a good wind resource can produce
energy cost-effectively, for instance, if wind speed is doubled the system becomes about
eight times cheaper (Ackermann, 2005). However, the available wind resource typically
varies from season to season, this creates a significant variation in the wind turbine
output and some areas do not have sufficient wind speeds for power generation thus
limiting resource use.
Another renewable resource is solar energy which is abundant in nature especially in
most developing countries and Zimbabwe for example, receives more than 2000 sunshine
hours per year. Solar stand-alone systems use photovoltaic modules to supply total
electric needs. Photovoltaic systems have a number of merits over conventional power-
generating technologies. PV systems can be designed for a variety of applications and
2
operational requirements, and can be used for either centralized or distributed power
generation. PV systems have no moving parts, are modular, easily expandable and even
transportable in some cases. This system is completely independent of traditional energy
sources and this energy independence and environmental compatibility are two attractive
features of PV systems. The fuel (sunlight) is free, and no noise or pollution is created
from operating PV systems. In general, PV systems that are well designed and properly
installed require minimal maintenance and have long service lifetimes (Nayar et. al,
1993)
The amount of power produced by renewable energy devices such as photovoltaic cells
and wind turbines varies significantly on an hourly, daily and seasonal basis due to the
variation in the availability of the sun, wind and other renewable resources. This
variation means that sometimes power is not available when it is required and on other
occasions there is excess power. PV stand-alone systems are also not suitable for high
energy-intensive applications. However, to deliver continuous uninterrupted power
supply, the PV array and battery of a stand alone solar system have to be excessively
over-sized leading to high capital costs. For undersized systems, power shortages will be
experienced and the batteries may be damaged by excessive discharge.
Another energy supply option for remote areas is the stand-alone diesel generator sets,
which are relatively inexpensive to purchase but expensive to operate and maintain
(Karnavas and Papadopoulos, 1999). Some generator sets will produce DC electricity for
charging batteries directly and AC electricity for running appliances and electrical
equipment. Advantages of this option are the low initial capital costs and generation of
power on demand. Gensets can be operated with or without a battery but the problem is
that if there is no battery they have to be sized for peak power and are therefore less
efficient when the load ratio is low. When a genset is designed this way it will operate at
partial load for most of its operating life yet specific fuel consumption characteristics of a
typical diesel engine show that a diesel generator must be operated above a certain
minimum load level in order to maintain efficiency and to reduce the possibility of
premature failures (Beyer et al, 2003).
3
Generator units perform best when operated near their rated output. As the load on the
generator decreases so does the efficiency of the unit. If a generator set runs for long
periods at very low loads, significant maintenance problems can occur to include wet
stacking. Diesel generators also emit substantial quantities of carbon dioxide per unit of
electricity (Beyer et al, 2003). Generally diesel gensets are noisy, have short durability,
cause environmental pollution and are expensive to run and maintain. Another
disadvantage is that diesel engines use petroleum fuel, which is imported for most
countries using premium foreign currency. The rising fuel costs and the impracticality of
running generators for long periods at low loads has led to the introduction of renewable
energy equipment, batteries and inverter technologies, which reduce fuel costs and
maintenance and provide continuous power supply.
An attractive option for power supply that eliminates most of the disadvantages of both
diesel and renewable stand-alone is the hybrid concept. Hybrid systems consist of
combination of a PV array and a complementary means of electricity generation such as a
diesel, gas or wind generator. Figure 1 shows the general layout of a hybrid system.
Battery Inverter
AC Load
ChargeController
PV Array DC Load
Alternator
Engine
Figure 1 Layout of a typical PV Hybrid Power Supply System
A key feature of hybrid systems is the fact that their constituent system strengths
compliment one another thus providing a number of advantages, which are also
determined in part by the system type. These include significantly greater reliability in
power supply due to the use of two or more energy sources, more efficient system
solutions by virtue of a high degree of flexibility during the design phase and in
4
operation, lower overall maintenance costs due to the shorter operating cycles of the
motor generator units and longer service life time of components as a result of reduced
use (Kaikhurst, 1998). The main problem of hybrid power supply systems is that they are
more complex when compared with stand-alone systems in terms of system sizing and
operation strategy of components. Other disadvantages include additional investment cost
of renewable energy sources, batteries and power electronics, limited experience of
customers and supply utilities with renewable energy and hybrid power system
technology and life cycle economic analysis required that is based on detailed system
simulation.
Sizing of such systems require simulation of power flows in the system, for example, to
decide when the diesel engine is dispatched, what size of array, battery life and many
other variables. The sizing requires an economic analysis but this research is concerned
with developing a simulation model to analyze the energy performance of a power supply
system comprising a PV array, battery, power conditioning equipment etc. The model
should be able to come up with information like solar fraction for a given area, battery
life, load satisfied and diesel fraction among other things.
The outputs from the model will be used to rationally decide on sizing of the components
of the power supply system like the generator, battery, PV array which is done for
different dispatch strategies. Dispatch strategy is the criteria used to decide when the
genset of a hybrid system is turned on and when it is turned off. The outputs will also be
used to show how the dispatch strategy can affect the size of a typical system for a rural
clinic. It is therefore hoped that the results from the study will give an insight and link
between the variables involved in the design and operation of the PV/Diesel/Battery
hybrid power supply system.
The aim of this work is to develop a procedure for sizing the hybrid system components
in order to come up with a system that can satisfy the load completely (100%) even when
there are poor weather conditions. This will be achieved by identifying the load
requirements and using a load matrix to find an hourly load demand. The next step would
5
be to design a model that can simulate the operation of the PV hybrid system. This will
be followed by use of the model to size the components and identifying a cost effective
energy dispatch strategy. The last step will be to recommend the optimal blending of
PV/Diesel/Battery.
While several software tools are available on the market and in research groups, it is
sometimes difficult to assess the adequacy of these tools to specific tasks. Also, more
details are available from the system when performing optimization than at the planning
phase. According to Gabrovska et al (2004) use of such programs require high expertise
and financial resource hence the development of simplified computational methods that
are less costly.
1.2 Conclusion
In this chapter the researcher looked at the background information, aims and objectives
as well as justification of the research. The next chapter is going to focus on review of
related literature.
6
CHAPTER 2
Literature Review
2.1 Introduction
This section makes a review of literature pertaining to remote power supply systems
which include renewable stand alones, diesel generator set stand alone and the hybrid
system which is the combination the two. The advantages and disadvantages of the power
supply options as well as their configurations and dispatch strategies will be considered.
2.2 Power Supply Options for Remote Areas
2.2.1 Wind Stand Alone Systems
Wind energy is one the renewable power supply options for remote areas. Its advantages
include low environmental impact and occupy relatively small area of land in proportion
to their electrical output. The output from wind generators increases significantly as the
wind speed increases, and wind speed increases as height above the ground increases. In
evaluating any available wind data the effect of the local topography/geography needs to
be considered as it may cause uneven wind patterns that will affect the turbine's output
(Ackermann, 2005). A wind turbine installed in an area with a good wind resource can
produce energy cost-effectively.
This energy option however has limited use because modern energy converter systems
are expensive to set up and if located near homes or workplaces noise of the rotor can be
annoying. Another problem is that wind does not blow all the time and in some cases the
speeds may not be enough for electricity generation. They are not suitable for mobile
needs and maintenance costs are high. If wind- driven generators are linked to diesel
generators the efficiency of the diesel plant can be reduced (Wichert, 1997).
7
2.2.2 Stand-Alone Photovoltaic Systems
Photovoltaic power systems are generally classified according to their functional and
operational requirements, their component configurations, and how the equipment is
connected to other power sources and electrical loads. The two principal classifications
are grid-connected or utility-interactive systems and stand-alone systems.
Wichert (1997) argues purports that stand-alone PV systems are designed to operate
independent of the electric utility grid, and are generally designed and sized to supply
certain DC and/or AC electrical loads. These types of systems may be powered by a PV
array only, or may use wind, an engine-generator or utility power as an auxiliary power
source in what is called a PV-hybrid system. The simplest type of stand-alone PV system
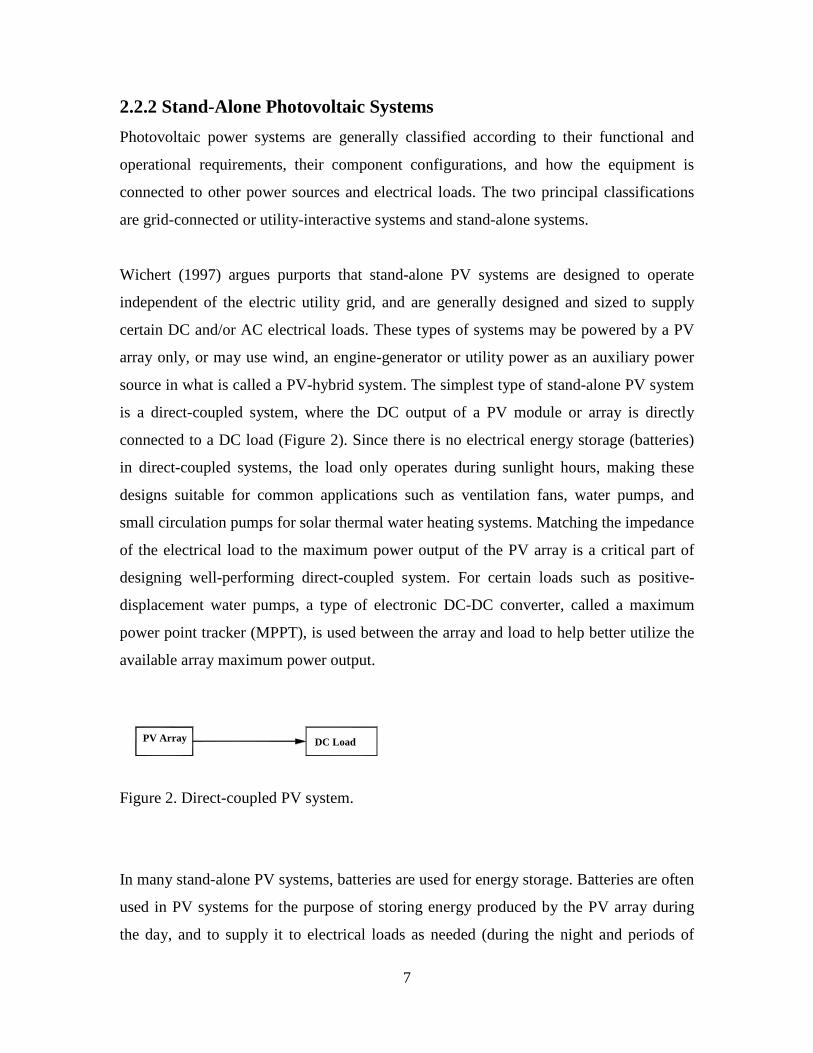
is a direct-coupled system, where the DC output of a PV module or array is directly
connected to a DC load (Figure 2). Since there is no electrical energy storage (batteries)
in direct-coupled systems, the load only operates during sunlight hours, making these
designs suitable for common applications such as ventilation fans, water pumps, and
small circulation pumps for solar thermal water heating systems. Matching the impedance
of the electrical load to the maximum power output of the PV array is a critical part of
designing well-performing direct-coupled system. For certain loads such as positive-
displacement water pumps, a type of electronic DC-DC converter, called a maximum
power point tracker (MPPT), is used between the array and load to help better utilize the
available array maximum power output.
PV Array DC Load
Figure 2. Direct-coupled PV system.
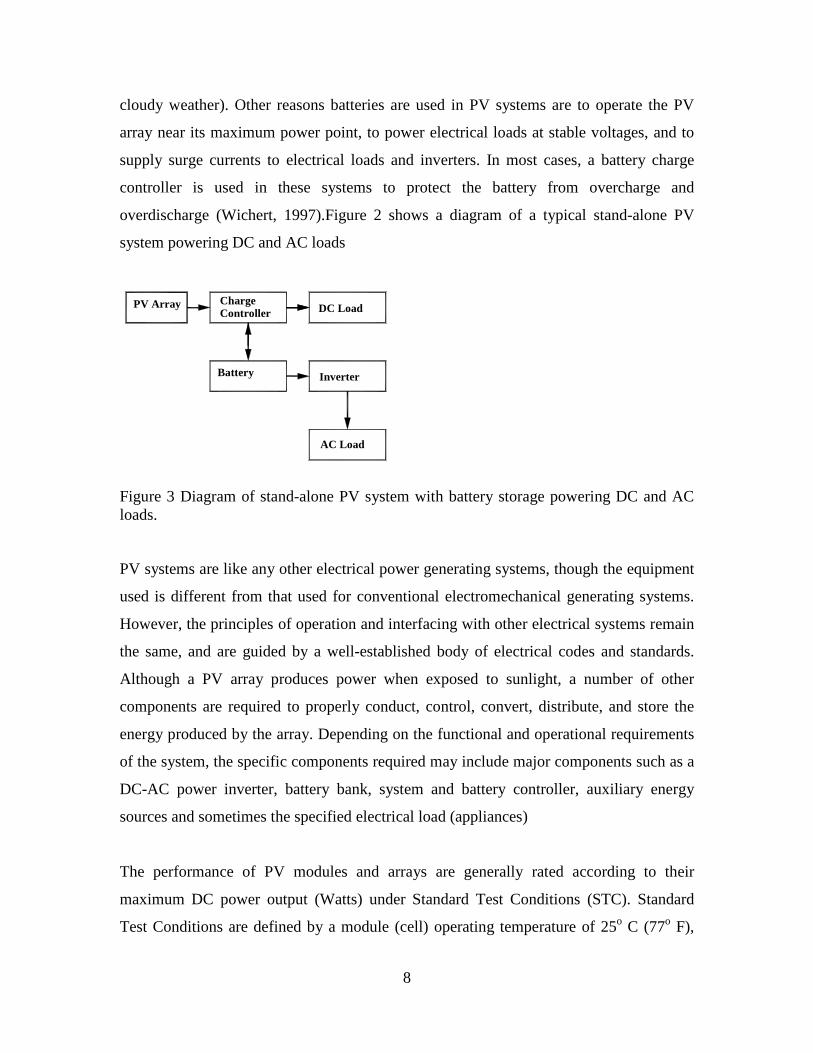
In many stand-alone PV systems, batteries are used for energy storage. Batteries are often
used in PV systems for the purpose of storing energy produced by the PV array during
the day, and to supply it to electrical loads as needed (during the night and periods of
8
cloudy weather). Other reasons batteries are used in PV systems are to operate the PV
array near its maximum power point, to power electrical loads at stable voltages, and to
supply surge currents to electrical loads and inverters. In most cases, a battery charge
controller is used in these systems to protect the battery from overcharge and
overdischarge (Wichert, 1997).Figure 2 shows a diagram of a typical stand-alone PV
system powering DC and AC loads
PV Array ChargeController DC Load
Battery Inverter
AC Load
Figure 3 Diagram of stand-alone PV system with battery storage powering DC and AC loads.
PV systems are like any other electrical power generating systems, though the equipment
used is different from that used for conventional electromechanical generating systems.
However, the principles of operation and interfacing with other electrical systems remain
the same, and are guided by a well-established body of electrical codes and standards.
Although a PV array produces power when exposed to sunlight, a number of other
components are required to properly conduct, control, convert, distribute, and store the
energy produced by the array. Depending on the functional and operational requirements
of the system, the specific components required may include major components such as a
DC-AC power inverter, battery bank, system and battery controller, auxiliary energy
sources and sometimes the specified electrical load (appliances)
The performance of PV modules and arrays are generally rated according to their
maximum DC power output (Watts) under Standard Test Conditions (STC). Standard
Test Conditions are defined by a module (cell) operating temperature of 25o C (77o F),
9
and incident solar irradiance level of 1000 W/m2 and under Air Mass 1.5 spectral
distribution. Since these conditions are not always typical of how PV modules and arrays
operate in the field, actual performance is usually 85 to 90 percent of the STC rating.
Photovoltaic modules are extremely safe and reliable products, with minimal failure rates
and projected service lifetimes of 20 to 30 years. Most major manufacturers offer
warranties of 20 or more years for maintaining a high percentage of initial rated power
output. When selecting PV modules, one should look for the product listing, qualification
testing and warranty information in the module manufacturer’s specifications (Wichert,
1997).
2.2.2.1 Merits and demerits of PV Systems
Photovoltaic systems have a number of unique advantages over conventional power-
generating technologies. PV systems can be designed for a variety of applications and
operational requirements, and can be used for either centralized or distributed power
generation. PV systems have no moving parts, are modular, easily expandable and even
transportable in some cases. Energy independence and environmental compatibility are
two attractive features of PV systems. The fuel (sunlight) is free, and no noise or
pollution is created from operating PV systems. In general, PV systems that are well
designed and properly installed require minimal maintenance and have long service
lifetimes (Gabrovska et al, 2004).
2.2.3 Diesel Power System
Stand-alone diesel generator sets are relatively inexpensive to purchase but expensive to
operate and maintain. Specific fuel consumption characteristics of a typical diesel engine
show that a diesel generator must be operated above a certain minimum load level in
order to maintain efficiency and to reduce the possibility of premature failures. This is
shown in figure 4 which shows a typical curve for specific fuel consumption versus load
ratio.
10
Figure 4 A typical curve for specific fuel consumption versus load ratio.
The typical specific fuel consumption versus load ratio curve generally shows that
specific fuel consumption increases as the load ratio increases. The relationship between
the two is such that low load ratios result in high fuel consumption.
The problem of selecting a diesel generator size for a newly emerging community, or one
which has not had continuous power previously, is difficult while population fluctuations,
seasonal demand, increase in number and use of electrical appliances are complex issues
for designers to assess. A generator should never be operated at its maximum power
output for more than 30 minutes. Rated power, or the power that a generator can produce
for long periods of time, is a more reliable measure of generator power (Beyer et al,
2003).
The conventional approach for a stand-alone diesel is to select the diesel generator set
according to the peak load. During periods of low loads, the diesel generators will be
poorly loaded with the consequences of poor fuel efficiency, wet stacking, low
combustion and carbon deposits (glazing) on the cylinder walls, causing premature
engine wear. Common practice is to install “dump loads” which deliberately dissipate
energy when useful demand is low, to protect the diesel engines.
00.10.20.30.40.50.60.70.80.9
1
0 0.1 0.2 0.3 0.4 0.5 0.6 0.7 0.8 0.9 1
Load ratio
Spe
cific
Fue
l Con
sum
ptio
n [k
Wh/
litre
]
11
The same authors argue that several approaches have been considered to maximise the
economy of operating diesel generators. One system employs a number of diesel
generators that need to operate parallel to achieve peak load supply, but can be shut down
systematically as load reduces. This system will require automatic sequencing and
synchronisation controls A two-diesel system-one small set and the other larger with
manual change over switch- is used to meet the load requirements .The small set is
operated during low-demand periods while the larger set is reserved for the high-demand
periods. This scheme is a relatively low-cost one, but offers little protection to the larger
generator with low demand and is not very convenient.
Although diesel generators have a low initial capital cost and there is support available on
how to operate and maintain them, experience has shown that there are significant
limitations associated with this method of generation. Getting a maintenance crew on
time in such isolated area is a problem. Transportation of fuel is another problem. Diesel
gensets have problems with short durability, which is due to the fact that they work very
inefficiently when running just at fractions of their rated capacity. Frequent start-up and
shut-down procedures also decrease their lifetime (Haupt and Haupt, 1998).
These diesel generators are very expensive to run and maintain and every litre of diesel
releases about 3 kg of CO2 gases (Lenzen, 1999). The diesel generator remain in the
system to equalize the battery and to act as a backup generator for extended periods of
low renewable energy input or high load demand. Such systems are usually installed in
locations where fuel supplies are expensive and unreliable, or where strong incentives for
the use of renewable energy exist (Drouilet, 1997).
2.2.4 Hybrid Power Systems
Hybrid systems are one means of providing electrical power in remote areas that are not
connected to a power grid. A hybrid remote power system integrates two or more power
12
sources. Such systems eliminate problems associated with both PV and diesel stand alone
systems.
Battery Inverter
AC Load
ChargeController
PV Array DC Load
Alternator
Engine
Figure 5 Diagram of photovoltaic hybrid system.
Such systems are inherently reliable due to multiple power sources and generally use
diesel generating set-capable of providing full rated power on demand as the second
energy source (Behrendorff, 1999). They are independent of a large, centralized
electricity grid and incorporate more than one type of power source. Isolated AC systems
include at least the following: conventional AC diesel generators, an electrical
distribution system, and distributed AC loads. A hybrid system could also include
additional power sources such as renewables (wind turbines, photovoltaic panels) and
storage.
There may be more than one diesel generator supplying power to the network. These are
normally connected to an AC bus in the power house where the diesels are located. This
bus provides power to the distribution network. When there is more than one diesel
generator, a control system must be employed to properly allocate the power from the
diesels. These control systems may take a variety of forms especially as computerized
control systems become more widespread and one of the approaches is to use one lead
diesel to set the grid frequency and to set the others to run at fixed throttle (Kaikhurst,
1998)
.
13
2.3 Hybrid Power System Configurations
According to Wichert (1997), hybrid energy systems with or without renewables, are
classified according to their configuration as series, switched hybrid, or parallel hybrid.
2.3.1 Series hybrid system
In this system either the renewable energy source or the diesel generator is used to
maintain charge in a large battery bank. During periods of low electricity demand the
diesel generator is switched off and the load can be supplied from PV together with
stored energy. Power from the battery bank is converted to AC at mains voltage and
frequency by a converter and is then fed to the load. Battery charging can be controlled
by controlling the excitation of the alternator (Wichert, 1997). The charge controller
prevents overcharging of the battery bank from PV generator when the PV power
exceeds the load demand and the batteries are fully charged. The system can be operated
in manual or automatic mode, with the addition of appropriate battery voltage sensing
and start/stop control of the engine-driven generator.
DIESELENGINE
ALTERNATOR BATTERYCHARGER
BATTTERYBANK INVERTER LOAD
RENEWABLEENERGY SOURCE
Figure 6 Series hybrid system
Advantages of this configuration include that the engine-driven generator can be sized to
be optimally loaded while supplying the load and charging the battery bank, until the
state of charge (SOC) of 70-80% is reached. No switching of AC power between the
different energy sources is required thus simplifying the electrical output interface. Also
the power supplied to the load is not interrupted when the diesel generator is started and
the inverter can generate a sine-wave, modified square-waves, or square-wave, depending
on the application.
14
Although the design principles of the series hybrid systems are relatively simple to
implement. Islam (1999) highlights its disadvantages to include: low overall efficiency
due to the series configuration of system elements; substantially larger battery capacity
than the maximum peak load demand resulting in the system being more expensive
component to the system; and with renewable inputs, there is limited control of diesel
alternator because the system is based on level of charge in the battery rather than the site
load.
A series hybrid system is characterized by low overall system efficiency since the diesel cannot
supply power directly to the load; large inverter and due to the cycling profile large battery bank
is required to limit the depth of discharge; and limited optimisation of diesel alternator and
renewable energy sources(SOPAC Miscellaneous Report 406, 2005). The battery bank is
cycled frequently, shortening its lifetime. If the inverter fails there is complete loss of power to
the load, unless the load can be supplied directly from the diesel generator for emergency
purposes.
2.3.2 Switched hybrid system
This system allows with either the engine-driven generator or the inverter as the AC
source but no parallel operation of the main generation source is possible (Islam, 1999).
Both the diesel generator and the PV array can charge the battery bank. The diesel
alternator meets the load during the day and evening peak while the battery bank is
charged by the renewables and any excess power from the diesel. Power is supplied to
the load by the battery through the inverter during the low load night period. The typical
layout of the system is as shown in figure 7.
15
DIESELENGINE
ALTERNATOR
ALTERNATOR LOAD
RENEWABLEENERGY SOURCE
BATTTERYBANK
BATTERYCHARGER
Figure 7 Switched configuration
The main advantages of the system are quiet operation at night and partial improvements
in diesel consumption. A switched hybrid system is also characterized by the fact that the diesel
generator can supply the load directly, therefore improving the system efficiency and reducing the
fuel consumption (SOPAC Miscellaneous Report 406, 2005). As for the series system, the
diesel generator is switched off during periods of low electricity demand and the inverter can
generate a sine-wave, modified square-wave, or square-wave, depending on the
application. Switched hybrid energy systems can be in manual mode, although the
increased complexity of the system makes it highly desirable to include an automatic
controller, which can be implemented with the addition of appropriate battery voltage
sensing start/stop control of the engine-driven.
The diesel system and inverter are typically designed to meet the peak loads, which
reduces their efficiency at part load operation and there is no optimisation control on the
diesel as the source switching solution is based on a simple time clock. Power to the load
is interrupted momentarily when the AC power sources are transferred
2.3.3 Parallel hybrid System (Source/ Charger-
16
Parallel Inverter/ Storage)
The parallel configuration shown in figure – allows all energy sources to supply the load
separately at low or medium demand, as well as supplying quick load from combined
sources by synchronizing the inverter with the alternator output wave form the bi-
directional inverter can charge the battery bank when access energy is available from the
engine driven generator, as well as act as DC-AC converter In this case the renewables
and the diesel generator supply part of the load demand directly. The diesel generator and
the inverter run in parallel.
LOAD
DIESELENGINE
ALTERNATOR
RENEWABLEENERGY SOURCE
INVERTER
SYNCHRONISEDCONTROL
BATTTERY
Figure 8 Parallel configuration
Advantages of this configuration over other system configurations are that the system
load can be met in the most optimal way, diesel efficiency can be maximized, diesel
generator maintenance can be minimized and there is a reduction in the capacities of
diesel, battery and renewable sources while load peaks are being met. However,
automatic control is essential for the reliable operation of the system and the system
operation is less transparent to the untrained user of the system. Also the inverter has to
be a true sign wave inverter with the ability to synchronize with a secondary AC source.
17
2.4 System Benefits
According to Wichert (1997), a key feature of hybrid systems is the fact that their
constituent system strengths complement one another. This provides a number of
advantages, which are also determined in part by the system type: significantly greater
reliability in power supply due to the use of two or more energy sources; more efficient
system solutions by virtue of a high degree of flexibility during the design phase and in
operation; lower overall maintenance costs due to the shorter operating cycles of the
motor generator units; and longer service life time of components as a result of reduced
use. Karnavas and Papadopoulos (1999) also highlight the following advantages of solar
hybrid systems : reduced operational cost due to less fuel consumption and low PV
maintenance; improved reliability through diversifying power sources and continuous
power supply; increased operational life due to less genset operating hours; improved
energy services and environmentally friendly due to reduced emissions and noise
pollution
The fuel savings in hybrid system without storage are affected by two main effects. As
the diesel has to be operated in a mode that follows the effective load (load – PV
production), it may be forced to operate under part load conditions quite often. This
causes an increase of the fuel consumption per kWh produced. Second there is the need
to dump PV-power, when the possible PV-production is above the actual load. In view of
the lifetime of the diesel gen-set and the system stability it is not recommended to operate
the diesel below a certain effective load (e.g. 15% of nominal). This causes another share
of PV-energy that needs to be dumped . A hybrid system that relies on photovoltaics for
the generation of most of the power during periods when there is sunshine, and use
generator power when sunshine is not available offsets capital costs of photovoltaics and
operating costs of the diesel generator (Lopez and Agustín, 2004).
Table 1 Summary of merit and demerits of different power supply systems Power Supply System Advantages Disadvantages
Diesel /battery • Low initial capital cost • Noisy
18
• Generate power on demand
• Short durability
• Very expensive to run and
maintain
• Environmental pollution
PV Stand -alone • Safe, clean and quiet to operate;
• Highly reliable;
• Require virtually no maintenance;
• Operate cost-effectively in remote areas and for
many applications;
• Flexible and can be expanded at any time to
meet demand
• Increased autonomy – independence from the
grid or backup during outages.
• Not well suited for highly
energy-intensive uses such as
heating
PV/Diesel/Battery Hybrid • Reduced operational cost due to less fuel
consumption and low PV maintenance
• Improved reliability through diversifying
power sources and continuous power supply
• Increased operational life due to less genset
operating hours
• Improved energy services
• Environmentally friendly due to reduced
emissions and noise pollution
• Smooths out seasonal weather fluctuations
• Reduced ‘deep-cycling’ of batteries
• Extended battery life
• Avoid noisy generator
• Additional investment cost of
renewable energy sources,
batteries and power
electronics.
• Limited experience of
customers and supply utilities
with renewable energy and
hybrid power system
technology.
• Systems are generally more
complex.
• Life-cycle economic analysis
required – based on detailed
system simulation.
2.5 Battery Storage
The battery storage (bank) is used to store electricity. It enables the continuity of power
to the load in the event of power failure or for solar sites in the event of cloudy weather
and at night. Both nickel cadmium and sealed – lead acid batteries are usually used for
remote area power supply systems. The cyclic energy efficiency of a battery (usually
80% for a new lead-acid battery operated in the optimum region) is also paramount, since
energy lost requires a larger input source to replace it. Other important factors that
determine life-cycle costs (apart from capital cost) are: the number of cycles delivered (at
19
a certain depth of discharge – DOD), lifetime (usually 3 to 7 years in well-designed
systems), and how often it must be maintained (Al-Alawi and Islam, 2004).
2.5.1 Storage in hybrid power systems
In order to maximize renewable resource available and/or to minimize use of backup
generator, batteries are incorporated in hybrid systems (Lopez and Agustín, 2004). The
same author agues that batteries in such systems experience irregular patterns of charge
discharge cycles and that estimation of battery life and optimal sizing of batteries is
difficult since battery life depends on both depth and rate of discharge as well as on other
factors to include temperature and charging strategy.
Important factors in battery life are battery aging which refers to processes that tend to
limit the physical integrity of the battery and its ability perform the intended task; and
battery wear which refers to processes that tend to limit the amount of electric energy that
can be stored or supplied (Behrendorff, 1999). The author further highlights that while
aging is mostly accelerated by adverse environmental conditions or improper
maintenance, which can be controlled, battery wear is a function of battery’s charge-
discharge history. The designer or operator has control over some factors that contribute
to useful battery life in a given application like cell temperature, charging regime, battery
maintenance procedures, dwell time at low and high states of charge and amount and
frequency of overcharge but cannot control the depth rate of discharge.
The capacity of the battery is specified by manufacturers in Ah under a certain discharge rate and
cell temperature. If energy stored in a battery is C25=100 Ah then it can provide a current of 4
Amps for 25 hours. Energy in Kilowatt Hours (kWh) = Ah x V / 1000, in which V is the battery
voltage (Karnavas and Papadopoulos, 1999). Charging rates are specified by battery
manufacturers and depend on the battery capacity and state of charge. The depth of discharge
refers to the measure of how much of the total battery capacity has been consumed and is usually
given in percent while State of Charge refers to a measure of how much of the initial battery
capacity is available and is expressed in terms of % of rated capacity.
20
The maximum recommended depth of discharge is usually around 70% depending on the battery
manufacturer’s specifications. Batteries in hybrid power systems are deep cycle batteries that can
discharge more of their stored energy while still maintaining long life. Karnavas and
Papadopoulos, (1999) also highlight that the operating voltage (12 V / 24 V / 48V) of the
battery cell is not constant due to factors such as the internal resistance of the cells and the
temperature. The argument is that rate of chemical reaction is reduced when the battery
temperature is low, during cold periods and battery capacities are usually given at a reference
temperature of 25°C necessitating correction at higher or lower temperatures. Battery bank
capacity is usually sized to provide 3-7 days autonomy to a depth of discharge of around 80%.
2.6 Solar Resource Characterization
Photovoltaic systems depend on the availability of the solar resource which is
characterized by measured insolation data and parameters related to the site. The site
related parameters include geographic information (site latitude and longitude) and
temperature information (the nominal ambient temperature or a time series of ambient
temperature).
Ambient temperature is used in estimating the solar photovoltaic cell panel temperature.
When such data is not available, a representative site mean ambient temperature is used.
The value selected should be a daytime temperature, corresponding to the times of
highest productivity from the panels. The site latitude is used in solar angle calculations.
These calculations are done since solar data is usually taken on a horizontal surface
whereas photovoltaic panels are normally installed on a slope. The slope surface
generally face south in the northern hemisphere and north in the southern hemisphere.
Sometimes panels are installed on adjustable tracking devices. Solar angle calculations
are also needed in those cases. The site longitude is used in solar angle calculations to
ensure that the data is converted to solar time. If the solar time is not properly accounted
for, errors in the results will appear. Solar resource calculations require knowledge of the
day during which the data was taken. Specification of the Julian day of the first data point
21
allows the data to begin on any day of the year. Solar insolation data is assumed to be
taken on the horizontal. Data is in Watts per square meter.
2.6.1 Average Hourly Incident Radiation on An Array
Radiation is normally given as daily data, that is as daily global radiation on a horizontal
plane, Hh . To solve the global radiation into its beam and diffuse component
correlations of the ration Hd/Hh with clearness index, o
n
H
HK =
Many correlations have been identified in the literature for different elements and
location by different authors e.g. Duffie & Bechaman (1991).
According to Hove and Gottscle (1999), for Zimbabwe and the region.
h
d
H
H = 1, 0294 – 1, 14K for K ≤ 0,75 (1)
= 0,175 for K > 0,75
To resolve the daily value into hourly value factors rd and rh of Liu and Jordan (1996) and
Collares Pereira and Rabl (1979) are used.
The factor , H
rΙ= (2)
Where Ι is the hourly radiation and it is the daily radiation.
andH
rD
dd
Ι=
H
hh H
rΙ
=
Since r is a function of hour angle ω and day length ω s for diffuse radiation.
sss
sdr ω
πωωωωπ
cossin
coscos
24 −−
−= (3)
rh = (a +b cos ω) rd
where a and b are correlation coefficients given by
22
a = 0,409 + 0, 5016 sin (ω s – 60) (4)
b = 0,6609 – 0,4767 sin (ω s-60) (5)
By adopting the Collares – Pereira and Rabl Sky Model and making some assumptions
the instantaneous radiation incident on the array, Larray can be estimated by
Iarray = (Ih-Id)Cosθ array/cosθ z+Id/c (6)
Where Ih is the global, θ array is the angle of incidence of direct irradiance on the array, C
is the concentration ratio which is equal to unity for flat-plate array and Id is the diffuse
irradiance.
Geometric factor Rb
This represents the ratio of beam radiation on the tilted surface to that on a horizontal
surface at any given time (Duffie & Bechaman, 1991). This factor is important in the
solar process design and performance calculations, as it is vital to calculate the hourly
radiation on a tilted surface of a collector from estimates of solar radiation on a horizontal
surface. The ratio, after some simplifications, is given by
zbR
θθ
cos
cos= (7)
where θ z is found in standard texts and is a function of the declination angle δ
Declination Angle, δ
This refers to the angular position of the sun at solar noon and is found by
+= )284(365
360sin45,23 nδ (8)
For the purpose of calculation in the model the monthly average day is used as adopted
from Klein (1977).
23
The angle of incidence as given in various texts [e.g (Duffie & Bechaman, 1991)] is as
follows:
wywy
wy
sinsinsincoscos
cossinsincoscoscoscoscoscossincossincossinsincos
βδβθδβφδβφδβδθ
+++−Φ=
(9)
This is the angle between the beam radiation on a surface and the normal to that surface
(Hove and Gottsche, 1999).
Hour Angle (ω) according to Hove and Gottsche (1999) is the angular displacement of
the sun east or west of the local meridian due to rotation of the earth on its axis at 150 per
hour, morning negative and afternoon positive.
The slope (β ) refers to the angle between the plane at the surface in the practice when
installing solar arrays is to place them at an angle β = latitude of location.
2.7 Energy dispatch strategy
Dispatch strategy is the criteria the controller uses to decide when the genset of a hybrid
system is turned on, at what loading rate it operates, and when it is turned off (Beyer et
al, 2003). In small hybrid systems dispatch strategies are simple, the genset is usually
turned on automatically when a low voltage set point is reached and runs until the battery
reaches a voltage set point, the battery is fully charged or a preset minimum run time of
several hours has elapsed. Many controllers also start the genset when the net load
exceed a certain level; sometimes it is left to the user to start the generator manually
when this condition exists.
In most hybrid systems the genset runs at full load and any power not required by the
load contributes to battery charging. Partial loading of the genset occurs when the battery
is approaching full charge and cannot accept the full current of the genset. In some
24
systems, however, the genset turns on only if the load is reasonably large and then runs
on the loading which supplies just enough power to keep the battery from discharging.
(i.e. it supplies power equivalent to the load power minus and power available from other
generators.)
In certain hybrid systems, the battery is used only to buffer transients in demand and
therefore there is no real dispatch strategy. The genset runs at all times supplying the
average of the difference between the load and the power available from renewable
sources. In systems with multiple gensets where the number of genset on line is
determined by the loading level associated with the average as oppose to the maximum,
when there is brief demand for more power, a small battery makes up the shortfall.
Dispatch strategies are sometimes implemented with operating set points that have been
selected by rules of thump (Beyer et al, 2003).While these set points may work they
generally will not achieve least-cost operation of the system. Methods exist that can help
select optimum strategies and set points but it is important to note that most hybrid
system controllers currently available are sufficiently sophisticated that they can
implement optimal dispatch strategies, the challenge is the selection of the strategy not its
implementation.
An optimal dispatch is the one that minimize the life-cycle cost of the hybrid system and
dispatch strategies affect costs associated with genset fuel use, genset maintenance and
battery life but the influence is difficult to quantify for the last two (Beyer et al, 2003). It
should also be noted that the overall system performance depends on the dispatch
strategy.
2.8 System sizing
Major issues that arise when designing a system include that the load placed on the
system is not constant, that the amount of energy available from the renewable energy
source is variable and that technology that best suits site should be implemented (Hove,
25
2000). Therefore the design has to be iterative using simulation models that can evaluate
instantaneous system performance.
Several software tools are available on the market and in research groups to optimize and
simulate hybrid energy systems, but it is sometimes difficult to assess the adequacy of
these tools to specific tasks. Also, more details are available from the system when
performing optimization than at the planning phase. According to
http://www.ecs.umass.edu/mie/labs/rerl/hy2/theory/pdf/users.pdf, use of such programs
require high expertise and financial resource hence the development of simplified
computational methods that are less costly. Also the user does not get an intuitive
understanding of the system since figures are just fed into the system, hence the
development of simpler home-made models. In the development of these homemade
models the user is able to include specific things that one needs to use. A system can be
designed with a smaller or larger solar array or battery, or may make more use of the
diesel generator. The problem is to find a system that provides an optimal combination of
solar array, battery and usage of the diesel engine.
2.8.1 Estimation of Electrical Load
The electrical loads can be estimated if the power used by each appliance is known. The
total energy required will depend on this power draw and the operating time of the
appliance. Overall electrical loads can be determined by drawing up a list of all items,
their power use and their average operating time per day. The total will be used in
determining the size and type of system required.
2.8.2 Load Profiles
The load profile has been defined by Karnavas and Papadopoulos (1999) as the power
requirements for the demand-side converters (appliance loads) over time. Once energy
conservation (demand side management) techniques are used to reduce the electrical load as far
as economically possible whilst still providing the required service, the load profile should be
determined to decide the type of hybrid system needed to provide power. The load profile may
vary by the hour, day, week, month, season, or year. The peak demand spikes can be met from the
26
batteries and the engine generator started and operated at a steady load when the battery state-of-
charge drops below a pre-set level.
The most convenient method of determining the load profile of a system is by measuring
electricity demand using an energy (kilowatt / kilowatt-hour) meter, and logging the output
hourly, or more often, for at least a week, preferably a month or year (seasonal variations). This
can be done either manually if someone can read the meter at regular intervals, or a data logger
can be used, in which case much more detailed information is available. This will reveal the daily
and weekly profiles. If seasonal variations in load are suspected, longer-term (yearly) load
monitoring will be required to reveal the seasonal profile (Karnavas and Papadopoulos , 1999)
2.8.3 Photovoltaic Modules: Technician’s method
According to Klein (1977) to determine the actual required PV array output, divide the daily
energy requirement by the battery efficiency which is usually between 0.70 and 0.95 and depends
on the coulombic efficiency of the batteries in both charging and discharging. Generally 0.95 is
used for very efficient batteries installed in good conditions and 0.7 for the least efficient
batteries.
The author highlights that to work out the output from the array, it is important to know under
what conditions the output will be determined, and need to know what the inclination of the array
will be. This is measured in peak sun hours, which is dependent on latitude, season and
inclination of the array. The scenario generally chosen for solar / generator hybrid systems is the
yearly average peak sun hours. If tables of peak sun hours are not available they can be
determined from the average of daily total global radiation. To convert daily global radiation
(MJ/m2) to peak sun hours divide by 3.6. The output of the modules will be average annual peak
sun hours times the module rating.
To determine the number of modules in the array first work out the number of modules in series
so that the operating voltage is sufficient for battery charging. Divide the system voltage by the
nominal operating voltage of each module. To determine the number of modules in parallel the
array output required (Ah) is divided by the output of each module (Ah). However this method
does not apply in this research as it does not take into account many things and in a hybrid system
energy flows need to be known from hour to hour.
2.8.4 Sizing The Charge Controller/ Battery Charger
27
Generators in renewable systems are used to power the battery charger, particularly
during poor weather, or to supply heavy loads. They can be automatically or manually
controlled. In most systems, either diesel, petrol or gas driven generators are used (Hove,
2000).
A battery charger converts the AC output to DC for the purpose of battery charging. The battery
charger should be selected such that it converts the 240 volt, 50 Hz AC to DC at the required bus
voltage of the battery storage bank. It should be able to provide a direct current up to the
maximum allowable charge rate of the batteries. The two critical factors to consider when
selecting a battery charger are the system voltage and the maximum rate of charge of the
batteries. There may not be a battery charger with exactly the maximum current specified so a
charger with lower current would be chosen. The most likely available charger would be 24 Volt
60 Amps. The size of the battery charger is determined by the size of the battery bank
(Hove, 2000).
A charge controller should be sized to pass the expected continuous current from the
array (or sub-array) into the battery, and should be able to withstand temporary peak
currents due to sunnier than normal conditions. It is critical that the controller be
adequately sized since the costs associated with the controller are much greater than the
cost of initially installing a slightly larger controller. A module will normally have a
maximum current output which is its rated short circuit current (when battery voltage is
low). It is possible for irradiance levels to reach 3000 watts/m²; the short circuit current
is normally rated for irradiance levels of 1000 watts/ m². Charge controllers should be
sized therefore, to regulate 130% of a module’s normal short circuit current. The size of
a controller can be calculated by multiplying the Isc current of a module by the number of
modules in parallel and the 1.3 safety factor. Consult with the manufacturers to
determine if they have already build a safety factor into their rating value; oversizing by
130% may not be necessary if the controller is already designed to handle higher than
rated currents (Beyer, 2003).
2.8.5 Inverter Power
28
The inverter converts DC power from the battery bank and/or PV array to AC whenever
power from diesel generator sets is not available. It changes DC energy stored within the
batteries to AC energy, suitable for the standard appliance operating voltage of 240V. An
inverter can generally only supply loads up to its kilowatt rating, although all inverters
have a surge rating for electrical peaks. This allows for motor starting, or other brief
In addition the battery energy due exclusively to the PV generator, Bgain-PV, is
calculated using equations similar to (4) and (5) with appropriately set conditions.
3.6.3 Solar Fraction
The hourly solar fraction- the fraction of the hourly load contributed by solar energy- is
calculated as follows:
The hourly energy contributed to the load by solar energy, Ls, is the sum of the PV hourly
output and the battery discharge attributable to solar energy, Bgain-PV. It is limited by
the diesel generator supply deficit, Lo-QD.
Ls = min{QPV + Bgain-PV(-ve); Lo-QD) if Lo > QPV + QD
= QPV - Bgain-PV(+ve) otherwise (16)
The daily solar contribution to the load is the sum of the hourly contributions, and the
daily solar fraction is the ratio of the daily solar contribution to the daily load. The
monthly solar fraction is equal to the daily solar fraction for the average day, and the
annual solar fraction is the weighted average (according to number of days in each
month) of the monthly solar fractions.
39
3.6.4 Battery Life Estimation Model
The model is also able to estimate the lifespan of the battery based on manufacturer’s
data on battery life cycles for varying depth of discharge and variation of battery capacity
with time to discharge (discharge current).
In the battery model used, the ratio of the effective discharge (deff) of the battery, for any
discharge event, to the actual observed discharge (dactual) depends on:
1) the ratio of the average depth of discharge of the battery during the discharge
event (DA), to the manufacturer’s rated discharge (DR), DA/DR.
2) the ratio of the rate of discharge during the discharge event to the manufacturer’s
rated discharge rate, IA/IR.
The relationship is:
deff / dactual = f1(DA/DR) x f2(IA/IR) (17)
where the functions f1 and f2 are obtained from curve fitting equations of the
relations between manufacturer’s battery life-cycle versus depth of discharge, and
that on amp-hour capacity versus time to discharge.
The battery life, in units of the discharge event duration (1 hour in the present case), is
the rated charge life (amp-hours) divided by the effective discharge in each discharge
event.
3.6.5 Diesel Generator Dispatch Strategy and Load Ratio
The criteria employed for turning on/off the diesel generator set (the dispatch strategy)
was made a variable in the model. It affects the hourly energy flow pattern in the power
supply system; the variation of battery state of charge; the amount of usable PV energy at
40
any given time; the hourly load ratio of the diesel generator; etc. In this study two diesel
generator dispatch strategies were considered:
1) the diesel generator is turned on at night OR when the incident solar irradiance is
low (below a certain threshold, say IPV < 0.08 kWh/m2)
i.e. QD = rated diesel power if abs(ω) > ωs OR IPV < 0.08 kWh/m2
= 0 otherwise,
where QD is the hourly diesel energy output, ω is the hour angle and ωs is the sunset
hour angle.
2) the diesel generator energy dispatch is load-following; it is turned on when the
load exceeds a certain prescribed value (e.g. Lo > 0.8 Lbar) AND it is greater than
the PV power output (Lo > QPV)
i.e. QD = rated diesel power if Lo > 0.8 Lbar AND Lo > QPV
= 0 otherwise,
where Lbar is the average hourly load.
3.6.5.1 Load Ratio
The model relates load ratio with specific fuel consumption therefore it can calculate the fuel consumption for any load ratio. 3.6.5 Input Data Required by the Model
Electricity is be generated either by photovoltaic array or by diesel generators or both. A
battery bank is used to store excess electricity from the PV array and the diesel
generators. In order to determine the size of the PV array and other variables there was
then need to design a model that could simulate various operations. The major constraint
is that solar radiation is not constant, thus the model is designed to be able to simulate
variations in solar radiation. Simulation can be done for every day of the year requiring
41
too much data so monthly averages of hourly radiation are used in this approach. For
diffuse and global radiation either use data derived from model for calculation of daily
average values from various texts or we use readily available statistical data from the
meteorological center. Radiation on a tilted surface is calculated for each hour of the day
for the average day of the month .
Various conditions were created in order to come up with an operational model. The
average meteorological data are assumed to occur on Klein’s average day (Klein, 1977).
Solar radiation data shown in table, global and diffuse radiation shown in table as well
as the ambient temperature shown in table for Bulawayo were obtained from
meteorological department as statistical data.
42
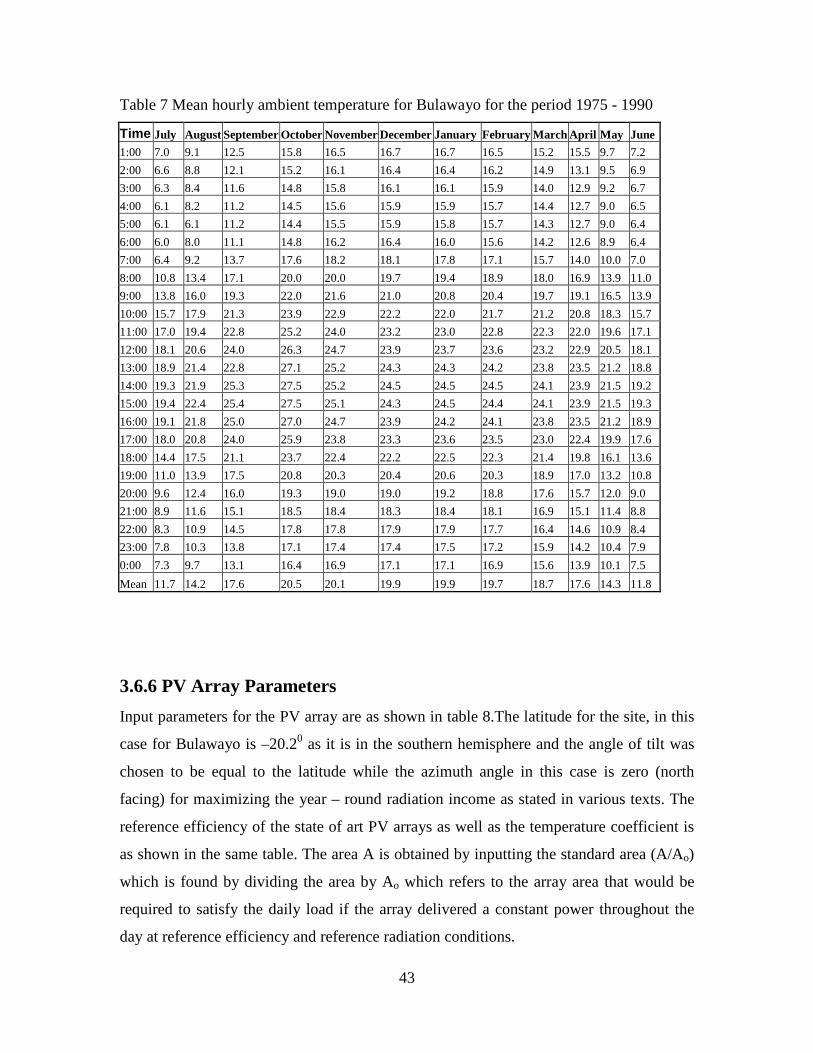
Table 6 Monthly Average Hourly Solar Radiation Over Bulawayo For The Year 1999
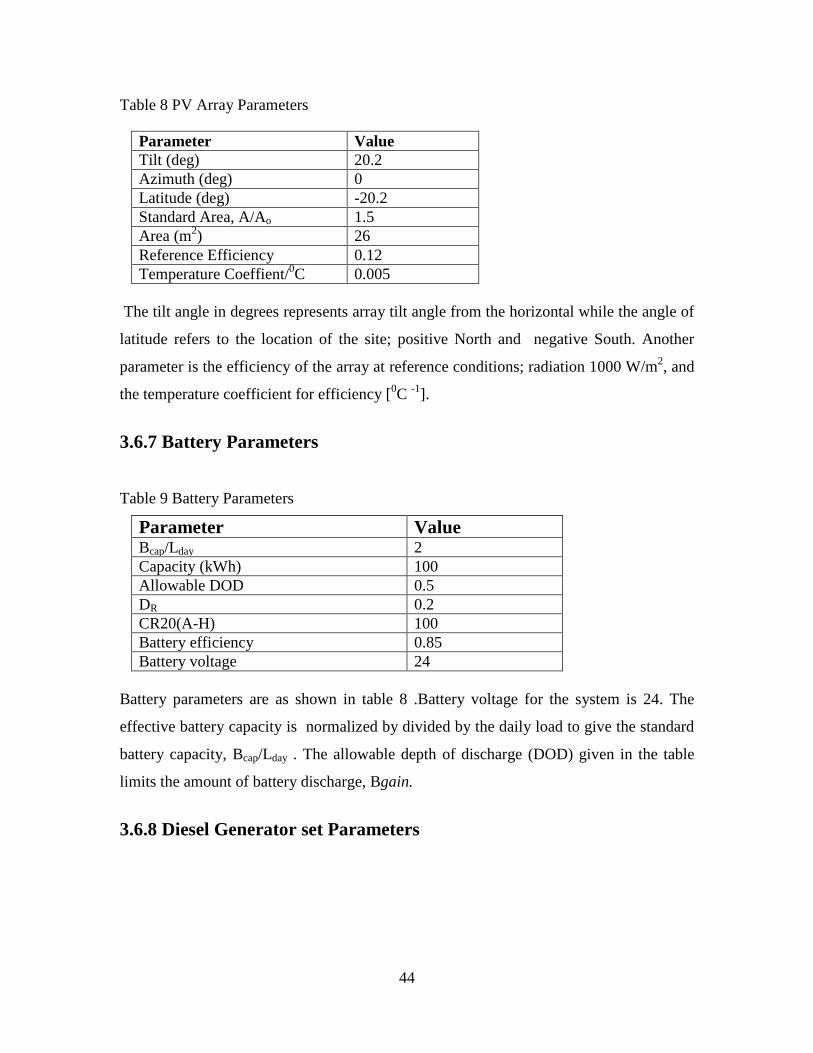
Input parameters for the PV array are as shown in table 8.The latitude for the site, in this
case for Bulawayo is –20.20 as it is in the southern hemisphere and the angle of tilt was
chosen to be equal to the latitude while the azimuth angle in this case is zero (north
facing) for maximizing the year – round radiation income as stated in various texts. The
reference efficiency of the state of art PV arrays as well as the temperature coefficient is
as shown in the same table. The area A is obtained by inputting the standard area (A/Ao)
which is found by dividing the area by Ao which refers to the array area that would be
required to satisfy the daily load if the array delivered a constant power throughout the
day at reference efficiency and reference radiation conditions.
44
Table 8 PV Array Parameters
Parameter Value Tilt (deg) 20.2 Azimuth (deg) 0 Latitude (deg) -20.2 Standard Area, A/Ao 1.5 Area (m2) 26 Reference Efficiency 0.12 Temperature Coeffient/0C 0.005
The tilt angle in degrees represents array tilt angle from the horizontal while the angle of
latitude refers to the location of the site; positive North and negative South. Another
parameter is the efficiency of the array at reference conditions; radiation 1000 W/m2, and
the temperature coefficient for efficiency [0C -1].
3.6.7 Battery Parameters
Table 9 Battery Parameters
Parameter Value Bcap/Lday 2 Capacity (kWh) 100 Allowable DOD 0.5 DR 0.2 CR20(A-H) 100 Battery efficiency 0.85 Battery voltage 24
Battery parameters are as shown in table 8 .Battery voltage for the system is 24. The
effective battery capacity is normalized by divided by the daily load to give the standard
battery capacity, Bcap/Lday . The allowable depth of discharge (DOD) given in the table
limits the amount of battery discharge, Bgain.
3.6.8 Diesel Generator set Parameters
45
Table 10 Diesel Generator set Parameters
Parameter Value Rated Power (kVA) 5 Power factor /efficiency 0.55 Specific fuel Consumption (kWh/l)
2
Low radiation cut-in (kWh/m2) 0.08 Table 10 shows the diesel generator set parameters as they are used in the model. The
power factor is inputted to come up with the rated power of the generator while 80W is
the radiation level at which the generator starts to operate in the load following strategy.
The efficiency of the power conditioning equipment, specifically the PV controller is
taken as 90%.
46
CHAPTER 4
Results and Analysis
4.1 Introduction
This section looks at the outputs from the model and their analysis. Comparisons of the
outputs from the two energy dispatch strategies are made in order to determine the most
suitable strategy for the location and the given load profile.
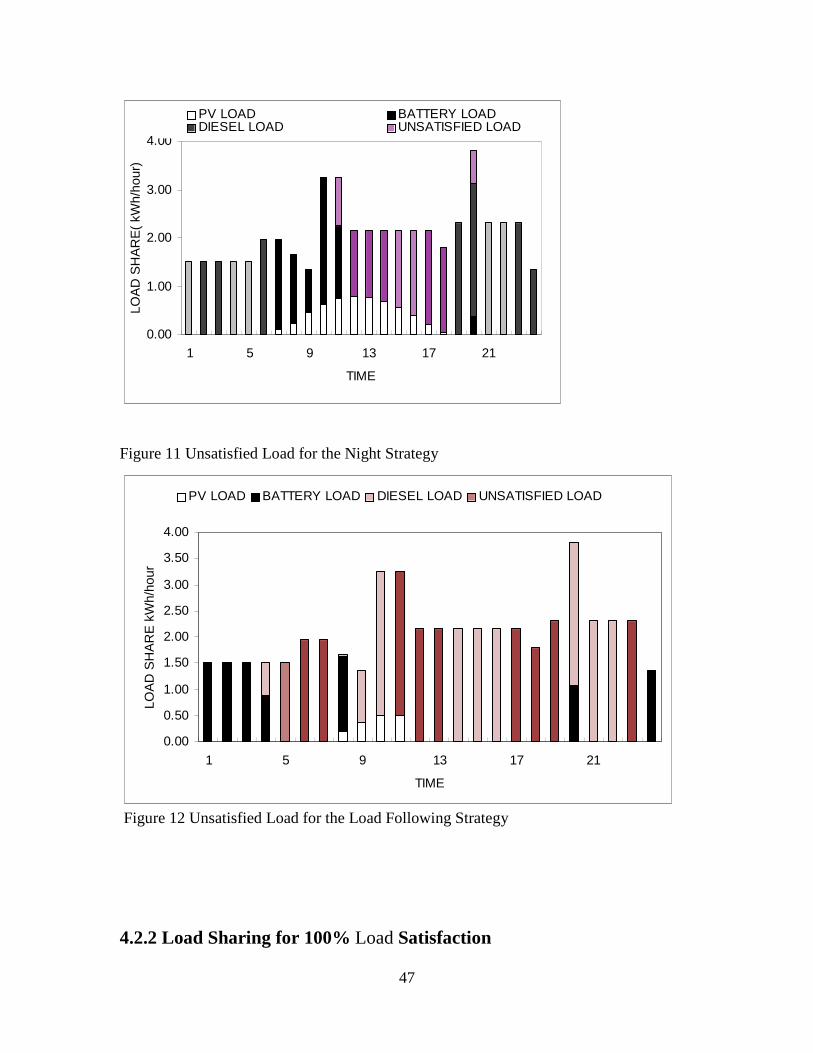
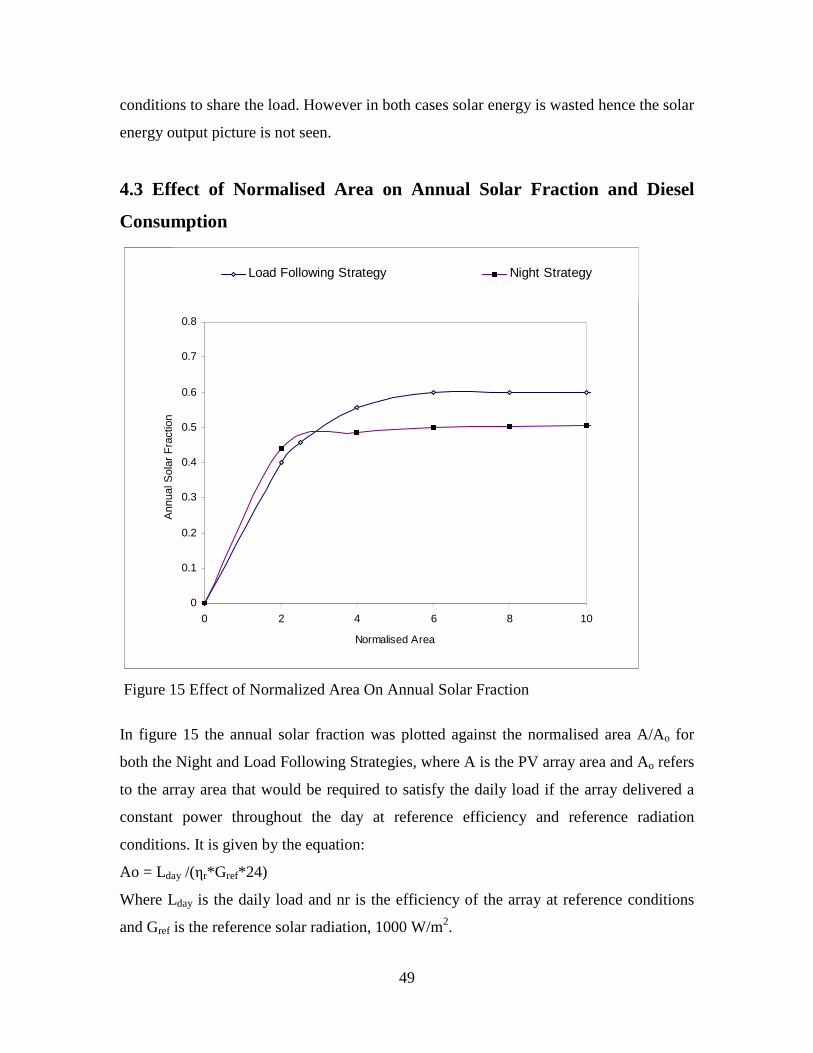
4.2 Load Sharing
The following Figures 11 – 14 generally show how the load is shared in the PV-Diesel-
Battery Hybrid System. The load share is plotted against time for cases where the load is
partially met and where the load is satisfied completely for both the Night and the Load-
Following Strategies. In figure 11 where the load is not satisfied 100% on the Night
Strategy, a typical day output shape is depicted which shows the fractions of the load met
directly by the PV array, the battery and the diesel generator. For this case, where the
area of the PV array is small there is little or no wastage of PV array energy, as evidenced
by the neat shape of the PV energy supply curve during the day when diesel genset is off.
The situation is different with the Load Following Strategy in which the diesel generator
comes into operation at any time to complement the insufficient energy. There is
therefore more PV energy wastage as the diesel generator interferes with energy supply
once the load is above 80% of the load and the PV energy is less than the load. This is
shown in figure 12.
4.2.1 Load Sharing for unsatisfied load
47
Figure 11 Unsatisfied Load for the Night Strategy
Figure 12 Unsatisfied Load for the Load Following Strategy
4.2.2 Load Sharing for 100% Load Satisfaction
0.00
0.50
1.00
1.50
2.00
2.50
3.00
3.50
4.00
1 5 9 13 17 21
TIME
LOA
D S
HA
RE
kW
h/ho
ur
PV LOAD BATTERY LOAD DIESEL LOAD UNSATISFIED LOAD
0.00
1.00
2.00
3.00
4.00
1 5 9 13 17 21
TIME
LOA
D S
HA
RE
( kW
h/ho
ur)
PV LOAD BATTERY LOADDIESEL LOAD UNSATISFIED LOAD
48
Figure 13 Load Sharing for the for the Night Strategy
Figure 14 Load Sharing for Load following Strategy
As the PV array is increased adequately, the load can be completely satisfied by the
power supply. For the Night Strategy the load sharing picture is shown in figure 13
where the battery comes in to share the load with the PV array. Figure 14 shows that for
the Load Following Strategy the diesel comes in any time depending on the loading
0.00
1.00
2.00
3.00
4.00
1 5 9 13 17 21
TIME
LOA
D S
HA
RE
( kW
h/ho
ur)
PV LOAD BATTERY LOADDIESEL LOAD UNSATISFIED LOAD
0.00
0.50
1.00
1.50
2.00
2.50
3.00
3.50
4.00
1 5 9 13 17 21
TIME
LOA
D S
HA
RE
( kW
h/ho
ur)
PV LOAD BATTERY LOAD DIESEL LOAD UNSATISFIED LOAD
49
conditions to share the load. However in both cases solar energy is wasted hence the solar
energy output picture is not seen.
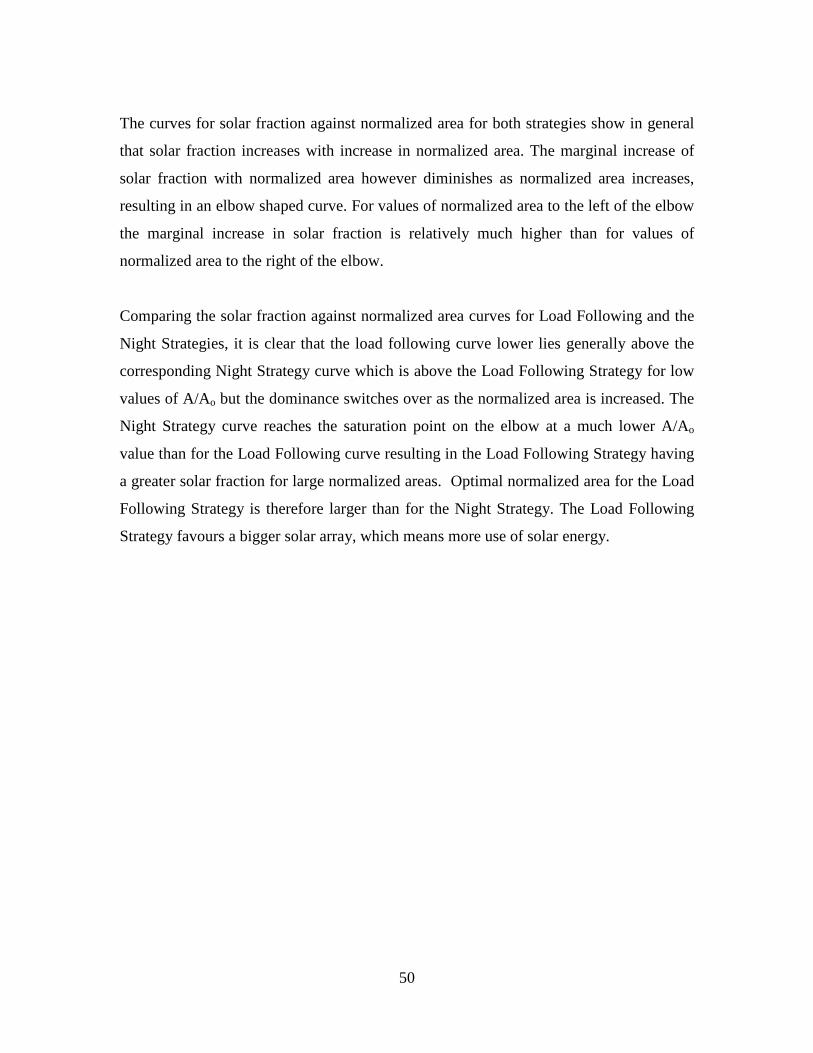
4.3 Effect of Normalised Area on Annual Solar Fraction and Diesel
Consumption
Figure 15 Effect of Normalized Area On Annual Solar Fraction
In figure 15 the annual solar fraction was plotted against the normalised area A/Ao for
both the Night and Load Following Strategies, where A is the PV array area and Ao refers
to the array area that would be required to satisfy the daily load if the array delivered a
constant power throughout the day at reference efficiency and reference radiation
conditions. It is given by the equation:
Ao = Lday /(ηr*Gref*24)
Where Lday is the daily load and nr is the efficiency of the array at reference conditions
and Gref is the reference solar radiation, 1000 W/m2.
0
0.1
0.2
0.3
0.4
0.5
0.6
0.7
0.8
0 2 4 6 8 10
Normalised Area
Ann
ual S
olar
Fra
ctio
n
Load Following Strategy Night Strategy
50
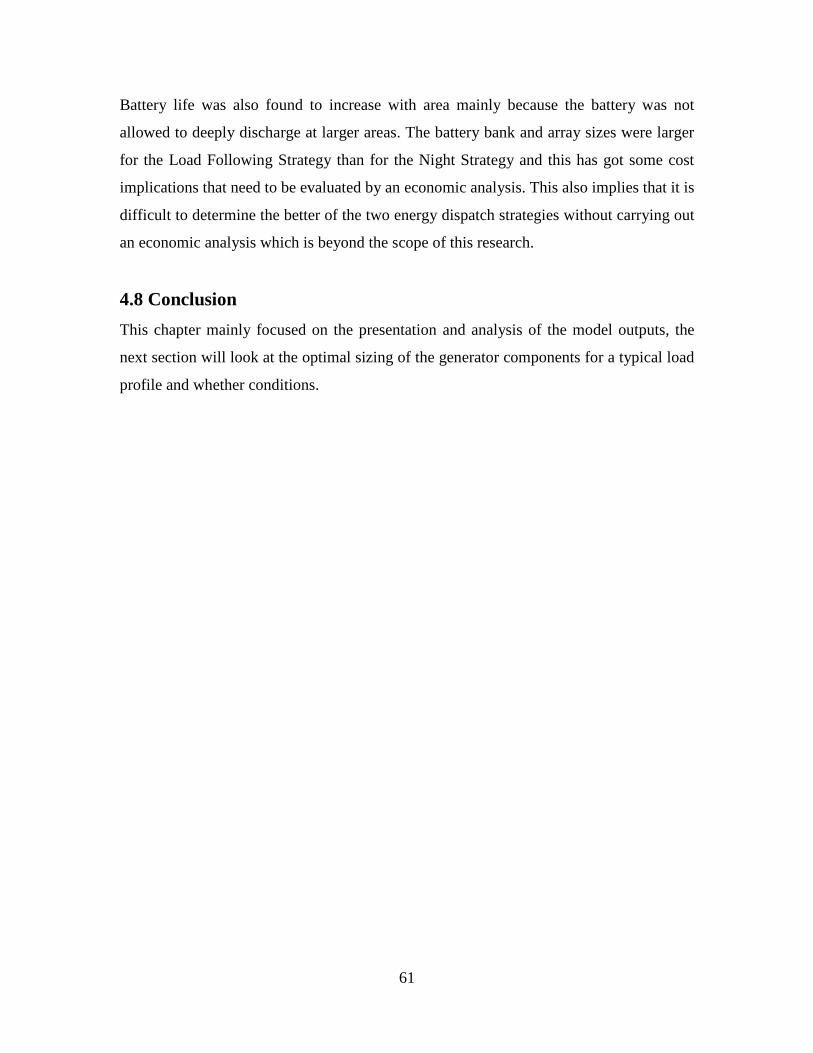
The curves for solar fraction against normalized area for both strategies show in general
that solar fraction increases with increase in normalized area. The marginal increase of
solar fraction with normalized area however diminishes as normalized area increases,
resulting in an elbow shaped curve. For values of normalized area to the left of the elbow
the marginal increase in solar fraction is relatively much higher than for values of
normalized area to the right of the elbow.
Comparing the solar fraction against normalized area curves for Load Following and the
Night Strategies, it is clear that the load following curve lower lies generally above the
corresponding Night Strategy curve which is above the Load Following Strategy for low
values of A/Ao but the dominance switches over as the normalized area is increased. The
Night Strategy curve reaches the saturation point on the elbow at a much lower A/Ao
value than for the Load Following curve resulting in the Load Following Strategy having
a greater solar fraction for large normalized areas. Optimal normalized area for the Load
Following Strategy is therefore larger than for the Night Strategy. The Load Following
Strategy favours a bigger solar array, which means more use of solar energy.
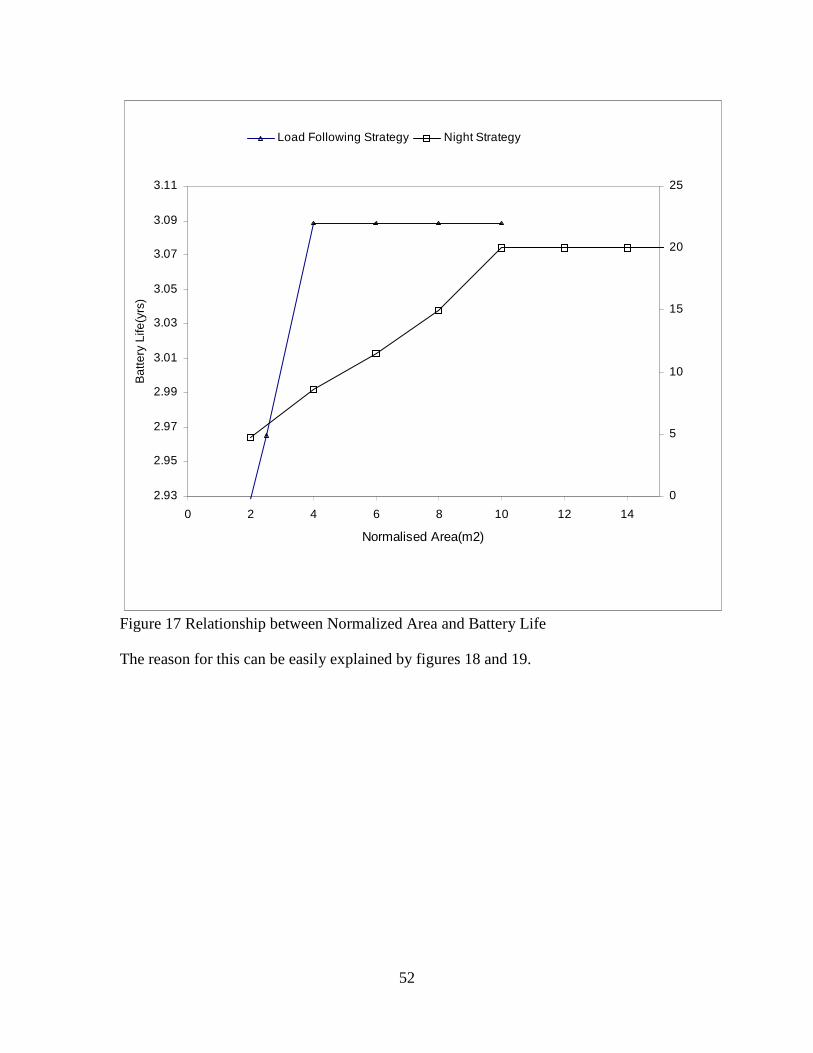
51
Figure 16 Diesel consumption against Normalized Area
Figure 16, shows the diesel consumption against normalized area curves for both
strategies and these depict that diesel consumption decreases as the PV area increases and
this should be expected as a larger area implies a larger solar fraction and reduction of the
fraction of the load, which is taken by the diesel.
4.4 Relationship Between Normalised Area and Battery Life
From the graphs shown in figure 17 it is clearly seen that battery life generally increases
with area. However, for the same areas the battery life is much less for the Load
Following Strategy compared to the Night Strategy.
2000
3000
4000
5000
6000
7000
8000
9000
10000
0 2 4 6 8 10
Normalized Area (m2)
Die
sel C
onsu
mpt
ion
(Litr
es/y
r)
Load Following Strategy Night Strategy
52
2.93
2.95
2.97
2.99
3.01
3.03
3.05
3.07
3.09
3.11
0 2 4 6 8 10 12 14
Normalised Area(m2)
Bat
tery
Life
(yrs
)
0
5
10
15
20
25
Load Following Strategy Night Strategy
Figure 17 Relationship between Normalized Area and Battery Life
The reason for this can be easily explained by figures 18 and 19.
Figure 18 Actual Depth of Discharge of the battery over the Rated Depth of Discharge
Figure 18 shows for atypical day, the variation of the ratio DA /DR ( actual depth of
discharge of the battery over the rated depth of discharge) with time. It is clear that for
the Load-Following strategy the depth of discharge is generally higher than that for the
night strategy (battery is more severely discharged).
54
Figure 19 Actual Rate of Discharge over Rated Rate of discharge against Time
The curves shown in figure 19 shows that although actual rate of discharge is less than
the rated discharge rate for both strategies, for larger areas it is higher for most of the
time for the Load Following Strategy implying that the battery is discharged more than
for the Night one. The explanation given above generally reflect that battery life depends
mostly on the depth of discharge and the rate of discharge.
4.5 Relationship between Battery Capacity and Battery Life
0.000
0.100
0.200
0.300
0.400
0.500
0.600
0.700
0.800
0.900
1.000
0:00 3:00 6:00 9:00 12:00 15:00 18:00 21:00 0:00
Time
Act
aul R
ate
of D
isch
arge
ove
r R
ated
dis
char
ge
rate
(IA
/IR)
Night Strategy Load Following Strategy
55
Figure 20 Relationship Between Battery Capacity and Battery Life for the Night Strategy
The graphs shown in figure 20 indicate an increase in battery capacity results in an
increase in battery life for any given area. An increase in battery capacity also means an
increase in the initial cost but since the life also increases, it means there is less
replacement and cost. The overall cost depends on economic parameters such as
discounting rate and life cycle costs. The area is decided on by the elbow while an
increase in battery life is expected because the battery is charged frequently by a bigger
area so that the depth of discharge is always low. For a chosen area the increase is due to
fact that as the battery capacity increases the depth of discharge decreases. Also the ratio
the ratio of the rate of discharge during the discharge event) to the manufacturer’s rated
discharge rate, (IA/IR), is less for a large battery than for a smaller battery.
0
2
4
6
8
10
12
14
16
18
0.5 0.6 0.7 0.8 0.9 1 1.1 1.2 1.3 1.4
Battery Capacity/Daily Load
Bat
tery
Life
(Yrs
)
45 3
2
Normalised Area
56
2.5
3.5
4.5
5.5
6.5
7.5
8.5
9.5
10.5
11.5
0.5 1 1.5 2Battery Capacity/Daily Load
Bat
tery
Life
(Yrs
)32
4;5
Normalized Area
Figure 21 Relationship Between Battery Capacity and Battery Life for the Load Following Strategy
For the Load Following Strategy, the graphs shown in figure 21 also depict that battery
life increases as the capacity is increased but in this case this is less dependent on area.
This increase is again expected because the ratios of IA/IR are less for larger areas than
for smaller areas.
4.6 Effect of Solar Fraction on Diesel Consumption
57
Figure 22 Effect of Solar Fraction on Diesel Consumption
The graphs shown depict that diesel consumption decreases as solar fraction increases but
consumption is higher on the Night than on the Load Following Strategy implying that
generally the Load Following Strategy is more fuel-economical to employ than the Night
Strategy. This can be explained by the graphs shown in figure 22, which show the load
ratio against time for each hour of the day with other things being the same.
4000
5000
6000
7000
8000
9000
10000
0 0.2 0.4 0.6
Solar Fraction
Die
sel C
onsu
mpt
ion(
L/yr
)
Night Strategy Load Following Strategy
58
Figure 23 Variation of Load Ratio with Time
In figure 23, it is shown that the load ratios are generally high for most of the times for
the Load Following Strategy implying less fuel consumption while for the Night Strategy
it is less than one which implies that the specific fuel consumption is less hence more
diesel is consumed because of the low load ratios. This is expected as it follows the
behavior of the typical specific fuel consumption versus load ratio.
4.6 Variation of Nominal and Effective diesel running hours with Normalized Area
Effective diesel running hours refers to the number of hours when the diesel generator set
is run at part load and then the model penalizes the system by increasing the running
hours. This is achieved using the equation:
Neff = Nfull*4^(1-LR)
0.00
0.10
0.20
0.30
0.40
0.50
0.60
0.70
0.80
0.90
1.00
0:00 3:00 6:00 9:00 12:00 15:00 18:00 21:00 0:00
Time
Load
Rat
ioNight Strategy Load Following Strategy
59
where Neff refers to the effective running hours, Nfull refers to the number of hours the
generator set is run at full load and LR is load ratio
Figure 24 Variation of Nominal and Effective diesel running hours with Normalized Area
Figure 24 shows that for the load following strategy nominal diesel running hours are not
constant, they vary because the diesel engine is switched on depending on the switching
conditions. The effective diesel running hours are in general more than the nominal
running hours and they decrease as the solar array increases; this strategy uses more fuel
for lower solar array areas. For the night strategy, the nominal running hours are constant
which is expected. The effective running hours depend on the load ratio and they vary
for the night strategy as the normalized area increases. The load ratio is lower implying
more fuel consumption.
8
9
10
11
12
13
14
15
16
17
18
0 1 2 3 4
Normalised Area, A/Ao
Die
sel R
unni
ng H
ours
NR-load ER-load NR-night ER-load
60
4.7 Discussion on Findings
The outputs of the model showed that the optimal PV area for the Night Strategy smaller
area than the Load Following strategy but it also consumes more fuel. This was shown
by curves for solar fraction and diesel consumption versus normalized area. It was found
that the solar fraction increased with normalized area with a decreasing marginal increase
such that the solar fraction versus normalized area curve showed a distinct elbow, which
formed a basis for sizing of the PV array. This implies that it is not beneficial in terms of
solar fraction to continue increasing the size for the PV array beyond the value of area
represented by the elbow value.
The Load Following Strategy was found to be more efficient than the Night Strategy at
higher solar fractions and areas with relatively less fuel consumption. The Diesel
Consumption against normalized area curves for both strategies showed that diesel
consumption decreases as the PV area increases and this should be expected as a larger
area implies a larger solar fraction and reduction of the fraction of the load, which is
taken by the diesel.
Another observation was that the effective diesel running hours are more for the Night
than for the Load Following Strategy and this has an effect on the maintenance costs of
the diesel generator. Since the diesel engine was found to consume more fuel and run for
more hours, it follows that the Night Strategy incurs more maintenance costs than the
Load Following Strategy and is not environmental friendly in terms of emissions into the
atmosphere.
Another observation was that for the battery model used, battery life increased with
increase in battery capacity and this was due to reduced depth of discharge of the battery.
This should be expected since the ratio of the rate of discharge during the discharge
event) to the manufacturer’s rated discharge rate, IA/IR, is less for a large battery than for
a smaller battery.
61
Battery life was also found to increase with area mainly because the battery was not
allowed to deeply discharge at larger areas. The battery bank and array sizes were larger
for the Load Following Strategy than for the Night Strategy and this has got some cost
implications that need to be evaluated by an economic analysis. This also implies that it is
difficult to determine the better of the two energy dispatch strategies without carrying out
an economic analysis which is beyond the scope of this research.
4.8 Conclusion
This chapter mainly focused on the presentation and analysis of the model outputs, the
next section will look at the optimal sizing of the generator components for a typical load
profile and whether conditions.
62
CHAPTER 5
OPTIMAL SIZING OF THE PV/DIESEL/BATTERY HYBRID SYSTEM
5.1 Introduction
In this section some of the results from the simulation model are used in the final design
of the PV/Diesel/Battery hybrid system. The optimal sizes of the PV array, battery,
battery charger and inverter are thus going to be determined.
5.2 Sizing the PV array
Figure16, which shows solar fraction and diesel consumption against normalized area
was used as the design chart for sizing the PV array. As explained earlier on, for values
of normalized area to the left of the elbow the marginal increase in solar fraction is
relatively much higher than for values to the right of the elbow. It is therefore not
beneficial in terms of increasing the solar fraction to continue increasing the PV array
size beyond the “elbow value”. After the elbow, to the right the marginal increase is very
small therefore it is no longer beneficial to increase the solar fraction and this is
analogous with the law of diminishing returns in economics. In other words the value at
the elbow can be taken as the optimal normalized area.
63
Figure 25 Design Chart for PV array size
Using the curves for solar fraction against normalized area and considering that the most
cost effective points are found around the elbow of the graph , the most appropriate point
chosen is where there is a solar fraction of 55% and normalized area of 4 on the Load
Following Strategy as it is the one that gives the most solar fraction and a
correspondingly lower diesel consumption. On the Night Strategy the chosen point is
where there is a solar fraction of 44% and standard area of 2.
From an engineering intuition the optimum size of the PV array occurs at the elbow of
the solar fraction versus normalized area curve which provides the basis for sizing the PV
array in this study. Comparing the two energy dispatch strategies used in this study, the
elbow of the solar fraction versus normalized area curve for the Night Strategy occurs at
0
0.1
0.2
0.3
0.4
0.5
0.6
0.7
0.8
0 2 4 6 8 10
Normalised Area
Ann
ual S
olar
Fra
ctio
n
Load Following Strategy Night Strategy
64
lower values of normalized area than for the Load Following Strategy indicating that
more solar fraction and larger areas can be utilized by employing the Load Following
Strategy. Graphs for diesel consumption also indicate that the Load Following Strategy
may be more economical since diesel consumption is shown to decrease more as the area
increases. Therefore through economic analysis, which is not within the scope of this
research, a decision can be reached on the better strategy to adopt for the site.
5.2.1 PV modules and Electrical Configuration
From obtained values of A/Ao, since area and power are interchangeable the following
formula is used to find the corresponding power:-
where A =(A/Ao)Ao
P = no*Go*A
For the load Following Strategy
A = (69.4/4)*4 = 69.4 m2
P =0.12*1000*69.4
= 8328W
From Kyocera Batteries a Kyocera KC200GT PV panel was chosen with the following
specification:-
Maximum power 200W
Maximum current 7.61A
Maximum voltage 26.3V
The number of modules is found by diving the total power output by the power output of
the chosen PV module.
Number of modules at 200Wp = 8328/200
= 42
Number of modules in series is found by dividing the system voltage by the module
voltage at maximum power.
Number of modules in series = 24/26.3
= 1
Number of modules in parallel is found by diving the total number of modules by the
number of modules in series.
65
Number of modules in parallel = 42/1 = 42
For the Night Strategy
A = (34.7/2)*2 = 34.7 m2
P = 0.12*1000*34.7
= 4164W
Number of modules at 200Wp = 4164/200 = 21
Number of modules in series = 24/26.3
= 1
Number of modules in parallel =21/1
= 21
5.3 Sizing the battery
Generally as battery size increases the initial capital cost increases but the life also
increases therefore the battery is replaced less frequently. For a smaller battery size the
initial capital costs are lower but the battery is replaced more frequently therefore the size
can be best determined through economic analysis which is beyond the scope of this
research.
The graphs shown in figure 8a can be used to give a rough estimate of the size by
choosing the desired battery life. Considering that in practice solar batteries last been 3
and 7 years depending on their use, battery life was limited to six years in this research.
66
3
4
5
6
7
8
9
0.4 0.5 0.6 0.7 0.8 0.9 1
Battery Capacity/Daily Load
Bat
tery
Life
(Yrs
)
Normalised Area
2Minimum Battery Size
Figure 26 Design Chart for Battery Capacity
This limit disqualifies areas greater than 2 in figure 26 giving a normalized battery
capacity of 0.65 which gives a battery capacity of 32.5kWh. For the Load Following
Strategy graphs shown in figure 27 give a normalized battery capacity of 1.09 which
gives a battery capacity of 54.5kWh for any array size. From the analyses of figures 26
and 27, it therefore follows that without knowing economic parameters like discounting
for the system, the size is determined by the minimum battery size which is 25kWh in
this case or by fixing the battery life to a number of years, say 6 years before
replacement.
67
5.4 Specifications for the battery bank
To size the battery bank using the determined battery capacities for the two strategies if
the capacity of each battery at a 20 hour charging rate is 625Ah, the following steps are
followed:
1. Convert the kWh to Ah capacity by dividing by the system voltage
2. Divide the total battery capacity by the Ah rating for the batteries. This rounded
off to the nearest whole number gives the number of batteries in parallel needed.
3. Divide the system voltage by the battery voltage to get the number of batteries in
series needed.
4. Multiply the number of batteries in parallel by the number of batteries in series to
get the total number of batteries required.
The above step were followed to size battery banks for the two strategies.
5.4.1 Night Strategy
For Battery capacity/daily load of 0.65, a battery capacity of 32.5kWh is obtained from the model.
1. 32500/24 = 1355Ah
2. 1355/625 = 3 batteries in parallel
3. 24/12 = 2 batteries in series
4. 3*2 = 6 batteries
5.4.2 Load Following Strategy
For Battery capacity/daily load of 1.09, a battery capacity of 54.5kWh is obtained from the model.
1. 54500/24 = 2271 Ah
2. 2271/625 = 4 batteries in parallel
3. 24/12 = 2 batteries in series
4. 4*2 = 8 batteries
Batteries were selected from solar battery company.
5.5 Sizing the inverter
68
The inverter is sized based on peak power and in this case the peak power is 3810 watts.
To find the power rating to match the inverter specifications the peak power is multiplied
by a factor of 1.2 to account for inverter loss. Therefore
Power Rating of inverter = 3810*1.2 = 4572 watts
An inverter with the following specifications was chosen:
Model ML5500-24, 24 Volt DC to 110 Volt AC inverter, 5500Watts continuous,
7000Watts peak
Inverters selected from Plamy Power Inverter Company.
5.6 Sizing the charge Controller
Critical factors when selecting a charge Controller are the system voltage and the
maximum rate of charge of the batteries. In this case the system voltage is 24. The
capacity at a 20-hour charging rate is 625Ah
For the charge controller the first step is to convert the total kWh to Ah capacity by
dividing by the system voltage then divide by the current rating of the battery to get the
charge controller current rating. In this case this gives for
1. The Night Strategy
32500/(24*20) = 68A Therefore a 100A charge controller was chosen
2. The Load Following Strategy
54500/(24*20) = 114A. Therefore a 200A charge controller was chosen from Kyocera
Company.
69
5.7 Sizing and Operating Parameters for the two dispatch strategies
Table 11: Parameters for the two dispatch strategies
Parameter Night
Strategy
Load Following Strategy
Sizing Parameters
PV Array size( A/Ao) 2 4
Battery size (Bcap/Lday) 0.65 1.09
Inverter (Wp) 4600 4600
Charge Controller (A) 100 200
Diesel Generator set (kVA) 5 5
Operation Parameters
Solar fraction 44% 55%
Diesel consumption (L/yr) 5346 4143
Battery life (yrs) 6 6
Effective Diesel Running Hours 14.7 10.3
Table shows the sizing and operation parameters of the two dispatch strategies used in
this research. It shows that the PV array size for the Night Strategy is half of that for the
Load Following Strategy while the battery capacity is 65% less. The inverters are of the
same size since the inverter is sized based on peak power which is the same for the given
load profile. The charge controller rating is 50% more for the Load Following Strategy.
The relative sizes of the components have implications on the capital costs of the two
energy dispatch strategies. The Load Following Strategy thus have more capital costs.
Considering the operation parameters it is clearly seen that the effective diesel running
hours and fuel consumption are higher for the Night Strategy than for the Load Following
Strategy.. Effective diesel running hours have an effect on the maintenance costs of the
70
diesel generator set such that more running hours mean more frequent maintenance. It
therefore follows that the Night Strategy requires more maintenance than the Load
Following Strategy. Diesel consumption has an implication on the operation costs of the
systems which implies that the Load Following Strategy may be desirable in developing
countries like Zimbabwe where capital is a problem. The Night Strategy thus consumes
more diesel and requires more maintenance meaning that it may be desirable if diesel is
cheap since most developing countries including Zimbabwe import fuel.
Capital costs are high for the load following strategy which may not be affordable but
they are more fuel savings. In the Zimbabwean context, since the capital items and fuel
are important, it is difficult to judge which of the two strategies is better from an
economic point of view only but other factors can be considered such that the load
following strategy requires complex electronic of controls which might be difficult to
operate in rural areas with untrained manpower while the night strategy can be operated
easily by untrained staff and is therefore more appropriate for rural areas.
From an environmental point of view the load following strategy is advantageous over
the night one. It has low fuel consumption and less running hours, which means less fuel
is burnt at higher efficiency resulting in less greenhouse gas emissions.
5.8 Conclusion
This section mainly looked at the sizing of the optimal components of the
PV/Diesel/Battery hybrid power supply system, the next section will focus on the
conclusions and recommendations.
71
CHAPTER 6
CONCLUSIONS AND RECOMMENDATIONS
6.1 Introduction
This section looks at the conclusions and recommendations that are made based on the
findings of the research.
6.2 Conclusions
The outputs of the model reflected that the designed model can make an hourly audit of
energy flows and after inputting things like solar radiation data, temperature data, average
day of the month, tilt angle, normalized area and capacity among other inputs, can output
things like solar fraction, diesel fraction, load satisfied, diesel running hours and battery
life among other outputs. The battery life versus battery capacity/daily load curve can be
used to choose the battery capacity by selecting a desired battery replacement time
(battery life), with a limit for the minimum battery capacity provided by the requirement
that it should be able to smoother hourly load fluctuations on a day with no solar
radiation.
Based on the findings, it can be concluded without economics that the best strategy is the
Load Following Strategy since it has lower diesel running hours and diesel consumption
when compared with the Night one. The lower running hours imply lower costs in terms
of diesel generator maintenance and fuel costs. Although this strategy favours relatively
larger areas and bigger battery capacities implying higher initial costs, the solar fraction
utilized is also higher and battery life is increased making it a better option in terms of the
payback period. However, because of the complexity of the controls involved, which may
need immediate attention by technical experts in the event of a malfunction, the Night
Strategy was considered as the more appropriate strategy in this research as it can be
operated manually by a non- technical operator. It can also be concluded that the
dispatch strategy is an important factor in deciding the size of system and the economics.
72
The decision on the better energy dispatch strategy will depend on various economic
parameters, for instance, on the fuel price relative to the capital cost of the battery, or the
PV array.
6.3 Recommendations
Basing on the above findings and conclusions, it can be therefore be recommended that: � To size components of hybrid systems, simulation models are required to
simulate all combinations and avoid design of sub-optimal systems
� An economic analysis is required for both exact determination of the generator
component size and the energy dispatch strategy.
� For a start a simple strategy that operate at night (Night diesel generator
strategy), is recommended for developing countries like Zimbabwe since it can
be operated manually and does not require complicated electronic controls.
� Further studies, should focus on the economics and more simple and efficient
energy dispatch strategies.
73
REFERENCES
Urmee, T., Harries, D. and Schlapfer, A. 2009 “Issues related to rural electrification
using renewable energy in developing countries of Asia and Pacific” Renewable Energy
Journal, Vol. 34, 2009, pp 354–357.2.
Ackermann, T. (ed). 2005 “Wind power in power systems” Jon Wiley & Sons, Ltd.
Nayar CV et. al 1993 Novel Wind/Diesel/Battery Hybrid Energy System Solar Energy
Vol 5 No 1 pp 65-78 1993. USA
Karnavas, Y.L., and Papadopoulos, D.P.: 1999 “Maintenance oriented Algorithm for
economic operation of an autonomous diesel electric station” Electric Power Systems
Research, Vol.5, 1999, pp109-122.
Kaikhurst, E. T. 1998 “Village Electrification an Evaluation of Options in remote Area
Systems” The World Directory of Renewable Energy Suppliers and services
Gabrovska, K., Wagner, A. and Mihailov, N. 2004 “Software System for Simulation of
Electric Power Processes in Photovoltaic-Hybrid System” International Conference on
Computer Systems and Technologies - CompSysTech’2004. 17-18 June 2004,
Rousse,Bulgaria
Haupt, R.L and Haupt S.E 1998 Practical Generic Algorithms. John Wiley and Sons, Inc,
New York
Beyer, H.G., Rüther, R. and. Oliveira, S.H.F.2003 “Adding PV-generators without
storage to medium size stand alone diesel generator sets to support rural electrification
in Brazil” ISES Solar World Congress, Göteborg, June 2003, pp16-19.
74
Patel M., Pryor T.L. 2001 “Monitored Performance Data from a Hybrid RAPS System
and the Determination of Control Set Points for Simulation Studies”, Proceedings of
ISES Conference, Adelaide, Nov 2001
Schienbein, L and Reich, E.: “Market, Cost, and Technical Analysis of Vertical and
Horizontal Axis Wind Turbines: Market Demand for Small Wind”. May 2003, Global
Nain H. Afgan, Maria G. Carvalho 2008 Sustainability assessment of a hybrid energy
system Energy Policy, Volume 36, Issue 8, August 2008, Pages 2903-2910
Wichert, B 1997 “PV-diesel hybrid energy systems for remote area power generation- A
review of current practice and future developments”, Renewable and Sustainable energy
Reviews, Vol. 1, No. 3, 1997, pp. 209-228.
Drouilet S.(1997) A battery life prediction method for hybrid power applications
Duffie JA, Bechaman WA Solar engineering of thermal processes. John Wiley and Sons,
1991.
Lenzen M. 1999 Greenhouse gas analysis of solar-thermal electricity generation. Solar
Energy 65(6):353-368, 1999
Lopez R.D. and Agustín J.L.B, 2004 Design and control strategies of PV–Diesel systems
using genetic algorithms, Solar Energy 79 (2004), pp. 33–46.
Al-Alawi A.and Islam S. M, 2004: Demand side management for remote area power
supply systems incorporating solar irradiance model Renewable Energy Volume 29,
Issue 13, October 2004, Pages 2027-2036
75
Islam, S.M., 1999. Improving Operational Cost in a Hybrid System by Optimal Sizing
and Control Design, A Short Course On: PV/Diesel/ Hybrid Systems, Australian
Cooperative Research Centre For Renewable Energy, Curtin University of technology,
Australia
SOPAC Miscellaneous Report 406: 2005 Hybrid Power Systems and their potential in the Pacific Islands Hove T.and Gottsche J. Mapping global, diffuse and beam radiation over Zimbabwe,
Renewable energy 1999;18:53
Collares –Pererra M, Rabl A. The average distribution of solar radiation hourly
correlations between diffuse and hemispherical radiation and between daily and
insolation values Solar Energy 1979; 22:15
Klein, S.A. Calculation of monthly average insolation on titled surfaces. Solar energy
1977;19:325
Hove T. 2000 A method for predicting long-term average performance of photovoltaic