Thiruvananthapuram, Kerala 695019, IndiacRadiochemistry Division, Bhabha Atomic
400085, IndiadDepartment of Atomic Energy, Homi Bhab
India
† Electronic supplementary informationuorimetric responses of TPE-NH2 in valimit of detection; selectivity study of Tmechanical studies of TPE-NH2 and Tsamples; cytotoxicity and cell imaging stuand previous reports for the detection ospectra. See DOI: 10.1039/d1ra03563k
Hydrazine is a vital precursor used in several pharmaceuticals and pesticide industries and upon exposure
can cause severe health hazards. Herein, a new AIEgen, tetraphenylethylene phthalimide (TPE-PMI), is
synthesized in a one-step solvent-free mechanochemical approach exploiting the simple condensation
between TPE-NH2 and phthalic anhydride and used for the selective and sensitive detection of
hydrazine. TPE-PMI with an AIE-active TPE-moiety is non-emissive in the solid phase by design.
Hydrazine performs the cleavage of TPE-PMI in a typical “Gabriel synthesis” pathway to release AIE-
active TPE-NH2 in an aqueous solution to emit blue fluorescence. A gradual rise in fluorescence intensity
at 462 nm was due to the increasing hydrazine concentration and TPE-PMI showed a linear relationship
with hydrazine in the concentration range from 0.2 to 3 mM. The selectivity study confirmed that the
probe is inert to amines, amino acids, metal anions, anions and even common oxidants and reductants.
The detection limit is 6.4 ppb which is lower than the US Environmental Protection Agency standard (10
ppb). The practical utilities of TPE-PMI were successfully demonstrated through quantitative detection of
hydrazine vapour on solid platforms like paper strips and TLC plates. Furthermore, on-site detection of
hydrazine in the solid phase was demonstrated by spiking the soil samples with measured quantities of
hydrazine and quantitation through image analysis. This cost-effective sensing tool was successfully
utilized in in vitro detection of hydrazine in live HeLa cells.
Introduction
Hydrazine is an important chemical in different industrial sectorsand is extensively used to prepare textile dyes, pharmaceuticals,polymers, pesticides, emulsiers, polymers, etc.1,2 It is also
(ESI) available: Synthesis of TPE-NH2;rious solvents; pH study of TPE-PMI;PE-PMI towards hydrazine; quantumPE-PMI; hydrazine detection in realdies; comparison of the present studyf hydrazine; copies of NMR and mass
the Royal Society of Chemistry
commonly used as a rocket fuel because of its very high heat ofcombustion.3 Despite its prevalent industrial uses, hydrazine iswell recognized for its severe noxiousness.4–6 Because of its muta-genic effect, it can harm the central nervous system and can easilyget engrossed by humans affecting severe damage to liver, kidney,lungs and other organs.7,8 The immense usage of hydrazine leadsto its contamination in soil and ground-water during the course ofmanufacturing, transportation, and disposal, and hence can easilyenter the food chain. Owing to its high toxicity and carcinogenicnature, the US Environmental Protection Agency (US EPA) hascategorized it as a group B2 chemical with a threshold limit of 10ppb.9 To protect human health and the environment from theadverse effect of hydrazine, the development of sensitive, selectiveand cost-effective methods for its detection is necessary. Conse-quently, a large variety of sensing strategies have been adopted forhydrazine, including electrochemistry,10 surface-enhanced Ramanspectroscopy,11 nanoparticle-based sensors,12 amperometry,13 etc.14
The key limits of these strategies are the use of expensive andintricate instrumentation, lengthy data acquirement time,engrossment of skilled personnel, which causes difficulty for real-time and on-site detection and monitoring.
Fluorimetric sensing, which involves interacting analyte withcompatible organic molecules, offers crucial advantages such ashigh sensitivity, selectivity and cost-effectiveness, and hasattracted many researchers in recent times.15,16 A good numberof chemosensors have been developed for uorimetric detec-tion of hydrazine17–19 based on well-known conventional dyemolecules such as rhodols,20 uorescein,21 BODIPY,22 dansyl,23
resorun,24 coumarin,25–27 andmany others.28–33 Inmost of thesereported methods, hydrazine has been assayed by evaluatingthe intensity changes in the uorescence output of the probemolecule by varying the concentration of the analyte in solutionphase by the use of a uorimeter.17–19 However, for the onsiteanalyte monitoring, it is always preferred to develop an assaysystem on the solid supports as it does not require expensiveand sophisticated instrumentation. It is noteworthy to mentionthat a solid-supported assay kit with the conventional uores-cent probes is difficult to achieve as they frequently suffer fromthe aggregation-caused quenching (ACQ) effect, when dispersedin a suitable solvent or assimilated into solid matrices, causinga huge diminution in the performance and sensitivity.34 TheACQ effect invokes enormous concerns in real-life uses,predominantly, in the solid phase detection of analytes.35
In the recent past, aggregation-induced emission (AIE) hasbeen exhibited by a new class of uorogenic molecules.35,36
These molecular probes, called AIEgens, can overcome ACQthrough emission owing to the restriction of intermolecularbond rotations (RIR) and the proscription of energy dissipationupon aggregation.37 They exhibit high quantum efficiency, goodbiocompatibility and photo-stability and therefore, nd anassortment of applications in diverse elds such as chemo-/bio-sensors,38,39 electroluminescent materials,40 cell imaging,41
optical devices42 etc.43 Among the reported AIE-gens, tetraphe-nylethylene (TPE) is one of the most studied luminophores dueto its easy synthesis and simple functionalization strategies forthe construction of novel sensing systems and various otherapplications.38,43 Though these AIE-gens can solve ACQ prob-lems, the development of a turn-on type of AIE-based sensor onthe solid supports remains challenging because of their auto-illuminating nature in the solid phase.35,36 However, from ourunprecedented observation of the formation of a non-emissiveTPE-azide dye in the solid phase during nitrite sensing bya TPE-NH2 based AIE-probe,44 we realized that a non-emissiveTPE-probe is possible which remains turn-off even in the solidphase, by the withdrawal of electron density from an emissiveTPE-NH2. We envisaged a phthalimide conjugated TPE (TPE-PMI) will be non-emissive in the solution phase as well as in thesolid-state. Relating the information that only hydrazine couldspontaneously regenerate the amino group from its phthali-mide derivative by a unique “Gabriel synthesis” type cleavage torelease the AIE-active unit, it paved us the way to design a highlyselective sensor for hydrazine.
In the last few years, mechanochemical synthesis of organiccompounds has become one of the emerging methods becauseit is a high yielding, energy-efficient, economic, and environ-mental friendly protocol that can avoid harsh conditions, use ofvolatile organic solvents etc.45,46 In recent years, our researchefforts are directed towards designing and synthesizing
21270 | RSC Adv., 2021, 11, 21269–21278
uorimetric sensors47–51 for environmentally and biologicallyimportant analytes particularly by environmentally benignways49–51 including mechanochemistry.51 Herein, we reporta non-emissive new AIEgen, tetraphenylethylene phthalimide(TPE-PMI), by the simple condensation of TPE-NH2 withphthalic anhydride using solvent-free mechanochemicalcondition and used for the selective and sensitive detection ofhydrazine using AIE-phenomenon.
ExperimentalChemicals and materials
4-Aminobenzophenone, benzophenone and hydrazine mono-hydrate (N2H4, 64–65%) were supplied by Sigma Aldrich (India).TiCl4 was procured from Spectrochem Pvt. Ltd. Mumbai (India).Phthalic anhydride was purchased from SDFCL (India). Allother common chemicals and solvents were obtained from localcommercial suppliers and were used without further purica-tion. All aqueous solutions were prepared with ultrapure waterobtained from Millipore system and purged with N2 for 15 minbefore use.
Instruments
NMR spectra (1H and 13C) were recorded on Bruker Avance (400MHz) with tetramethylsilane (TMS) as the internal standard.HRMS spectra were recorded on QTOF LC-MS (6545 Q-TOFLCMS, Agilent) using ESI as an ion source. Mass spectra wereobtained from Agilent 6400B LC-MS (ESI). An IR affinity-1Fourier transform infrared (FT-IR) spectrophotometer (Shi-madzu) was used to record IR spectra and KBr was used toprepare pellets. Fluorescence spectra were measured ona JASCO FP-6300 spectrouorometer; the slit width was 2.5 nmfor excitation and emission; the excitation wavelength was set to345 nm and emission spectra were recorded in the range of 350to 600 nm. Theoretical studies were performed with GaussianG09W using the density functional theory (DFT) method. Theuorescence images of HeLa cells were captured using a DAPIlter of Nikon uorescent microscope. ImageJ public domainimage processing soware was used for image analysis.
Procedure for sensing studies
1 mM stock solutions of TPE-PMI and hydrazine were preparedin CH3CN and deionized water (MilliQ, 18 MU cm), respectively.The uorescence studies were carried out by the addition ofTPE-PMI (10 mM) in 3% CH3CN in HEPES buffer (10 mM, 7.0pH) in a 1 mL cuvette. For selectivity study, stock solutions ofchlorides and nitrates of cations (1 mM) and sodium salts ofanions (1 mM), different amines and amino acids (1 mM) wereprepared in deionized water. For some other organic molecules,if it is not freely soluble in water, the stock solutions wereprepared in CH3CN (1 mM) and subsequently used for selec-tivity studies. The solutions for real sample analytes wereprepared by spiking hydrazine in water samples collected fromvarious water bodies (eld, tap, pond, rain and river water). Allsolutions were subjected to ltration through 0.22 mm syringelter to avoid any interference by any particulate matter in
uorescence measurement. All the experiments were performedthree independent times at room temperature and the averagedata were reported.
Synthesis of 4-(1,2,2-triphenylvinyl)benzenamine (TPE-NH2)
TPE-NH2 was prepared from an equimolar mixture of 4-ami-nobenzophenone and benzophenone using McMurry cross-coupling reaction according to the reported procedure44 andcharacterized by NMR (1H & 13C) and ESI-MS (see ESI fordetails†).
Synthesis of 2-(4-(1,2,2-triphenylvinyl)phenyl)isoindoline-1,3-dione (TPE-PMI)
In a 5 mL stainless steel (SS) jar, TPE-NH2 (100 mg, 0.29 mmol)and phthalic anhydride (43 mg, 0.29 mmol) were taken with one10 mm SS ball. The two components were milled in a RetschMM400 mixer-mill for 1 h at 30 Hz. Next, the solid mixture wastransferred to a 10 mL Teon container and heated in a sandbath at 230 �C for 2 h. The TLC revealed complete consumptionof TPE-NH2 and formation of a single product. The sufficientlypure TPE-PMI was recrystallized from EtOH–water to afford theprobe as off-white solid (130 mg, 94%), mp 283 �C; 1H NMR (400MHz, CDCl3), d (ppm) 7.94 (2H, dd, J1¼ 3.2 Hz, J2¼ 5.6 Hz), 7.79(2H, dd, J1 ¼ 3.2 Hz, J2 ¼ 5.6 Hz), 7.27–7.24 (2H, m), 7.22–7.17(2H, m), 7.16–7.05 (15H, m); 13C NMR (100 MHz, CDCl3),d (ppm) 167.17, 143.53, 143.34, 143.30, 143.24, 141.73, 139.95,134.34, 131.84, 131.67, 131.41, 131.37, 131.30, 131.27, 129.78,127.81, 127.72, 127.62, 126.69, 126.54, 126.49, 125.36, 123.63; IR(KBr): n 3028, 1709, 1598, 1510, 1389 cm�1; HRMS (ESI):calculated for C34H24NO2 [M + H]+: 478.1729, found 478.1754.
DFT studies
Quantum mechanical studies were performed at the densityfunctional theory (DFT)52 and time-dependent density func-tional theory (TD-DFT)53 levels using the Gaussian 09 programto understand the ground and excited state behaviours of TPE-PMI and TPE-NH2. Becke's three-parameter exchange function(B3)54 with Lee–Yang–Parr correlation function (LYP)55 havebeen employed using the 6-311G basis set for the geometryoptimization calculations.
General procedure for image analysis and solid, solution,vapour phase detection of hydrazine
The TLC plates were dipped in TPE-PMI (1 mM) solution. On thedried TLC plates different concentrations of hydrazine (0, 20,40, 80, 120 and 160 mM) were drop casted and directly subjectedto image analysis by ImageJ soware.56 For solution phasedetection of hydrazine TPE-PMI (1 mM) was drop casted onculture plates and sprayed with hydrazine (1 mM) solution. Invapour phase detection, the TLC plate was engraved as “BITS”with TPE-PMI (1 mM) solution soaked earbud and was exposedto hydrazine vapour in a closed container for 30 min. For solid-phase detection, the soil samples were collected from thedifferent landmass, spiked with hydrazine followed by theaddition of TPE-PMI. In another set of study, the soil samples
contaminated with hydrazine were transferred into the TPE-PMIsolution. The uorescence images were taken under long UVlight source (365 nm). All the images were taken by SamsungM31 smartphone with 64 megapixels camera without any lter.
Cytotoxicity and cell imaging studies
For cytotoxicity studies A549, HEPG2, HeLa cells and forimaging only HeLa cells were grown in Dulbecco's ModiedEagle's Medium (DMEM) supplemented with 10% (v/v) fetalbovine serum, separately. Cells were seeded (1 � 104) in a 96well plate and aer 24 h, treated with various concentrations ofTPE-PMI (0–200 mM) for 24 h and performed the MTT assay. Fortime-dependent uorescence cell imaging, HeLa cells in logphase were harvested by trypsinization and centrifugation andseeded in a 96 well plate (8 � 103 cells per well). Firstly, HeLacells were incubated for 10–30 min in the presence of hydrazineand washed with PBS buffer. Next, the cells were treated withTPE-PMI (10 mM) for 1 h, followed by thrice PBS buffer wash.The detection of hydrazine on HeLa cells was monitored atdifferent time-intervals (10 min, 15 min, 30 min). Next, forconcentration-dependent uorescence cell imaging, the washedHeLa cells were loaded with different concentrations of hydrazine(0, 20, 50 and 100 mM) respectively at 37 �C for 1 h. Aer removal offree hydrazine by washing the cells with PBS buffer, the cells wereloaded with TPE-PMI (10 mM); incubated for another 1 h. For thecell imaging studies, the uorescence and bright-eld images weretaken directly under a DAPI lter of Nikon uorescent microscope,combining the phase-contrast system and the uorescence system,without further washing steps.
Results and discussionDesign and synthesis of TPE-PMI
In 2015, an AIE based turn-off type probe was reported by ourgroup for the detection of nitrite and nitrate ions utilizing well-known diazotization reaction of TPE-NH2.44 The p-extendedTPE-based product, an azo dye, showed quenching property,presumably because of strong electron delocalization of theelectron-rich donor (TPE unit) to the quencher group (–N]N–Ar). Several research groups have exploited this phenomenon todevelop TPE-based probes for selective detection of hydra-zine.57–59 For example, Liu and co-workers, in 2017, developeda TPE-based uorogenic probe for naked-eye sensing of hydra-zine employing a similar strategy of the attachment of an azogroup (–N]N–) as the quencher unit to a suitable TPE moiety.57
The azo group was reduced to –NH–NH– in the presence ofhydrazine to open the passage of electron ow to give a turn-onuorescence response. However, a simple reduction of azogroup can also be achieved by other reducing agents which maylead to the poor selectivity of the probe.60 The same grouppreviously developed another TPE-probe with cyanovinyl groupas the acceptor which showed moderate interference by gluta-thione.58 However, uorescent probe with a cyanovinyl groupfor selective detection of hydrazine known to show response inthe presence of nucleophiles like HSO3
�,25 amines,59,61 etc.62
Considering these facts, we designed a solid-state AIE-
suppressed probe (TPE-PMI) for hydrazine consisting of twofeatures: (1) tetraphenylethylene (TPE) as an AIEgen to showhigh uorescence in the aggregated state and (2) phthalimidemoiety as a quencher and the reactive site for hydrazine via“Gabriel synthesis pathway”. It was considered that by cleavingthe phthalimide group, TPE-PMI switches to the uorescenceON state by releasing TPE-NH2; potentially capable of detectinghydrazine in solution, vapour and solid phase with utmostselectivity. Practically, the probe was synthesized in a single stepby 100% atom-economic way from a known TPE-derivative(TPE-NH2). First, TPE-NH2 was synthesized from benzophe-none and 4-aminobenzophenone by McMurry cross-couplingand characterized (see ESI for details†).44 The TPE-NH2 wasconverted to TPE-PMI using a mechanochemical method bymilling of TPE-NH2 and phthalic anhydride under neat condi-tion followed by heating at 230 �C in a Teon containerresulting in the formation of TPE-PMI in high yield. Theproduct was characterized by 1H and 13C NMR, HRMS and IRspectroscopy. The peak at d (ppm) 167.17 of 13C and 1703 cm�1
of IR conrms the imide carbonyl of TPE-PMI.
Fig. 1 Fluorimetric response of TPE-PMI (10 mM) upon the addition ofhydrazine (0 to 20 mM) in 3% CH3CN in HEPES [lex 345 nm; lem 462nm]. Inset: plot of the increment in emission against the concentrationof hydrazine.
Solvent screening and spectral investigation of TPE-PMItowards hydrazine
As anticipated, TPE-PMI was non-emissive in organic solventslike CH3CN, DMF, DMSO and THF and did not manifest any AIEresponse upon varying the water fractions in the aqueous-organic solvent mixture (Fig. S1, ESI†). Whereas, its precursoror the product by hydrazine mediated cleavage, TPE-NH2, eventhough non-uorescent in the same organic solvents, preservesan intense blue uorescence response in water fractions above90% manifesting the AIE behavior (Fig. S1, ESI†). The CH3CN–water mixture was found out as one of the better solvent systemswith the highest AIE response for TPE-NH2 at or above 5 : 95CH3CN–water making it a suitable solvent system to explore thenucleophilic attack of hydrazine to TPE-PMI and subsequentcleavage to an emissive TPE-NH2. Indeed, a 3% CH3CN in wateror HEPES buffer was found as most suitable solvent system forspontaneous sensing of hydrazine. A detailed theoretical studywas also carried out to understand the non-emissive characterof TPE-PMI, which will be discussed later.
Next, the uorescence behaviour of TPE-PMI in the presence ofhydrazine was measured. First, as a regular practice, the uori-metric response of 10 mM of TPE-PMI at a wide range of pH wasstudied in the absence and presence of one equivalent of hydra-zine (Fig. S2, ESI†). It was observed that TPE-PMI remains non-uorescence in the absence of hydrazine in the broad pH range(pH 3–12). While in the presence of hydrazine, TPE-PMI showedthe highest response at a neutral pH and considerably high uo-rescence response in a reasonably wide range of pH (pH 6–8),which gives us a working window in mild acidic and basicconditions with a consideration that only water or a buffer can beused for entire sensing studies. The conversion of the imide groupto the corresponding amide under a strongly basic medium andprotonation of the hydrazine to remain unavailable for interactionunder strongly acidic conditionsmight be the reasons for the lowerresponses at higher and lower pH.
21272 | RSC Adv., 2021, 11, 21269–21278
The uorescence response was recorded by taking 10 mM ofTPE-PMI in 3% CH3CN in HEPES (10 mM, pH 7.0) upon theincremental addition of hydrazine (0–2 equiv.) (Fig. 1). A regularincrease up to �10 folds in uorescence intensity of the char-acteristic peak of tetraphenylethylene moiety at lmax 462 nmwas observed and corresponding relative uorescence intensi-ties against hydrazine concentration were plotted to geta sigmoidal curve with a high R2 value (R2 ¼ 0.99426) (Fig. 1,inset). This established the highly sensitive nature of the TPE-PMI for the detection of hydrazine in the aqueous solution.
Selectivity studies
Selectivity is the most signicant parameter for assessing theperformance and future applications of any analytical probe.The probe TPE-PMI, by design exhibited high selectivity towardshydrazine, and was investigated by competing it with variouscations, anions which are commonly abundant in water andalso with various amines, amino acids, small molecules, andreducing and oxidizing agents. The interaction of TPE-PMI withnumerous prospective interfering ions like metal ions (Ag+, Al3+,Ca2+, Cd2+, Co2+, Cr3+, Cu2+, Fe2+, Fe3+, Hg2+, K+, Mg2+, Mn2+,Na+, Ni2+, Pb2+, Sn2+ and Zn2+), anions (Cl�, Br�, I�, NO2
�,NO3
�, N3�, CO3
2�, HCO3�, HPO4
2�, H2PO4�, SCN�, SH�,
HSO3�, S2O3
2�, S2� and AcO�) 50 mM each were evaluated(Fig. S3a and b, ESI†). The study resulted in no obvious changein the uorescence intensity for each analyte studied. Next,aliphatic and aromatic amines such as ethylenediamine, etha-nolamine, triethylamine, diethylamine, ethylamine, p-phenyl-enediamine, aniline, hexamethylenetetramine (HMTA), variousL-amino acids including alanine (Ala), leucine (Leu), proline(Pro), aspartic acid (Asp), glycine (Gly), cysteine (Cys), bovineserum albumin (BSA), other common chemicals like phenyl-hydrazine, urea, thiourea, hydroxylamine, semicarbazide werealso examined against TPE-PMI. By contrast, these speciescaused a negligible output of the uorescence intensity fromtheir respective solutions (Fig. S3c, ESI†). Further, reductants
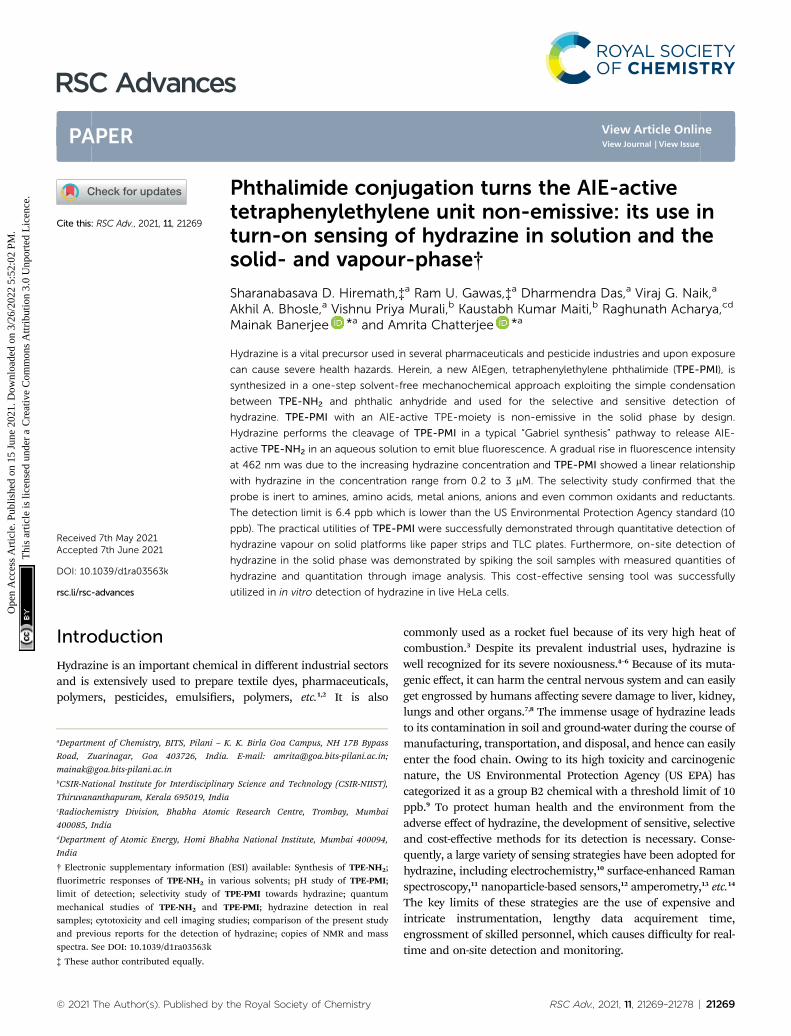
Fig. 2 The effect of various interfering analytes on TPE-PMI drop-casted on TLC plate: (A) in the absence and (B) presence of hydrazine(viewed under long UV radiation, 365 nm).
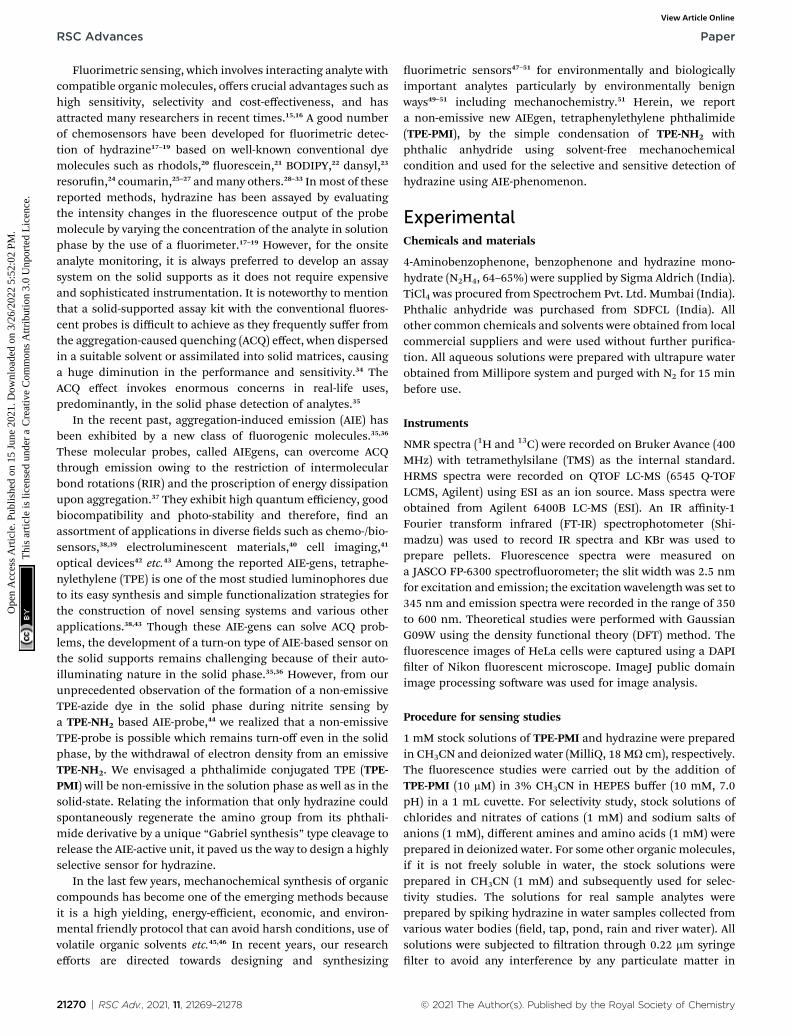
Fig. 3 Frontier molecular orbital diagram of HOMO and LUMO ofTPE-PMI in ground state geometry.
Paper RSC Advances
Ope
n A
cces
s A
rtic
le. P
ublis
hed
on 1
5 Ju
ne 2
021.
Dow
nloa
ded
on 3
/26/
2022
5:5
2:02
PM
. T
his
artic
le is
lice
nsed
und
er a
Cre
ativ
e C
omm
ons
Attr
ibut
ion
3.0
Unp
orte
d L
icen
ce.
View Article Online
like glutathione (GSH), glucose (Glu), NaBH4, HQ, and oxidantslike BQ, H2O2, sodium borate, sodium hypochlorite, 50 mM eachwere evaluated (Fig. S3c, ESI†). It was found that the uores-cence intensity of TPE-PMI was highly enhanced only by theaddition of hydrazine. The other redox compounds did notcause any signicant changes in the uorescence intensity. Allthe above results indicated that TPE-PMI undergoes a typical nucle-ophilic attack of hydrazine proposed for the Gabriel synthesispathwaywith excellent selectivity toward hydrazine in aqueousmedia.In a separate study, we evaluated the specicity of TPE-PMI towardshydrazine on solid-phase with selected analytes on TLC plates. InFig. 2a, TLC based detection showed that only hydrazine results in anobvious uorescence response while the competitors, even thereductive species (cysteine, D-glucose andGSH), didnot cause any signof uorescence in the solid phase. Then we conducted the detectionof hydrazine in the presence of all of selected interference molecules(Fig. 2b). The results show that there is no obvious difference inuorescence intensity. This study indicated thehigh selectivity ofTPE-PMI towards detecting hydrazine on the solid phase as well.
DFT studies
To understand the electronic behaviour of TPE-PMI and itscleaved form aer interaction with hydrazine (i.e., TPE-NH2)quantum mechanical studies were carried out at the densityfunctional theory (DFT)52 and time-dependent density func-tional theory (TD-DFT)53 levels using the Gaussian 09 programto understand the ground and excited state behaviour of TPE-NH2 and TPE-PMI. Becke's three-parameter exchange functions(B3)54 with Lee–Yang–Parr correlation55 function (LYP) wereemployed using 6-311G basis set for the geometry optimizationcalculations. The probe TPE-PMI showed non-uorescentnature both in the solution as well as in the solid-state. Fig. 3showed that a major portion of the p-cloud is shied fromHOMO of the TPE-moiety and exists near to the phthalimidemoiety in the LUMO. During the excitation from HOMO toLUMO, the disappearance of p-electron cloud from the centralethylene moiety as well as from three of the four phenyl rings oftetraphenylethylene was observed (Fig. 3). During S0–S1
transition, the fourth phenyl ring of the TPE moiety, which isdirectly connected to the electron-withdrawing phthalimidepart and located on the other side of the bond, can createa channel for shiing of the p-electron cloud because of theircoplanarity. Therefore, the non-uorescent nature of TPE-PMIcould be correlated to the disappearance of p electron cloudfrom themajor part of the TPEmoiety in the course of HOMO toLUMO transition. This intramolecular charge transfer (ICT)process is successively followed by a non-radiative decay fromthis charge-separated excited state. The optimized singletexcited state of this species is more or less having a similargeometry as the ground state (Fig. S4, ESI†). The energy gapbetween the excited state at its optimized geometry and the groundstate at this geometry was found to be very small (�0.73 eV). As perthe energy gap law,63 this shows a chance of non-radiative decay ofthe singlet excited state. Additionally, the aggregated state is also notanticipated to have a betterp-delocalization (even though it becomesentirely planar) as the electron-withdrawing part of the molecule willstill inhibit ow ofp-electronic cloud over the TPE part. Whereas, forTPE-NH2 the S0–S1 transition arising due to the HOMO / LUMOexcitation was characterized by an association of the p-cloud fromthe aniline moiety towards the central ethylenic part (Fig. S5 and S6,ESI†).44 A better co-planarity resulting in from improved delocaliza-tion can be expected in the aggregated form andmight be the reasonbehind the uorescent nature of TPE-NH2 in this state.
The mechanistic aspect of hydrazine sensing by TPE-PMI
Based on the previous report,44 TPE-NH2 is considered as theuorescence signaling unit, and the quenching of uorescencein TPE-PMI is predicted via the ICT process from the TPE u-orophore to the phthalimide moiety. However, in an appro-priate solvent system hydrazine converts TPE-PMI to thecorresponding free amine, i.e. AIE-active TPE-NH2 via “Gabrielsynthesis” pathway in two steps. The nucleophilic addition ofhydrazine to the carbonyl carbon, in the rst step, is followed bythe subsequent nucleophile attack on the carbonyl group wouldinduce the release of phthalhydrazide and the TPE-NH2 would begenerated (Scheme 1). In order to verify the proposed mechanism,further studies were conducted. First, the LC-MS of sensing solu-tion was recorded aer addition of 0.5 equiv. of hydrazine. Atdifferent retention time, the peak atm/z 478 [M + H]+ representingTPE-PMI and at m/z 348 [M + H]+ corresponding to the TPE-NH2
were observed clearly indicating hydrazinemediated conversion ofTPE-PMI to TPE-NH2 (Fig. S7, ESI†). Next, to determine the struc-ture of the generated byproducts, a reaction was kept with TPE-
Scheme 1 Synthesis and sensing mechanism of TPE-phthalimide(TPE-PMI).
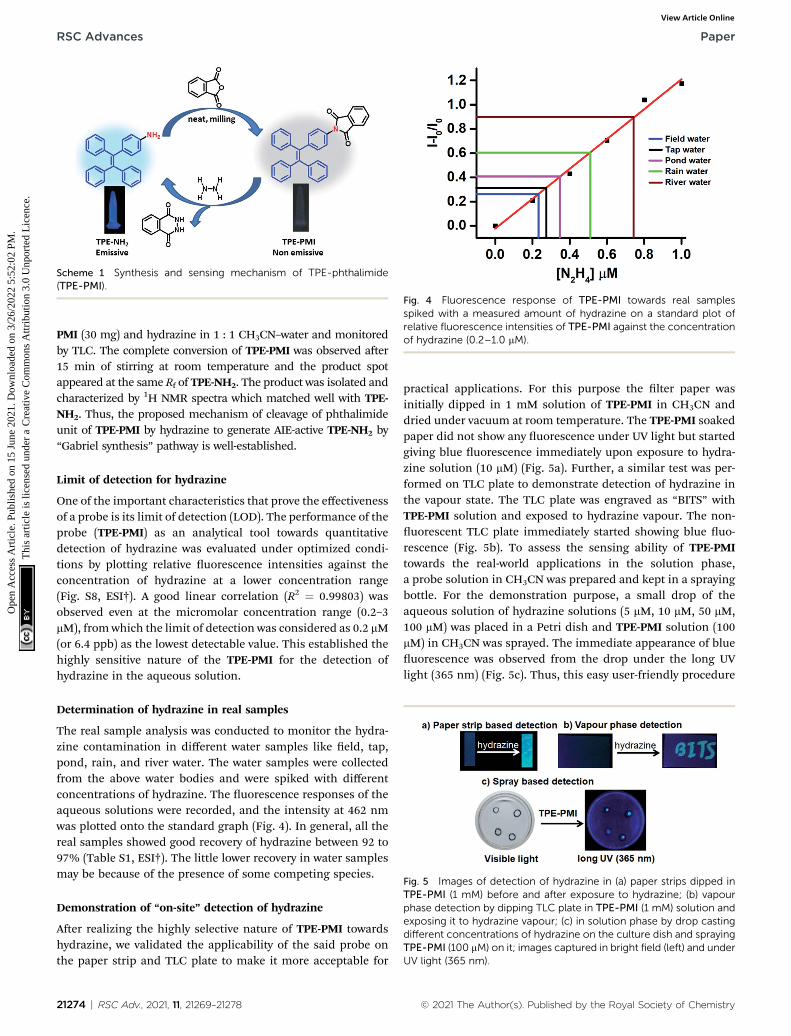
Fig. 4 Fluorescence response of TPE-PMI towards real samplesspiked with a measured amount of hydrazine on a standard plot ofrelative fluorescence intensities of TPE-PMI against the concentrationof hydrazine (0.2–1.0 mM).
Fig. 5 Images of detection of hydrazine in (a) paper strips dipped inTPE-PMI (1 mM) before and after exposure to hydrazine; (b) vapourphase detection by dipping TLC plate in TPE-PMI (1 mM) solution andexposing it to hydrazine vapour; (c) in solution phase by drop castingdifferent concentrations of hydrazine on the culture dish and sprayingTPE-PMI (100 mM) on it; images captured in bright field (left) and underUV light (365 nm).
RSC Advances Paper
Ope
n A
cces
s A
rtic
le. P
ublis
hed
on 1
5 Ju
ne 2
021.
Dow
nloa
ded
on 3
/26/
2022
5:5
2:02
PM
. T
his
artic
le is
lice
nsed
und
er a
Cre
ativ
e C
omm
ons
Attr
ibut
ion
3.0
Unp
orte
d L
icen
ce.
View Article Online
PMI (30 mg) and hydrazine in 1 : 1 CH3CN–water and monitoredby TLC. The complete conversion of TPE-PMI was observed aer15 min of stirring at room temperature and the product spotappeared at the same Rf of TPE-NH2. The product was isolated andcharacterized by 1H NMR spectra which matched well with TPE-NH2. Thus, the proposed mechanism of cleavage of phthalimideunit of TPE-PMI by hydrazine to generate AIE-active TPE-NH2 by“Gabriel synthesis” pathway is well-established.
Limit of detection for hydrazine
One of the important characteristics that prove the effectivenessof a probe is its limit of detection (LOD). The performance of theprobe (TPE-PMI) as an analytical tool towards quantitativedetection of hydrazine was evaluated under optimized condi-tions by plotting relative uorescence intensities against theconcentration of hydrazine at a lower concentration range(Fig. S8, ESI†). A good linear correlation (R2 ¼ 0.99803) wasobserved even at the micromolar concentration range (0.2–3mM), fromwhich the limit of detection was considered as 0.2 mM(or 6.4 ppb) as the lowest detectable value. This established thehighly sensitive nature of the TPE-PMI for the detection ofhydrazine in the aqueous solution.
Determination of hydrazine in real samples
The real sample analysis was conducted to monitor the hydra-zine contamination in different water samples like eld, tap,pond, rain, and river water. The water samples were collectedfrom the above water bodies and were spiked with differentconcentrations of hydrazine. The uorescence responses of theaqueous solutions were recorded, and the intensity at 462 nmwas plotted onto the standard graph (Fig. 4). In general, all thereal samples showed good recovery of hydrazine between 92 to97% (Table S1, ESI†). The little lower recovery in water samplesmay be because of the presence of some competing species.
Demonstration of “on-site” detection of hydrazine
Aer realizing the highly selective nature of TPE-PMI towardshydrazine, we validated the applicability of the said probe onthe paper strip and TLC plate to make it more acceptable for
21274 | RSC Adv., 2021, 11, 21269–21278
practical applications. For this purpose the lter paper wasinitially dipped in 1 mM solution of TPE-PMI in CH3CN anddried under vacuum at room temperature. The TPE-PMI soakedpaper did not show any uorescence under UV light but startedgiving blue uorescence immediately upon exposure to hydra-zine solution (10 mM) (Fig. 5a). Further, a similar test was per-formed on TLC plate to demonstrate detection of hydrazine inthe vapour state. The TLC plate was engraved as “BITS” withTPE-PMI solution and exposed to hydrazine vapour. The non-uorescent TLC plate immediately started showing blue uo-rescence (Fig. 5b). To assess the sensing ability of TPE-PMItowards the real-world applications in the solution phase,a probe solution in CH3CN was prepared and kept in a sprayingbottle. For the demonstration purpose, a small drop of theaqueous solution of hydrazine solutions (5 mM, 10 mM, 50 mM,100 mM) was placed in a Petri dish and TPE-PMI solution (100mM) in CH3CN was sprayed. The immediate appearance of blueuorescence was observed from the drop under the long UVlight (365 nm) (Fig. 5c). Thus, this easy user-friendly procedure
Fig. 7 On-site detection of hydrazine: (a) in solid-phase the hydrazinecontaminated soil was sprayed with TPE-PMI (1 mM) and viewed underUV light; (b) different soil types like clay, field and sand soil wereexposed to hydrazine (1 mM) and transferred into the solution con-tained TPE-PMI (1 mM) and the solutions were viewed under UV light(365 nm).
Paper RSC Advances
Ope
n A
cces
s A
rtic
le. P
ublis
hed
on 1
5 Ju
ne 2
021.
Dow
nloa
ded
on 3
/26/
2022
5:5
2:02
PM
. T
his
artic
le is
lice
nsed
und
er a
Cre
ativ
e C
omm
ons
Attr
ibut
ion
3.0
Unp
orte
d L
icen
ce.
View Article Online
can offer a useful approach for onsite analysis and detection ofhydrazine.
Recently, smartphone based devices are successfullyemployed in the detection and quantitation of analytes bya quick analysis of images and is slowly becoming a user-friendly approach for on-site detection.64 Aer successfuldemonstration of the solid phase detection of hydrazine, wefelt, it will be worth carrying out image analysis for the quan-titation of hydrazine in the solid phase. Again, we utilized TLCplates as the solid platform. The TLC strips were prepared bydrop-casting the probe solution (1 mM in CH3CN) on the TLCplate and dipping them in the aqueous solution of the differentconcentrations of hydrazine. In all the cases the TLC platesshowed blue uorescence of different intensities when placedunder UV lamp (365 nm). The images were captured with thecamera and subjected to ImageJ analysis. Clearly, the observeduorescence became brighter with exposure to a higherconcentration of hydrazine. For the analysis of each sample,four different regions were selected randomly within thecircular region using the background as a control and correctedtotal cell uorescence (CTCF) value of the images were plottedagainst the concentrations of hydrazine. More importantly, thesolid phase provides a sufficient uorescence response froma 40 mM of hydrazine with a regression coefficient of R2 ¼0.99921 (Fig. 6). This shows the scope of using the imageanalysis technique for the possible quantication of hydrazinefor real-life applications.
Direct detection of hydrazine in soil samples
To extend the applicability of this approach for the possibledetection of hydrazine in environmental soil samples, ina qualitative way, some amount of the eld soil was taken in
Fig. 6 (a) The images of TLC plates drop-casted by TPE-PMI anddipped in different concentrations of hydrazine; (b) plots of the CTCFvalues of the images of TLC plates captured on a smartphone andprocessed using ImageJ analysis software.
a watch glass and contaminated with hydrazine followed byspraying TPE-PMI (1 mM) solution before capturing images.The blue uorescence was observed from the soil sample underlong UV light (365 nm) (Fig. 7a).
The initial success encouraged us to further investigate thedirect detection of hydrazine in various soil samples (clay soil,eld soil, and sand soil). Initially, the soil (1 g) was contami-nated with the known concentration of aqueous hydrazine (50mL of 1 mM). Next, the contaminated soils were added to thesolution of TPE-PMI (100 mM, in 3% CH3CN in HEPES) and theuorescence change was monitored. A distinct blueish emissionwas observed within a minute in all the soil samples (Fig. 7b). Theuorescence signals from these solutions were visible even aer 10days. Next, in the same way like solid phase based image analysis,the quantitation of hydrazine in the sand sample was carried outthrough image analysis. The images of variable amounts ofhydrazine contaminated sand transferred to the solution of TPE-PMI were captured by a 64 megapixels mobile camera and pro-cessed through Image-J analysis soware. A good correlation plotbetween CTCF and the amount of hydrazine with high regressioncoefficient (R2 ¼ 0.98494) was obtained from 0.05 mmoles to 0.5mmoles (Fig. S9, ESI†). These studies clearly demonstrate thepotential real-world applicability of TPE-PMI for the detection andquantitation of hydrazine.
Detection of hydrazine in live cells
To further explore the usefulness of TPE-PMI in the livingspecies, we carried out in vitro studies for the detection ofhydrazine in HeLa cells. In this regard, the cytotoxicity of TPE-PMI by the MTT assay at different concentrations was deter-mined (Fig. S10, ESI†). Three cell lines namely A549, HEPG2and HeLa cells were selected for cell viability study. As seenfrom the bar diagram, no signicant cell death of any of the celllines was observed up to 50 mM of TPE-PMImaking it safe to useon human cell lines even at reasonably higher concentrations.The cytotoxicity study allowed us to use TPE-PMI for in vitrosensing in HeLa cells. For this, cells were pre-treated witha large excess of hydrazine (50 mM) for 30 min, followed byincubation with TPE-PMI (10 mM). This followed a washing step
to remove any loose probe molecules that are present in theculture media. Initially, a time-dependent uorescenceresponse was carried out (Fig. S11, ESI†). The uorescence turn-on response in the presence of hydrazine at different timeintervals (10 min, 15 min, 30 min) was imaged upon incubationwith TPE-PMI. It was observed that as time increases, the HeLacells show enhanced uorescence from the intracellular region.It indicates that probe TPE-PMI is suitable for the in vitrosensing of hydrazine; can easily penetrate the cell membrane toenter into the living cells and interact with hydrazine present inthe cytosol and trigger a uorescence response. The highestmanifestation of uorescence was observed aer 30 min whichwas considered as the ideal time for the hydrazine to enter intothe live cells. A similar study was replicated by pre-treatment ofHeLa cells with various concentrations of hydrazine (0–100 mM)(Fig. S12, ESI†). Once again, the blue uorescence was observedeven if the cells were exposed to only 10 mM of hydrazine. Thus,the probe can be used for in vitro detection and wash-freeimaging of hydrazine via cell imaging even at a reasonablylow concentration level.
Comparison with available AIE-based probes
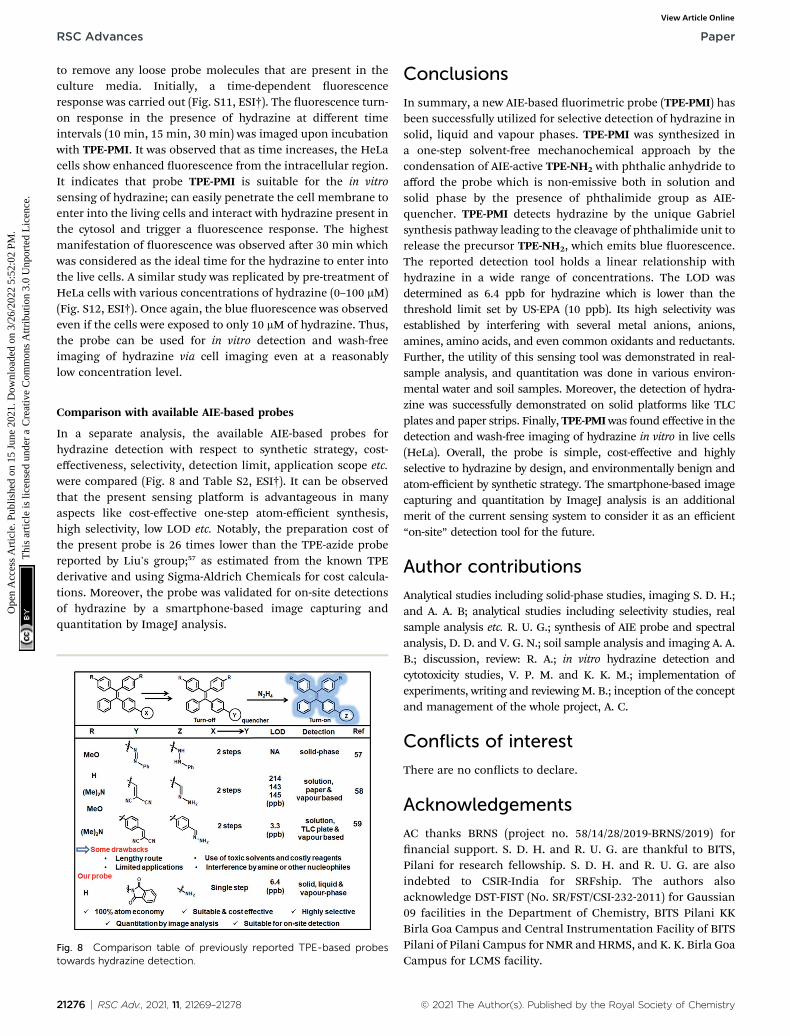
In a separate analysis, the available AIE-based probes forhydrazine detection with respect to synthetic strategy, cost-effectiveness, selectivity, detection limit, application scope etc.were compared (Fig. 8 and Table S2, ESI†). It can be observedthat the present sensing platform is advantageous in manyaspects like cost-effective one-step atom-efficient synthesis,high selectivity, low LOD etc. Notably, the preparation cost ofthe present probe is 26 times lower than the TPE-azide probereported by Liu's group;57 as estimated from the known TPEderivative and using Sigma-Aldrich Chemicals for cost calcula-tions. Moreover, the probe was validated for on-site detectionsof hydrazine by a smartphone-based image capturing andquantitation by ImageJ analysis.
In summary, a new AIE-based uorimetric probe (TPE-PMI) hasbeen successfully utilized for selective detection of hydrazine insolid, liquid and vapour phases. TPE-PMI was synthesized ina one-step solvent-free mechanochemical approach by thecondensation of AIE-active TPE-NH2 with phthalic anhydride toafford the probe which is non-emissive both in solution andsolid phase by the presence of phthalimide group as AIE-quencher. TPE-PMI detects hydrazine by the unique Gabrielsynthesis pathway leading to the cleavage of phthalimide unit torelease the precursor TPE-NH2, which emits blue uorescence.The reported detection tool holds a linear relationship withhydrazine in a wide range of concentrations. The LOD wasdetermined as 6.4 ppb for hydrazine which is lower than thethreshold limit set by US-EPA (10 ppb). Its high selectivity wasestablished by interfering with several metal anions, anions,amines, amino acids, and even common oxidants and reductants.Further, the utility of this sensing tool was demonstrated in real-sample analysis, and quantitation was done in various environ-mental water and soil samples. Moreover, the detection of hydra-zine was successfully demonstrated on solid platforms like TLCplates and paper strips. Finally, TPE-PMIwas found effective in thedetection and wash-free imaging of hydrazine in vitro in live cells(HeLa). Overall, the probe is simple, cost-effective and highlyselective to hydrazine by design, and environmentally benign andatom-efficient by synthetic strategy. The smartphone-based imagecapturing and quantitation by ImageJ analysis is an additionalmerit of the current sensing system to consider it as an efficient“on-site” detection tool for the future.
Author contributions
Analytical studies including solid-phase studies, imaging S. D. H.;and A. A. B; analytical studies including selectivity studies, realsample analysis etc. R. U. G.; synthesis of AIE probe and spectralanalysis, D. D. and V. G. N.; soil sample analysis and imaging A. A.B.; discussion, review: R. A.; in vitro hydrazine detection andcytotoxicity studies, V. P. M. and K. K. M.; implementation ofexperiments, writing and reviewingM. B.; inception of the conceptand management of the whole project, A. C.
Conflicts of interest
There are no conicts to declare.
Acknowledgements
AC thanks BRNS (project no. 58/14/28/2019-BRNS/2019) fornancial support. S. D. H. and R. U. G. are thankful to BITS,Pilani for research fellowship. S. D. H. and R. U. G. are alsoindebted to CSIR-India for SRFship. The authors alsoacknowledge DST-FIST (No. SR/FST/CSI-232-2011) for Gaussian09 facilities in the Department of Chemistry, BITS Pilani KKBirla Goa Campus and Central Instrumentation Facility of BITSPilani of Pilani Campus for NMR andHRMS, and K. K. Birla GoaCampus for LCMS facility.
1 U. Ragnarsson, Chem. Soc. Rev., 2001, 30, 205–213.2 J. I. Kroschwitz and A. Seidel, Hydrazine and its derivatives inKirk-Othmer Encyclopedia of Chemical Technology, Wiley,NewYork, 2005, vol. 13.
3 A. Serov and C. Kwak, Appl. Catal., B, 2010, 98, 1–9.4 G. Choudhary and H. Hansen, Chemosphere, 1998, 37, 801–843.
5 S. Garrod, M. E. Bollard, A. W. Nicholls, S. C. Connor,J. Connelly, J. K. Nicholson and E. Holmes, Chem. Res.Toxicol., 2005, 18, 115–122.
6 B. K. Sinha and R. P. Mason, J. Drug Metab. Toxicol., 2014, 5,2–8.
7 Re-evaluation of some organic chemicals, hydrazine andhydrogen peroxide, IARC monographs on the evaluation ofcarcinogenic risk of chemicals to humans, IARC, Lyon, 1999,vol. 71, pp. 991–1013, http://monographs.iarc.fr/ENG/Monographs/vol71/mono71–43.
8 B. Toth, Cancer Res., 1975, 35, 3693–3697.9 U. S. Environmental Protection Agency (EPA), Integrated riskinformation system (IRIS) on hydrazine, hydrazine sulfate,National Center for Environmental Assessment, Office ofResearch and Development, Washington DC, 1999.
10 J. Wang, T. Xie, Q. Deng, Y. Wang, Q. Zhu and S. Liu, New J.Chem., 2019, 43, 3218–3225.
11 X. Gu and J. P. Camden, Anal. Chem., 2015, 87, 6460–6464.12 S. D. Hiremath, B. Priyadarshi, M. Banerjee and
A. Chatterjee, J. Photochem. Photobiol., A, 2020, 389,112258–112265.
13 M. Nemakal, S. Aralekallu, I. Mohammed, S. Swamy andL. K. Sannegowda, J. Electroanal. Chem., 2019, 839, 238–246.
14 A. Umar, M. M. Rahman, S. H. Kim and Y. B. Hahn, Chem.Commun., 2008, 166–168.
15 D. Wu, A. C. Sedgwick, T. Gunnlaugsson, E. U. Akkaya, J. Yoonand T. D. James, Chem. Soc. Rev., 2017, 46, 7105–7123.
16 O. S. Woleis, Fluorescence spectroscopy: new methods andapplications, Springer Science & Business Media, 2012.
17 B. Roy and S. Bandyopadhyay, Anal. Methods, 2018, 10, 1117–1139.
18 L. Yan, S. Zhang, Y. Xie, X. Mu and J. Zhu, Crit. Rev. Anal.Chem., 2020, 1–20.
19 X. Y. Zhang, Y. S. Yang, W. Wang, Q. C. Jiao and H. L. Zhu,Coord. Chem. Rev., 2020, 417(1–30), 213367.
20 K. Tiensomjitr, R. Noorat, S. Chomngam, K. Wechakorn,S. Prabpai, P. Kanjanasirirat, Y. Pewkliang,S. Borwornpinyo and P. A. Kongsaeree, Spectrochim. Acta,Part A, 2018, 195, 136–141.
21 N. Vijay and S. Velmathi, ACS Sustainable Chem. Eng., 2020,8, 4457–4463.
22 A. K. Mahapatra, R. Maji, K. Maiti, S. K. Manna, S. Mondal,S. S. Ali, S. Manna, P. Sahoo, S. Mandal, M. R. Uddin andD. Mandal, RSC Adv., 2015, 5, 58228–58236.
23 X.-X. Zhao, J.-F. Zhang, W. Liu, S. Zhou, Z.-Q. Zhou,Y.-H. Xiao, G. Xi, J.-Y. Miao and B.-X. Zhao, J. Mater. Chem.B, 2014, 2, 7344–7350.
24 Y. Qian, J. Lin, L. Han, L. Lin and H. A. Zhu, Biosens.Bioelectron., 2014, 58, 282–286.
25 J. Wu, J. Pan, Z. Ye, L. Zeng and D. Su, Sens. Actuators, B,2018, 274, 274–284.
26 H.Wu, Y. Wang, W.-N. Wu, Z.-Q. Xu, Z.-H. Xu, X.-L. Zhao andY.-C. Fan, Spectrochim. Acta, Part A, 2019, 222, 117272.
27 X. Kong, M. Li, Y. Zhang, Y. Yin and W. Lin, Sens. Actuators,B, 2021, 329, 129232.
28 L. Wang, F.-Y. Liu, H.-Y. Liu, Y.-S. Dong, T.-Q. Liu, J.-F. Liu,Y.-W. Yao and X.-J. Wan, Sens. Actuators, B, 2016, 229, 441–452.
29 J. Zhang, L. Ning, J. Liu, J. Wang, B. Yu, X. Liu, X. Yao,Z. Zhang and H. Zhang, Anal. Chem., 2015, 87, 9101–9107.
30 L. Wang, Q. Pan, Y. Chen, Y. Ou, H. Li and B. Li, Spectrochim.Acta, Part A, 2020, 241, 118672.
31 N. Meher, S. Panda, S. Kumar and P. K. Iyer, Chem. Sci., 2018,9, 3978–3985.
32 Y. Song, G. Chen, X. Han, J. You and F. Yu, Sens. Actuators, B,2019, 286, 69–76.
33 S. Paul, R. Nandi, K. Ghoshal, M. Bhattacharyya andD. Maiti, New J. Chem., 2019, 43, 3303–3308.
34 Y. Hong, J. W. Y. Lam and B. Z. Tang, Chem. Soc. Rev., 2011,40, 5361–5388.
35 J. Mei, N. L. C. Leung, R. T. K. Kwok, J. W. Y. Lam andB. Z. Tang, Chem. Rev., 2015, 115, 11718–11940.
36 S. Chen, H. Wang, Y. Hong and B. Z. Tang, Mater. Horiz.,2016, 3, 283–293.
37 Z. Zhao, P. Lu, J. W. Y. Lam, Z. Wang, C. Y. K. Chan,H. H. Y. Sung, I. D. Williams, Y. Ma and B. Z. Tang, Chem.Sci., 2011, 2, 672–675.
38 D. D. La, S. V. Bhosale, L. A. Jones and S. V. Bhosale, ACSAppl. Mater. Interfaces, 2018, 10, 12189–12216.
39 D. Ding, K. Li, B. Liu and B. Z. Tang, Acc. Chem. Res., 2013,46, 2441–2453.
40 G. R. Suman, M. Pandey and A. S. J. Chakravarthy, Mater.Chem. Front., 2021, 5, 1541–1584.
41 R. Zhang, Y. Duan and B. Liu, Nanoscale, 2019, 11, 19241–19250.
42 J. Huo, H. Wang, S. Li, H. Shi, Y. Tang and B. Z. Tang, Chem.Rec., 2019, 19, 1–15.
43 M. Wang, G. Zhang, D. Zhang, D. Zhu and B. Z. Tang, J.Mater. Chem., 2010, 20, 1858–1867.
44 A. Chatterjee, D. G. Khandare, P. Saini, A. Chattopadhyay,M. S. Majik andM. Banerjee, RSC Adv., 2015, 5, 31479–31484.
45 G.-W. Wang, Chem. Soc. Rev., 2013, 42, 7668–7700.46 F. Gomollon-Bel, Chem. Int., 2019, 41, 12–17.47 S. D. Hiremath, K. K. Maiti, N. N. Ghosh, M. Banerjee and
A. Chatterjee, ACS Appl. Nano Mater., 2020, 3, 3071–3079.48 R. U. Gawas, S. Anand, B. K. Ghosh, P. Shivbhagwan,
K. Choudhary, N. N. Ghosh, M. Banerjee and A. Chatterjee,ChemistrySelect, 2018, 3, 10585–10592.
49 S. D. Hiremath, R. U. Gawas, S. Mascarenhas, A. Ganguly,M. Banerjee and A. Chatterjee, New J. Chem., 2019, 43,5219–5227.
50 A. Chatterjee, M. Banerjee, D. G. Khandare, R. U. Gawas,S. C. Mascarenhas, A. Ganguly, R. Gupta and H. Joshi,Anal. Chem., 2017, 89, 12698–12704.
51 A. A. Bhosle, S. D. Hiremath, A. C. Bhasikuttan, M. Banerjeeand A. Chatterjee, J. Photochem. Photobiol., A, 2021, 413,113265.
52 R. G. Parr andW. Yang, Density functional theory of atoms andmolecules, Oxford Univ. Press, New York, 1989.
53 C. Jamorski, M. E. Casida and D. R. Salahub, J. Phys. Chem.,1996, 104, 5134–5147.
54 A. D. Becke, J. Phys. Chem., 1993, 98, 1372–1377.55 C. Lee, W. Yang and R. G. Parr, Phys. Rev., 1988, 37, 785–789.56 A. P. French, S. Mills, R. Swarup, M. J. Bennett and
T. P. Pridmore, Nat. Protoc., 2008, 3, 619–628.57 X. Cheng, R. Zhang, X. Cai and B. Liu, J. Mater. Chem. B,
2017, 5, 3565–3571.
21278 | RSC Adv., 2021, 11, 21269–21278
58 R. Zhang, C.-J. Zhang, Z. Song, J. Liang, R. T. K. Kwok,B. Z. Tang and B. Liu, J. Mater. Chem. C, 2016, 4, 2834–2842.
59 M. J. Jung, S. J. Kim and M. H. Lee, ACS Omega, 2020, 5,28369–28374.
60 H. Rau, H. Durr and H. Bouas-Laurent, Azo Compounds,Photochromism, Elsevier Science, 2003, ch. 4, pp. 165–192.
61 X. Shi, F. Huo, J. Chao, Y. Zhang and C. Yin, New J. Chem.,2019, 43, 10025–10029.
62 S. Mu, H. Gao, C. Li, S. Li, Y. Wang, Y. Zhang, C. Ma,H. Zhang and X. Liu, Talanta, 2021, 221(1–8), 121606.
63 R. Englman and J. Jortner, Mol. Phys., 1970, 18, 145–164.64 I. Hussain, K. U. Ahamad and P. Nath, Anal. Chem., 2017, 89,


![Synthesis and anion binding properties of phthalimide ... · form anion-π complexes [32-47]. We report herein the synthe-sis, structure and anion recognition of phthalimide-containing](https://static.documents.pub/doc/80x56/60232bfdbbeb1f570a496ab6/synthesis-and-anion-binding-properties-of-phthalimide-form-anion-complexes.jpg)


