PHYLOGENETIC ANALYSES AND THE REPETITIVE PATTERNS OF TOMISTOMA SCHLEGELII BASED ON MITOCHONDRIA DNA GENE REGIONS By TARANJEET KAUR A thesis submitted to the Faculty of Engineering and Science, Universiti Tunku Abdul Rahman, in partial fulfillment of the requirements for the degree of Master of Science September 2010
Transcript
PHYLOGENETIC ANALYSES AND THE REPETITIVE PATTERNS OF TOMISTOMA SCHLEGELII BASED ON MITOCHONDRIA DNA
GENE REGIONS
By
TARANJEET KAUR
A thesis submitted to the Faculty of Engineering and Science, Universiti Tunku Abdul Rahman,
in partial fulfillment of the requirements for the degree of Master of Science September 2010
���
� ���
ABSTRACT
PHYLOGENETIC ANALYSES AND THE REPETITIVE PATTERNS OF TOMISTOMA SCHLEGELII BASED ON MITOCHONDRIA DNA
GENE REGIONS
Taranjeet Kaur The endangered Tomistoma schlegelii, a freshwater crocodilian endemic to
Malaysia and Indonesia, is currently affected with severe habitat loss as their
numbers in the wild have been decreasing. Phylogenetic inferences for this
species which was carried out using newly designed primers for the protein
coding ND 6 – tRNAglu – cyt b and the tRNA Thr – control region revealed
five haplotypes each. The repetitive regions in the mitochondria DNA
(mtDNA) control region (CR) not previously described were also amplified
and sequenced. A high overall haplotype diversity of 0.78 was reported with
evidence of population structure separating East Kalimantan, Sarawak,
Peninsular Malaysia and Sumatra. Except for the H2 haplotype that occurred
in both Peninsular Malaysia and Sarawak, haplotypes were generally
geographically distinct. These findings allowed individuals of unknown
origins in our data to be assigned into their respective geographical origins.
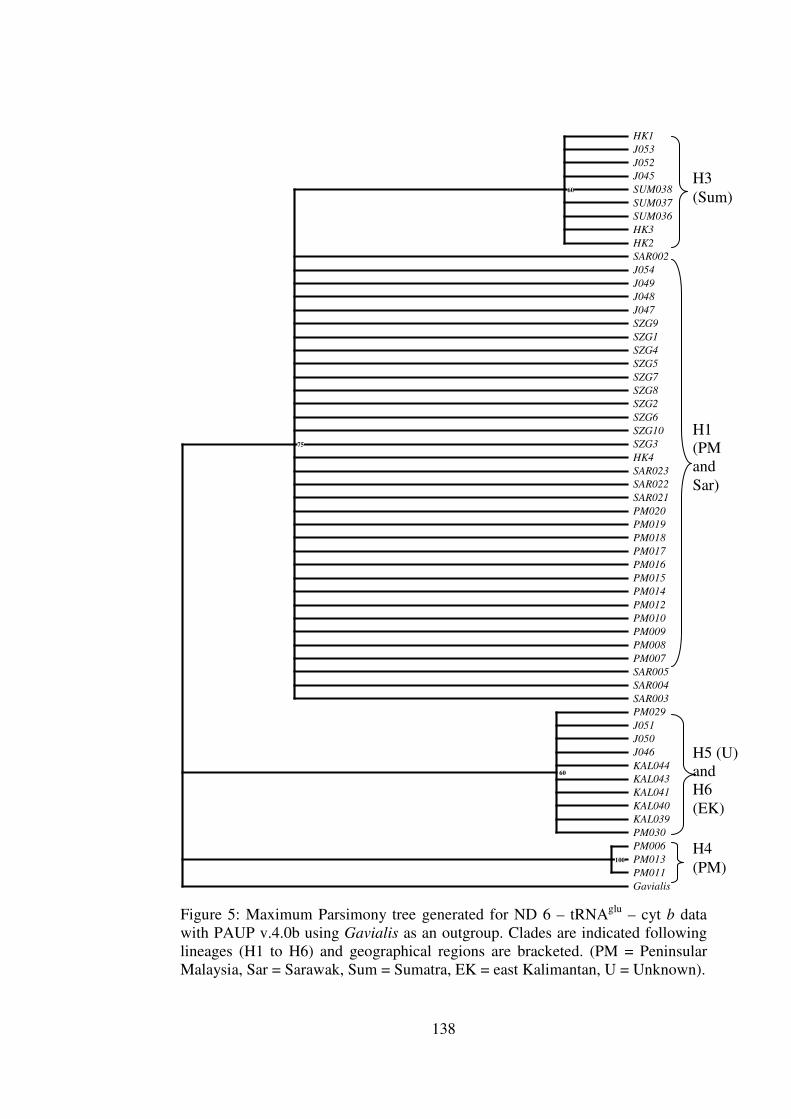
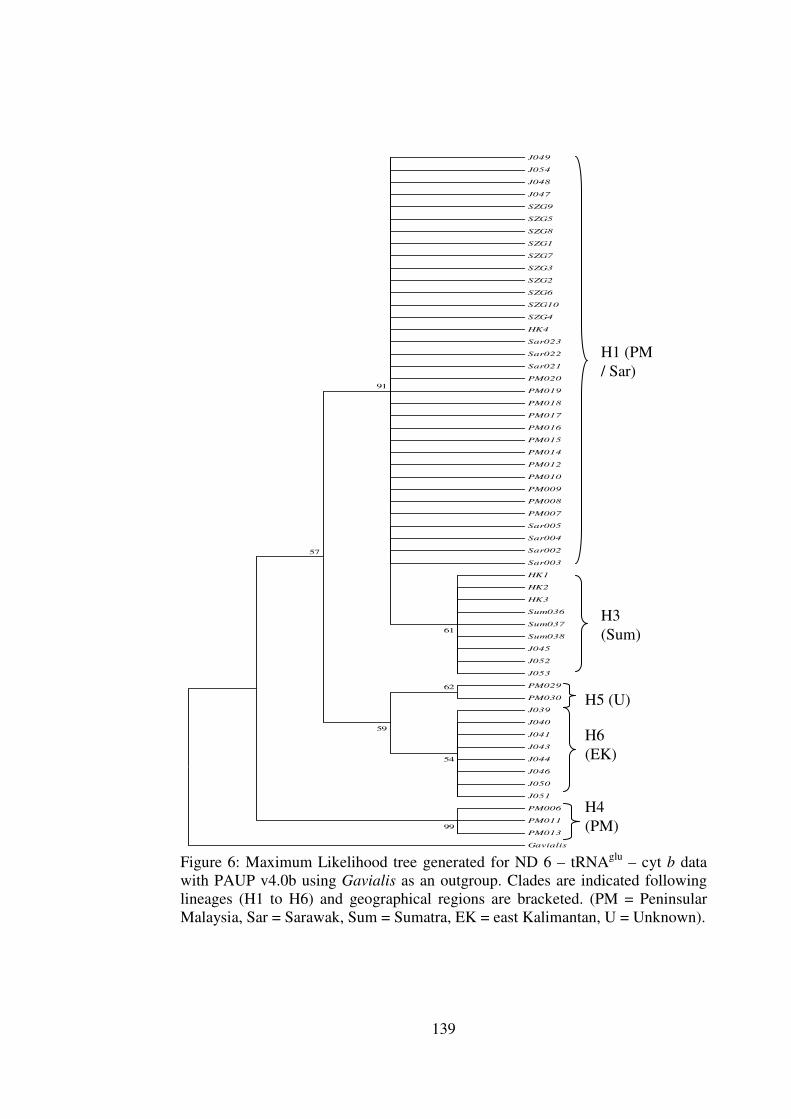
Haplotype H4, occurring in Peninsular Malaysia, had the highest genetic
distance and always formed a basal and reciprocally monophyletic clade in all
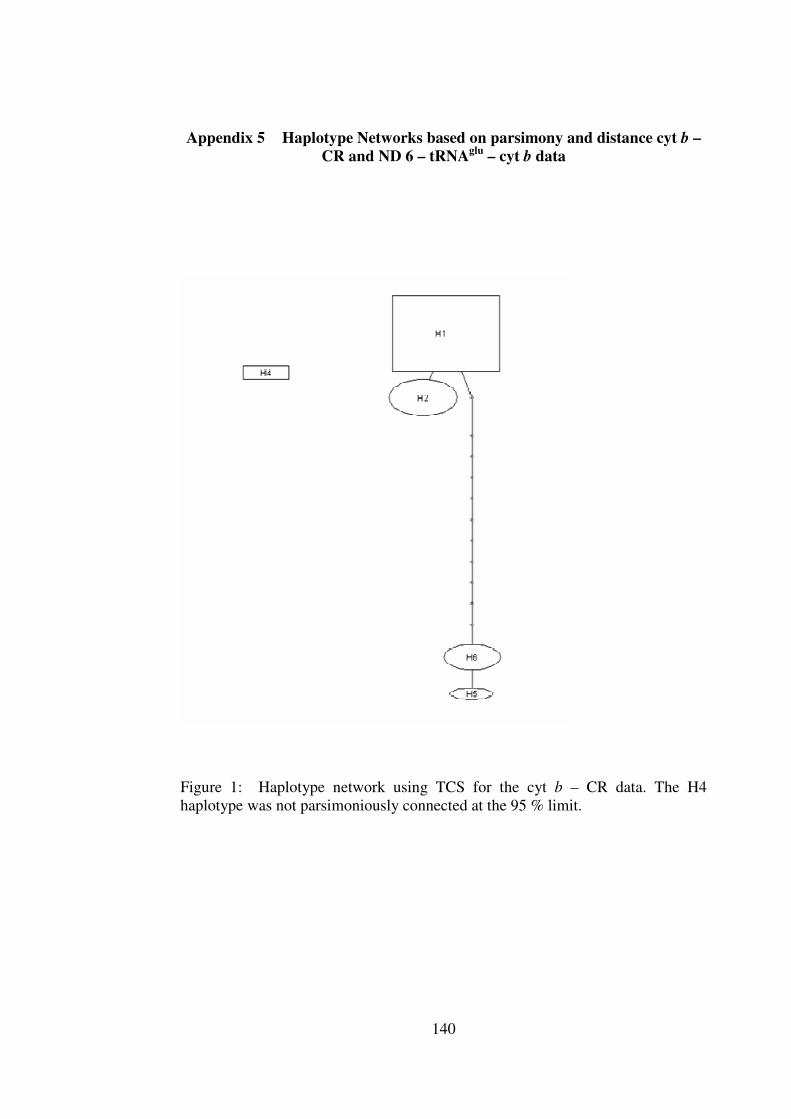
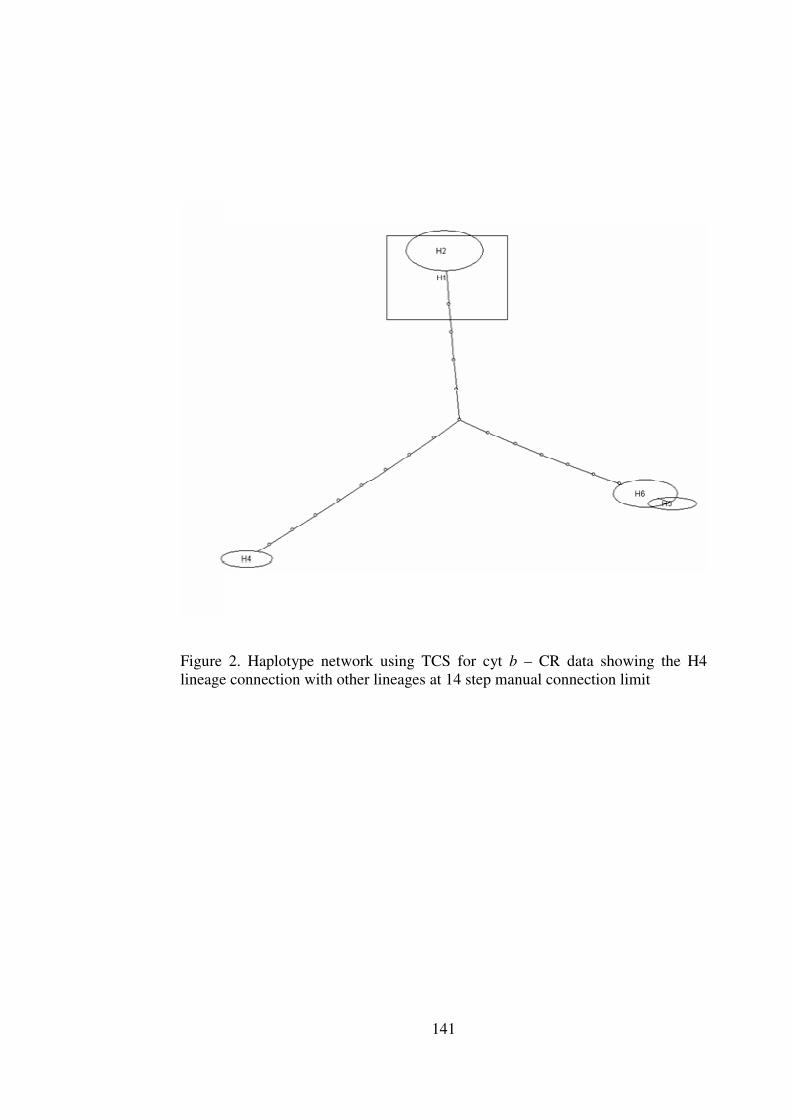
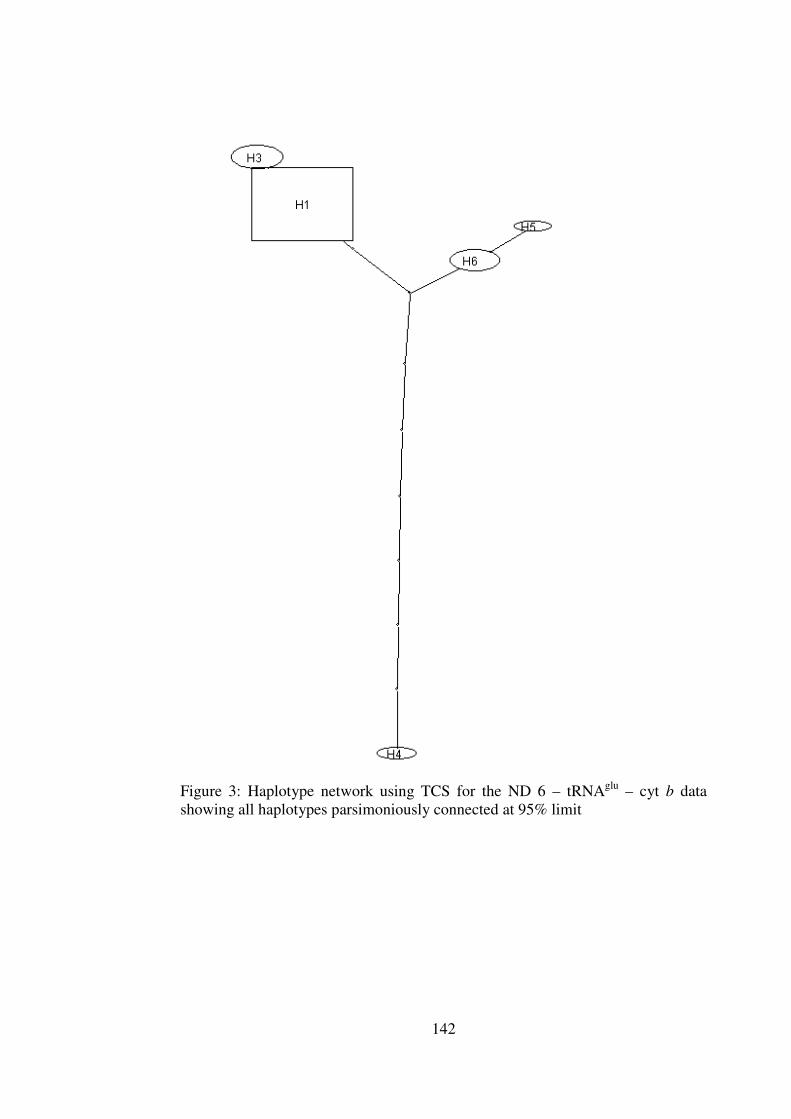
the NJ, MP and ML trees. This lineage was not connected at the 95%
connection limit in the parsimony haplotype network while for the minimum
spanning network was placed on a separate evolutionary branch. These
analyses suggest that H4 is a highly divergent lineage. Length variation
ranging from 50 to 600 bp with intervals of ~ 50 and ~ 100bp were detected in
� ����
the mtDNA repetitive region among individuals and only one individual
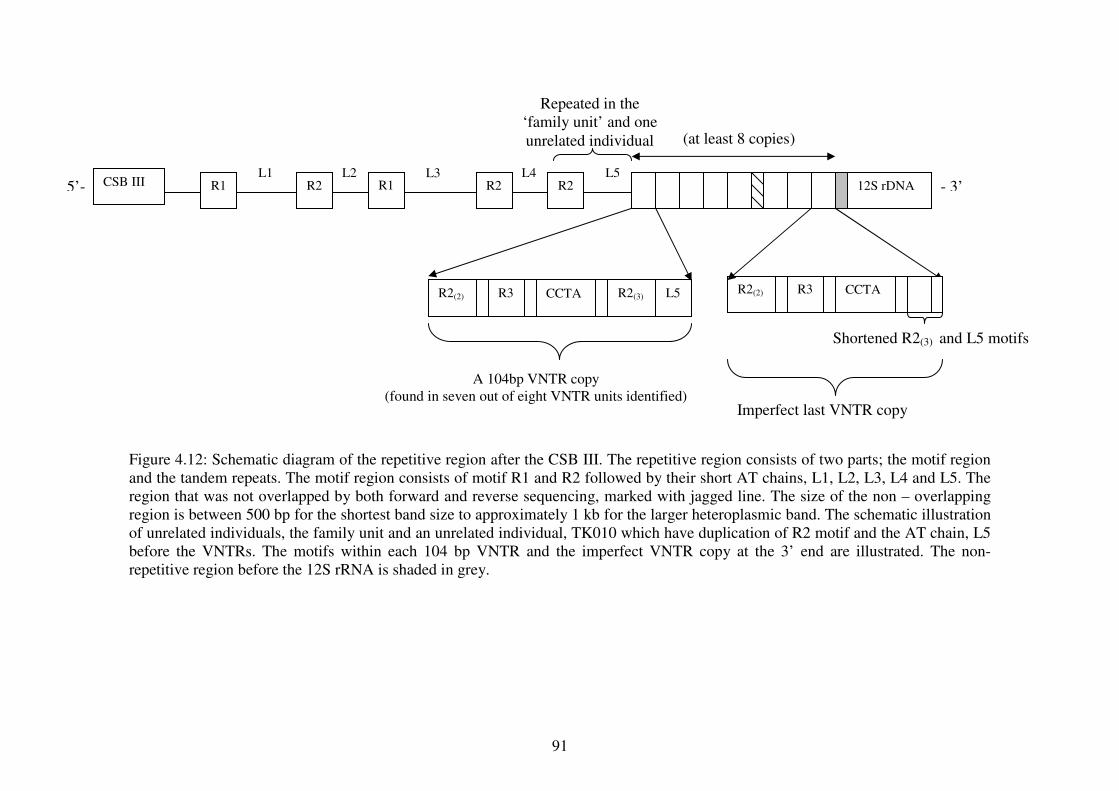
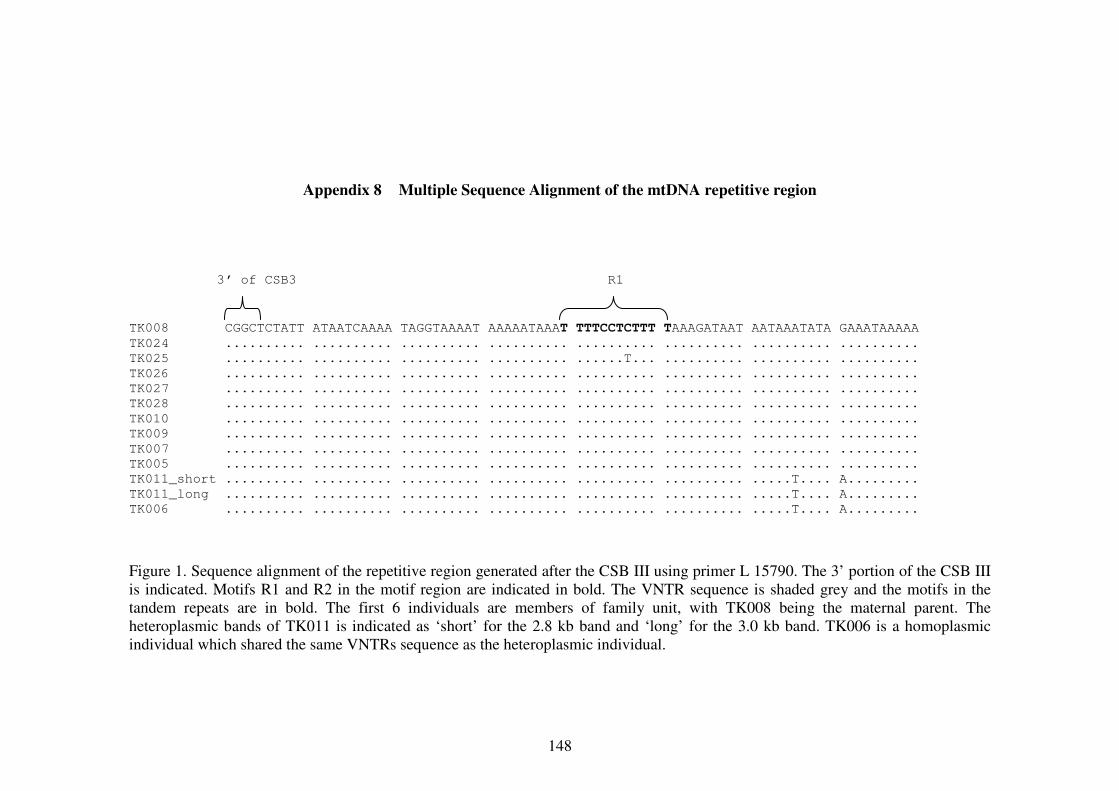
showed a heteroplasmic band. Sequencing the region after CSB III revealed a
motif region and a variable number of tandem repeats (VNTRs) region which
were stably inherited from the maternal parent to all offspring. A VNTR core
unit of 104 bp is implicated for the cause of the length variation seen among
individuals of Tomistoma and the repetitive patterns resembled those specific
to other crocodilians.
��
� ���
ACKNOWLEDGEMENT
I owe my deepest gratitude to my supervisor, Associate Prof. Dr. Alan Ong
Han Kiat, whose patience, guidance and support throughout my dissertation
enable me to work at my own pace and develop an understanding for this
subject.
This study would not have been possible without the participation of the
Department of Wildlife and National Parks, Peninsular Malaysia (Perhilitan),
Forest Department of Sarawak and Sarawak Forestry Corporation (SFC) and
Lembaga Ilmu Pengetahuan Indonesia (LIPI) as counterparts. I would like to
thank the Director Generals, Dato. Abdul Rasid Samsudin of Perhilitan, Dato
Haji Len Talif Salleh of the Forest Department of Sarawak and Sarawak
Forestry Corporation (SFC), and Ir. Ahmad J. Arief for permits and permission
to carry out this work. I extend my appreciation to the officers of these
government bodies Dr. Sandie Choong, Dr. Abraham Matthews and Mr. Rauf
Kadir (Perhilitan), Mr. Shahbudin Sabki (Forest Department Sarawak) and Mr.
Engkamat Lading (SFC), Dr. Irvan Sidek (LIPI) and all their staffs involved in
assisting with the samples collection. I am also grateful to Zoo Negara,
Melaka Zoo, Taiping Zoo, Temerloh Mini Zoo and the crocodile farms in
Kuching and Miri, Sarawak and their personnel for assisting in sample
collections.
I would also like to thank Universiti Tunku Abdul Rahman (UTAR), S.O.S
Rhino, Sabah, Malaysia, Zoological Society for the Conservation of Species
and Population (Zoologische Gesellschaft für Arten – und Populationsschutz,
ZGAP) and BOH Plantations Sdn. Bhd for supporting this study financially.
� �
APPROVAL SHEET
This dissertation/thesis entitled “PHYLOGENETIC ANALYSES AND THE
REPETITIVE PATTERNS OF TOMISTOMA SCHLEGELII BASED ON
MITOCHONDRIA DNA GENE REGIONS” was prepared by
TARANJEET KAUR and submitted as partial fulfillment of the requirements
for the degree of Master of Science at Universiti Tunku Abdul Rahman.
Approved by: ___________________________ (Associate Prof. Dr. Alan Ong Han Kiat) Date:………………….. Supervisor Department of Preclinical Sciences Faculty of Medicine and Health Sciences Universiti Tunku Abdul Rahman
���������������
vi
FACULTY OF ENGINEERING AND SCIENCE UNIVERSITI TUNKU ABDUL RAHMAN
Date: __________________
PERMISSION SHEET
It is hereby certified that TARANJEET KAUR (ID No: 06UEM07737) have
completed this thesis entitled “PHYLOGENETIC ANALYSES AND THE
REPETITIVE PATTERNS OF TOMISTOMA SCHLEGELII BASED ON
MITOCHONDRIA DNA GENE REGIONS” under the supervision of
Associate Prof. Dr. Alan Ong Han Kiat from the Department of Preclinical
Sciences, Faculty of Medicine and Health Science.
I hereby give permission to the University to upload softcopy of my thesis in
pdf format into UTAR Institutional Repository, which will be made accessible
to UTAR community and public.
Yours truly,
___________________(TARANJEET KAUR)
� ����
DECLARATION
I hereby declare that the dissertation is based on my original work except for quotations and citations which have been duly acknowledged. I also declare that it has not been previously or concurrently submitted for any other degree at UTAR or other institutions.
Name ____________________________
Date _____________________________
� �����
TABLE OF CONTENTS Page ABSTRACT ii ACKNOWLEDGEMENTS iv APPROVAL SHEET v PERMISSION SHEET vi DECLARATION vii LIST OF TABLES xii LIST OF FIGURES xiii CHAPTER 1.0 INTRODUCTION 1 2.0 LITERATURE REVIEW 5
2.1 Tomistoma schlegelii 5 2.1.1 Description 5 2.1.2 Classification Based on Fossils, Morphology
and Molecular Data 8 2.1.3 Ecology and Habitat 10
2.1.3.1 Historical Distribution 10 2.1.3.2 Current Distribution 11
2.2 Mitochondria Genes 14 2.2.1 Mitochondria Genome 14 2.2.2 mtDNA as a Genetic Marker 15 2.2.3 mtDNA in Phylogenetic Studies 20
2.2.3.1 ND 6 – tRNAglu – cyt b marker 22 2.2.3.2 mtDNA Control Region 23
2.2.4 Structure of the Control Region in General and in Crocodilian 24
2.2.4.1 mtDNA VNTRs Utility 27 2.2.4.2 Replication models of the D – loop 29
2.3 Intraspecific Variation Analyses 30 2.3.1 Definition and Importance of Intraspecific
Analyses 30 2.3.2 Quantification of genetic diversity 35 2.3.3 Intraspecific genetic diversity of crocodilians 37
2.3.3.1 Species level divergence within the Dwarf Crocodile (Osteolaemus) 37
2.3.3.2 Low genetic diversity trends in the American Alligator (Alligator missisipiensis) and the
Nile Crocodile (Crocodylus niloticus�� 38 2.3.3.3 Population structure in the Black
Caiman (Melanosuchus niger) 39
� ���
2.3.3.4 Population structure and a divergent lineage of the Spectacled Caiman
(Caiman crocodilus) 40 2.3.3.5 Genetic diversity trends in cases
of hybridization between Crocodylus moreletii, C. acutus and C. rhombifer 41
3 MATERIALS AND METHODS 43 3.1 Sample Collection 43
3.4 Data Analysis for Intraspecific Variation 53 3.4.1 Sequence Identity and Alignment 53 3.4.2 Assembling Sequences of the Two Sets of
the Control Region Primers 53 3.4.3 Partition Homogeneity Test 54 3.4.4 Genetic Diversity 54
3.4.4.1 Polymorphic sites and Number of Haplotypes 54
3.4.4.2 Haplotype and Nucleotide Diverstiy 54 3.4.5 jModeltest 54 3.4.6 Genetic Divergence 55 3.4.7 Phylogenetic Trees 56
3.4.7.1 Neighbour Joining Trees 56 3.4.7.2 Maximum Parsimony Trees 56 3.4.7.3 Maximum Likelihood Trees 56
3.4.8 Haplotype Trees 57 3.4.8.1 Parsimony Based Haplotype
Networks 57 3.4.8.2 Distance Based Haplotype Networks 57
3.4.9 Gene Flow and Population Division 57 3.4.9.1 Nearest Neighbour Statistic (SNN) 57 3.4.9.2 Nucleotide based Pairwise FST 58
3.4.10 Neutrality Test 58 3.4.10.1 Fu and Li’s D 58 3.4.10.2 Fu’s FS 58 3.4.10.3 Ramos and Rozas’s R2 59
� ��
3.5 Data Analysis for mtDNA Repetitive Regions 59 3.5.1 Band Size Estimation 59 3.5.2 Sequence Alignment 59 3.5.3 Secondary Structure and Free Energy Estimation 59
4.0 RESULTS 60 4.1 Primer Development 60 4.2 Laboratory Analysis 63
4.2.1 DNA Extraction and DNA Quantification 63 4.2.2 PCR Optimisation and DNA Purification 63 4.2.3 DNA Purification and Sequencing 65
4.3 Data Analysis for Intraspecific Variation 65 4.3.1 Sequence Identity and Alignment 65 4.3.2 Partition Homogeneity Test 67 4.3.3 Genetic Diversity 67
4.3.3.1 Polymorphic sites and Number of Haplotypes 67
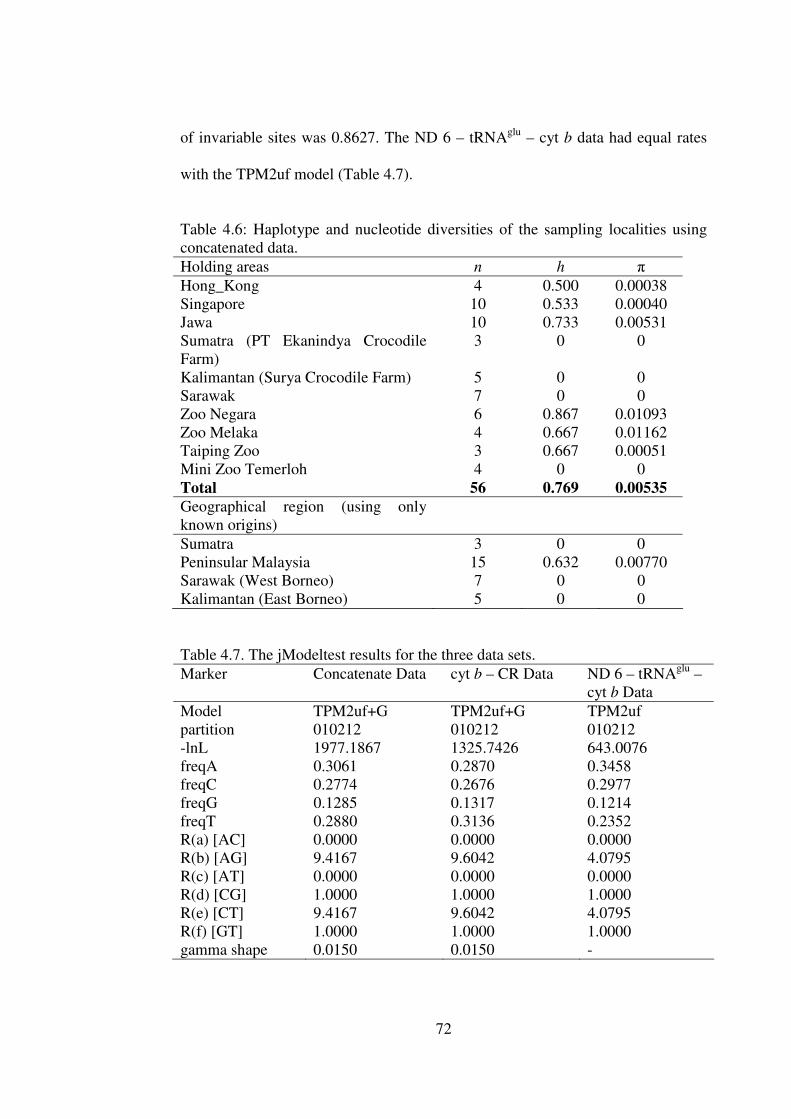
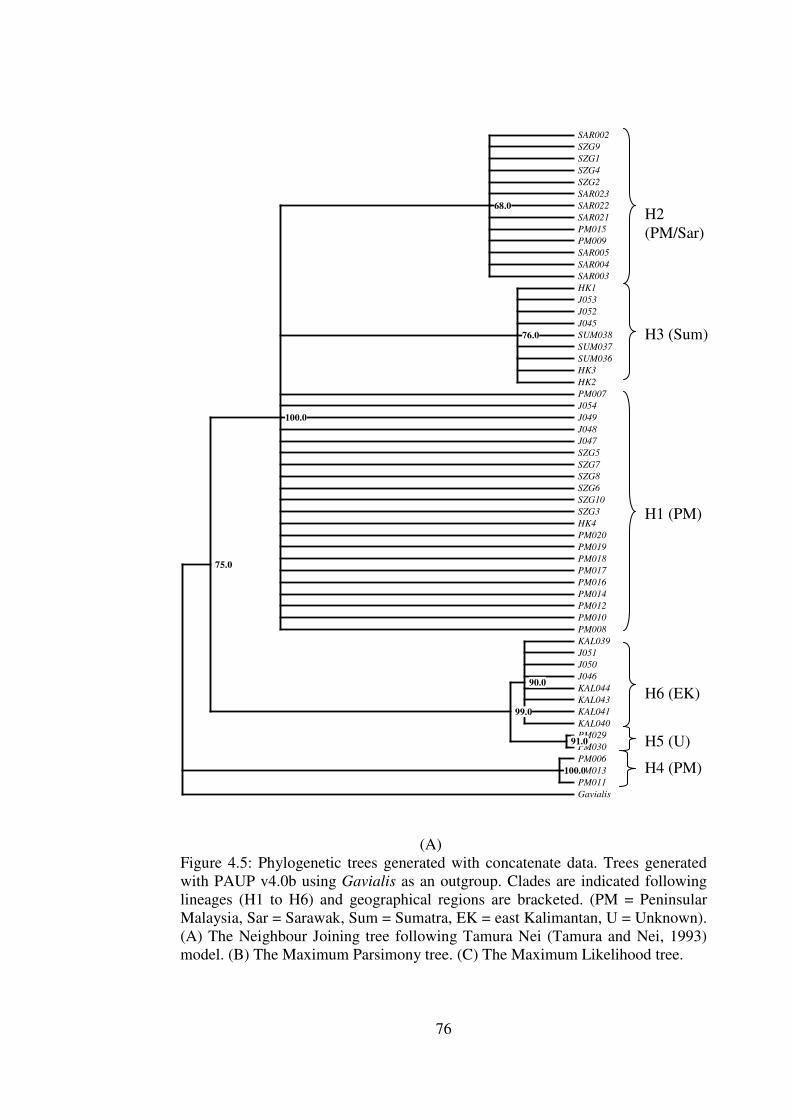
4.3.3.2 Haplotype and Nucleotide Diverstiy 69 4.3.4 jModeltest 71 4.3.5 Genetic Divergence 73 4.3.6 Phylogenetic Trees (NJ, MP and ML) 75 4.3.7 Haplotype Trees 79
4.3.7.1 Parsimony and Distance Based Haplotype Networks 79
4.3.8 Gene Flow and Population Division (SNN and Pairwise FST) 82
4.3.9 Neutrality Test 84 4.4 Data Analysis for mtDNA Repetitive Regions 85
4.4.1 PCR Optimisation, DNA Purification and Sequencing 85
4.4.2 Cloning and Restriction Enzyme Digestion 86 4.4.3 Sequence Identity and Alignment 87 4.4.4 General Structure 88
4.4.4.1 Motif Region 93 4.4.4.2 VNTRs Region 94
4.4.5 Secondary Structure and Free Energy Estimation 95
5.2.1 Genetic Diversity at species, population and captive holding locality 98
5.2.2 Geographical association of haplotypes 101 5.2.3 Population structure 103 5.2.4 Divergent lineage 104
5.3 mtDNA repetitive region 107 5.3.1 Homology and Variations with Crocodilian
Patterns and Repeats 109
� ���
5.3.2 Conservation of Crocodilian mtDNA Repetitive Region. 112
6.0 CONCLUSIONS 113 REFERENCES 115 APENDICES 129 Appendix 1 Ventral approach to the caudal vein 130 Appendix 2 Genbank accession number for the respective
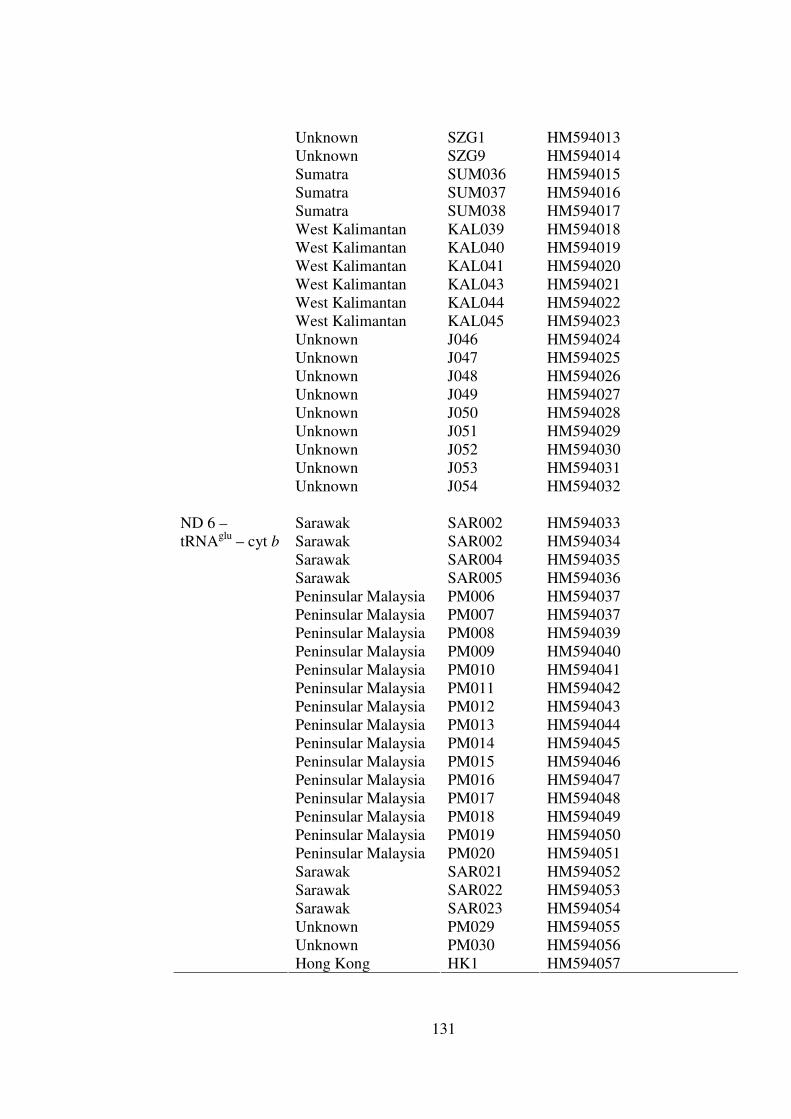
specimens for cyt b – CR and the ND 6 – tRNAglu – cyt b marker. 132
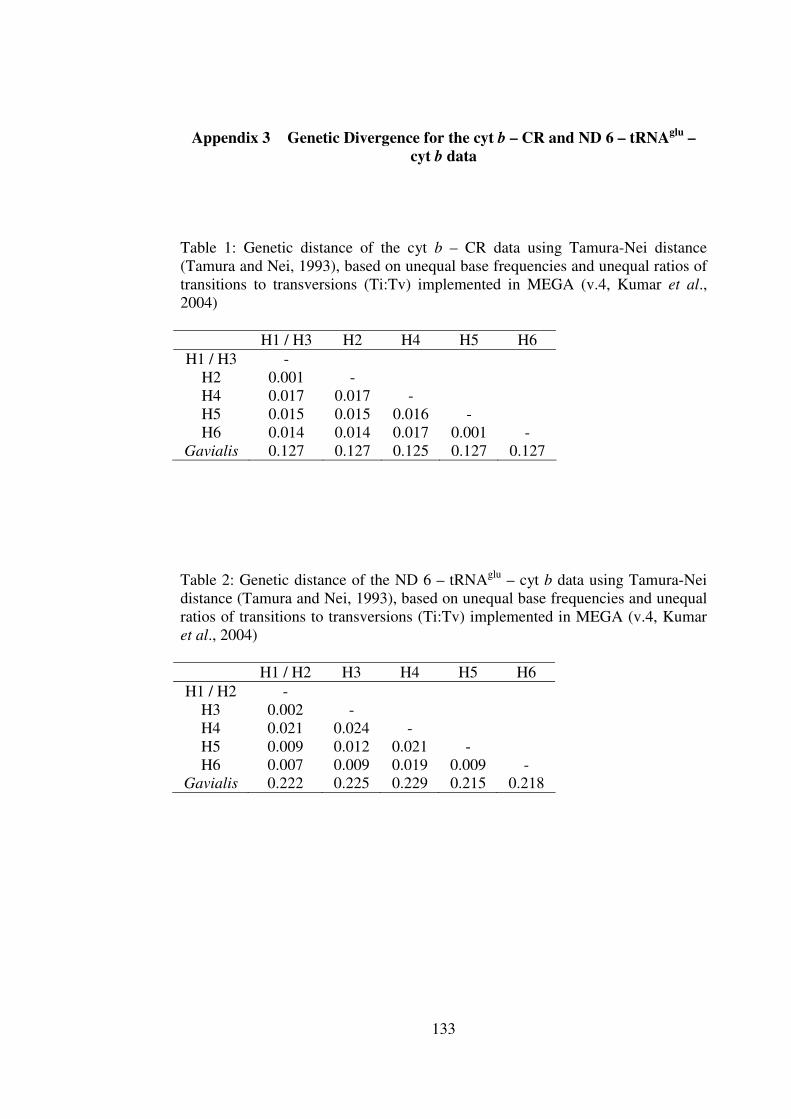
Appendix 3 Genetic Divergence for the cyt b – CR and ND 6 – tRNAglu – cyt b data 133
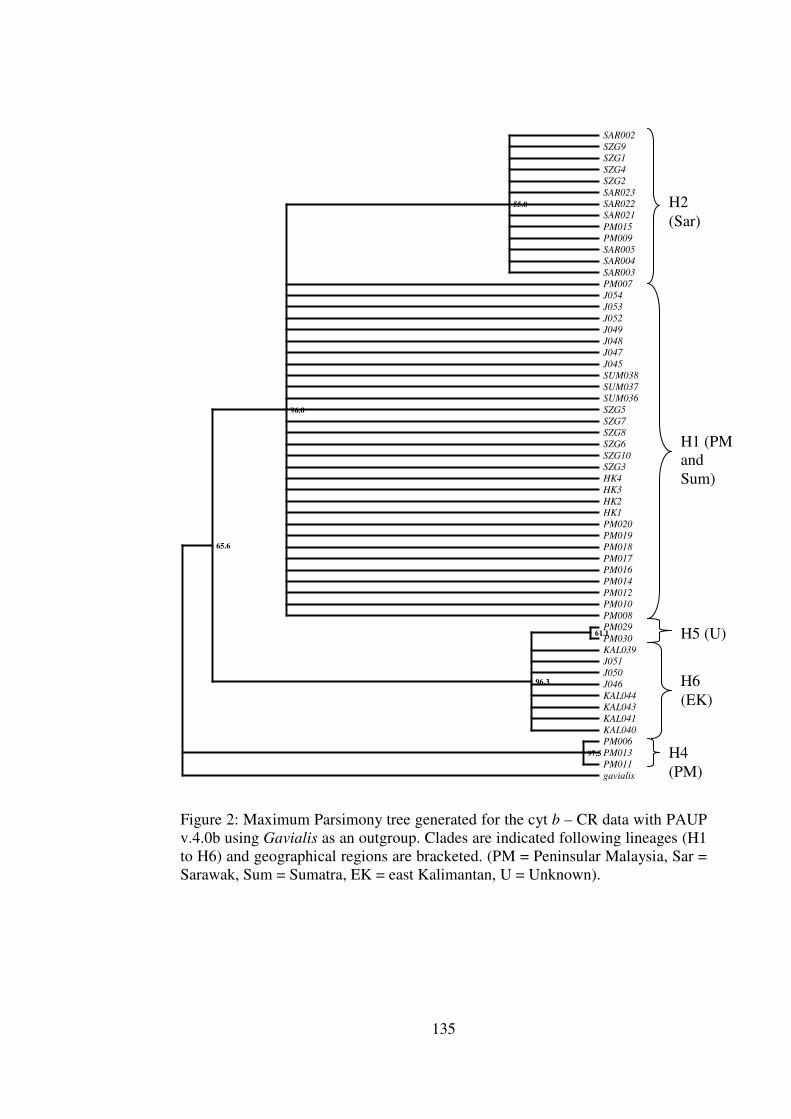
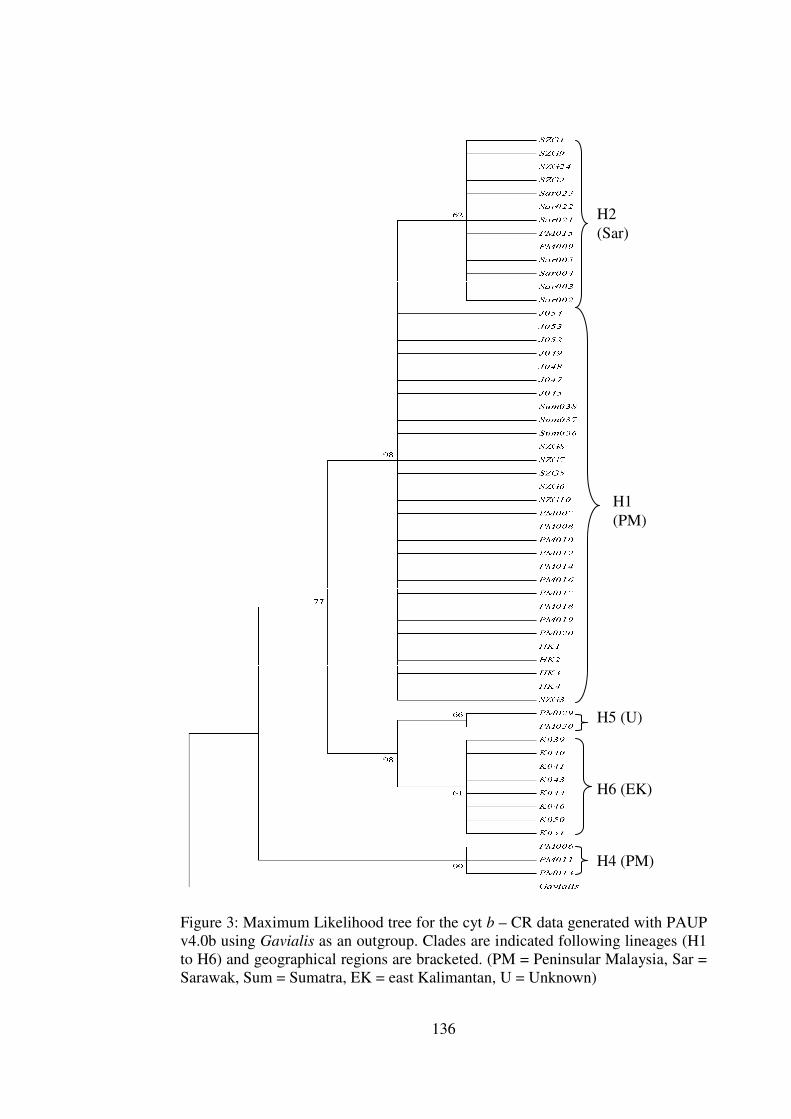
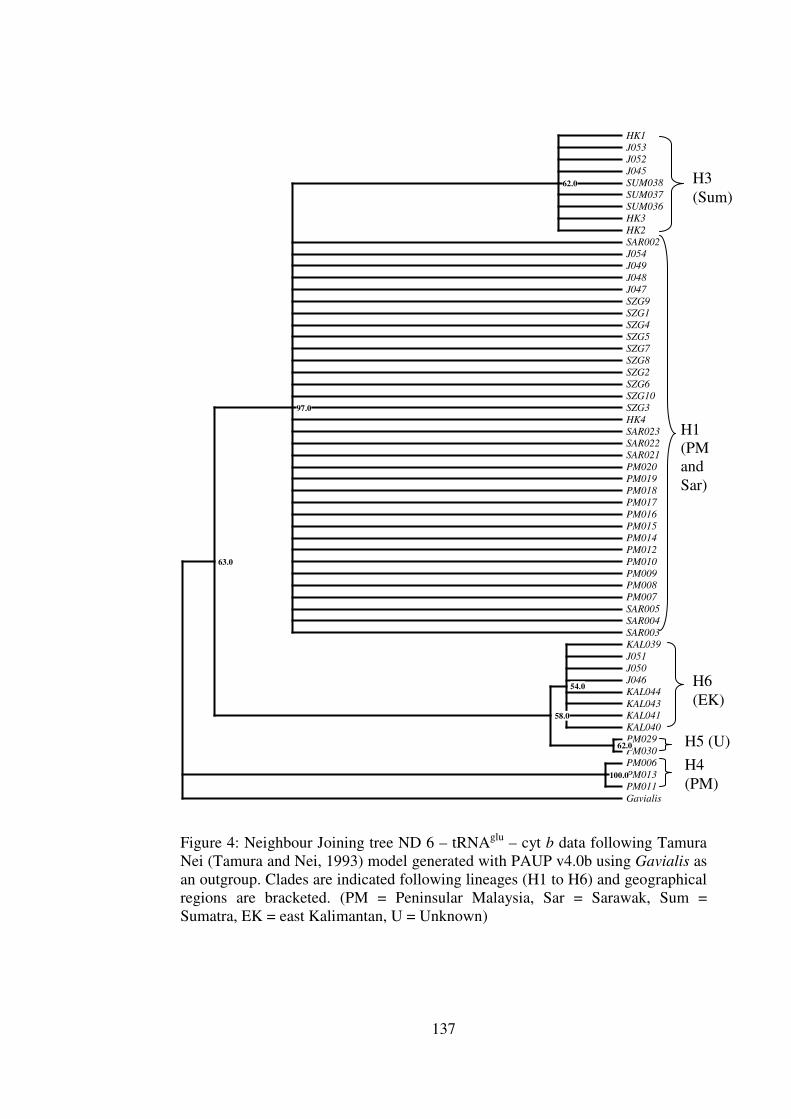
Appendix 4 Phylogenetic Trees for the cyt b – CR and ND 6 – tRNAglu – cyt b data 134
Appendix 5 Haplotype Networks based on parsimony and distance cyt b – CR and ND 6 – tRNAglu – cyt b data 140
Appendix 6 Population subdivision and gene flow analysis for the cyt b – CR and ND 6 – tRNAglu – cyt b data 145
Appendix 7 Neutrality Test for the cyt b – CR and ND 6 – tRNAglu – cyt b data 147
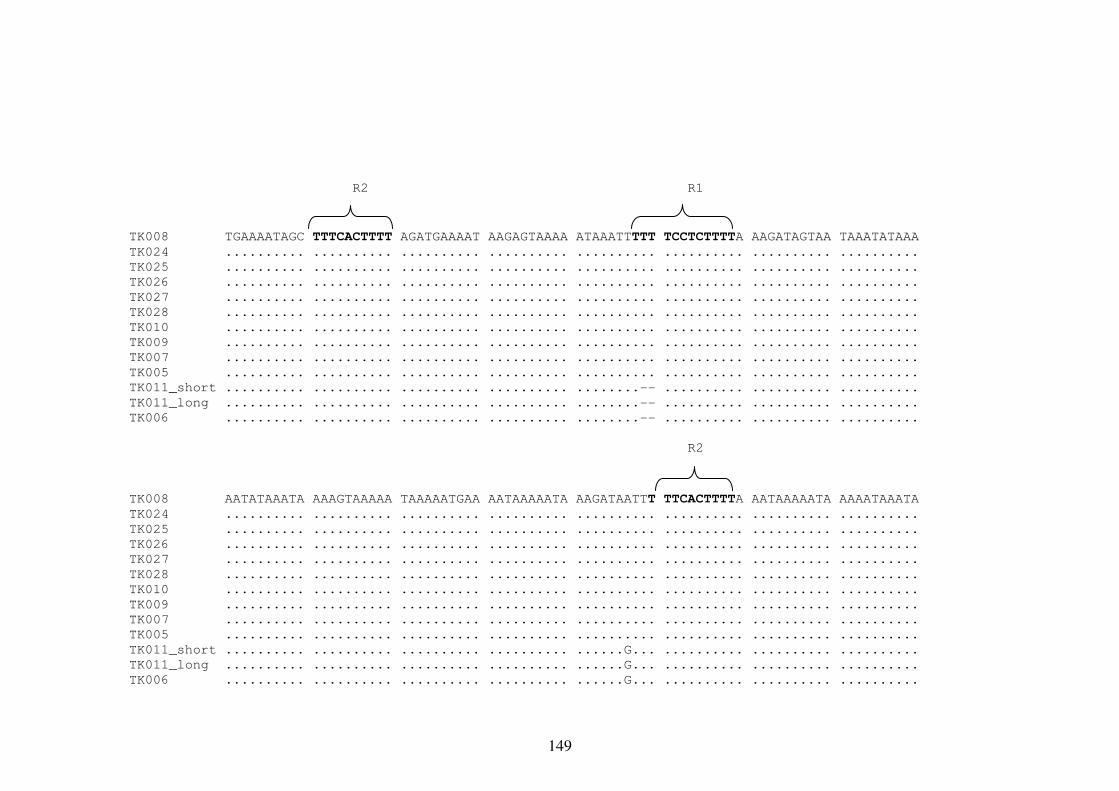
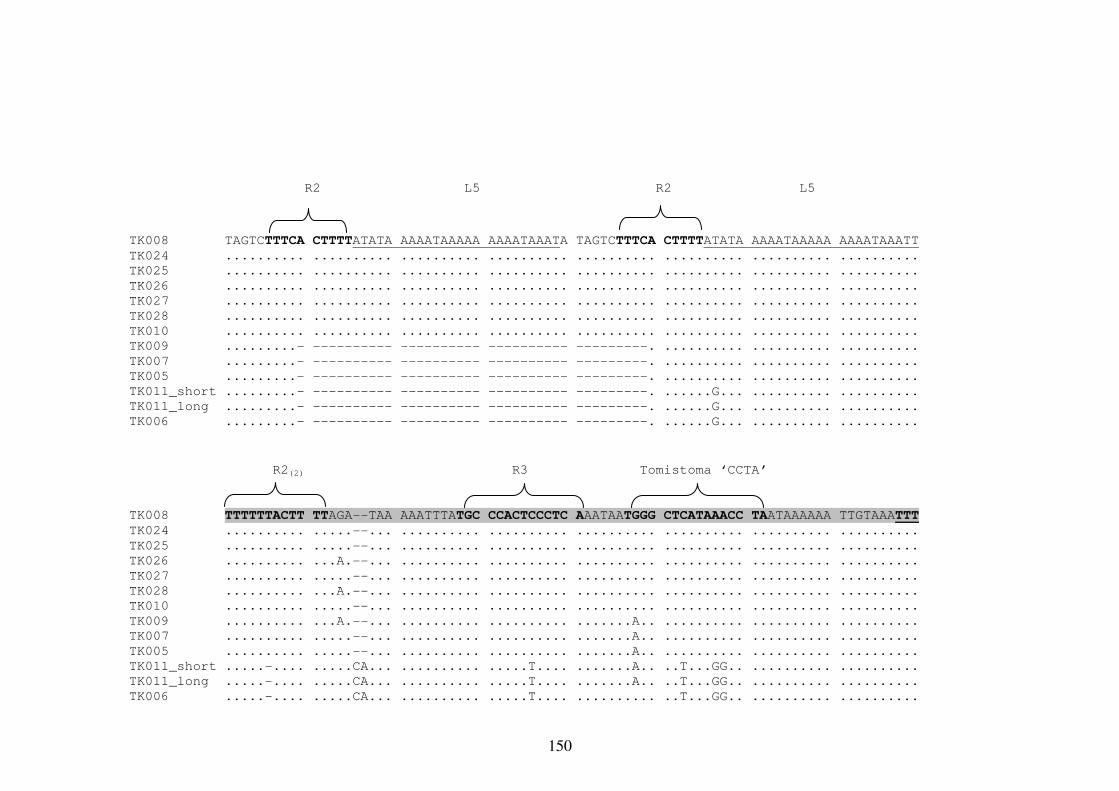
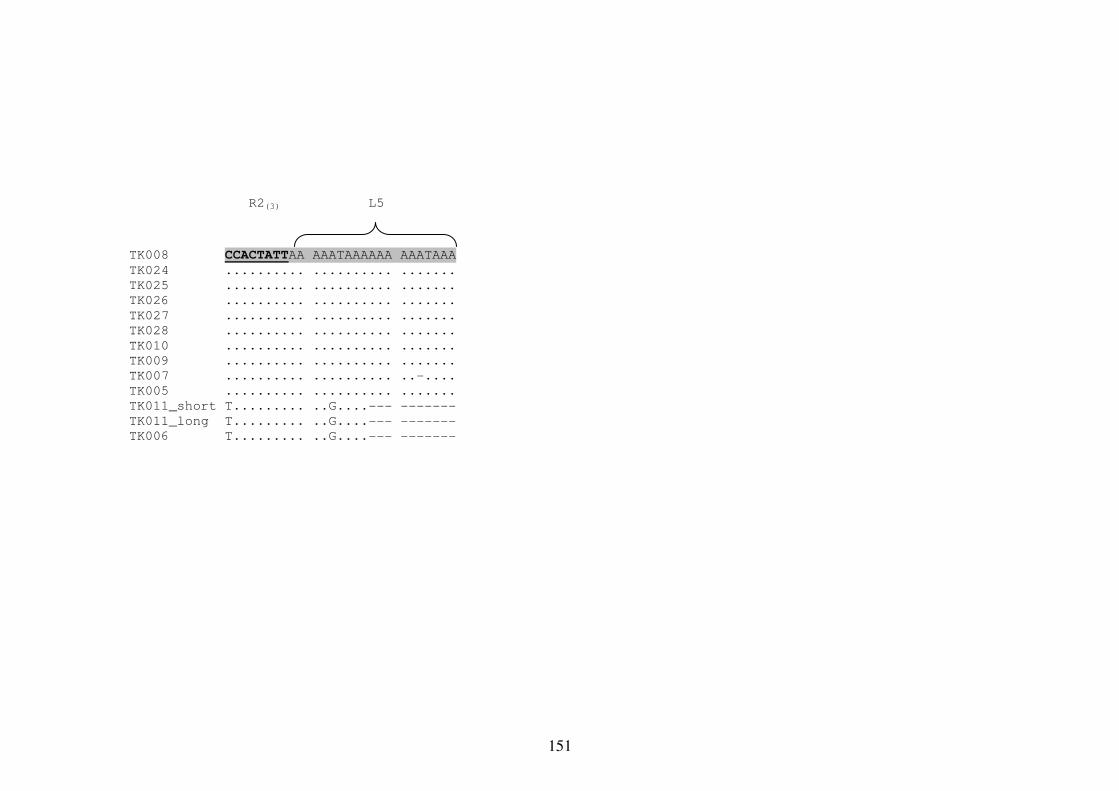
Appendix 8 Multiple Sequence Alignment of the mtDNA Repetitive Region 148
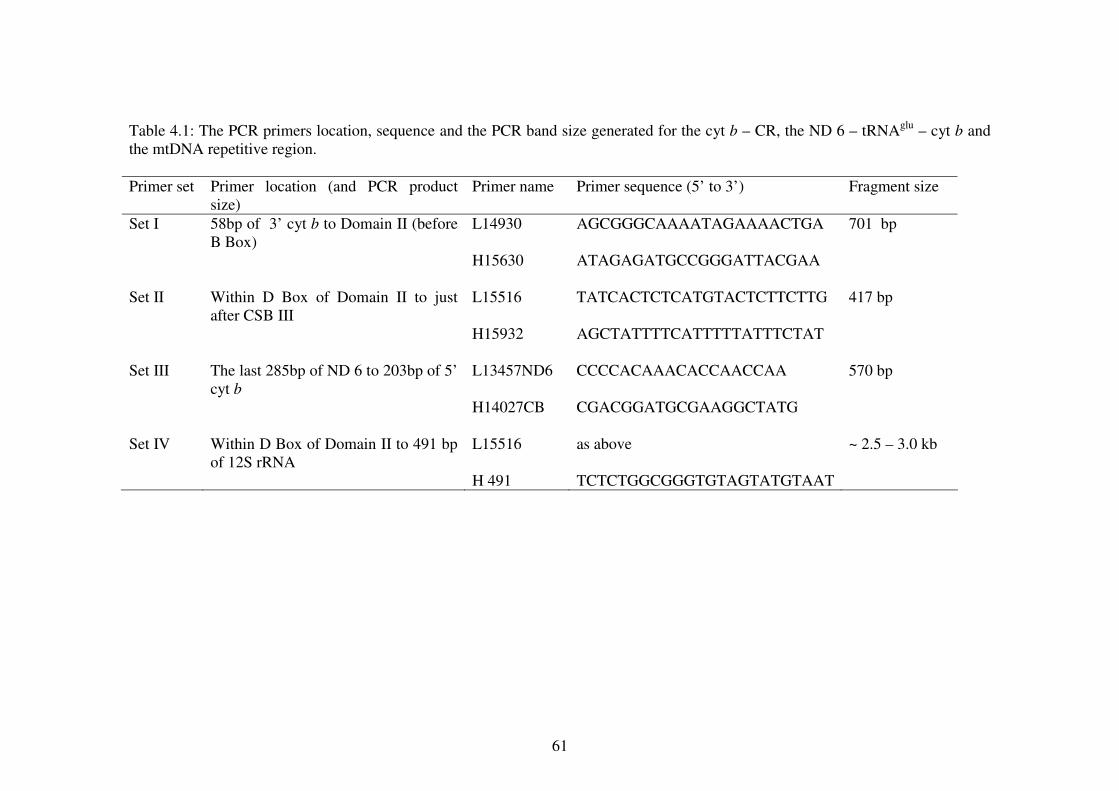
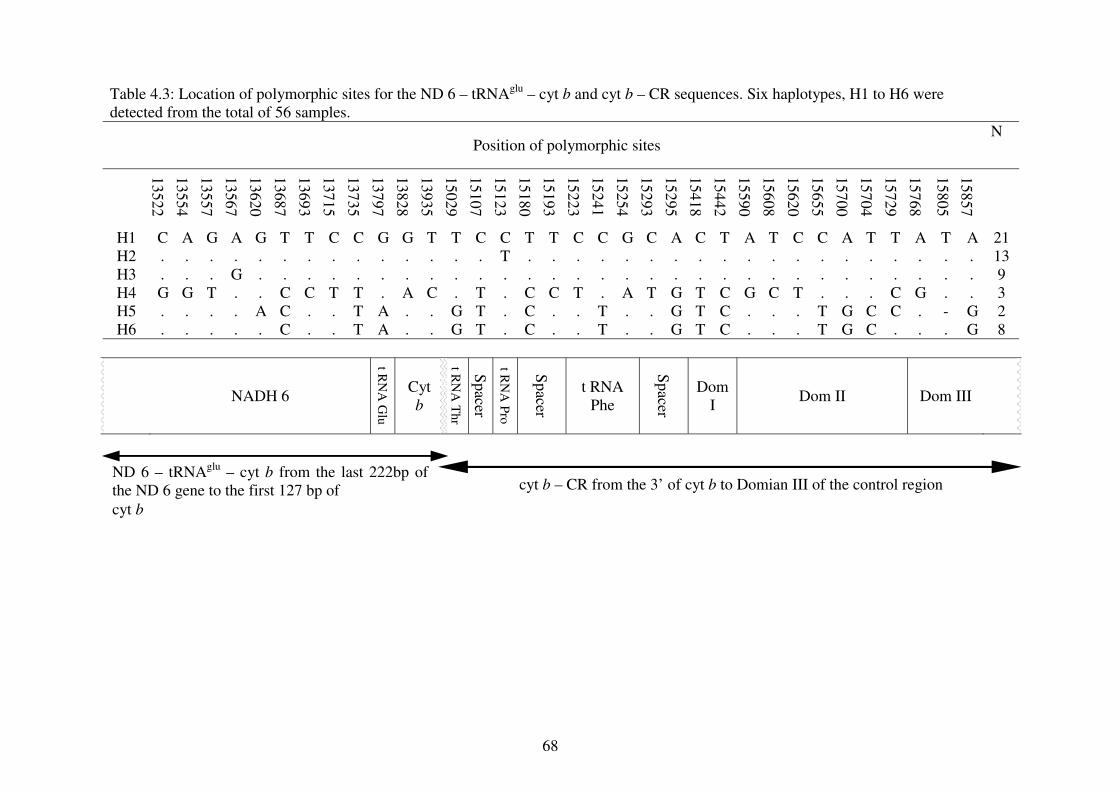
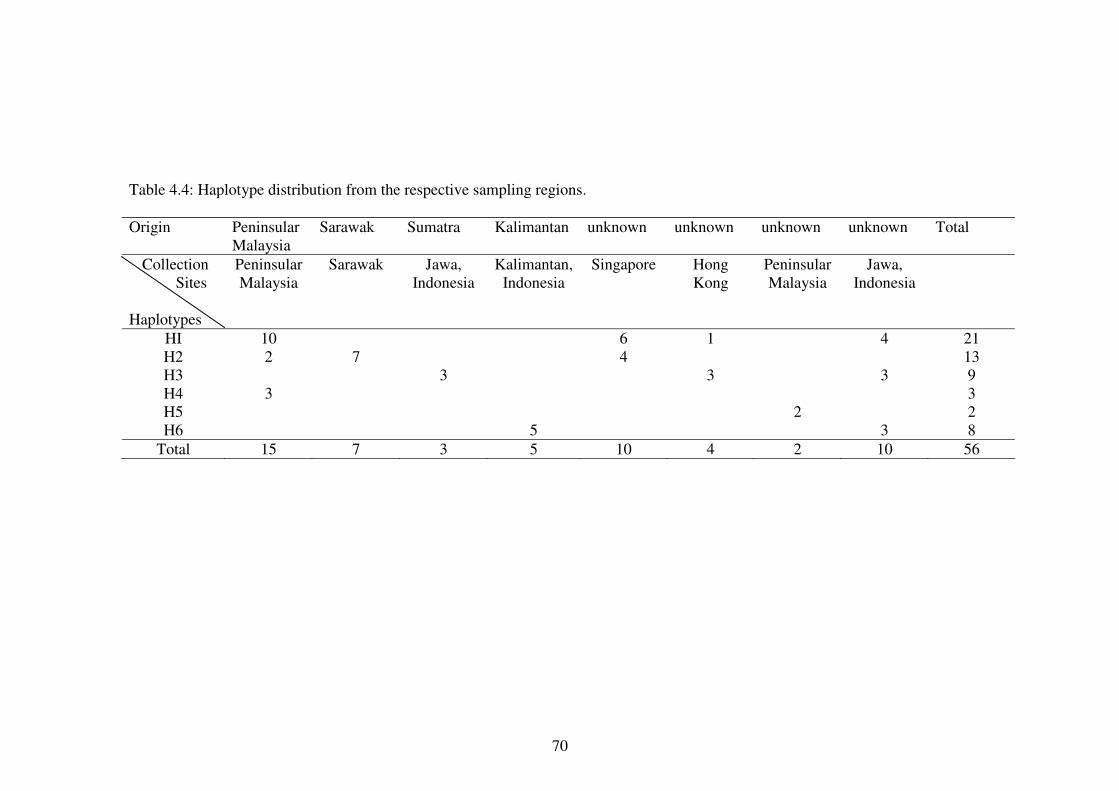
The blood collection localities and geographical origins for all Tomistoma samples List of optimum PCR parameters according to the primers sets. The PCR primers location, sequence and the PCR band size generated for the cyt b – CR, the ND 6 – tRNAglu – cyt b and the mtDNA repetitive region. Internal primers used for sequencing of both homoplasmic and heteroplasmic bands. Location of polymorphic sites for the ND 6 – tRNAglu – cyt b and cyt b – CR sequences. Haplotype distribution from the respective sampling regions. List of haplotype (h) and nucleotide (�) diversities of the two mtDNA markers and concatenate data. Haplotype and nucleotide diversities of the sampling localities using concatenated data. The jModeltest results for the three data sets. Genetic distance of the concatenate data using Tamura-Nei distance. Genetic distance in percentage using Tajima Nei, Kimura 2 Parameter, the uncorrected pairwise distance and the HKY model. Population structure estimates using concatenate data. Gene flow estimates using concatenate data. Neutrality test using concatenate data and samples of known origins only. Band sizes of PCR products from Figure 4.11 (A) and (B).
44 50 61 62 68 70 71 72 72 73 74 83 84 85 90
xiii
LIST OF FIGURES
Figure Page
2.1
2.2
2.3
2.4
2.5
2.6
2.7
3.1
4.1
4.2
4.3
4.4
4.5
4.6
4.7
4.8
4.9
4.10
The slender snout of Tomistoma.
Hatchlings of Tomistoma.
The sharp teeth of an adult male Tomistoma.
Distribution of Tomistoma schlegelii.
Schematic diagram of mtDNA WANCY and HSL region
Schematic diagram of mtDNA tRNA – Phe gene
General structure of the crocodilian mtDNA control region.
Location of the blood sampling sites.
Locations of the PCR and internal primers for the mtDNA non – coding repetitive region
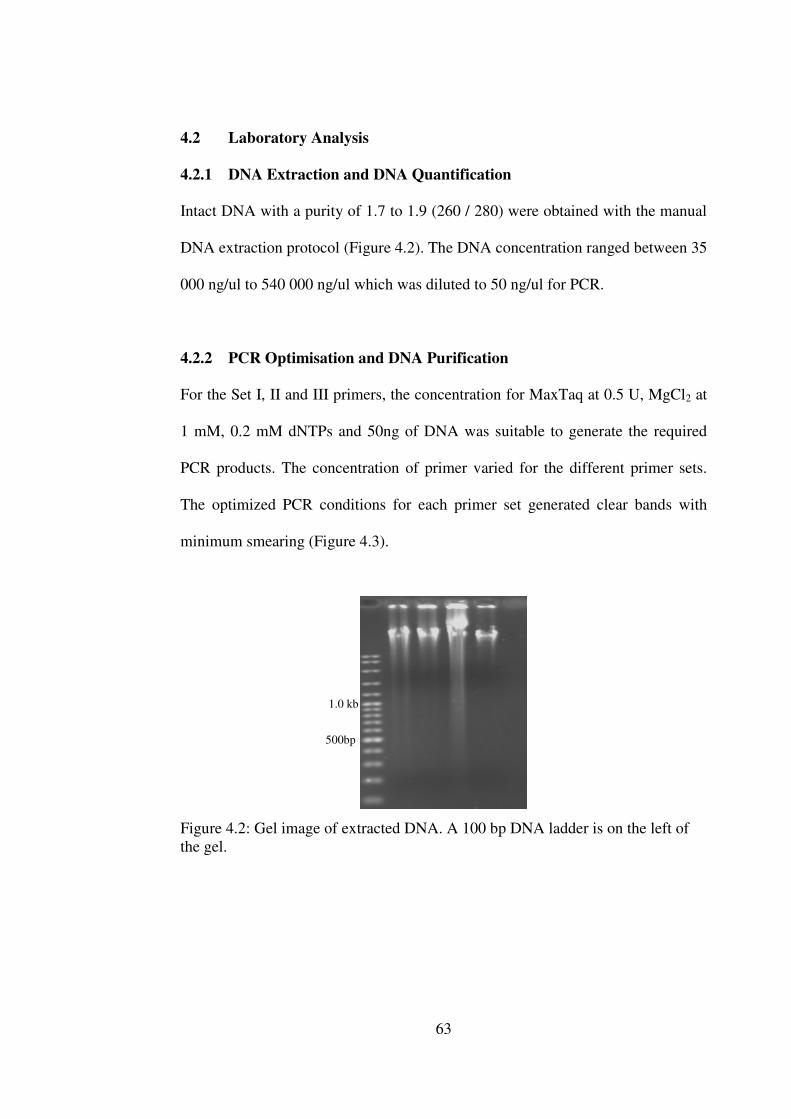
Gel image of extracted DNA.
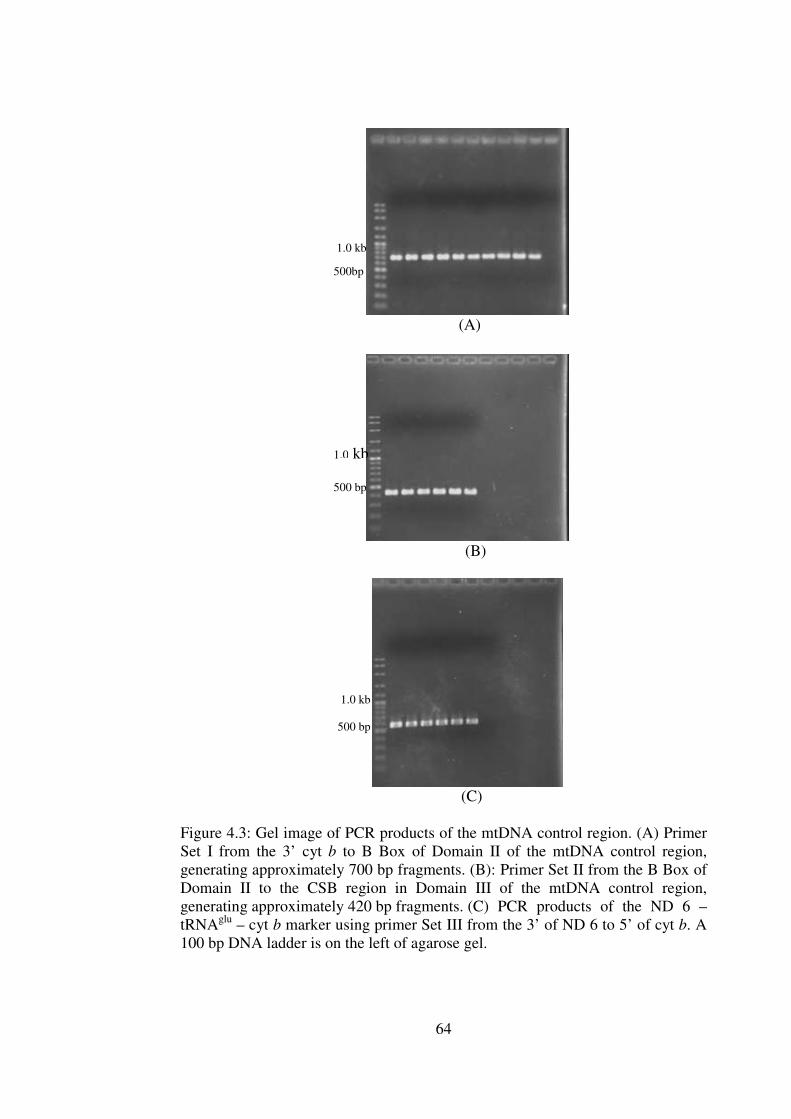
Gel image of PCR products of the mtDNA control region.
Gel image of purified PCR products of the mtDNA control region.
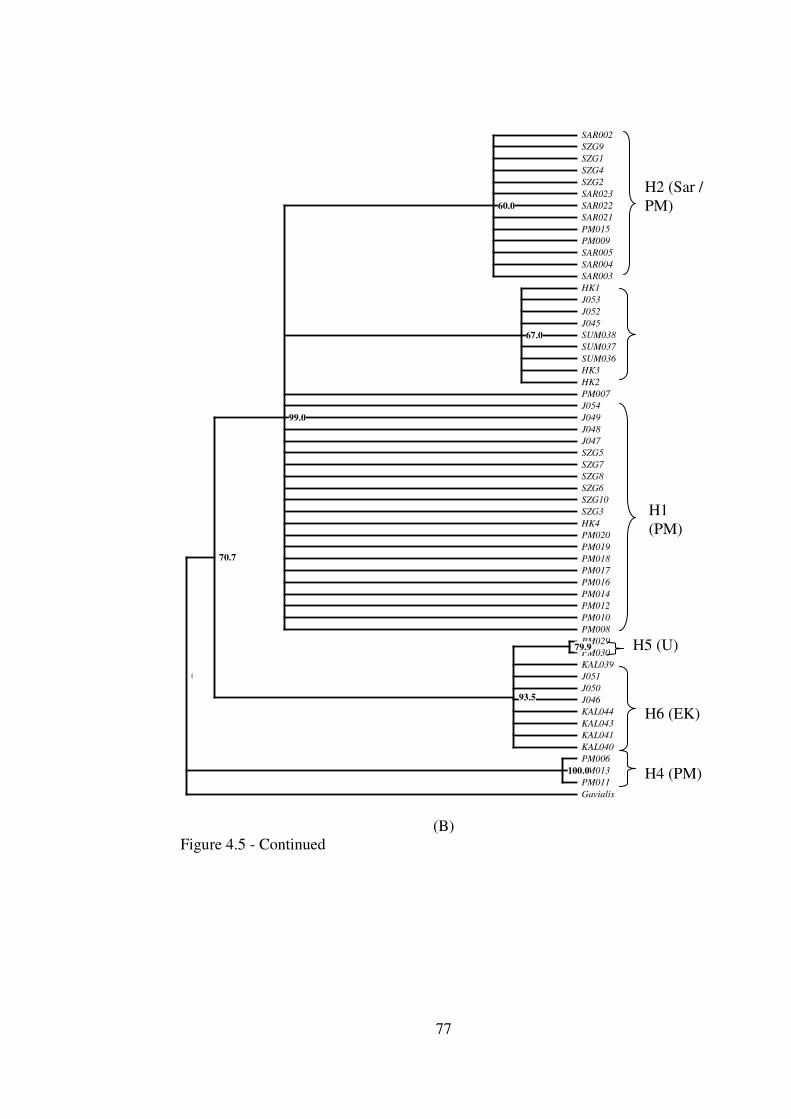
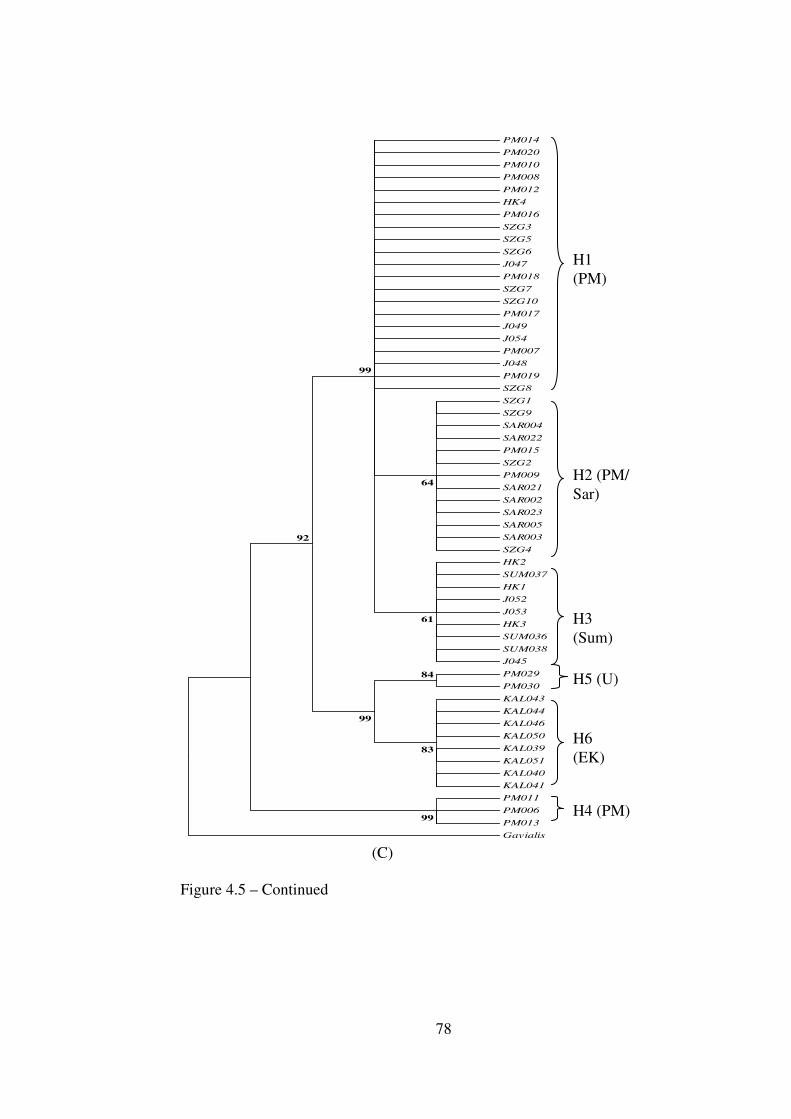
Phylogenetic trees generated with concatenate data
Haplotype network using concatenate data.
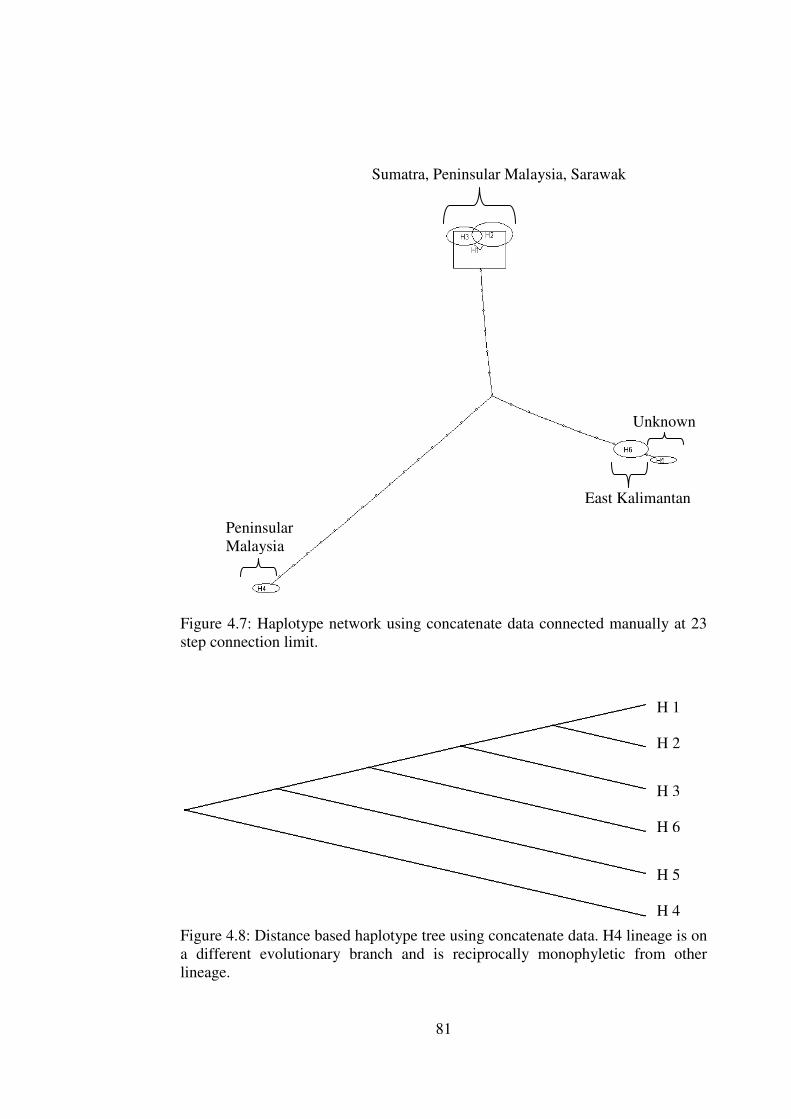
Haplotype network using concatenate data connected manually at 23 step connection limit
Distance based haplotype tree using concatenate data.
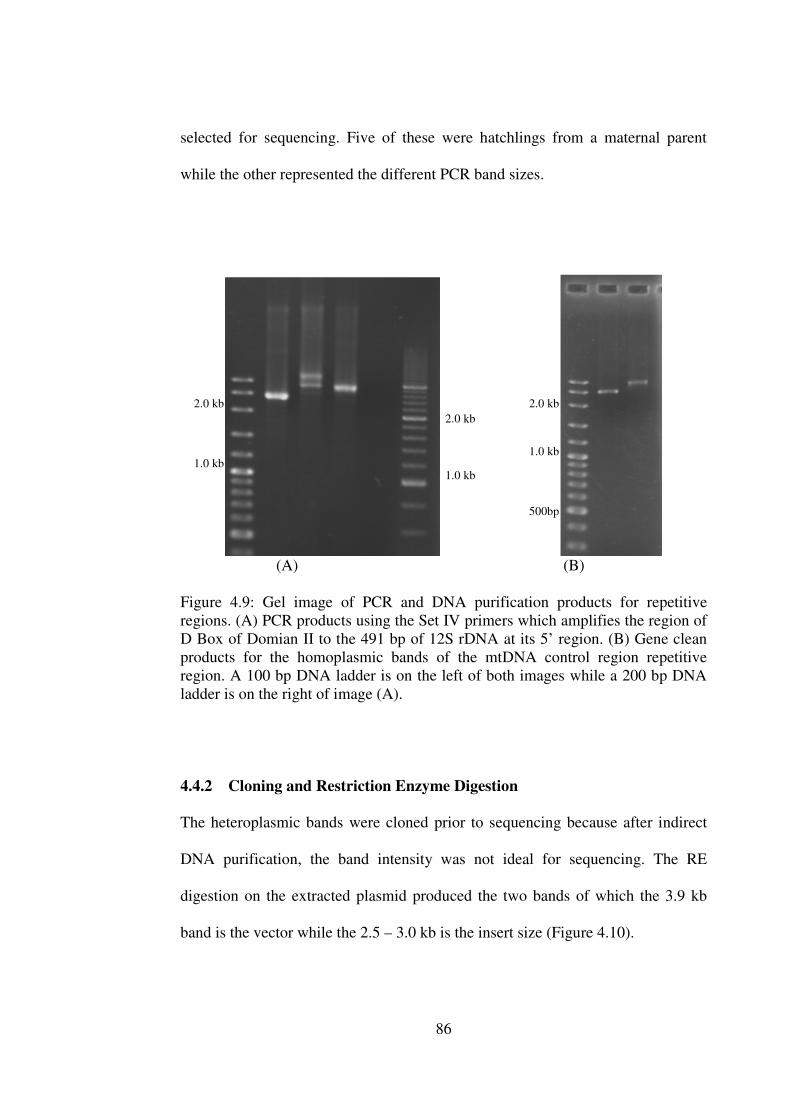
Gel image of PCR and DNA purification products for repetitive regions.
Gel image of the restriction enzyme products
6
7
7
12
16
16
26
46
62
63
64
66
76
80
81
81
86
87
� ���
4.11
4.12
4.13
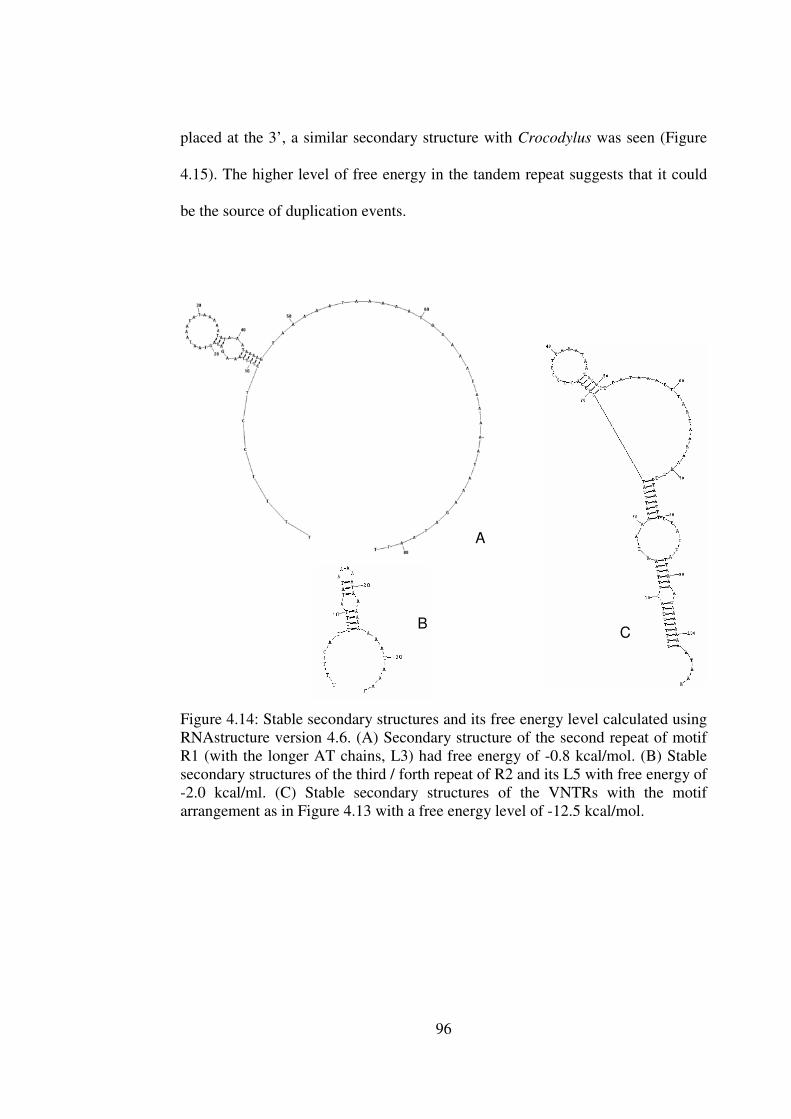
4.14
4.15
Agarose gel image showing the bands generated using PCR primers Set IV. Schematic diagram of the repetitive region after the CSB III. Nucleotide sequence of the repetitive region and the flanking CSB III and 12S rRNA gene of Tomistoma schlegelii as illustrated in Figure 4.12. Stable secondary structures and its free energy level calculated using RNAstructure version 4.6. Stable secondary structures when the VNTRs with the Tomistoma CCTA motif at the 3’.
89
91
92
96
97
CHAPTER 1
INTRODUCTION
The endangered Tomistoma schlegelii, also known as the false gharial, is endemic
to Malaysia and Indonesia (Auliya et al., 2006; Bezuijen et al., 2001) and is
currently under Appendix I of CITES (IUCN 2009) with an estimated population
of less than 2500 individuals left in the wild (Bezuijen et al., 2010). Previous
census studies have all indicated a gradual decline of Tomistoma sightings in
Kalimantan and Sumatra from the 1990s to 2000s (Auliya et al., 2006; Bezuijen
et al., 1998; Bezuijen et al., 2001) while in Malaysia sightings have been rare
since the late 1980s (Cox and Gombek, 1985; Sebastian, 1993; Simpson et al.,
1998). The main threat of this freshwater crocodilian is habitat loss due to legal
and illegal logging, urbanization, fishing activities and forest fires at peat swamps
resulting in loss of suitable nesting sites and habitat for Tomistoma (Auliya et al.,
2006; Bezuijen et al., 1998; Bezuijen et al., 2001).
Currently, most of these wild specimens are found in captivity in zoos and farms
and even by individuals who acquired it illegally. Zoos and farms in Malaysia
have approximately 77 specimens (Stuebing et al., 2004) while Singapore,
Thailand and Indonesia have collectively 88 specimens (http://tomistoma.org).
2
Zoos and farms in Europe and the United States of America hold approximately
57 specimens (http://tomistoma.org).
Thus far, studies in both Malaysia and Indonesia have concentrated on surveys of
Tomistoma in natural habitats and related issues involving conservation of habitat
for the false gharials (Auliya et al., 2006; Bezuijen et al., 1998; Bezuijen et al.,
2001; Bezuijen et al., 2002; Bezuijen et al., 2004; Stuebing et al., 2006).
Information on the genetic diversity of this species is currently lacking. The
available genetic information to date on Tomistoma schlegelii is on its
classification within Crocodylia (Gatesy et al., 2003; Harshman et al., 2003;
Janke et al., 2007; McAliley et al., 2006; Roos et al., 2009). Due to the ongoing
habitat destruction of Tomistoma which is forcing this crocodilian to survive in
the limited available habitat and a gradual decrease of numbers and density of this
species is likely to result in a loss of genetic diversity due to genetic drift or
inbreeding.
Without genetic information of the available wild caught individuals in captivity,
breeding programs at such localities could result in inbreeding, if closely related
individuals are bred, or outbreeding, if mating is carried out using two divergent
lineages. Similarly, genetic information of potential wild populations is essential
for a successful breeding and reintroduction program. Reintroduction of divergent
lineages into the existing wild population could prove to be detrimental to the
survival of this little known species in the wild. Apart from reintroduction
3
programs, accurate identification of lineage or populations would help in
enforcement of wildlife law efforts concerning this species. A study at the
intraspecific level is therefore important in order to make appropriate
conservation management decision for Tomistoma. Hence, this study was carried
out to document the genetic diversity and population structure of this sole member
of Tomistoma using wild caught individuals held in captivity in the occurrence
range of this crocodilian.
A total of 56 samples collected from Malaysia, Indonesia, Hong Kong and
Singapore which were a mixture of wild caught specimens and farmed specimens
with known and unknown origins (confiscated specimens) were used in this study.
The 3’ cytochrome b to the third domain of the mtDNA control region (cyt b –
CR) and the 3’ ND 6 – tRNA-Glu – 5’ cytochrome b (ND 6 – tRNAglu – cyt b)
were utilised to investigate the genetic diversity of Tomistoma schlegelii and to
facilitate comparisons with other crocodilians for the same gene region.
Since the control region was used as one of the markers, and is known to have
repetitive regions containing variable number tandem repeats (VNTRs) that were
described in other crocodilians but failed to be amplified in Tomistoma and
Gavialis (Ray and Densmore, 2002), new primers were developed to identify and
characterise the repetitive region in Tomistoma. Investigation of parental
inheritance was carried out as a ‘family unit’ was included in the sampling
process.
4
Therefore, the objectives of this study are to:
• document the genetic diversity of the species in the occurrence range
of this species and within sampling localities individually,
• identify if there is population structure over its occurrence range,
• identify if haplotypes are geographically associated, and therefore to
assign the individuals with unknown origin to their respective
geographical region,
• detect if species level divergence exist within Tomistoma,
• detect if VNTRs are present in the mtDNA control region of
Tomistoma, and to characterize them accordingly.
5
CHAPTER 2
LITERATURE REVIEW
2.1 Tomistoma schlegelii 2.1.1 Description
Tomistoma schlegelii is one of the largest crocodilian with adult males ranging
from 4.5 – 5.0 m while adults females are about 2.5 – 3.0 m long (Bezuijen et al.,
1998; Bezuijen et al., 2010). The number of eggs in a clutch is up to 35 eggs
(Bezuijen et al., 1998; Bezuijen et al., 2001). The snout of this species resembles
the slender snout of the Indian gharials, Gavialis gangeticus but slightly wider in
Tomistoma schlegelii and therefore is commonly known as the false gharials
(Figure 2.1).
The genus name means ‘cutting mouth’ in Greek while the species is named after
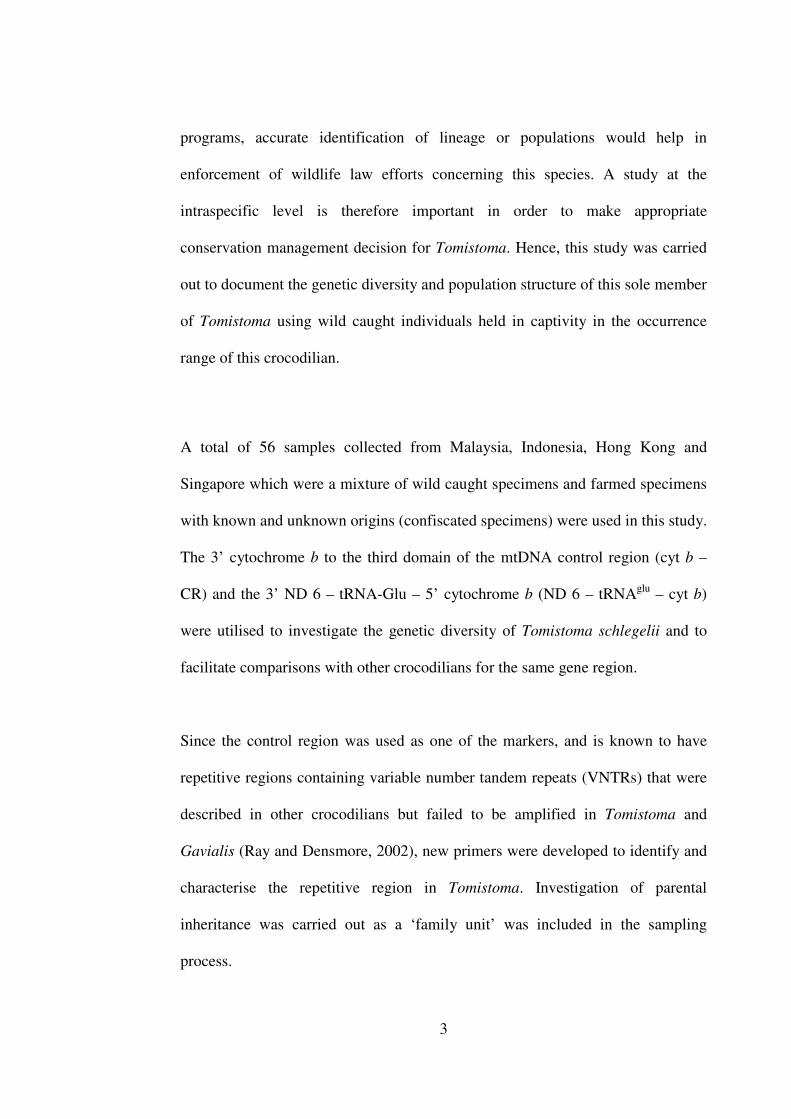
its Dutch discoverer, H. Schlegel. Juveniles are dark chocolate brown in colour
with black banding on the tail, body and dark blotches at the jaw area (Figure
2.2). Their underbelly is dark, turns lighter and finally white as they grow older.
Adults retain most of their juvenile pattern with the dorsal colouration turning
brown to olive-green with dark cross bands (Bezuijen et al., 2001).
6
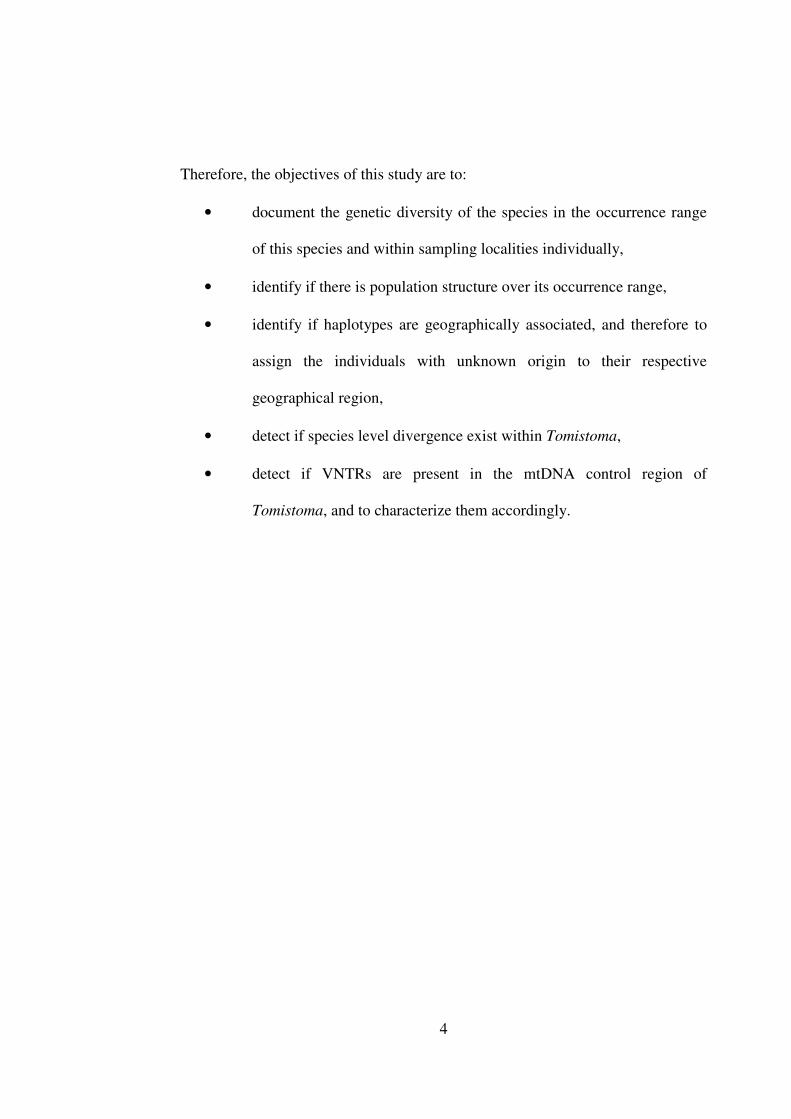
The total of 76 to 84 teeth are sharper and narrower than that of the other
crocodilians that occur in its distribution range, the saltwater crocodiles
Crocodylus porosus and C. siamensis (Figure 2.3). Its diet is reported to include a
variety of invertebrates like shrimps to small vertebrates such as fish, monkeys
and small deers (Bezuijen et al., 2001).
Figure 2.1: The slender snout of Tomistoma. An adult male basking in Zoo Negara, Malaysia.
7
Figure 2.2: Hatchlings of Tomistoma. One month old hatchlings in Jong’s Crocodile Farm, Sarawak.
Figure 2.3: The sharp teeth of an adult male Tomistoma.
8
2.1.2 Classification Based On Fossils, Morphology and Molecular Data
Members of Tomistominae amongst others, based on morphological and fossil
data, are Tomistoma schlegelii, T. cariense, T. lusitania, T. petrolica,
This crocodilian is known to be associated with peat swamps and rivers in
Sumatra especially the South Sumatra and Jambi Provinces (Bezuijen et al., 1998;
2002), Central Kalimantan in the Tanjung Putting National Park rivers (Auliya et
al., 2006) and Danau Sentarum in West Kalimantan (Bezuijen et al., 2004).
Overall, the census studies showed a declining population of this species over the
years.
The densitiy of Tomistoma in Leboyan river, west Kalimantan was reported to be
0.21 crocodiles / km in 1994 but reduced to 0.08 crocodiles/km in 2004 (Bezuijen
12
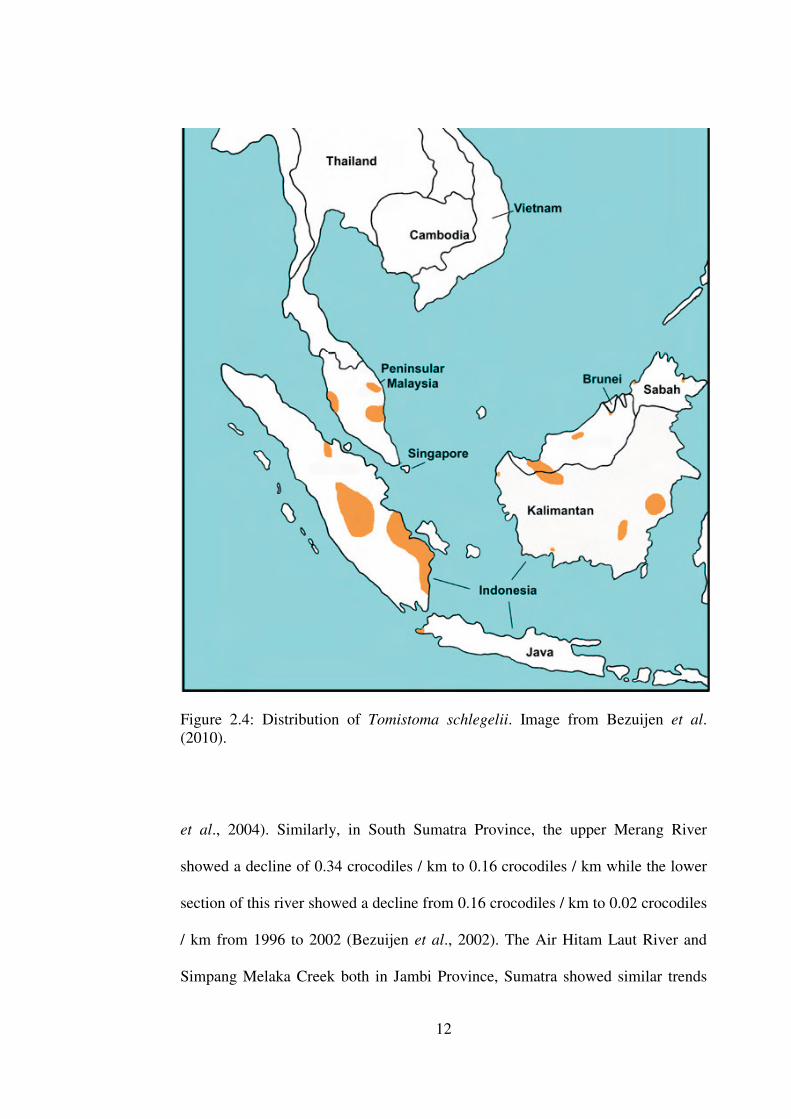
Figure 2.4: Distribution of Tomistoma schlegelii. Image from Bezuijen et al. (2010).
et al., 2004). Similarly, in South Sumatra Province, the upper Merang River
showed a decline of 0.34 crocodiles / km to 0.16 crocodiles / km while the lower
section of this river showed a decline from 0.16 crocodiles / km to 0.02 crocodiles
/ km from 1996 to 2002 (Bezuijen et al., 2002). The Air Hitam Laut River and
Simpang Melaka Creek both in Jambi Province, Sumatra showed similar trends
13
within this time frame (Bezuijen et al., 2002). Bezuijen et al. (2002; 2004)
attributed the decline due to habitat destruction and fishing activities. In contrast,
Auliya et al. (2006) found that apart from sighting of varying sizes of Tomistoma,
the density was increasing in the Sekonyer and Sekonyer Kanan rivers in Tanjung
Putting National Park. However, no sightings were reported in the Buluh Kecil
River also in Tanjung Putting National Park indicating that the stable breeding
populations in the Sekonyer and Sekonyer Kanan rivers could be due to the
conservation efforts on orangutans around that area since the 1970s (Auliya et al.,
2006)
All previous wild caught Tomistoma of Malaysia were caught within peat swamps
restricted to Sarawak and Peninsular Malaysia with sightings being rare since the
early 1990s (Sebastian, 1993; Simpson et al., 1998). Three individuals were
sighted by Cox and Gombek (1985) in the Ensengai River in Sarawak during one
survey night while none were spotted at the Bera Lake, Pahang despite historical
reports of the species as common in the area (Simpson, 1998). Other studies have
been on compilation of distributional records for the false gharial in Malaysia
(Sebastian, 1993). The occurrence of Tomistoma in Thailand is unconfirmed.
Stuebing et al. (2006) reported that a lack of supporting data either suggests this
species did not occur in Thailand or occurred in the southern region now under
Malaysian sovereignty. There is no supporting data for Tomistoma occurrence in
Vietnam and Singapore (Sebastian, 1993).
14
2.2 Mitochondria Genes 2.2.1 Mitochondrial Genome
Mitochondria is a circular organelle DNA and is found in cells of higher
organisms. It is responsible for oxidative phosphorylation and production of
adenosine triphosphate, ATP (McBride et al., 2006). It contains DNA which is
separated from the chromosomal or nuclear DNA and is maternally transmitted
with low or no recombination (Avise, 2000). Generally the mitochondria DNA
(mtDNA) has two rRNA genes, two ATPase genes, four cytochrome genes, six
NADH genes, 22 tRNAs which are found in between the genes and acts by
providing the amino acids needed during translation, and a large non-coding
region resulting in a genome size of 16 kilo bases (kb) (Moritz et al., 1987).
Larger mtDNA genome sizes are usually due to the length variation of the non-
coding region of the mtDNA (Rand and Harrison, 1989). There are other smaller
non-coding regions at variable positions along the mtDNA genome for some
groups of animals (Boore, 1999). These mtDNA genes are also seen in
crocodilian together with the smaller non-coding region (Janke et al., 2005). The
arrangements of these genes however vary among major taxonomic groups in
vertebrates, with most conforming to one of the ‘common’ vertebrate tRNAs
arrangements (Boore, 1999). The arrangement of the WANCY region (tRNA -
Trp, - Ala, - Asn, - Cys, - Try genes, abbreviated by single letters of amino acids
decoded) for instance has been found to differ within reptilians (Boore, 1999;
Kumazawa and Nishida, 1995). The WANCY region differs from crocodilian and
tuatara to squamate with the latter having a non-coding region within the
15
WANCY region, which is also the ‘common’ vertebrate arrangement described
by Boore (1999) (Figure 2.5A and Figure 2.5B). In crocodilian, the tRNA – His, -
Ser and - Leu (HSL) between the ND 4 and ND 5 genes and the tRNAs flanking
the control region (tRNA – Phe) differ from the ‘common’ tRNA orientation
(Boore, 1999; Kumazawa and Nishida, 1995) (Figure 2.5A and Figure 2.5B). The
‘common’ vertebrate arrangement for tRNA – Phe is between the control region
and the 12S rDNA gene but in crocodilians the control region is flanked by the
tRNA – Phe at its 5’ end and the 12S rDNA gene flanks the control region at the
3’ end (Boore, 1999). Other reptilian, such as the tuatara, conform to the
‘common’ vertebrate arrangement for this region (Quinn and Mindell, 1996)
(Figure 2.6A and Figure 2.6B).
2.2.2 mtDNA Gene as a Genetic Marker
Apart from the abundance of these organelle DNA and a faster evolution rate
compared to nuclear genes (Avise, 2000, Hwang and Kim, 2000), mtDNA genes
are also a popular marker for evolutionary and phylogeography studies due to
maternal inheritance with minimal or no recombination, (Avise, 2000; 2004;
Moore, 1997) and neutral evolution (Vawter and Brown, 1986). However, recent
reviews on mtDNA have indicated that it is not free of recombination and is not
exclusively maternally inherited (Galtier et al., 2009). Recombination was
suggested in human mitochondria when a high homoplasmy within species was
observed and divergent lineages sharing point mutation (Eyre-Walker et al., 1999;
Hagelberg et al., 1999), which was later found to be due to mutation hotspots and
16
(A)
(B)
Figure 2.5: Schematic diagram of mtDNA WANCY and HSL region. Gene arrangements from 5’ to 3’ adapted from Boore (1999). Jagged lines indicate partial genes. (A) The ‘common’ vertebrate arrangement of the WANCY and HSL region. (B) The tRNA orientations in crocodilian.
(A)
(B)
Figure 2.6: Schematic diagram of mtDNA tRNA – Phe gene. Gene arrangements from 5’ to 3’ adapted from Boore (1999). Jagged lines indicate partial genes. (A) The ‘common’ vertebrate arrangement of tRNA – Phe. (B) The tRNA – Phe arrangement in crocodilian.
ND 2 W A N OL C Y COI ND 4 H S L ND 5
ND 2 W A N C Y COI ND 4 S H L ND 5
Cyt b tRNA Thr
tRNA Pro
Control region tRNA Phe
12S rDNA
Cyt b tRNA Thr
tRNA Pro
tRNA Phe
Control region 12S rDNA
17
alignment error (Galtier et al., 2006; Hagelberg et al., 2000). Because methods for
accurate detection of recombination is lacking, it should be considered when high
amount of within species homoplasmy is seen using mtDNA gene, though it could
also be due to mutation- induced convergences (Galtier et al., 2009).
Apart from recombination, biparental inheritance is found in marine mussels
(Zouros et al., 1992) while paternal leakage has been reported in mice and sheep
(Gyllesten et al., 1991). In the marine mussel Mytilus trossulus, the biparental
mtDNA genomes had the paternally inherited control region (Burzynski et al.,
2003).
Zhao et al. (2004) suggested that paternal mtDNA could be inherited either by
paternal leakage in which the mtDNA from spermatids enter the eggs and are
maintained at low levels in the fertilized eggs. The other possibility suggested was
by recombination of the paternal mtDNA genome into the nucleus to form nuclear
copies of mitochondria genes (Numt DNA), which interacted with the nuclear and
mtDNA, and then transferred back into the mtDNA (Zhao et al., 2004) especially
in cases of hybrids (Fontaine et al., 2007). Though there are exceptions to the
clonal inheritance with no recombination of mtDNA, generally most taxa conform
to the maternal inheritance with negligible recombination events (Avise, 2009).
18
The neutral theory suggests that most molecular variations are caused by random
drift and selectively neutral mutations (Kimura, 1968). This theory has been used
to infer population demography using molecular markers especially using mtDNA
that were thought to be neutral. The neutrality of mitochondria gene has also been
questioned (Galtier et al., 2009). Recurrent sweeps in large population and
adaptation leading to reduced diversity of the mtDNA genome was suggested by
Bazin et al. (2006) when mtDNA gene diversity was similar across animal taxa.
The lack of recombination of the mitochondria makes genetic hitchhiking more
likely when there is selection for a particular gene (Ballard and Kreitman, 1995).
There are several neutrality test to indicate if indeed the marker is neutral for
demographic purposes, like the Tajima’s D (1989), Fu and Li’s D test (1993), the
Fu’s FS test (1997) and the Ramos and Rozas’s R2 (2002). The null hypothesis in
these tests is neutral mutation with no recombination and deviations from neutral
mutations are either purifying (a negative value) or balancing selection (a positive
value). In the case of the Tajima’s D and Fu and Li’s D test, the presence of
natural selection is only one of the possibilities when the null hypothesis is
rejected. In contrast, the Fu’s FS can be used to identify the evolutionary forces in
a population which is either undergoing subdivision, population reduction and
over – dominance selection (Fu, 1996). Old mutations are seen in generations
closest to the common ancestor while young mutations are seen in the most recent
descendents, and an excess of the former would indicate population reduction or
bottleneck while an excess of the latter would indicate population expansion (Fu,
19
1996). The Ramos and Rozas’s R2 has been found to be more sensitive than Fu’s
FS when the sample size is small (Ramos and Rozas, 2002). The more recent test,
Fu’s FS and Ramos and Rozas’s R2 tests are therefore most sensitive to detect
population demography compared to the earlier test (Ramos and Rozas, 2002).
Therefore, inferences at the population demography can be made with a better
level of confidence.
Finally, though the mutation of mtDNA is generally higher than nuclear DNA
(nuDNA) by ten folds (Clayton, 1984; DeSalle et al., 1987), the mutation is not
constant across the genome. The mtDNA 12S rDNA is highly conserved and used
in higher taxonomic level similar to the nuclear small subunit (SSU) rDNA, while
the mtDNA non – coding region or the cytochrome c oxidase I (COI), have a high
mutation rate suitable for population and species level comparisons (Hwang and
Kim, 1999). Apart from mutation variation within the mtDNA genes themselves,
the mtDNA mutation rate which was thought not to deviate too much within
vertebrates (Moritz et al., 1987) is now reported to vary across taxa (Gatlier et al.,
2009). The mutation rates of nuDNA in mammal lineages were reported to be
more constant than mtDNA and therefore when using the mtDNA genome as a
molecular dating tool, mutation rate heterogeneity should be taken into
consideration (Galtier et al., 2009).
20
2.2.3. mtDNA Genes in Phylogenetic Studies
Interspecific and higher level comparisons are possible with mtDNA due to the
conservations of the number of genes (most groups have 37 genes) and its
arrangements (Boore, 1999; Moritz et al., 1987) while amino acids analysis is
suitable for higher taxonomic level, such as at the family and even phylum
(Hwang and Kim, 1999). Nucleotide sequences of the protein coding genes are
used in cases of saturation of the third codon due to high substitution at this
position usually at lower taxonomic level, such as the species and population level
(Hwang and Kim, 1999).
The nucleotide analysis of its protein coding genes is suitable for species or
population level analysis and are commonly used in crocodilian population
studies (Cedeno – Vasquez et al., 2008; Farais et al., 2004; Glenn et al., 2002;
Ray et al., 2000; Ray et al., 2004; Rodriguez et al., 2008; Vasconcelos et al.,
2006; 2008; Venegas – Anaya et al., 2008, Weaver et al., 2008).
Generally, mtDNA cytochrome b gene (cyt b) was found to be more conserved
compared to cytochrome c oxidase I (COI) (Hwang and Kim, 1999). Cyt b
however is a common marker at the species and population level of crocodilian
(Farais et al., 2004; Vasconcelos et al., 2006; Weaver et al., 2008) and was found
to be as sensitive as the COI and the control region in caiman and crocodiles
(Venegas – Anaya et al., 2008; Weaver et al., 2008). In the black caiman, the cyt
b gene revealed a population expansion and population differentiation according
21
to the two main drainage type (Farais et al., 2004; Vasconcelos et al., 2008). The
latter study found that the haplotype diversity, h was high at 0.91 compared to
0.69 by Farais et al. (2004). Similar findings of high haplotype diversity and
population differentiation using mtDNA were seen in Caiman crocodilus
(Vasconcelos et al., 2006; Venegas – Anaya et al., 2008).
The COI gene is probably the most common mtDNA used for species level
comparisons as its efficiency as a barcoding tool is well documented in animals
(Apakupakul et al., 1999; Herbert et al., 2004; Costa et al., 2007) due to the high
diversity levels seen between species over a relatively short length and is flanked
by conserved region where universal primers can easily work to amplify the
region (Kress and Ericksoon, 2008).
Concatenation of data from mtDNA cyt b and cytochrome oxidase I (COI) in the
caiman, revealed 3 evolutionary significant units (ESU) with a divergence of 1.6
to 6 million years ago (Venegas – Anaya et al., 2008). Apart from identifying
management units, COI gene was also useful in classifying Osteolaemus species
(Eaton et al., 2009). Concatenate data of three different mtDNA genes (12S
rDNA, COI and cyt b – control region) of Osteolaemus revealed three different
species within this genus which were also associated with geographical regions
and was supported with two different nuclear genes and subsequently by
combining all the five genes (Eaton et al., 2009).
22
Hybridization has been suggested using mtDNA data when the phylogenetic
analyses showed incongruence with morphological data (Ray et al., 2004, Weaver
et al., 2008). In Morelet’s crocodile, Ray et al. (2004) found that some
populations with C. moreletti morphology showed a C. acutus haplotype, while
Weaver et al. (2008) found that C. rhombifer with C. acutus morphology formed
a separate clade from those with the Cuban crocodile morphology.
The control region, an unassigned region and does not code for any proteins
(Hwang and Kim, 2000), is a hypervariable region used as a molecular marker at
species and population level. Although it is a hypervariable region, it is believed
to have functional constraints as certain conserved sequences found across taxa
are involved in the regulation of replication and transcription of the mitochondrial
genome (Broughton and Dowling, 1994; Buroker et al., 1990; Chang and
Clayton, 1985; Levinson and Gutman, 1987; Mundy et al., 1996; Wenick et al.,
1994).
2.2.3.1 ND 6 – tRNAglu – cyt b Marker
The 3’ region of NADH 6 to 5’ region of cytochrome b (ND 6 – tRNAglu – cyt b
marker) has been used as a marker for interspecific and intraspecific variation in
crocodilians (McAliley et al., 2006; Ray and Densmore, 2003). In a preliminary
genetic study of Osteolaemus tetraspis, this marker revealed high levels of
variations comparable to that of between species when individual from Gabon in
Africa were included (Ray et al., 2000). The Gabon population, using
23
microsatellite and morphology, revealed substantial evidence to be considered a
different taxonomic unit (Eaton et al., 2009). However, McAliley et al. (2006)
found low variation within Crocodylus in this 347 bp region but comparison
between genus (Crocodylus, Gavialis, Tomistoma and Mecistops) was similar or
higher than that seen by using the control region.
2.2.3.2 mtDNA Control Region
The control region is the only major non – coding segment in the vertebrate
mitochondrial genome. The non – coding region known to be the most
hypervariable region, evolving three to five times more rapidly compared with the
rest of the mitochondrial genome and is not subjected to any selection making it
suitable for population and species level analysis (Avise, 2000; Hwang and Kim,
2000).
However nucleotide diversity by this marker has been reported to be low with
0.07% to 1.3% in Crocodylus moreletti (Ray et al., 2004). Genetic divergence
using this marker also revealed low values from 0 % to 1.6 % (Eaton et al., 2009;
Weaver et al., 2008). Ray et al. (2004) suggested that this could be due to a low
rate of substitution in the crocodilian mtDNA control region. Despite this, the
divergence of the mtDNA cyt b – CR sequences and cyt b was useful in revealing
a separate lineage in Crocodylus rhombifer which was confirmed with
microsatellite studies (Weaver et al., 2008). The cyt b – CR marker was able to
suggest hybridization between C. acutus and C. moreletti when eight individuals
24
showing C. acutus morphology had C. moreletti haplotype while another eight
with C. moreletti morphology had C. acutus haplotype (Cedeno – Vasquez et al.,
2008). The microsatellite findings confirmed the cyt b – CR marker findings
(Cedeno – Vasquez et al., 2008). This study also found one individual with the
American crocodile morphology showing a C. rhombifer haplotype (Cedeno –
Vasquez et al., 2008). In the American alligator, the mtDNA d loop revealed a
single population with very low diversity due to a past population bottleneck
(Glenn et al., 2002).
2.2.4 Structure of the Control Region in General and in Crocodilians.
The non-coding region of most taxa consists of three parts known as Domain I, II
and III with Domain I and III as the hypervariable domains with highly repetitive
sequences (Sbisa et al., 1997). Although it is a hypervariable region, there are
conserved sequences within this region found across taxa suggesting functional
constraint in this region of the mtDNA genome.
Domain I contains ‘termination associated sequences’ or TAS/ ETAS while
Domain III contains short conserved sequence blocks (CSBs) and promoters for
H- and L- strand transcription. Domain III is where the replication of the H-strand
begins and ends at the TAS in Domian I (Sbisa et al., 1997). Domain II is
generally more conserved compared to the other two domains and contains CSB
like sequences known as F, E, D, C and B boxes which are thought to be
associated with regulating H- strand synthesis. (Xiao et al., 2006).
25
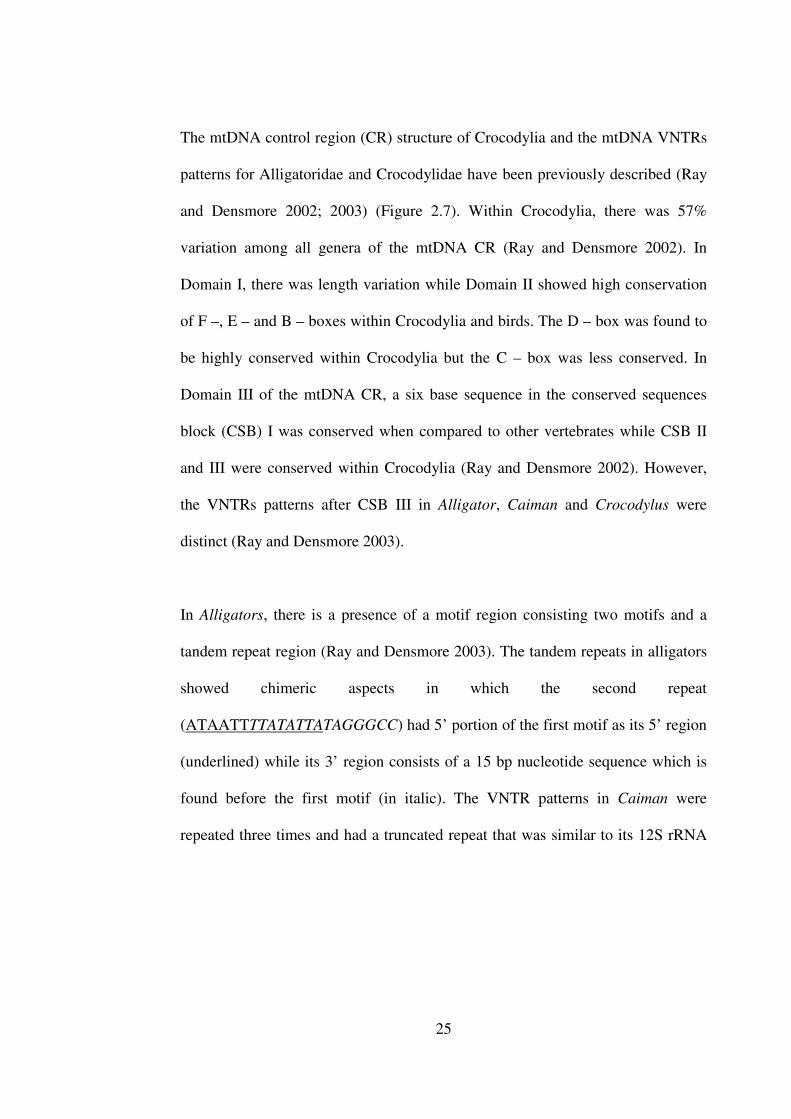
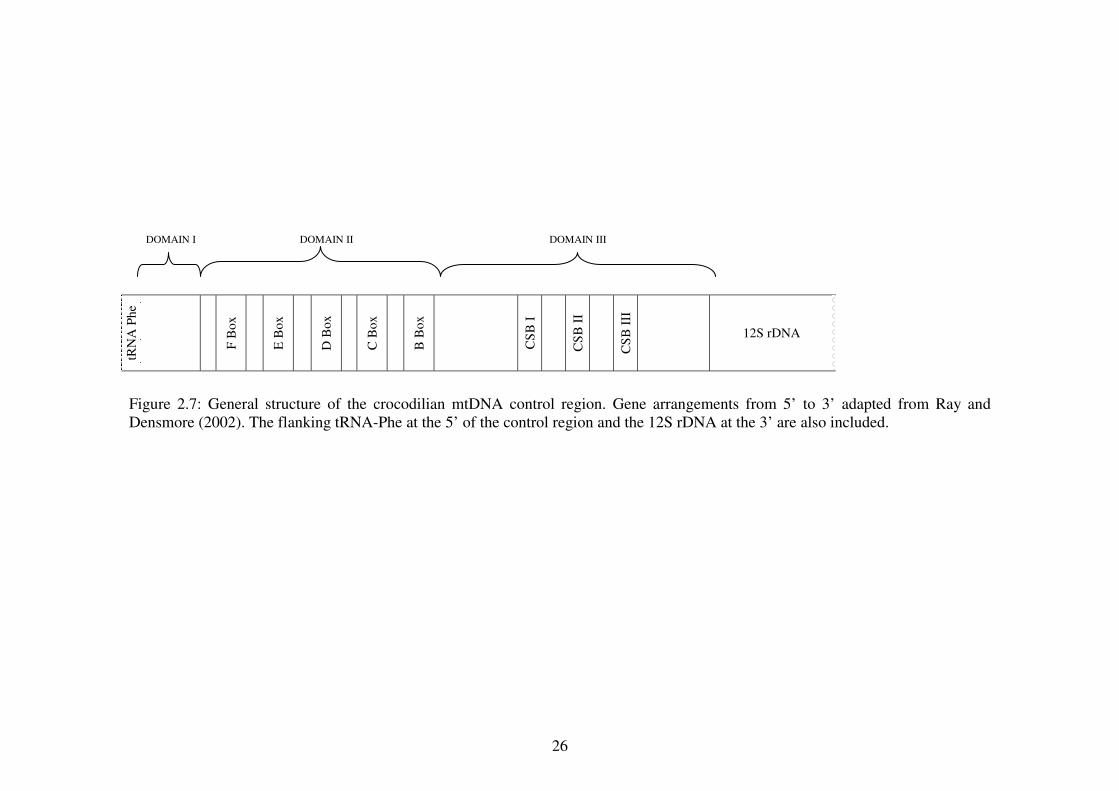
The mtDNA control region (CR) structure of Crocodylia and the mtDNA VNTRs
patterns for Alligatoridae and Crocodylidae have been previously described (Ray
and Densmore 2002; 2003) (Figure 2.7). Within Crocodylia, there was 57%
variation among all genera of the mtDNA CR (Ray and Densmore 2002). In
Domain I, there was length variation while Domain II showed high conservation
of F –, E – and B – boxes within Crocodylia and birds. The D – box was found to
be highly conserved within Crocodylia but the C – box was less conserved. In
Domain III of the mtDNA CR, a six base sequence in the conserved sequences
block (CSB) I was conserved when compared to other vertebrates while CSB II
and III were conserved within Crocodylia (Ray and Densmore 2002). However,
the VNTRs patterns after CSB III in Alligator, Caiman and Crocodylus were
distinct (Ray and Densmore 2003).
In Alligators, there is a presence of a motif region consisting two motifs and a
tandem repeat region (Ray and Densmore 2003). The tandem repeats in alligators
showed chimeric aspects in which the second repeat
(ATAATTTTATATTATAGGGCC) had 5’ portion of the first motif as its 5’ region
(underlined) while its 3’ region consists of a 15 bp nucleotide sequence which is
found before the first motif (in italic). The VNTR patterns in Caiman were
repeated three times and had a truncated repeat that was similar to its 12S rRNA
26
Figure 2.7: General structure of the crocodilian mtDNA control region. Gene arrangements from 5’ to 3’ adapted from Ray and Densmore (2002). The flanking tRNA-Phe at the 5’ of the control region and the 12S rDNA at the 3’ are also included.
tRN
A P
he
F B
ox
E B
ox
D B
ox
C B
ox
B B
ox
CS
B I
CS
B I
I
CS
B I
II
12S rDNA
DOMAIN III DOMAIN II DOMAIN I
27
gene (Ray and Densmore 2003). In the Crocodylus, only one form of motif was
reported, the ‘TAGG’ motif, which is part of the VNTRs. The VNTRs showed
shortening of sequences from 5’ to 3’ in the New World crocodiles and appeared
constant in the Old World crocodiles (Ray and Densmore 2003). The presences of
VNTR and repetitive regions for both gharials have not been previously reported
and were not addressed in a related study of the crocodilian repetitive region (Ray
and Densmore 2003).
2.2.4.1 mtDNA VNTRs Utiltiy
The variable number tandem repeats (VNTRs) are short sequences or motifs
repeated in a tandem fashion, usually found in Domain I and Domain III of the
control region (Lunt et al., 1998; Ray and Densmore, 2003) and are capable of
folding into thermodynamically stable secondary structures (Lunt et al., 1998).
This region has been used as a marker for intraspecific and interspecific variation
studies (Arnason and Rand, 1992; Broughton and Dowling, 1994; Casane et al.,
1994; Larizza et al., 2002; Ludwig et al., 2000; Mjelle et al., 2008; Nesbo et al.,
1998; Ray and Densmore, 2002; Wilkinson et al., 1997) and in studies of
replication models of the mtDNA genome (Buroker et al., 1990; Levinson and
Gutman, 1987; Mundy et al., 1996; Taylor and Breden, 2000).
Study at population level has shown little substructure (Arnason and Rand, 1992;
Broughton and Dowling, 1994) while variation at the family unit level showed
mixed results. Heteroplasmy and sequence types in the European Vespertilonid
28
bat were stably transmitted from mother to offspring (Petri et al., 1996) but
Wilkinson and Chapman (1991) found one case in the American evening bat,
where a homoplasmic mother had a heteroplasmic offspring and both
homoplasmic and heteroplasmic offspring did not have identical sequence repeats
as the mother. In humans, heteroplasmy was stably transmitted in maternally
related individuals due to either a wide bottleneck or joint transmission of two or
more mtDNA (Lutz et al., 1999). However, in bovine, high mutations within one
generation was observed owing to a narrow bottleneck (Hauswirth et al., 1984,
Koehler et al., 1991). Due to these mixed results at intraspecific level, this marker
has been suggested to be more appropriate as ‘mtDNA fingerprint for individual’
rather than for population or species level (Wenick et al., 1994).
Interspecific variation studies using mtDNA VNTRs reported the evolution of the
VNTRs sequence between species suggesting the repeats are lineage specific
either within order and family (Larizza et al., 2002) due to either concerted
evolution of the sequence or functional constraints. In parrots, the mtDNA control
region was duplicated and the two copies were identical in the Amazona genus
suggesting concerted evolution (Eberhard et al., 2001) while in large cats, some
repeat arrays were conserved among species which indicates either conserved
functional roles or are influenced by concerted evolution (Jae-Heup et al. 2001).
29
2.2.4.2 Replication models of the D – loop The length variations seen in the mtDNA repetitive region is due to the
duplication of sequences and variations in the number of VNTR copies during the
replication processes (Broughton and Dowling, 1994). Drift and tissue – specific
selection can also cause length variations and heteroplasmy within an individual
(Casane et al., 1994; Lunt et al., 1998).
Various models for the replication of the mtDNA genome depending of the
location of the repeats, the sequence and its secondary structures stability have
been suggested (Broughton and Dowling, 1994; Buroker et al., 1990; Chang and
Clayton, 1985; Levinson and Gutman, 1987; Mundy et al., 1996).
The slipped strand mispairing (SSM) model by Levinson and Gutman (1987) was
suggested in tandem repeats of non-coding regions characterized by either a
tandem unit made up by a combination of different motifs, tandem arrangements
of closely related motifs and imperfect copies of the original copy as it moves
farther to 3’ of the non-coding region. These patterns are explained by slipped
strand mispairing and interhelical events like long tandem duplication or unequal-
crossing over (UCO) caused by mutational changes. These create new motifs that
are propagated further increasing in length and number of motifs. The Levinson
and Gutman (1987) model was the likely model for the duplication of the tandem
repeats for the Crocodylus as suggested by Ray and Densmore (2003) due to the
shortening of the tandem repeat sequences from 5’ to 3’.
30
The model by Taylor and Brenden (2000) is very similar to Levinson and Gutman
(1987) but with the non-contiguous repeats as the site for misalignment. The
tandem repeats are characterized by perfect tandem repeats and an imperfect
repeat at the 3’ region of the VNTRs in which the first portion of this imperfect
repeat matches the first portion of the perfect repeats. An initial SSM by
nucleotide substitution produces a non – contiguous repeat and subsequent SSM
at this repeat is responsible for the length variations in this region of the control
region. Taylor and Breden (2000) suggested that chance mutations alone, as seen
in the model by Levinson and Gutman (1987) could not explain the formation of
VNTRs for longer length sequences.
Mundy et al. (1996) suggested a model where the duplication of repeats occurs
adjacent to the tandem repeats and involving inverted repeats. In the loggerhead
shrikes, this inverted repeat was located at the tRNA-Phe which is upstream from
the d-loop and the origin of H-strand replication. This model was proposed for
Caiman crocodiles due to the presence of an intervening sequence between the
12S rDNA gene and the last tandem repeat (Ray and Densmore, 2003).
2.3 Intraspecific Variation Analyses 2.3.1 Definitions and Importance of Intraspecific Variation Analyses
There are various levels of genetic diversity namely the genetic variations among
individuals within populations, genetic variation among populations within the
31
same species, and genetic variation between individuals from separate species.
The genetic diversity in the first two instances above is also known as
intraspecific variation while the latter is known as interspecific variation (Hillis et
al., 1996). Changes in the genetic composition of populations and individuals are
the primary mechanism of evolutionary change within species which help the
population or species adapt to the changing environment and therefore increasing
the possibility of its survival (Frankham et al., 2002; Mayr, 1963). The coalescent
theory traces the evolutionary processes backward to the most recent common
ancestor (MRCA) and is popularly used for within species or population level
analyses (intraspecific variation) because it incorporates the demographic
processes as well (Rosenberg and Nordborg, 2002).
Generally, low genetic variation especially in endangered species, in which
numbers of surviving individuals is small, suggests susceptibility to extinction
due to genetic drift (Snyder et al., 1996). But low genetic variation could also
indicate that the current population or species has adapted to the current
environment and is expanding. In the giant panda, the finding of a very low
genetic variation was thought to be due to a population bottleneck in the past and
together with current small numbers in the wild and ongoing habitat degradation
indicates that this species may be on the edge of extinction (Zhang et al., 2002).
However, neutrality tests, Tajima’s D (1989) and Fu’s FS (1997) which are used
for demographic analysis, indicated population expansion, suggesting that after
the bottleneck in the past, the remaining populations have adapted to the
32
environment and are expanding (Zhang et al., 2002). This finding shows that
apart from genetic variation alone, other analysis like demographic and coalescent
analysis is necessary to make better inferences at the intraspecific level (Zhang et
al., 2002).
A description of how haplotypes or the genetic variation of a species is
geographically distributed is equally essential (Avise, 2000). In general, genetic
variability and haplotypes or genotypes in many naturally occurring populations
have been found to be geographically associated and is termed as phylogeography
(Avise, 2000). This is useful in reintroduction programs and assigning
geographical region of individuals of unknown origins (Venegas – Anaya et al.,
2008).
In threatened or endangered species, intraspecific variation can indicate whether
smaller management units exist below the species level. Management units (MUs)
are populations with distinct haplotype and are demographically separated
(Moritz, 1994). An example of this is the Hector’s dolphins in New Zealand
which had four populations, the east, west and south population of the South
Island and North Island populations (Baker et al., 2002). Although there was
substantial gene flow between the east and west population of the South Island
population, all three (east, west and south) were considered separate management
units due to the significant difference in haplotype frequencies between the
populations (Baker et al., 2002). The evolutionary significant units (ESUs) are
33
populations that form a reciprocally monophyletic clade in the mtDNA phylogeny
and are minimally connected or not connected by nuclear gene flow to other
populations (Moritz, 1994). Fraser and Bernatchez (2001) defined ESUs as a
lineage demonstrating highly restricted gene flow from other lineages of the
species. The North Island population fit into the description of ESUs by Mortiz
(1994) and is now recognized as a subspecies. Mixing this population with any of
the other three could result in loss of local adaptation ability due to breeding with
distant lineages and at the same time losing the genetic component of the
evolutionary lineage (Baker et al., 2002).
However, the definitions for ESUs and MUs above have been criticised (Crandall
et al., 2000; Paetkau, 1999) as many subspecies and distinct lineages have been
found to be not reciprocally monophyletic. In the Orchard Oriole, two subspecies
are identified based on morphology, breeding and wintering ranges (Baker et al.,
2003). A polyphyletic mtDNA gene tree was recovered but the FST analysis
showed a significantly high differentiation of these two subspecies. This finding
suggests that these two Orchard Orioles just recently diverged and lineage sorting
is incomplete, therefore the mtDNA tree was not reciprocally monophyletic
(Baker et al., 2003). A recent speciation in which gene flow is absent, and the
population size of the older and newer population can cause an evolutionary
significant unit to not demonstrate a reciprocally monophyletic clade (Paetkau,
1999). Crandall et al. (2000) suggest a broader range of criteria to be included
when defining an ESU; such as ecological information and genealogical histories
34
and exchangeabilities as this would indicate if the population is able to adapt and
evolve over time enhancing the species survival.
The estimate of divergence time between lineages at the species level has also
been used to help define management units or populations in Elephas maximus
and Pongo pygmaeus (Fernando et al., 2003; Warren et al., 2001) in combination
with other population analyses. The Bornean elephant population diverged from
the other Asian elephants in the Pleistocene and had since been isolated,
warranting them as an ESU (Fernando et al., 2003). Similarly, the four Bornean
orangutan populations showed divergence of the same magnitude as the Bornean
– Sumatran populations that are reproductively isolated with high FST, suggesting
the four Bornean populations be managed separately (Warren et al., 2001). In the
spectacled caiman, the phylogenetic analyses and divergence time among lineages
suggest five subspecies (Venegas – Anaya et al., 2008). The basal clade which is
a population from the Amazonia had a divergence of 6 million years indicating
that this cryptic lineage be managed as a separate subspecies from the other
Amazonia clade (Venegas – Anaya et al., 2008). These estimates were based on
the Alligator – Caiman most recent common ancestor (MRCA) from estimates
using morphological, mtDNA and nuclear gene data which showed similar results
(Venegas – Anaya et al., 2008). The divergence estimates were based on
mitogenomic analysis by Roos et al. (2007) which showed general consistencies
with crocodilian fossil records.
35
In summary, conservation of genetic variation and the evolutionary processes
involved in these variations are essential in preservation of genetic diversity at the
intraspecific level.
2.3.2 Quantification of Genetic Diversity
There are a variety of techniques used to quantify genetic diversity such as using
the mitochondrial DNA (mtDNA) nuclear DNA (nuDNA) sequences, restriction
fragment length polymorphism (RFLP), amplified fragment length polymorphism
(AFLP), microsatellites and minisatellites. As seen in most phylogeography
studies, the mtDNA sequencing is one of the most commonly used techniques
(Avise, 2000). Similarly, in crocodilian population studies, mtDNA has been
commonly used (Cedeno – Vazquez et al., 2008; Ray et al., 2000; Ray et al.,
2004; Vasconcelos et al., 2006; 2008; Weaver et al., 2008). These findings were
confirmed with microsatellite markers (de Thoisy et al., 2006, Dever et al., 2002,
Eaton et al., 2009, Rodriguez et al., 2008). However, in the American alligators,
microsatellite markers were able to separate populations according to large scale
east-west phylogeographic separation with little population subdivision within the
two regions (Davis et al., 2002). This population genetic structure was unable to
be detected by mitochondrial marker which had very low variation (Glenn et al.,
2002). One of the reasons for the incongruence could be the small sample size of
only 25 individuals representing the entire occurrence range in the mtDNA study
(Glenn et al., 2002) versus 14 to 59 samples collected in each localities from east
to west of the occurrence range in the microsatellite study (Davis et al., 2002).
36
The common parameter to measure diversity within populations or species is the
expected heterozygosity, or gene diversity defined by Nei (1987) as the
probability that when two alleles are chosen at random from the population, they
are different. Gene diversity refers to haplotype diversity, h, for the mtDNA
genome. A moderate to high h is desirable for the population in the wild or in
captivity to continue to adapt to the changes in environment. Nucleotide diversity,
π, is the gene diversity at the nucleotide level and refers to the probability that
when two homologous nucleotides are chosen randomly, they are different (Nei,
1987). A general pattern is seen in population studies using these two parameters
(Grant and Bowen, 1998). A high h with low π indicates a population had a small
effective population or population bottleneck followed by rapid expansion or
population growth. In contrast, a species with low h and high π indicates
divergence between geographically subdivided populations. If both these
parameters are high, the species has had a large stable population with long
evolutionary histories while a low h and π indicates a recent bottleneck or could
be a founder effect of one or a few mtDNA lineages (Grant and Bowen, 1998).
Therefore, these two parameters can be used to indicate population demography
in combination with the neutrality tests (Fu and Li, 1993; Fu, 1997; Ramos and
Rozas, 2002; Tajima, 1989) and the less sensitive mismatch distribution (Ramos
and Rozas, 2002; Rogers and Harpending, 1992). As seen in the case of the
Chinese panda, demographic analysis is an important part when deciding on
conservation plans. Therefore, it is recommended to use a variety of test when
analyzing populations.
37
The other common parameter for the population differentiation level is the
Wright's (1951) fixation index, FST. This parameter reveals the connection
between populations through gene flow and can be carried out at various
hierarchical levels to identify units to be managed separately. A significantly high
FST indicates low gene flow between populations while a low FST indicates that
the various populations can be considered as a single panmixic unit (Slatkin,
1987). Gene flow may either constrain evolution by preventing adaptation to local
conditions or promote evolution by spreading new genes (Slatkin, 1987).
Therefore, an understanding of adaptive genetic differentiation among
populations is necessary (Allendorf and Luikart, 2007).
In conclusion, the phylogenetic and genealogy analyses, and demographic
analyses should be analysed together for better inferences of intraspecific
variation. This would help to plan for better management, breeding and relocation
programs.
2.3.3 Intraspecific Genetic Diversity of Crocodilians 2.3.3.1 Species Level Divergence within the Dwarf Crocodile (Osteolaemus)
The taxanomic classification of Osteolaemus at the genus and species level have
been in conflict since the early 20th century (Ray et al., 2000). According to
Schmidt (1919), O. tetraspis osborni should be placed in a separate genus,
Osteoblepharon, while Mertens (1943) suggested that O. t. osborni and O. t.
tetraspis should be considered as separate species within Osteolaemus (as cited in
38
Ray et al., 2000). A preliminary intraspecific variation study of Osteolaemus
using mtDNA marker, ND 6 – tRNAglu – cyt b, was carried out with two
individuals from Gabon and eight individuals of unknown origins (Ray et al.,
2000). The high genetic divergence between the Gabon individuals and the
unknown origin individuals was comparable with interspecific divergence albeit
all 10 were morphologically indistinguishable (Ray et al., 2000).
Subsequent phylogeography study of samples originating from Central to West
Africa, carried out with a combination of morphometric characters with mtDNA
and nuclear gene markers, revealed strong support for two separate species (Eaton
et al., 2009). In addition to the two species, O. t. osborni found in the Congo
Basin and O. t. tetraspis from Ogooué Basin, another species, O. sp. nov was also
detected. However, this lineage was not morphologically distinct from O. t.
tetraspis (Eaton et al., 2009).
Since both these studies did not use a common marker, it is unclear if the eight
individuals of unknown origins in the study by Ray et al. (2000) represent O. sp.
nov or another distinct lineage within the genus (Eaton et al., 2009).
2.3.3.2 Low Genetic Diversity Trends in the American Alligator (Alligator missisipiensis) and the Nile Crocodile (Crocodylus niloticus)
In contrast to Osteolaemus, A. missisipiensis showed low genetic diversity and
divergence using mtDNA, microsatellite and allozyme markers (Davis et al.,
2002; Gartiside et al., 1977; Glenn et al., 2002). Population subdivision into East
39
and West of southeastern United States was only detected using microsatellite
markers with a large sampling size (n = 359) over 13 sampling sites and using
more polymorphic loci (Davis et al., 2002). Interestingly, even with a low genetic
diversity, morphological differences were noticed in Alligator of Florida lakes
that share a common drainage system (Davis et al., 2002). Epigenetic and
environmental factors were suggested instead of direct inheritance for this
observation (Davis et al., 2002).
Similarly, the farmed C. niloticus showed no genetic variation using 52 protein
coding loci. Adaptation to a narrow environmental niche was one of the suggested
reasons as mortality, hatchling abnormalities and growth rates were in normal
ranges (Flint et al., 2000).
2.3.3.3 Population Structure in the Black Caiman (Melanosuchus niger) The largest Neotropical predator, M. niger, previously threaten with poaching and
habitat degradation is currently classified as vulnerable under IUCN (Farais et al.,
2004). This crocodilian has a high genetic diversity and the population is at
equilibrium (Farais et al., 2004).
Both the microsatellite and mtDNA cyt b markers showed high genetic diversity
even though the population census indicated a marked reduction of wild
populations. Extensive but recent exploitations are difficult to detect genetically
and field surveys should be incorporated when interpreting genetic information
40
(de Thoisy et al., 2006). The dwindling population of the French Guiana and the
stable population census of Angelique swamp showed similar genetic diversity
(de Thoisy et al., 2006). Vasconcelos et al (2008) suggested that the reduction in
population sizes was not detected by mtDNA due to either a historical population
expansion which left a strong signature on the mtDNA genome, or the
exploitation rate was too short with respect to the generation time of this caiman,
or the difficulty in detecting genetic drift due to the historical expansion and long
generation time.
The population differentiation detected was attributed with isolation – by –
distance over larger geographical region and by ecological differences between
the closely located white and black water region in French Guiana and Brazil (de
Thoisy et al., 2006). On a global scale, though populations from Ecuador, Brazil
and the French Guiana were significantly isolate, the gene flow levels were
sufficient for recolonization processes (de Thoisy et al., 2006).
2.3.3.4 Population Structure and a Divergent Lineage of the Spectacled Caiman (Caiman crocodilus)
Similar to M. niger, C. crocodilus has a high genetic diversity in spite of reduced
population size from census studies which showed distinct phylogeography trend
(Farais et al., 2004; Vasconcelos et al., 2006; Venegas – Anaya et al., 2008).
Using mtDNA COI and cyt b, populations of C. c. fuscus were differentiated into
the Caribbean Costa Rica population and a wider population unit from the
Caribbean coast of Colombia to the Pacific Costa Rica that corresponds to the
41
intervening mountains (Venega – Anaya et al., 2008). C. c. fuscus was also found
to be expanding northward into C. c. chiapasius range due to habitat degradation
which may result in hybridisation of the two caimans. A divergent and cryptic
mtDNA lineage was detected but was indistinguishable from C. c. crocodilus
based on morphology (Venega – Anaya et al., 2008).
2.3.3.5 Genetic Diversity Trends in Cases of Hybridization between Morelet’s crocodile (Crocodylus moreletii), American crocodile (C. acutus) and Cuban crocodile (C. rhombifer)
These crocodiles faced severe exploitation previously and all three show the same
trend of high genetic diversity and a population at equilibrium. The phylogenetic
tree showed some of C. moreletii clustered together with C. acutus and had
genetic divergence comparable to interspecific levels, suggesting hybridisation
(Ray et al., 2004). The population at Banana Bank Lagoon was differentiated
from other populations. But when the hybrid C. moreletii were not included in the
analysis, population subdivision was not detected (Ray et al., 2004).
Cedeno – Vasquez et al. (2008) found that hybridisation of C. moreletii and C.
acutus was higher at the Yucatan Peninsular. Using nuclear and mtDNA markers,
hybridisation was found to be bidirectional with the initial generation consisting
of female C. acutus cross with male C. moreletii (Rodriguez et al., 2008).
Because C. moreletii haplotypes were detected with mtDNA markers, subsequent
backcrossing of this hybrid generation with either crocodiles produced either C.
moreletii or C. acutus haplotypes (Cedeno – Vasquez et al., 2008).
42
Hybrids of C. rhombifer and C. acutus were also detected using mtDNA markers
and morphological characters (Weaver et al., 2008). Within C. rhombifer, two
distinct lineages (� and ß) were detected with mtDNA markers. The microsatellite
markers too detected two distinct lineges (I and II). The combination of this data
suggest that the mtDNA � lineage consisted of hybrids of C. acutus with the I and
II lineages (Weaver et al., 2008).
Therefore, crocodiles identified in the wild on field surveys may be pure C.
rhombifer, C. acutus, C. moreletii or hybrid and the wild population size could be
much lower than documented (Weaver et al., 2008)
In conclusion, the main trend in the intraspecific variation of crocodilian is a high
genetic diversity (with the exception of A. missisipiensis and C. niloticus) even
with small wild populations and most populations are at equilibrium, which does
not reflect the census of crocodilians in the wild. Except when ecological factors
are influencing population structure, sufficient gene flow exists in subdivided
populations. Hybridisation and divergent lineages have also been detected in wild
populations which directly affect the implementation of proper management
strategies of these populations.
43
CHAPTER 3
MATERIALS AND METHODS
3.1 Sample Collection 3.1.1 Sampling Sites
Blood samples of Tomistoma specimens were collected from various locations
within Malaysia, Singapore, Hong Kong and Indonesia (Table 3.1). Samples from
Sumatra (but in captivity in Jawa), Peninsular Malaysia, Sarawak and East
Kalimantan were known to be from the respective geographical region. Though
the precise location of the samples from Peninsular Malaysian is not conclusive,
all samples are from the peninsular of Malaysia except for two hatchlings whose
origin could not be ascertained.
Samples from Singapore, the Cikananga Wildlife Rescue Center in Jawa and
Hong Kong Wetland Park were of unknown origins. Singapore’s samples are
thought to be from Malaysia (A. Matthews, pers. comm.) but were treated as
unknown origin since documentations to support this claim were lacking. The
samples from these holding areas were included in this study to document the
genetic variability, identify which maternal lineage they belonged to and how
these holding areas can contribute in conservation of this species.
44
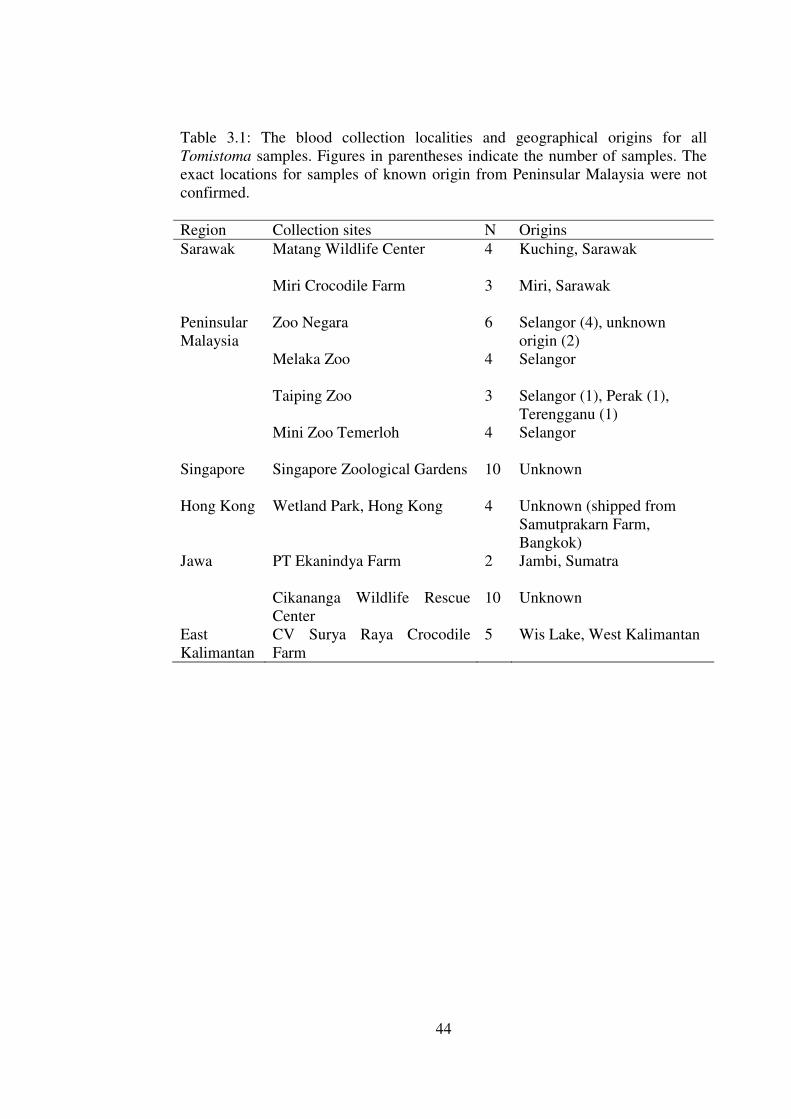
Table 3.1: The blood collection localities and geographical origins for all Tomistoma samples. Figures in parentheses indicate the number of samples. The exact locations for samples of known origin from Peninsular Malaysia were not confirmed. Region Collection sites N Origins Sarawak Matang Wildlife Center
4 Kuching, Sarawak
Miri Crocodile Farm
3 Miri, Sarawak
Peninsular Malaysia
Zoo Negara
6 Selangor (4), unknown origin (2)
Melaka Zoo
4 Selangor
Taiping Zoo
3 Selangor (1), Perak (1), Terengganu (1)
Mini Zoo Temerloh
4 Selangor
Singapore Singapore Zoological Gardens
10 Unknown
Hong Kong Wetland Park, Hong Kong 4 Unknown (shipped from Samutprakarn Farm, Bangkok)
Jawa PT Ekanindya Farm
2 Jambi, Sumatra
Cikananga Wildlife Rescue Center
10 Unknown
East Kalimantan
CV Surya Raya Crocodile Farm
5 Wis Lake, West Kalimantan
45
3.1.2 Manual Restraint
Each Tomistoma was physically restraint before any blood was drawn. As a safety
measure and ease of handling the crocodilian, the water in the moat was drained
before pulling the Tomistoma with a lasso around both jaws to an area suitable for
manual immobilisation. A gunny sac was then placed onto the eyes and head area
of the crocodilian as visual barrier before three people can sit on the dorsal of the
entire crocodile to hold it down and immobilize it. The snout was secured by
covering the upper and lower jaw using parachute strings or 6 mm polystyrene
rope together with the gunny sac. Smaller strings provide better security for the
jaws as bigger ropes can loosen during immobilization. The fore and hind limbs
are then tied to each other with 6 mm polystyrene rope or parachute strings to
secure immobility before blood is drawn.
Release was done by removing the 6 mm polystyrene rope from the limbs and
snout, followed by the 2 cm polystyrene rope around the body and mouth. The
people sitting on these animals then moved away before the visual barrier is
removed using a long rattan.
3.1.3 Blood Collection
Blood collection sites included the caudal vein (approached dorsally or ventrally)
and the supravertebral vein at the post occipital site. For the tail bleed, the caudal
vein is at the midline about 10 cm from the vent (Figure 3.1). For the ventral
approach to the caudal vein, the crocodilian was restrained on its back (ventral
46
facing up) while for the dorsal approach to the caudal vein and supravertebral
vein, the crocodile remained with its dorsal facing up. The site at the post
occipital was at the dorsal midline from the cranium platform (about 1 – 3 cm in
young adults to larger crocodiles).
Blood collection site was cleaned with alcohol and an 18 G spinal needle
(SPINOCAN, B. Braun Medical Inc) was introduced vertically into the site until
close to the vertebrae (Appendix 1). A syringe with 1 – 2 ml of 10 % EDTA was
used to collect blood. For both the caudal and supravertebral veins, the venous
sinus is located by aspirating blood with the syringe.
Supravertebral Vein
Caudal Vein
Vent
Figure 3.1: Location of the blood sampling sites. (A) The supravertebral vein at the post occipital site. (B) The caudal vein of the tail for the ventral approach.
(B) (A)
47
A minimum of 10 ml blood was targeted to be collected. The blood collected
from each T. schlegelii was placed into two 15 ml Falcon tubes and additional 1 –
2 ml of 10 % EDTA was added. Povidion Iodine and pressure are applied to the
site of blood collection to minimize bleeding and infection after collection.
The Indonesian samples were collected and preserved on QIAcard FTA Spots
(Qiagen). Only one drop of blood was placed onto each card for each individual.
Because of the extensive travelling for samples collection in both Java and
Kalimantan, the FTA cards, which provide convenience in transportation of
samples and proper storage of samples and DNA at room temperature, were used.
3.1.4 Sample Storage
Blood was centrifuged at 4000 rpm for 20 minutes (EBA 21, Hettich Instruments)
to separate the red blood cells (RBCs) and plasma. Both plasma and RBCs were
stored in separate 15 ml Falcon tubes at -20ºC.
The Indonesian samples on the QIAcard FTA Spots (Qiagen) were stored at room
temperature in the laboratory.
3.2 Primer Development
Primers for the cytochrome b – control region (cyt b – CR) and the protein
coding ND 6 – tRNAglu – cyt b were specifically designed based on sequence of
Tomistoma schlegelii from Genbank (AJ810455) using PrimerSelect in
DNASTAR Lasergene version 7.0 (DNASTAR, Inc). Sequence positions and
48
limits were set manually while melting temperatures were set between 45 to 58ºC.
Primer locations were restricted to 100 – 200 bp for each pairs while all other
parameters were left as default. The primers were checked for the gene region,
product length, primer dimers and hairpins formation. Melting temperature
differences were limited to not more than 5ºC. As the sequencing for the
repetitive regions in the mtDNA control region involved a large area
(approximately 2.5 kb) three overlapping sets of primers were designed for the
control region to cover the entire region.
3.3 Laboratory Analysis 3.3.1 DNA Extraction
Total DNA extraction was isolated following Chong et al. (2000) for whole
blood. A total of 20 μl of RBCs were lysed with 1 % SDS and 400 �g/ml
proteinase K incubated at 37°C overnight, followed by separation of DNA by
precipitating proteins using phenol:chloroform:isoamyl alcohol (25:24:1) and
chloroform:isoamyl alcohol (24:1). DNA was precipitated from the solution using
pure ethanol. The precipitated DNA was eluted in 30 μl of 10 mM Tris – HCl
buffer at 4°C overnight before storage at -20ºC.
The DNA from QIAcard FTA Spots was extracted following recommendation by
the supplier for DNA extraction. Using a 1.2 mm coring device, a disc from the
cards is removed and placed into PCR tubes. This disc was washed three to four
times with the FTA Purification Reagent, incubating about 5 minutes each time at
49
room temperature. Subsequently, the disc was washed with 1X TE buffer for a
total of three to four times using a pipette. Finally, the disc was added with 50 -
100 μl of 1X TE buffer in a fresh PCR tube and incubated at 37°C for half an
hour. The disc was then discarded. The remaining TE buffer was quantified for
the DNA concentration and used in the respective PCR protocols.
3.3.2 DNA Quantification
DNA concentration was determined with the Biorad SmartSpecTM Plus
spectrophotometer using absorbance at 260 nm. A total of 1 μl of extracts were
diluted into 100 μl of 10 mM Tris – Cl and calculation was based considering this
dilution factor. DNA purity was estimated by absorbance ratio of 260 / 280 nm.
Readings were repeated three times and the average was calculated to improve
accuracy.
Gel electrophoreses was carried out by running 1 μl of extracted DNA mixed with
1 μl of loading dye on a 1 % agarose gel at 80 V for 45 minutes to view the
intactness of the extracts using the 1 kb ladder (Vivantis) as reference. After gel
electrophoresis, the gel was stained in ethidium bromide solution for 5 minutes
before viewing with GeneSnap version 7.0.4 (Synoptics Ltd).
3.3.3 PCR Optimization
One sample each from Peninsular Malaysia and Sarawak was used to optimise
two different PCRs for the two fragments of the non – coding gene, and one each
50
for the protein coding fragment and the repetitive region at the 3’ of the control
region. The PCR parameters that were optimized were the Magnesium (Mg2+),
primer and DNA concentration and the annealing time (Table 3.2). For the
mtDNA repetitive region, the PCR cycles were also optimized.
Table 3.2: List of optimum PCR parameters according to the primers sets.
Primer Set
Primer concentration (mM)
Annealing temperature (°C)
Elongation duration (sec)
PCR Cycles
Set I 0.3 54 45 35
Set II 0.3 55 25 35
Set III 0.2 55 35 35
An amplified DNA volume of 5 μl was mixed with 1 μl of loading dye before
loading it onto a 1 % agarose gel (Vivantis). The gel was then stained with 1 %
ethidium bromide and viewed with GeneSnap version 7.0.4 (Synoptics Ltd).
3.3.4 DNA Purification
SV spin columns kit by GENEALL (General Biosystems, Inc) was used in DNA
purification before downstream processes. PB Buffer was added to the PCR mix
at 5:1 ratio and centrifuged at > 12,000 rpm and the column was washed with NW
Buffer and centrifuged at > 12,000rpm. An additional centrifuge step to ensure
proper removal of NW buffer was carried out before elution buffer was placed at
the centre of the column. After a standing period of 10 minutes, the column was
centrifuged and eluted DNA was stored at -20°C. If smearing was seen on the
51
PCR products gel image, the PCR products were run on 1 % agarose gel and the
band of interest, estimated using the 100 bp DNA ladder, was excised by cutting
the gel after electrophoresis at 80 V for an hour. The gel slice was weighed and
the GB Buffer was added at 3:1 ratio of buffer to gel. The gel slice was incubated
at 50°C until gel was completely melted (5 – 10 minutes). The mixture was then
placed into the SV column and centrifuged at > 12,000 rpm. The SV column was
centrifuged again with GB Buffer to ensure removal of all traces of agarose gel
before the washing of column procedure, similar to the direct gene clean method.
3.3.5 Cloning
Cloning was carried out for the PCR products of the VNTRs region using the
Invitrogen Cloning Kit following the regular chemical transformation protocol,
under cloning of large PCR products, provided by the suppliers. Luria – Bertani
(LB) agar with 50 μg / ml Ampicillin was prepared on petri dishes and once
solidified the Petri dishes were inverted and left overnight at room temperature.
The purified PCR product was then mixed with plasmid vector (pCR2.1–TOPO)
and salt solution and incubated at room temperature before adding 2 μl of this
mixture into the thawed competent cells, E. coli strain TOP10 (Invitrogen). This
mixture was then treated with heat shock for 30 seconds at 42°C after incubation
on ice. The commercially prepared Super Optimal broth with Catabolite
repression (S.O.C) media (Invitrogen) was added to these cells and incubated at
37°C before spreading on pre-warmed selective agar plates which has been spread
with X-gal. Plates were incubated at 37°C overnight. Each of the white (positive)
52
colonies were then individually spread onto separate petri dishes containing LB
agar and incubated at 37°C overnight. About 10 colonies were selected from each
petri dish and incubated overnight at 200 rpm and 37°C in LB Broth containing
50 μg / ml Ampicillin.
3.3.6 Alkaline Lysis Plasmid Extraction and Restriction Enzyme Digestion
The plasmids were extracted using Alkaline Lysis method following the protocol
by Sambrook and Russell (2001) before confirmation of insert using restriction
enzyme (RE) digestion. The bacterial cells were lysed when the plasmid is
incubated on ice with 0.2 N NaOH and 1 % SDS and the DNA is separated from
the cell debris by adding potassium acetate. The mixture was centrifuged using
MicrofugeR 22R Refrigerated Microcentrifuge (Beckman Coulter Inc) and the
supernatant was separated from the pelleted debris. The DNA was precipitated
using isoporpanol containing 5 M potassium acetate and centrifuged again. The
pelleted DNA was separated from the supernatant and washed with 70 % ethanol
before resuspension of DNA in 10 mM Tris – HCl.
RE digestion was carried out using 1 μl of extracted plasmid with 1μl of EcoR1
for 1 – 3 hours at 37°C followed by inactivation at 65°C for 20 minutes. The
EcoR1 sites flank the insert and therefore produced two bands, a 3.9 kb vector and
the 2.5 – 3.0 kb insert.
53
3.3.7 Sequencing
Sequencing was done using ABI 3730XL DNA Analyser in both directions with
PCR primers for the two fragments of the control region and the protein coding
region. For the repetitive region, in addition of the PCR primers, internal primers
were used to sequence homoplasmic bands while the M13 primers were used for
the heteroplasmic bands that were cloned.
3.4 Data Analysis of mtDNA for Intraspecific Variation 3.4.1. Sequence Identity and Alignment
Sequences identity was checked using FinchTV version 1.4 by manual
comparison of the chromatograph with the sequences generated. A BLAST search
for gene homology was conducted before doing the multiple sequence alignment
and nucleotide composition using ClustalW in MEGA version 4 (Tamura et al.,
2007).
3.4.2 Assembling Sequences of the Two Sets of the Control Region Primers
A single contig comprising of 888 bp was obtained with SeqMan program in
DNASTAR Lasergene version 7.0 (DNASTAR, Inc) when the sequences from
the 701 bp and the 417 bp PCR product for the control region (primer set I and II)
were overlapped.
54
3.4.3. Partition Homogeneity Test
A partition homogeneity test to decide if concatenation of the two different
genetic markers for the intraspecific variation gene markers (cyt b – CR and the
ND 6 – tRNAglu – cyt b) was possible was done using PAUP 4.0 beta version
(Swofford, 2003) with parsimony criteria and branch and bound search.
3.4.4 Genetic Diversity 3.4.4.1 Polymorphic Sites and Number of Haplotype
Polymorphic sites and haplotypes were identified using DnaSP version 5 (Librado
and Rozas, 2009) for each marker separately.
3.4.4.2 Haplotype and Nucleotide Diversity
Standard indices of genetic variation, haplotypic diversity, h, and nucleotide
diversity, �, defined by Nei (1987) was calculated using DnaSP version 5
(Librado and Rozas, 2009). These two parameters were estimated first, for a total
number of samples and then separately for the geographically associated samples
of known origins only followed by for each collection sites, considering all
samples held in collection each site as a population.
3.4.5 jModeltest
jModeltest software (Posada, 2008) was used to search for the best fit model for
the data using only ingroup as to maximise the accuracy of the model for the
Maximum Likelihood tree. The likelihood settings were set at default while the
55
Akaike Information criterion (AIC) was set to calculate parameters importance
and model averaging.
3.4.6 Genetic Divergence
Pairwise genetic distance between all haplotypes was calculated using the Tamura
Nei (1993) model which incorporates transition (Ti) and transversion (Tv)
substitution rates, and the differences in nucleotide frequencies. Gavialis
gangeticus (Genbank Accession AJ810454) was used as an outgroup to compare
the distances of between genus and within species of Tomistoma.
For comparison with intraspecific data of other crocodilian, we used the Tajima –
Nei distance (Tajima and Nei, 1984) which assumes an equality of substitution
rates among sites and between substitution implemented in MEGA version 4 beta
(Tamura et al., 2007) for the ND 6 – tRNAglu – cyt b fragment. The K2 model
(Kimura, 1980), the uncorrected pairwise distance method (Nei and Kumar, 2000)
and HKY85 model were estimated for the cyt b – CR data. The K2 model
considers the Ti and Tv substitution rates with equal nucleotide frequencies and
equal substitution among sites while the uncorrected pairwise distance method
considers the proportion of nucleotide sites (p) at which two sequences being
compared are different. The HKY85 (Hasegawa et al., 1985) distance was
calculated using PAUP over 543 bp of control region sequences while the K2
distance was based on 842 bp and uncorrected pairwise distance was based on
459 bp of the control region.
56
3.4.7 Phylogenetic Tree
Phylogenetic trees were generated using PAUP version 4b (Swofford, 2003) for
distance and character based approaches. TREEVIEW (Page, 1996) was used to
view and edit the Neighbour Joining and Maximum Parsimony trees while
MEGA version 4 (Tamura et al., 2007) was used for the Maximum Likelihood
trees. Gavialis gangeticus (Genbank Accession AJ810454) was used as an
outgroup to root the trees.
3.4.7.1 Neighbour Joining Tree
The distance based Neighbour Joining (NJ) tree was generated using the Tamura
– Nei model (Tamura and Nei, 1993) with 1000 bootstrap replicates.
3.4.7.2 Maximum Parsimony Tree
The maximum parsimony trees were carried out by heuristic search using the tree
bisection reconnection (TBR) with all characters treated as unordered with equal
weight. A 50 % majority rule command was used to search for the best tree from
all the trees produced. The confidence value for the branches was generated by
1000 bootstraps replicates (Felsenstein, 1985).
3.4.7.3 Maximum Likelihood Tree
Using the results form jModeltest, the Maximum Likelihood (ML) tree was
generated by heuristic search using TBR function with 100 bootstrap replicates.
57
3.4.8 Haplotype trees 3.4.8.1 Parsimony Based Haplotype Networks
Haplotype connectivity based on statistical parsimony was done with TCS
(Clement et al., 2000) at 95 % limits. When networks were not connected,
connection limits were manually adjusted until all haplotypes were connected.
3.4.8.2 Distance Based Haplotype Networks
Distance based network connection were generated using minimum spanning
network (Kruskal, 1956, Prim, 1957) in Arlequin 3.1 (Excoffier et al., 2005) and
viewed with TreeView (Page, 1996).
3.4.9 Gene Flow and Population Division 3.4.9.1 Nearest Neighbour Statistic (SNN)
The extent of population subdivision and gene flow was examined using nearest –
neighbour statistic, SNN, which is a measure of how often the nearest neighbours
sequences are from the same locality in geographic region. It is useful when
population size is small and haplotype diversity is high as in our case (Hudson,
2000). This was analysed by considering only known origins according to
geographical regions (with and without considering the distant lineage, H4) using
DnaSP version 5 (Librado and Rozas, 2009).
58
3.4.9.2. Nucleotide Based Pairwise FST
The pairwise FST and gene flow, NM were estimated using Hudson et al. (1992)
equation based on sequence data in DnaSP version 5 (Librado and Rozas, 2009).
This analysis is more sensitive than the chi square analysis. The pairwise FST
analysis was carried out by 10,000 permutations and pseudorandom number seed,
for the population groupings as in SNN.
3.4.10 Neutrality Test
All the neutrality tests were carried out using DnaSP (Librado and Rozas, 2009).
3.4.10.1 Fu and Li’s D
The D test statistic is based on the differences between the number of mutations
appearing only once among the sequences and the total number of mutations (Fu
and Li, 1993) while the significance values were obtained by computer
simulations assuming that the true value of theta falls into the two tailed test by
DnaSP.
3.4.10.2 Fu’s FS
This test is based on haplotype frequency (Fu, 1997) instead of nucleotide
frequency as the Fu and Li’s D and was carried out using segregating sites. The
significance of the D values was estimated with 10,000 replicates using the
coalescent simulations which assumes a neutral infinite-sites model and a large
constant population size (Hudson, 1990).
59
3.4.10.3 Ramos and Rozas’s R2
The R2, which is suitable for small population sizes (Ramos and Rozas, 2002)
was carried out for both the population growth-decline and constant sizes, using
the pairwise number of differences and significant values were also estimated
using the coalescent simulations with 10,000 replicates.
3.5 Data Analysis for mtDNA Repetitive Regions 3.5.1 Band Size Estimation Precise band sizes on the gel image were identified using AlphaEaseFC Imaging
System version 6.0.2 (Alpha Innotech Corp) by comparing the band sizes of the
DNA ladder in the gel image.
3.5.2 Sequence Alignment
Similar to the intraspecific sequence alignment, sequences identity was checked
using FinchTV version 1.4 by manual comparison of the chromatograph with the
sequences generated and BLAST search for gene homology. The nucleotide
composition and multiple sequence alignment were carried out using ClustalW in
MEGA version 4 (Tamura et al., 2007). Motifs and repetitive sequences were
located using the Find Motif function in MEGA version 4 beta.
3.5.3 Secondary Structure and Free Energy Estimation
RNAstructure version 4.6 (Mathews et al., 2004) was used to generate secondary
structure and to estimate the stable energy levels. The structures are generated
based on minimising the free energy level.
60
CHAPTER 4
RESULTS
4.1 Primer Development
The primer sets I and II were successful in generating sequences flanking the 3’ of
cyt b to the region just before the mtDNA repetitive region for PCR and
sequencing. Set I generated 701 base pairs (bp) from the 3’ of cyt b and Set II
generated 417 bp to the CSB III in control region. For the ND 6 – tRNAglu – cyt b
gene, only one primer set was required, Set III was also successful in generating
570 bp of the target region (Table 4.1).
For the mtDNA repetitive region, located between the CSB III of control region
and the 12S rDNA gene, the forward primer of Set II and a reverse primer located
at the 12S rDNA (H491) were able to amplify the required region for PCR and
sequencing. For the heteroplasmic bands, instead of the PCR primers, M13
primers were used for sequencing. Due to the large band size generated for all the
individuals with PCR (2.5 to 3.0 kb), internal primers designed in an attempt to
sequence the entire length of the products (Table 4.2 and Figure 4.1), also
successfully produced the targeted sequences.
61
Table 4.1: The PCR primers location, sequence and the PCR band size generated for the cyt b – CR, the ND 6 – tRNAglu – cyt b and the mtDNA repetitive region. Primer set Primer location (and PCR product
size) Primer name Primer sequence (5’ to 3’) Fragment size
Set I 58bp of 3’ cyt b to Domain II (before B Box)
L14930 H15630
AGCGGGCAAAATAGAAAACTGA ATAGAGATGCCGGGATTACGAA
701 bp
Set II
Within D Box of Domain II to just after CSB III
L15516 H15932
TATCACTCTCATGTACTCTTCTTG AGCTATTTTCATTTTTATTTCTAT
417 bp
Set III
The last 285bp of ND 6 to 203bp of 5’ cyt b
L13457ND6 H14027CB
CCCCACAAACACCAACCAA CGACGGATGCGAAGGCTATG
570 bp
Set IV
Within D Box of Domain II to 491 bp of 12S rRNA
L15516 H 491
as above TCTCTGGCGGGTGTAGTATGTAAT
~ 2.5 – 3.0 kb
62
Table 4.2: Internal primers used for sequencing of both homoplasmic and heteroplasmic bands. M13 primers were used for initial sequencing of heteroplasmic bands instead of PCR primers (Primer Set IV) Primer name Primer sequence (5’ to 3’)
L15790 TCTATATTTCAGCTATGCCC
H-int GGTGTAGATGTGCCTGATGCC
M13 Forward (-20) GTAAAACGACGGCCAGTG
M13 reverse CAGGAAACAGCTATGACC
Figure 4.1: Locations of the PCR and internal primers for the mtDNA non – coding repetitive region. Bold font indicates the PCR primers while normal font indicates internal primers.
Cyt
b
SPA
CE
R
t RN
A T
hr
t RN
A P
ro
t RN
A P
he
F B
ox
E B
ox
D B
ox
C B
ox
B B
ox
CSB
I
CSB
II
CSB
III
Repetitive Region
12S rRNA
DOMAIN I DOMAIN II DOMAIN III
L14930 L15516 L15790
H-int’ H 491 H15630 H15932
63
4.2 Laboratory Analysis 4.2.1 DNA Extraction and DNA Quantification
Intact DNA with a purity of 1.7 to 1.9 (260 / 280) were obtained with the manual
DNA extraction protocol (Figure 4.2). The DNA concentration ranged between 35
000 ng/ul to 540 000 ng/ul which was diluted to 50 ng/ul for PCR.
4.2.2 PCR Optimisation and DNA Purification
For the Set I, II and III primers, the concentration for MaxTaq at 0.5 U, MgCl2 at
1 mM, 0.2 mM dNTPs and 50ng of DNA was suitable to generate the required
PCR products. The concentration of primer varied for the different primer sets.
The optimized PCR conditions for each primer set generated clear bands with
minimum smearing (Figure 4.3).
Figure 4.2: Gel image of extracted DNA. A 100 bp DNA ladder is on the left of the gel.
1.0 kb
500bp
64
(A)
(B)
(C) Figure 4.3: Gel image of PCR products of the mtDNA control region. (A) Primer Set I from the 3’ cyt b to B Box of Domain II of the mtDNA control region, generating approximately 700 bp fragments. (B): Primer Set II from the B Box of Domain II to the CSB region in Domain III of the mtDNA control region, generating approximately 420 bp fragments. (C) PCR products of the ND 6 – tRNAglu – cyt b marker using primer Set III from the 3’ of ND 6 to 5’ of cyt b. A 100 bp DNA ladder is on the left of agarose gel.
500bp
500 bp
1.0 kb
1.0 kb
1.0 kb
500 bp
65
4.2.3 DNA Purification and DNA Sequencing
The PCR products were purified before sequencing (Figure 4.4). The strong bands
obtained after purification produced good sequencing results with strong, clear
peaks with no or minimal noise. Sequencing was done in both directions (forward
and reverse) to confirm nucleotide identity.
4.3 Data Analysis for Intraspecific Variation 4.3.1 Sequence Identity and Alignment
The comparison of sequences obtained for the forward and reverse sequences
with the chromatograph showed identical sequences. BLAST search results
showed a maximum identity of 98 – 100 % over a query coverage of 100 % with
the available Tomistoma sequence in Genbank. The Set I and II markers were
overlapped to generate a single contig. The final alignment for Set I and Set II as
a contig was 888 bp from tRNA – Thr to CSB II while the final alignment for Set
III primers was 431 bp.
Sequence obtained, 888 bp from the cyt b – CR and 431 bp from the ND 6 –
tRNAglu – cyt b gene, had been deposited into the Genbank (Appendix 2).
Nucleotide composition for the cyt b – CR marker was T (31.3 %), C (26.8 %), A
(28.9 %) and G (13.0 %) while ND 6 – tRNAglu – cyt b was T (23.7 %), C (29.9
%), A (34.3 %) and G (12.1 %).
66
(A)
(B)
(C)
Figure 4.4: Gel image of purified PCR products of the mtDNA control region. (A) Primer Set I and (B) Primer Set II. (C) Primer set III (ND 6 – tRNAglu – cyt b). A 100 bp DNA ladder is on the left of agarose gel.
500 bp
500 bp
1.0 kb
1.0 kb
1.0 kb
500 bp
67
4.3.2 Partition Homogeneity Test
Partition homogeneity test for the total length of 1319 bp from the concatenate
data indicated the two markers were significantly congruent with a p value of 1.0.
Since using multiple genes provide better estimates than individual genes, three
sets of data consisting of the cyt b – CR marker, ND 6 – tRNAglu – cyt b marker
and a concatenation of these two were used in the subsequent analysis. These
three data sets were congruent in all analyses except for the population structure
analysis.
4.3.3. Genetic Diversity
4.3.3.1 Polymorphic Sites and Number of Haplotypes
There were 22 polymorphic sites with 20 transitions, one transversion and an
indel, which resulted in five haplotypes for the cyt b – CR marker. For the ND 6 –
tRNAglu – cyt b marker, 12 polymorphic sites with 10 transitions and two
transversions also resulted in five haplotypes (Table 4.3). The sequence alignment
of 1319 bp from the concatenate data revealed six haplotypes. The H1 and H2
haplotypes differed by one transition in the cyt b – CR but had identical sequence
over the 431bp of the ND 6 – tRNAglu – cyt b marker. However, H1 and H3
differed by one transition in the ND 6 – tRNAglu – cyt b region. The ND 6 –
tRNAglu – cyt b marker was equally sensitive as the control region as it was able
to detect a different haplotype from some individuals with H1 haplotype of the
mtDNA control region. The haplotype H4 had seven and eight unique base
substitutions in the ND 6 – tRNAglu – cyt b and the cyt b – CR marker
68
Table 4.3: Location of polymorphic sites for the ND 6 – tRNAglu – cyt b and cyt b – CR sequences. Six haplotypes, H1 to H6 were detected from the total of 56 samples.
Position of polymorphic sites N
13522
13554
13557
13567
13620
13687
13693
13715
13735
13797
13828
13935
15029
15107
15123
15180
15193
15223
15241
15254
15293
15295
15418
15442
15590
15608
15620
15655
15700
15704
15729
15768
15805
15857
H1 C A G A G T T C C G G T T C C T T C C G C A C T A T C C A T T A T A 21 H2 . . . . . . . . . . . . . . T . . . . . . . . . . . . . . . . . . . 13 H3 . . . G . . . . . . . . . . . . . . . . . . . . . . . . . . . . . . 9 H4 G G T . . C C T T . A C . T . C C T . A T G T C G C T . . . C G . . 3 H5 . . . . A C . . T A . . G T . C . . T . . G T C . . . T G C C . - G 2 H6 . . . . . C . . T A . . G T . C . . T . . G T C . . . T G C . . . G 8
NADH 6
t RN
A G
lu
Cyt b
t RN
A T
hr
Spacer
t RN
A Pro
Spacer
t RNA Phe
Spacer
Dom I
Dom II
Dom III
ND 6 – tRNAglu – cyt b from the last 222bp of the ND 6 gene to the first 127 bp of cyt b
cyt b – CR from the 3’ of cyt b to Domian III of the control region
69
respectively (Table 4.3). These nucleotide sites clearly distinguished H4 from the
other haplotypes. The H5 (of unknown origins) and H6 haplotypes found in East
Kalimantan differed by only one transition in each marker. When populations of
known origin (Peninsular Malaysia, Sarawak, East Kalimantan and Sumatra) were
compared, each population had one haplotype which was distinct between
geographical regions with the exception of Peninsular Malaysia (Table 4.4).
Peninsular Malaysia had three haplotypes, which consisted of the most divergent
haplotype, H4, the most commonly found haplotype, H1 and the Sarawak
haplotype, H2 which differs with H1 by one base substitution. The two specimens
of unknown origins had the H5 haplotype. Results from locations of unconfirmed
origins (Jawa, Singapore Zoo and Hong Kong) did not reveal any new haplotypes
for the Tomistoma in this study.
4.3.3.2 Haplotype and Nucleotide Diversity
The haplotype diversity, h was similar for both markers at 0.6 and the nucleotide
diversity, � were 0.6 % and 0.5 % for the cyt b – CR and ND 6 – tRNAglu – cyt b
marker respectively when all samples were considered. When only samples of
known origins were considered, h for the cyt b – CR marker was slightly higher at
0.70 compared to 0.6 for ND 6 – tRNAglu – cyt b marker, while � was 0.66 and
0.60% for the cyt b – CR marker and ND 6 – tRNAglu – cyt b marker respectively
(Table 4.5).
70
Table 4.4: Haplotype distribution from the respective sampling regions. Origin Peninsular
Malaysia Sarawak Sumatra Kalimantan unknown unknown unknown unknown Total
Table 4.5: List of haplotype (h) and nucleotide (�) diversities of the two mtDNA markers and concatenate data. Diversities estimates are for a total number of 56 samples. The diversities estimate for 30 samples of known origin is also presented. Groups of samples All samples Samples with known
geographical origins Diversity
parameters Markers
h � (%)
h � (%)
cyt b – CR 0.646 0.556 0.708 0.66 ND 6 – tRNAglu – cyt b 0.592 0.485 0.570 0.60
Concatenate 0.769 0.535 0.777 0.64
Overall haplotype diversity, using the concatenate data, was 0.77 with Peninsular
Malaysia showing highest haplotype and nucleotide diversity (h = 0.63,
π = 0.00770). In terms of holding areas, the highest haplotype diversity was seen
in Zoo Negara, Malaysia (h = 0.867, π = 0.01093) followed by Cikananga
Wildlife Rescue Center, Jawa (h = 0.733, π = 0.00531). Singapore Zoo and Hong
Kong Wetland Park had two haplotypes each while Sumatra, West Kalimantan,
Sarawak (2 collection sites) and Mini Zoo Temerloh had one haplotype each
resulting in no genetic diversity. When geographical regions were considered,
only Peninsular Malaysia showed genetic variation (Table 4.6).
4.3.4 jModeltest
The model revealed by jModeltest for the concatenate data and the cyt b – CR
data was the TPM2uf+G model. However, for the concatenate data the proportion
72
of invariable sites was 0.8627. The ND 6 – tRNAglu – cyt b data had equal rates
with the TPM2uf model (Table 4.7).
Table 4.6: Haplotype and nucleotide diversities of the sampling localities using concatenated data. Holding areas n h � Hong_Kong 4 0.500 0.00038 Singapore 10 0.533 0.00040 Jawa 10 0.733 0.00531 Sumatra (PT Ekanindya Crocodile Farm)
3 0 0
Kalimantan (Surya Crocodile Farm) 5 0 0 Sarawak 7 0 0 Zoo Negara 6 0.867 0.01093 Zoo Melaka 4 0.667 0.01162 Taiping Zoo 3 0.667 0.00051 Mini Zoo Temerloh 4 0 0 Total 56 0.769 0.00535 Geographical region (using only known origins)
Sumatra 3 0 0 Peninsular Malaysia 15 0.632 0.00770 Sarawak (West Borneo) 7 0 0 Kalimantan (East Borneo) 5 0 0 Table 4.7. The jModeltest results for the three data sets. Marker Concatenate Data cyt b – CR Data ND 6 – tRNAglu –
The genetic distance calculated with concatenate data was between 1.2 to 1.8 %
for the H4 haplotype while the other haplotypes had a genetic divergence that
ranged between 0.1 to 1.3 % using the Tamura Nei model (1993) (Table 4.8).
Similarly, with the cyt b – CR and the ND 6 – tRNAglu – cyt b data, the H4
haplotype showed the highest genetic divergence (Appendix 3).
Table 4.8: Genetic distance of the concatenate data using Tamura-Nei distance. Tamura and Nei, (1993) genetic distance is based on unequal base frequencies and unequal ratios of transitions to transversions (Ti:Tv) implemented in MEGA v.4 (Kumar et al., 2004)
H1 H2 H3 H4 H5 H6 H1 -
H2 0.00076
-
H3 0.00076
0.00152 -
H4 0.01777
0.01856 0.01855 -
H5 0.01230
0.01308 0.01308 0.01778 -
H6 0.01074
0.01153 0.01152 0.01777 0.00152 -
Gavialis 0.15510
0.15617 0.15612 0.15494 0.15501 0.15709
Using Tajima – Nei (1984) model, the genetic distance of the ND 6 – tRNAglu –
cyt b marker ranged from two to ten fold higher when other haplotypes were
compared to the H4 haplotype. The lower range of the genetic divergence from
the cyt b – CR of Tomistoma (0.1%) is comparable with the Osteolaemus
74
population (0 – 0.7 %) (Eaton et al., 2009) but was six times lower from the
divergence between Osteolaemus species (Eaton et al., 2009) (Table 4.9).
Table 4.9: Genetic distance in percentage using Tajima Nei, Kimura 2 Parameter, the uncorrected pairwise distance and the HKY model. The Tamura Nei method was carried out the total base pairs generated in this study for the respective genes. The cyt b – CR was truncated to 842 bp, 459 bp and 543 bp for the Kimura 2 Parameter, the uncorrected pairwise distance method and the HKY model respectively for comparisons with Osteolaemus (Ray et al., 2000; Eaton et al., 2009), Crocodylus rhombifer (Weaver et al., 2008) and C. moreletti (Ray et al., 2004) Distance models
Species cyt b – CR ND 6 – tRNAglu – cyt b
Tomistoma - 0 – 2.4 Tajima – Nei
Osteolaemus -
0.3 – 9.8 Tomistoma
0.1 – 1.8
-
Osteolaemus (within species)
0 – 0.4
-
K2P
Osteolaemus (between species)
11.5 – 12. 4
-
Tomistoma
0 – 2.4
-
C. rhombifer
1.6
-
Uncorrected pairwise distance
C. rhombifer vs C. acutus
3.4 – 4.1
-
Tomistoma
0 – 0.0188
-
C. acutus
0.0048
-
C. moreletti
0.0062
-
HKY85
C. acutus vs C. moreletti
0.0553
-
75
4.3.6 Phylogenetic Trees The Neighbour Joining (NJ), Maximum Parsimony (MP) and Maximum
Likelihood (ML) phylogenetic trees had congruent topology for the concatenate
data (Figure 4.5) and individual markers data (Appendix 4). Three main clades
were seen in all the trees with the H4 lineage as the basal clade with very high
bootstrap values of either 100 % or 99 % (Figure 4.5). The other two major clades
consisted of subclades comprising haplotypes that differed by only one base
substitution in both the genetic markers. The H1 haplotype from Peninsular
Malaysia, H2 haplotype from Peninsular Malaysia and Sarawak and the H3
haplotype from Sumatra grouped into one major clade whereas the H5 haplotype
(unknown origins) and H6 haplotype from East Kalimantan always clustered into
another major clade. The two individuals whose origins were unknown (H5
haplotype) were always grouped into the East Kalimantan clade in all trees.
Samples with unknown origins from Singapore Zoo clustered with the subclades
representing Peninsular Malaysia and Sarawak while samples from Jawa clustered
with the subclades representing Sumatra, Peninsular Malaysia and Kalimantan.
Samples from Hong Kong clustered with those of Sumatra and Peninsular
(A) Figure 4.5: Phylogenetic trees generated with concatenate data. Trees generated with PAUP v4.0b using Gavialis as an outgroup. Clades are indicated following lineages (H1 to H6) and geographical regions are bracketed. (PM = Peninsular Malaysia, Sar = Sarawak, Sum = Sumatra, EK = east Kalimantan, U = Unknown). (A) The Neighbour Joining tree following Tamura Nei (Tamura and Nei, 1993) model. (B) The Maximum Parsimony tree. (C) The Maximum Likelihood tree.
4.3.7 Haplotype Trees 4.3.7.1 Parsimony and Distance Based Haplotype Network The H4 haplotype could not be reliably connected to the other haplotypes at 95 %
probability level for the concatenate (Figure 4.6) and cyt b – CR data (Appendix
5). The 95 % connection limit for Tomistoma was 8 steps for the ND 6 – tRNAglu
– cyt b marker which connected all haplotypes (Appendix 5). The concatenate
data haplotype network could only be connected manually at 23 steps (Figure 4.7)
and for the cyt b – CR marker at 14 steps (Appendix 5). Haplotype connections
within the distinct (95 %) networks remained unchanged in the manually joined
networks. This lineage appeared on a different evolutionary branch in the
minimum spanning network while the other haplotypes were placed together on a
separate evolutionary branch for the concatenate data (Figure 4.8) and individual
marker data (Appendix 5).
80
Sumatra Sarawak
Peninsular Malaysia
Peninsular Malaysia
West Kalimantan
Unknown
Figure 4.6: Haplotype network using concatenate data. The H4 haplotype was not parsimoniously connected at the 95 % limit with TCS.
81
Sumatra, Peninsular Malaysia, Sarawak
Figure 4.7: Haplotype network using concatenate data connected manually at 23 step connection limit. Figure 4.8: Distance based haplotype tree using concatenate data. H4 lineage is on a different evolutionary branch and is reciprocally monophyletic from other lineage.
Peninsular Malaysia
East Kalimantan
Unknown
H 1
H 2
H 3
H 4
H 5
H 6
82
4.3.8 Gene Flow and Population Division (SNN and Pairwise FST)
The SNN analysis and pairwise FST for ND 6 – tRNAglu – cyt b, cyt b – CR and the
concatenate data were congruent for a well differentiated East Kalimantan
population from other regions.
SNN results showed that the populations from the four geographical regions
(Sumatra, Peninsular Malaysia, Sarawak and East Kalimantan) were significantly
differentiated with almost no gene flow using the concatenate data (Table 4.10
and Table 4.11). The cyt b – CR also showed four main populations for
Tomistoma that are geographically associated (Appendix 6). However, the SNN
analysis using the ND 6 – tRNAglu – cyt b data found only three well
differentiated populations, the Sumatran population, Peninsular Malaysia –
Sarawak population and the East Kalimantan population (Appendix 6). The
incongruence between the Sarawak and Peninsular Malaysian populations with
the ND 6 – tRNAglu – cyt b could be due to the failure of this marker to
differentiate the two different haplotype, H1 and H2 which were detected in the
cyt b – CR and concatenate data. Therefore, in this study, the concatenated data
would be used to discuss the population analysis of Tomistoma.
The pairwise FST findings were congruent with the SNN analysis for the
concatenate data set which separated populations of Tomistoma into the four
geographical regions. However, the pairwise FST was incongruent between the
two individual markers for the populations from Sumatra, Peninsular Malaysia
83
and Sarawak. The pairwise FST estimates using the cyt b – CR data set found that
the Sumatran and Peninsular Malaysian population had substantial gene flow
between them whereas the ND 6 – tRNAglu – cyt b data set showed that the
Sarawak and Peninsular Malaysian population were undifferentiated.
The reason for the incongruence between the SNN and the pairwise FST estimates
could be due to the small sampling size in which the SNN analysis is more
powerful (Hudson, 2000) and therefore the discussion for the population structure
would be based on the SNN estimates.
Table 4.10: Population structure estimates using concatenate data. Analysis carried out following geographical regions using samples of known origins, excluding the H4 haplotype. Above diagonal is the SNN values while below diagonal are the FST values. The significant value of the SNN and FST estimates are p < 0.0001 and p < 0.001. The sample size for each population is 12 samples for Peninsular Malaysia, seven for Sarawak, three for Sumatra and five for East Kalimantan. Locations Peninsular
Malaysia Sarawak Sumatra East
Kalimantan Peninsular Malaysia
- 0.82 1.00 1.00
Sarawak
0.82 - 1.00 1.00
Sumatra
0.87 1.00 - 1.00
East Kalimantan
0.99 1.00 -
84
Table 4.11: Gene flow estimates using concatenate data. Gene flow estimated between populations following Nm = 1- FST / 2 FST (Hudson et al., 1992) Locations Nm from FST
Peninsular Malaysia X Sarawak
0.11
Peninsular Malaysia X Sumatra
0.07
Peninsular Malaysia X East Kalimantan
0.01
Sarawak X Sumatra
0
Sarawak X East Kalimantan
0
Sumatra X East Kalimantan
0
4.3.9 Neutrality Test
Neutrality tests were carried out when considering all samples as a population and
subsequently with populations of known origins. The Peninsular Malaysia
samples were treated as a population. The neutrality tests could not be carried out
for the other regions because each region only had one haplotype.
The significantly positive Fu and Li’s D indicated that the total populations and
Peninsular Malaysian were at balancing selection, population structure or a recent
bottleneck (Table 4.12). The neutrality tests for the cyt b – CR and the ND 6 –
tRNAglu – cyt b data are in Appendix 7. Though Rozas R2 and Fu’s Fs were
positive, they were not significant when tested with coalescent simulations (p>
0.05) indicating population at equilibrium. However, when the H4 lineage was not
considered in Peninsular Malaysian population, the Fu and Li’s D value was
85
positive but not significant. A non significant neutrality test is unable to reject the
null hypothesis, which assumes a population at equilibrium. For small samples,
the R2 is a more powerful test and therefore for subsequent discussion, the R2
would be used for discussion.
Table 4.12: Neutrality test using concatenate data and samples of known origins only. Bold font indicates significance at p < 0.05. Value in brackets are excluding H4 lineage in Peninsular Malaysia.
Fu and Li’s D Fu’s Fs Rozas R2 Total 1.88496 9.682 0.1069 Total Peninsular Malaysia 1.58616
(0.752) 9.492 (0.297)
0.1694 (0.1515)
4.4 mtDNA Control Region Repetitive Region 4.4.1 PCR Optimisation, DNA Purification and Sequencing
The Set IV primers required higher concentration of MaxTaq (1 U), MgCl2
(3mM) and dNTPs concentration was 0.2 mM while other chemicals
concentration was the same with the other primer sets. The optimum annealing
temperature was at 55°C with a 90 seconds elongation time in a total of 25 cycles.
The target PCR bands were strong with only one individual showing
heteroplasmy (Figure 4.9a) and produced suitable purified DNA for sequencing
(Figure 4.9b). Sequencing for highly repetitive regions in each direction generated
800 – 1000 bp using both PCR or M13 primers and internal primers. Only 14
individuals from the 30 individuals that were amplified for PCR products were
86
selected for sequencing. Five of these were hatchlings from a maternal parent
while the other represented the different PCR band sizes.
(A) (B)
Figure 4.9: Gel image of PCR and DNA purification products for repetitive regions. (A) PCR products using the Set IV primers which amplifies the region of D Box of Domian II to the 491 bp of 12S rDNA at its 5’ region. (B) Gene clean products for the homoplasmic bands of the mtDNA control region repetitive region. A 100 bp DNA ladder is on the left of both images while a 200 bp DNA ladder is on the right of image (A).
4.4.2 Cloning and Restriction Enzyme Digestion
The heteroplasmic bands were cloned prior to sequencing because after indirect
DNA purification, the band intensity was not ideal for sequencing. The RE
digestion on the extracted plasmid produced the two bands of which the 3.9 kb
band is the vector while the 2.5 – 3.0 kb is the insert size (Figure 4.10).
1.0 kb
2.0 kb
1.0 kb
2.0 kb
500bp
1.0 kb
2.0 kb
87
Figure 4.10: Gel image of the restriction enzyme products. A 3.9 kb vector and an approximately 2.5 – 3.0 kb insert of the heteroplasmic PCR product is produced with EcoR I. A 100bp DNA ladder is on the right.
4.4.3 Sequence Identity and Alignment
The comparison of sequences obtained with the chromatograph and with BLAST
confirmed that the sequences are indeed of the mtDNA VNTR of Tomistoma.
BLAST results were between 89 – 93 % for maximum identity while the
maximum coverage was only 45 – 53 % with the Tomistoma sequence available
in Genbank. The maximum coverage was higher (46 – 65 %) when comparing
with Gavialis but maximum identity was lower (52 – 60 %). The forward PCR
primer and forward internal primers were able to overlap to generate a single
contig. Similarly the reverse PCR primers and reverse internal primers were also
overlapped to generate a single contig. The multiple alignment for the region after
CSB III is in Appendix 8.
500bp
1.0 kb
88
Although internal primers were used, the sequences obtained did not overlap at
the VNTR region from both directions due to technical difficulty of sequencing
large sequence sizes of repetitive bases ranging from 2.5 to 3.0 kb as seen in this
study.
4.4.4 General Structure
The amplified fragments flanking the repetitive region of the mtDNA CR from 30
individuals of Tomistoma showed length variation (Figure 4.11A). The shortest
homoplasmic band was 2.5 kb while the longest was 2.7 kb (Table 4.13). The
‘family unit’ showed a uniform band size of around 2.6 kb (Figure 4.11B). The
2.6kb band was also the most common size amongst all individual followed by
the 2.7 kb and 2.8 kb band. Only one individual was heteroplasmic with bands
longer than the homoplasmic bands, at 2.8 kb and 3.1 kb in length.
Sequencing results revealed nucleotide composition of the repetitive region (after
the CSB III region) as AT rich with adenine (41.1 %), tyrosine (31.9 %), cytosine
(16.4 %) and guanine (8.2 %).
Generally, the repetitive region of Tomistoma has two main parts. The region
closer to the CSB III (5’ of the repetitive region) was represented by more than
one form of motifs which is repeated between two to four times while the region
89
closer to the 12S rDNA gene (3’ of the repetitive region) consisted of the tandem
repeats duplicated at least eight times (Figure 4.12 and Figure 4.13).
TK 002
TK 003
TK 022
TK 004
TK 005
TK 023
TK 010
TK 021
TK 019
TK 011
TK 012
TK 017
TK 020
TK 014
TK 015
TK 016
TK 006
TK 030
TK 029
TK 013
TK 018
1.0 kb
500bp
2.0kb
M2 M1 M1
(A)
(B)
1.0kb
2.0kb
3.0kb
1.0kb
TK 009
TK 025
TK 007
TK 008
TK 024
TK 027
TK 028
TK 026
2.0kb
M1 M2
Figure 4.11: Agarose gel image showing the bands generated using PCR primers Set IV. (A) Band sizes of unrelated individuals showing the size variation and heteroplasmy in Tomistoma schlegelii. (B) Family unit showing equal band size. TK007 and TK009 are adult males sharing the pond with the sole female, TK008. TK024 – TK027 are the first nest while TK028 is from the subsequent nest. M1: 100 bp DNA ladder. M2: 200 bp DNA ladder.
90
Table 4.13: Band sizes of PCR products from Figure 4.11 (A) and (B). The respective size classes, the total number of individuals in each class, the voucher number of selected individuals from the different classes used for sequencing and their respective Genbank accession numbers is presented. GU217576, GU217574 and GU217575 are sequences generated using the reverse PCR primers while the other forward and reverse sequences were generated using internal primers. Class Band
Size (kb) Indivi-duals
Voucher Genbank accession (forward and reverse sequencing)
GU220807 and GU217576 GQ421351 and GU217578 GQ421344 and GU217579 GQ421350 and GU217580 GQ421352 GQ421345 and GU217581 GQ421346 and GU217582 GQ421347 and GU217583, GU217574 GQ421348 GQ421349 and GU217584
4
2.61 3 -
5
2.66 4 TK014 GQ421354
6
2.71 1 -
7
2.76 3 TK030 GQ421355
8 2.81 and 3.08
1 TK011_short, TK011_long
GQ421356 and GU217585 GQ421357 and GU217586, GU217575
91
Figure 4.12: Schematic diagram of the repetitive region after the CSB III. The repetitive region consists of two parts; the motif region and the tandem repeats. The motif region consists of motif R1 and R2 followed by their short AT chains, L1, L2, L3, L4 and L5. The region that was not overlapped by both forward and reverse sequencing, marked with jagged line. The size of the non – overlapping region is between 500 bp for the shortest band size to approximately 1 kb for the larger heteroplasmic band. The schematic illustration of unrelated individuals, the family unit and an unrelated individual, TK010 which have duplication of R2 motif and the AT chain, L5 before the VNTRs. The motifs within each 104 bp VNTR and the imperfect VNTR copy at the 3’ end are illustrated. The non-repetitive region before the 12S rRNA is shaded in grey.
Repeated in the ‘family unit’ and one unrelated individual
CSB III R1 R2 R1 R2 R2
R2(3) R3 CCTA R2(2) L5
A 104bp VNTR copy (found in seven out of eight VNTR units identified)
L1 L2 L3 L4 L5
R2(2) R3 CCTA
Shortened R2(3) and L5 motifs
Imperfect last VNTR copy
5’- - 3’12S rDNA
(at least 8 copies)
92
Figure 4.13: Nucleotide sequence of the repetitive region and the flanking CSB III and 12S rRNA gene of Tomistoma schlegelii as illustrated in Figure 4.12. The motif region begins approximately 35 bp after the CSB III with motif R1 (underlined). The R2 motif in the motif region and the R2(2) and R2(3) motifs in the VNTRs are shaded for sequence comparison. All the AT chains adjacent to the motifs are boxed. The VNTRs are underlined with dotted line while motifs in the VNTRs are in bold and italic. Only the first and the last VNTR are shown. The last VNTR is imperfectly duplicated where the R2(3) and the L5 sequences are shortened. The non-repetitive region with a length of 82 bp (indicated) lies between the last VNTR and the 12S rRNA gene.
93
Each tandem repeat was 104 bp in length. The forward sequencing results
revealed that the band size of 2.5 to 3.0 kb generated with PCR primers consisted
of approximately 300 bp of the 3’ end of Domain III and a 270 – 310 bp of motif
region which flanks the VNTRs region at its 5’end. Five VNTR copies were seen
with the forward sequencing. The reverse sequencing revealed approximately 500
bp of the 5’ end of 12S rDNA gene and a short non repetitive region of 82 bp
which flanks the VNTRs at the 3’ end (Figure 4.12 and Figure 4.13). Three copies
of VNTR were seen with the reverse sequencing in which the last copy is
imperfectly duplicated (Figure 4.12 and Figure 4.13). Highly conserve patterns
were observed from sequences flanking the VNTRs and the numbers of VNTR
copies (eight copies) seen in all the individuals sequenced (homoplasmic and
heteroplasmic), indicates that the length variation is due to the region in which the
forward and reverse sequence did not overlap.
4.4.4.1 Motif Region
The motif region starts with TTTTCCTCTTTT (R1), approximately 35 bp after
the CSB III. R1 is repeated twice but is alternated with another motif
TTTCACTTTT (R2) (Figure 4.12 and Figure 4.13). Motifs R1 and R2 are
followed by short adenine and thymine chains interrupted by guanines. Though
there is elongation of these chains from 5’ to 3’, R1 motifs had longer AT chains
compared to R2. The third repeat of R2 and the AT chains (L5),
AAAAATAAAAAAAAATAAATTT, found after the third repeat of R2 is
perfectly duplicated in the maternal parent (Figure 4.12). This duplication of R2
94
and L5 is inherited in all her hatchlings from two consecutive nests with base
substitution occurring towards the 3’ of the sequence (Figure 4.12 and Figure
4.13). One unrelated individual (TK010) also showed the identical repeat pattern
as in the family unit.
4.4.4.2 VNTRs Region
The variable number tandem repeats in Tomistoma is a 104 bp unit which consists
of four different motifs and an AT chain (Figure 4.12). The VNTRs starts after the
motif region mentioned above with a motif R2(2) which differs from the original
R2 with an insertion of two tyrosine and a transition of the first cytosine from C to
T of R2. This is followed by motif R3, TGCCCACTCCCTCA, and by another
adjacent motif, ‘Tomistoma CCTA’ motif. The Tomistoma CCTA motif showed
base substitutions within individuals and therefore a consensus for this motif is
TAGGCTYATARRCCTA. The last motif in the VNTRs is R2(3), another version
of R2 with an insertion of a tyrosine and a cytosine after the third tyrosine and a
transversion at the eighth nucleotide of R2. Motif R2(3) is followed by the AT
chains (L5) that are found after the R2 motif at the region before the VNTRs.
The last VNTR repeat has an imperfect or shortened sequence of both the R2(3)
and L5. Adjacent to the imperfect VNTR was a non repetitive region consisting of
82 bp. The 5’ region of the 12S rDNA gene was observed after the non repetitive
region (Figure 4.13). The placement of the imperfect tandem repeat at the 3’
95
region of the repetitive region has also been reported in other species (Brown et
al., 1996; Nesbo et al., 1998)
In the heteroplasmic (TK011) and one homoplasmic individual (TK006), the R3
is TGCCCACTTCCTCA, with a transition at the ninth nucleotide when compared
with the R3 of the other homoplasmic individuals. The L5
(AAAAATAAAAAAAAATAAAT) is significantly shortened in the
heteroplasmic and TK006 individuals where the last ten nucleotides are deleted
(Appendix 8). Both TK006 and TK011 are members of the H4 lineage.
4.4.5 Secondary Structures
Stable secondary structures were produced by both the short motifs and the
tandem repeats. Motifs R1 with L3 and the third / forth repeat of R2 with its L5
were able to form secondary structures though with lower energy level (Figure
4.14A and Figure 4.14B).
The free energy levels were very much dependent on the AT chains adjacent to
the motifs (either R1 or R2) to form the stem – loop structure. The tandem repeat
also formed a stable stem-loop structure consisting of two stem-loop structures.
The first stem – loop is made up of the first motif in the VNTRs, R2(2) and L5
while the second is between the R2(3) and Tomistoma CCTA motif (Figure 4.14C).
Depending on where the Tomistoma CCTA motif was placed, the free energy
level ranged from -9.9 – 12.5 kcal/mol. When Tomistoma CCTA motif was
96
placed at the 3’, a similar secondary structure with Crocodylus was seen (Figure
4.15). The higher level of free energy in the tandem repeat suggests that it could
be the source of duplication events.
Figure 4.14: Stable secondary structures and its free energy level calculated using RNAstructure version 4.6. (A) Secondary structure of the second repeat of motif R1 (with the longer AT chains, L3) had free energy of -0.8 kcal/mol. (B) Stable secondary structures of the third / forth repeat of R2 and its L5 with free energy of -2.0 kcal/ml. (C) Stable secondary structures of the VNTRs with the motif arrangement as in Figure 4.13 with a free energy level of -12.5 kcal/mol.
C
A
B
97
Figure 4.15: Stable secondary structures when the VNTRs with the Tomistoma CCTA motif at the 3’. Free energy level calculated using RNAstructure version 4.6 for this VNTR sequence arrangement was -11.7 kcal / mol.
98
CHAPTER 5
DISCUSSION
5.1. Methodology Development
The newly designed primers were successful in amplifying the target bands for all
the regions in this study without difficulty in optimizing the PCR conditions.
Sequencing was also straightforward except for the heteroplasmic band for the
mtDNA repetitive region. Indirect DNA purification consistently produced poor
intensity bands that were not ideal for downstream analysis. This was overcome
by cloning the purified DNA fragment.
5.2 Intraspecific Variation
5.2.1 Genetic Diversity at Species, Population and Captive Holding Locality
Overall haplotype diversity was high (h = 0.77) while overall nucleotide diversity
(�) was low (0.54%). Although the genetic diversities inferred from individual
markers were slightly lower than from concatenate data, h and � were still high.
This pattern of genetic diversities is consistent with that reported in previous
crocodilian population studies (Farais et al., 2004; Ray et al., 2004; Vasconcelos
et al., 2006; Vasconcelos et al., 2008). In most of these studies, either in small
(Farais et al., 2004) or large sampling size (Vasconcelos et al., 2006; Vasconcelos
et al., 2008), the high h and low � were associated with expansion of the crocodile
population. In contrast, Ray et al. (2004) found this pattern in populations of C.
99
moreletti that was at equilibrium. The marker used by Ray et al. (2004) was the
mtDNA d loop with a sampling size similar to Vasconcelos et al. (2006, 2008).
Similarly, the high haplotype diversity seen in our data coupled with positive but
not significant neutrality tests, suggests that Tomistoma schlegelii population is at
equilibrium, contrary to the assumption that genetic diversity would be low due to
the small remaining wild population of this freshwater crocodilian. When
considering the total Tomistoma samples as a population or with samples of
known origins in Peninsular Malaysia, the demographic analysis inferred from
genetic data does not appear to reflect the census studies which indicated gradual
decline in numbers (Bezuijen et al., 2001, Stuebing et al., 2006, Sebastian, 1993;
Simpson et al., 1998).
Explanations for similar census and genetic diversity findings in other crocodilian
were that recent exploitations are difficult to detect genetically due to historical
population expansion which left a strong signature on the mtDNA genome and
therefore is unable to detect the recent exploitations, and longer generation time
compared with the rate of exploitations which is not able to detect genetic drift
even though populations are small (Vasconcelos et al., 2008).
de Thoisy et al. (2006) suggested that census studies should be incorporated when
interpreting genetic information for better inferences. For Tomistoma, census
study has been limited to previously documented localities of occurrence, which
are now faced with habitat destruction (Bezuijen et al., 2001; Bezuijen et al.,
100
2004; Sebastian, 1993; Simpson et al., 1998). For a species that is particularly
sensitive to human activities (Bezuijen et al., 2002), a decline in sightings may
not reflect actual population size. When faced with threats from humans, the
possibility that this species could have translocated to another area which may be
in accessible to humans cannot be discounted altoghether. In addition to the
limited areas surveyed for Tomistoma sightings, the duration of the surveys have
also been limited from one night to a maximum of 10 nights (Auliya et al., 2006;
Bezuijen et al., 2001; Bezuijen et al., 2004; Sebastian, 1993; Simpson et al.,
1998), a relatively short duration for reliable inferences from the census studies.
Genetic diversity of most holding localities was high except for the farms
(Sumatra, Sarawak and Kalimantan) and Mini Zoo Temerloh. In the case of
farmed crocodilian, a low genetic diversity does not necessarily reflects
inbreeding or an effect of genetic drift due to small remaining population as seen
in C. niloticus (Flint et al., 2000) but could indicate adaptation to the farm
conditions. In this study, all individuals from the farms and Temerloh Zoo
animals are from the wild and not bred in the farm. The low genetic diversity
from these four localities could still be due to adaptation to the restricted habitat
that they are left with in the wild.
Only Tomistoma schlegelii population from Peninsular Malaysian showed genetic
variation while the other geographical regions were not genetically diverse. This
could be due to the fact that Peninsular Malaysia has been reported as an area of
101
overlap for most vertebrates of this region. The snakes and frogs of Peninsular
Malaysian have been shown to share species and haplotypes with both Sumatra
and Borneo, in which the latter two regions show lesser similarities with each
other (Inger and Voris, 2001).
5.2.2 Geographical Association of Haplotypes The haplotypes for Tomistoma were geographically distinct except for the H2
haplotype which was found in both Peninsular Malaysia and Sarawak. This trend
of populations or lineages overlapping across Sumatra, Peninsular Malaysia,
Sarawak and West Kalimantan is also seen in several fish species due to historical
association. A haplotype of H. hoevenii was found to be distributed from Kapuas
River (west Kalimantan) to Palembang (southeastern Sumatra) and Johor (south
Peninsular Malaysia) suggesting a recent Pleistocene exchange (Dodson et al.,
1995). Similarly, a haplotype of the freshwater fish Tor tambroides was found in
Sarawak and Peninsular Malaysia suggesting the ancient North Sunda River
system as a means for gene flow (Esa et al., 2008). Another freshwater fish
Hampala macrolepidota showed low population differentiation between Sarawak
and Peninsular Malaysia and haplotypes from both regions clustered in one clade
on the phylogenetic tree (Ryan and Esa, 2006). The distribution of H2 haplotype
in the two geographically separated regions (Peninsular Malaysia and Sarawak)
seems to indicate an association to the ancient river system, the North Sunda
River, which drained these two regions when the Sunda Shelf was exposed
(Voris, 2000).
102
The likely origins of individuals whose geographical origins were not known
from Singapore Zoo, Hong Kong Wetland Park and Cikananga Wildlife Rescue
Centre, Jawa were able to be resolved based on the phylogenetic trees inferred
from individuals of known origins. Data from this study suggests samples from
the H3 lineage in Hong Kong Wetland Park originated from Sumatra, while the
other three individuals of the H1 lineage originated from Peninsular Malaysia.
From a total of ten Tomistoma held in Singapore Zoo, six were from Peninsular
Malaysian while four others from Sarawak. The geographical origins for
individuals from Cikananga Wildlife Rescue Center ranged from Sumatra,
Peninsular Malaysia and Sarawak. The two specimens from Zoo Negara of
unknown origins (public surrender specimens) were always found in the same
clade as West Kalimantan in the phylogenetic trees with very little genetic
divergence between these two populations. This study was limited to only one
sampling site in the whole of East Kalimantan and therefore could not identify if
these two specimens are from East Kalimantan or other parts of Kalimantan.
However, when data of this study was compared with data of wild caught
Tomistoma from West, Central and East Kalimantan over 451bp of control region
(H. Kurniati, unpubl. data), the H5 haplotype clustered together with the East
Kalimantan individuals. Apart from this, the H1 and H2 haplotypes was also seen
in West Kalimantan, reinforcing the suggestion that the shared haplotype in
Peninsular Malaysia, Sarawak and West Kalimantan is due to historical river
system connection. Therefore, the H1 haplotype found from confiscated
specimens in Cikananga Wildlife Rescue Center could have originated from West
103
Kalimantan, Sarawak or Peninsular Malaysia. Similarly, the HI samples from
Hong Kong Wetland Park and samples from Singapore Zoo (H1 and H2
haplotype) could be from any of these three regions as well.
Based on the three data sets, the concatenate data was the most useful in
identifying likely origins of the samples from unknown locations. This is because
the individual markers, cyt b – CR and the ND 6 – tRNAglu – cyt b region were
not able to distinguish the H2 and H3 lineage respectively. Therefore when using
either one of these markers individually, instead of having distinct haplotypes
based on geographical regions, the Sumatra and Sarawak regions would have
shown similar haplotypes with Peninsular Malaysian lineages.
5.2.3 Population Structure The SNN analysis however indicated the populations from the four geographical
regions (Sumatran, Peninsular Malaysia, Sarawak and East Kalimantan) are
different even though the H2 haplotype is found in both Peninsular Malaysia and
Sarawak. In rats, haplotype sharing in well differentiated population has been
reported and was due to historical association rather than ongoing gene flow
(Patton et al., 1994). The division of Tomistoma population according to the
geographical regions is also seen in large endangered land mammals. The tiger for
instance, there are different subspecies in the respective geographical region (Luo
et al., 2004) while the Bornean Orangutans are also differentiated into the
Sarawak and northwest Kalimantan, south west Kalimantan, Central Kalimantan
104
and Sabah populations (Warren et al., 2001). Sharing of alleles was also seen and
in Orangutans found across its geographical range probably due to retention of
polymorphism or recent gene flow (Kanthaswamy and Smith, 2002). Such a
division has been attributed by the type of landscape and habitat ideal for these
mammals. Natural barriers like mountains (Schwaner and Crocker Ranges in
Borneo, Titiwangsa Mountains in Peninsular Malaysia and the Barisan mountain
range in Sumatra) are reported to restrict the movements of lowland mammals
such as tigers and elephants and therefore restrict the gene flow between
populations (Luo et al., 2004; Fleischer et al., 2001). The Schwaner and Crocker
mountain ranges are likely to act as land barrier for Tomistoma populations in
Borneo (East Kalimantan and Sarawak) as well. However, the natural barriers for
populations in Sumatra, Peninsular Malaysia and Sarawak which separated during
the late Pleistocene (Voris, 2000), are the likely the Melaka Strait and South
China Sea. Further investigation with larger sample size of known origins should
be carried out to identify if finer scale population structure exists and the cause of
such structure.
5.2.4 Divergent Lineage The data from this study shows that the H4 lineage is highly divergent. The
genetic divergence compared to other haplotypes was the highest for all three data
sets. Moreover, the genetic divergence seen in the cyt b – CR data is comparable
to that of the Cuban crocodile (Weaver et al., 2008) and a magnitude higher when
compared with the American and Morelet’s crocodile (Ray et al., 2004). In the
105
haplotype network, except for the ND 6 – tRNAglu – cyt b data which connected
all lineages, the H4 haplotype was not parsimoniously connected to the other
haplotypes using cyt b – CR and concatenate data. Unconnected haplotype
networks are seen in cases of hybridization or cryptic species (Hart and Sunday,
2007). With the distance based haplotype network placing the H4 on a different
evolutionary branch from the other lineages and forming a basal and reciprocally
monophyletic clade in the mtDNA trees partly fit the description of an ESU
according to Moritz’s definition (1994) in which the mtDNA alleles have to be
reciprocally monophyletic. Furthermore, when the mtDNA VNTRs sequence was
investigated, individuals from this haplotype were distinct from the rest with
indels of the AT chain within the VNTRs region.
The genus Tomistoma previously had more members that ranged from northern
Africa to Japan as indicated from the fossil records (Brochu, 2003; Kobayashi et
al., 2005; Piras et al., 2007). Although the divergence of this lineage was lower
than that of Osteolaemus species (Eaton et al., 2009), the genetic distance of 2.4%
for the cyt b – CR data of Tomistoma is higher than the distance between hybrid
and pure C. rhombifer and just slightly lower than when these two forms of C.
rhombifer were compared to C. acutus (Weaver et al., 2008). Therefore, there is a
possibility of hybrids in wild Tomistoma populations. The phylogenetic tree
however does not seem to indicate a possible hybridisation with other crocodilian
of this region (C. siamensis, C. porosus and C. mindorensis) as the divergent H4
lineage is placed between the other lineages and Gavialis, a sister taxa. Therefore,
106
if this lineage is indeed a hybrid, it is likely that it is a hybrid with another
Tomistominae. This possibility is based on the bidirectional hybridisation of C.
moreletti and C. acutus and in which the hybrids were fertile (Cedeno – Vasquez
et al., 2008). Assuming this can also happen in Tomistoma, the hybrids of
Tomistominae would have survived even if other members of this family are
extinct.
Small population that diverged from other populations over a considerable period
of time can become highly divergent and result in an ESU (Moritz, 1994; Snyder
et al., 1996). Since the exact location of the three individuals comprising this H4
lineage is unknown, it is difficult to confirm if this lineage diverged from another
lineage of Tomistoma due to drift caused by small population size.
The H4 lineage was morphologically similar to the other lineages suggesting a
possible cryptic species. Cryptic species were characterized as lineages that have
high genetic divergence and are not connected in the parsimony based haplotype
trees (Hart and Sunday, 2007), which is also demonstrated by the H4 lineage.
However, when genetic divergence was compared with the newly discovered
Osteolaemus lineage, O. sp. nov with O. t. tetraspis, lineages with no apparent
morphological differences (Eaton et al., 2009), the divergence of the H4 lineage is
one fold lower than between O. sp. nov and O. t. tetraspis. Further investigation
into this lineage is required to confirm the status of this lineage.
107
As most of captive Tomistoma are intended for breeding and conservation
purposes, it is particularly important to identify the status of this lineage and to
detect if other holding localities have this lineage. In an endangered species, it is
important to minimize inbreeding and outbreeding for better breeding and
survival success (Frankham et al., 2002). Therefore, this lineage should be treated
separately until the status of this lineage is verified.
5.3 mtDNA Repetitive Region
The higher A and T composition observed in this study is common for the
mtDNA control region in general (Ray and Densmore, 2003; Zhang et al., 2009).
Similarly, the mtDNA repetitive region has nucleotide composition which is also
AT bias and has length variations and presence of a heteroplasmic band has also
been reported in other crocodilians (Ray and Densmore, 2003) and in other
animals (Arnason and Rand, 1992; Delport et al., 2002; Rand and Harrison, 1989;
Roques et al., 2004).
Since each VNTR is 104 bp long and the length difference seen between bands is
from 50 or 100 bp, it is likely that the length variation in Tomistoma is due to
partial or complete VNTR indels. Similarly in the komodo dragon and
Crocodylus, the likely patterns in mtDNA repetitive regions that were difficult to
sequence were indicated using information from gel image and conservation of
sequences flanking the VNTRs (Kumazawa and Endo, 2004; Ray and Densmore,
2003).
108
The two heteroplasmic bands were identical in sequence pattern with no base
substitution between the two bands. The homoplasmic individuals showed high
conservation of VNTRs sequence pattern (either with the heteroplasmic pattern or
homoplasmic pattern) but single base substitution was seen within the VNTR
units. The base substitution occurring within the family unit was also reported in
Vespertilonid bats where heteroplasmy was stably inherited (Petri et al., 1996).
The inheritance of the duplicated R2 and L5 in all members of the family unit
suggests a stable transfer of repetitive regions from mother to offspring although
such pattern may not necessarily be unique to the family unit as it was also seen in
one unrelated individual (TK010). A similar observation was reported in humans
as individuals from unrelated maternal lineage have been shown to have the same
haplotype for the repetitive regions (Soong et al., 1997).
The VNTRs pattern in the heteroplasmic individual differed from all
homoplasmic individuals, except for one (TK006), with a substitution in the R3
and indels within the L5. The heteroplasmic individual and TK006 are members
of the H4 lineage. In Crocodylus moreletii, the base indels reported in
heteroplasmic haplotype was in the Poly A region and not repeated as VNTRs
while the homoplasmic haplotypes only differed in the number of VNTRs (Ray
and Densmore, 2003). In fact, the VNTR sequences between different species of
Crocodylus (C. porosus and C. palustris) were found to be generally conserved
(Ray and Densmore, 2003) unlike Tomistoma in which individuals differed in
bases (R3) and the indel of the AT chains within L5 resulting in two different
109
types of tandem repeats within Tomistoma. In the VNTRs of Crocodylus, the
trend of AT chain indels was only seen when the New World species were
compared to the Old World species. Therefore, the repetitive region of this
crocodilian was able to detect this highly divergent lineage.
The stem – loop structures made up by Tomistoma VNTRs is similar to the stem –
loop structures by poly A and T in Crocodylus adjacent to each TAGG motif
repeat. The most probable model for the replication for Crocodylus suggested was
the Levinson and Gutman (1987) model due to the secondary structure and
difference in the number of VNTRs repeats (Ray and Densmore, 2003). Because
of the noncontiguous motifs in the tandem repeats of Tomistoma (R2(2) and R2(3))
with an imperfect tandem repeat at the 3’, the formation of stable secondary
structures could be due to the replication model suggested by Taylor and Breden
(2000). This model adopts the slip strand mispairing model by Levinson and
Gutman (1987) but at noncontiguous repeats involving minisatellites.
5.3.1 Homology and Variations with Other Species Patterns and Repeats
Crocodylus
The poly A-T after the CSB III found in Crocodylus (Ray and Densmore, 2003) is
absent in Tomistoma. An inverted form of the Crocodylus TAGG motif (Ray and
Densmore, 2003) is present in Tomistoma (referred as Tomistoma CCTA motif).
Similar to the Crocodylus TAGG, the Tomistoma CCTA motif has the first four
nucleotides at 5’ and 3’ inverted. Secondary structure produced when the CCTA
110
motif was placed at the 3’ of the tandem repeat was similar to that of Crocodylus
secondary structure when the Crocodylus TAGG motif was arranged at the 3’
(Ray and Densmore, 2003).
Alligator
Based on the sequence alignment, the repetitive region of Tomistoma after CSB
III is similar to Alligator in which the distinct Poly-A followed by poly-T in the
Crocodylus is absent. Instead, it is replaced by the short motif repeats in
Tomistoma and Alligator but in Alligator, the motifs are tandem repeats with short
AT chains adjacent to the motif. The first motif is repeated three times followed
by the second motif by 11 times (Ray and Densmore, 2003). These two genera
also share a similar form of the CCTA motif, TAGGSYYATARRYYTA but the
inverted repeats are only 2bp long at the 5’ and 3’ nucleotides in the Alligator
(shaded font indicates nucleotides conserved between the two genera). Similar to
Tomistoma, this CCTA motif is found in the alligator’s VNTRs.
Caiman crocodilus
Caiman’s VNTRs consist of three copies of a 287 bp sequence and a truncated
copy which is located closer to the 12S rDNA (Ray and Densmore, 2003). Within
these copies, a short sequence of ATTATA is found in the motifs of Alligator.
This sequence is also found immediately after the CSB III in Tomistoma in all the
individuals sequenced. However, there are no other repeats of this sequence found
111
subsequently in both the motif and VNTRs regions of the Tomistoma. This
sequence is not found in Gavialis and Crocodylus.
Gavialis
The CSB III region is highly conserved between Tomistoma and Gavialis. The
region after CSB III in Gavialis gangeticus contains two parts, a short motif
region followed by the VNTRs. The motif present in the Gavialis gangeticus is
the ‘Tomistoma R1’ with the fifth nucleotide having a transition from T to C. In
Gavialis, this short motif region consists of only one imperfect tandem repeat
followed by perfect tandem repeats (VNTRs) whereas in Tomistoma the imperfect
tandem repeat is at the last VNTR units (3’ end). The Gavialis VNTRs consisted
of two sets of R1 and ends with a TAGG motif which is similar to the Crocodylus
(CCTAGGSYWAAATASG) in which the ninth and the fifteenth nucleotide have
base substitution. However, the Tomistoma CCTA motif is not seen in the
Gavialis. The perfect duplicate of VNTRs for Gavialis starts approximately at the
same site as the VNTRs of Crocodylus. The secondary structure formed by the
VNTRs was also similar to Crocodylus secondary structure when the TAGG
motif is placed at the extreme 3’ end. Both Tomistoma and Gavialis have 85%
similarities at the non-repetitive sequences between the last VNTR and the 12S
rRNA.
112
5.3.2 Conservation of Crocodilian mtDNA Repetitive Region.
In marsupials, the conservation of the repeats was used to indicate evolutionary
histories (Nilsson, 2009). The highly conserved sequences in marsupials were
easily aligned for lineages that diverged 20 million years ago (Ma) and could
indicate a recent event as compared to placental mammals which showed lesser
conservation (Nilsson, 2009). In crocodilian, the presence of the R1 motif
sequence and the high conservation of the non – repetitive region at the 5’ of 12 S
rDNA gene in Tomistoma and Gavialis are consistent with previous molecular
work on crocodilians in which these two are closely associated, diverging some
28 – 22 Ma (Roos et al., 2007). Similarly, the short ATTATA sequence seen in
every repeat copy of Caiman and Alligator suggest closer association between
these two genera although it is estimated that these two diverged some 68 – 73
Ma (Roos et al., 2007). The presence of TAGG motif in Crocodylus and Gavialis
also supports their molecular data classification as Crocodylidae (Janke et al.,
2005; Roos et al., 2007). With the exception of Caiman, the TAGG motif and the
inversion of this motif, the CCTA motif which are found in all crocodilian that
diverged before K/T boundary, approximately 90 to 106 Ma (Brochu, 2009; Roos
et al., 2007), could be due to concerted evolution. Concerted evolution was
suggested for the conservation of sequences of the mtDNA repetitive region of
large cats (Jae-Heup et al., 2001), and nuclear genes of primates that diverged
over 35 Ma (Pavelitz et al., 1995). The repetitive patterns of Tomistoma are
interesting as it consisted of motifs and inversion of motifs found in all other
crocodilian irrespective of their phylogenetic classification.
113
CHAPTER 6
CONCLUSION
In conclusion, the genetic diversity study on Tomistoma found that the overall
haplotype diversity is high with population structure especially associated with
geographical region. We were able to identify the geographical regions for
samples of unknown origins from Singapore Zoo, Hong Kong, Jawa, and
Peninsular Malaysia. The findings also suggest that Tomistoma populations are
geographically differentiated into Sumatra, Peninsular Malaysia, Sarawak and
East Kalimantan. The divergent H4 haplotype should be managed separately and
should be investigated further using microsatellite to confirm the status of this
lineage.
The type of mtDNA repetitive patterns present in Tomistoma which are unique
due to the presence of two different types of patterns, the motif region and
VNTRs within a species that is not seen in the other crocodilian that diverged
during the Pre K/T boundary. Indels of complete motifs (R2 and L5) were seen in
the motif region (before the VNTRs). The VNTR repeat sequence varies in base
pattern and probably in the number of VNTR copies which caused the length
variation of the band sizes. Though not as common, heteroplasmy does occur in
this taxon. The H4 lineage (heteroplasmic and one homoplasmic individual)
114
differed from other lineages at R3 with base substitution and L5 with base indels.
The repetitive region consisted of a combination of patterns which are specific to
different crocodilian and shares similar secondary structure with Crocodylus and
Gavialis. Finally, this marker has a potential to detect maternally related siblings
due to the stable inheritance of VNTRs sequence from maternal to offspring and
the highly divergent H4 lineage.
115
List of References
Allendorf, F.W. and Luikart, G. (2007). Units of conservation. In Conservation and the genetics of populations (pp. 380 - 420). Malden, Massachusetts: Blackwell Publishing Ltd. Apakupakul, K., Siggal, M.E. and Burreson, E.M. (1999). Higher level relationship of leeches (Annelida: Clitella: Euhirudinea) based on morphology and gene sequences. Molecular Phylogenetics and Evolution, 12 (3), 350 – 359. Arnason, E. and Rand, D.M. (1992). Heteroplasmy of short tandem repeats in mitochondrial DNA of Atlantic cod, Gadus morhua. Genetics, 132, 211 – 220.
Auliya, M., Schwedick, B., Sommerlad, R., Brend, S. and Samedi. (2006). A short-term assessment of the conservation status of Tomistoma schlegelii (Crocodylia: Crocodylidae) in Tanjung Puting National Park (Central Kalimantan, Indonesia). URL: http//tomistoma.org . Accessed on the 29th March 2009.
Avise, J.C. (2000). Phylogeography: The history and formation of speices. London, England: Harvard University Press. Avise, J.C. (2004). Molecular markers, Natural History and Evolution (2nd ed.). Sunderland, Massachusetts: Sinauer Associates. Avise, J.C. (2009). Phylogeography: retrospect and prospect. Journal of Biogeography, 36, 3 – 15. Baker , J.M., Lopez – Medrano, E., Navarro – Siguenza, A.G., Rojas – Soto, O.R. and Omland, K.E. (2003). Recent speciation in the Orchard oriole group: Divergence of Icterus spurius spurius and Icterus spurious fuertesi. The Auk, 120 (3), 848 – 859. Baker, A.N., Smith, A.N.H. and Pichler, F.B. (2002). Geographical variation in Hector’s dolphin: recognition of new subspecies of Cephalorhynchus hectori. Journal of the Royal Society of New Zealand, 32, 713 – 727. Ballard, J.W.O. and Kreitman, M. (1995). Is mitochondrial DNA a strictly neutral marker? Trends in Ecology and Evolution, 10, 485 – 488. Bazin, E., Gle´min, S. and Galtier, N. (2006). Population size does not influence mitochondrial genetic diversity in animals. Science, 312, 570–571.
Bezuijen, M.R., Hartoyo, P., Elliot, M. and Baker, B.A. (1998). Project Tomistoma. Second report on the ecology of the false gharial (Tomistoma schlegelii) in Sumatra. Darwin: Wildlife Management International Pty Limited.
116
Bezuijen M.R., Webb G.J., Hartoyo P. and Samedi. (2001). Peat swamp forest and the false gharial (Tomistoma schlegelii) in the Merang River, eastern Sumatra, Indonesia. Oryx, 35, 301 – 307. Bezuijen, M.R., Wibowo, P. and Wirawijaya, H. (2002). Assessment of the management and conservation of the Merang River as habitat for the false gharial. In: Proceedings of the 2002 False Gharial Workshop. Darwin: Wildlife Management International Pty. Limited/Wetlands International-Indonesia Program.
Bezuijen, M.R., Suryansyah, Huda, I., Andriyono, S., Pratihno, P., Potess, F. and Sommerlad, R. (2004). False gharial (Tomistoma schlegelii) surveys in West Kalimantan, Indonesia in 2004. URL: http//tomistoma.org . Accessed on the 29th March 2009.
Bezuijen, M.R., Shwedick, B.M., Sommerlad, R., Stevenson, C. and Steubing, R.B. (2010). Crocodiles. Status survey and conservationa action plan. 3rd Edition. (Pp 133 – 138). Darwin, Australia: Crocodile Specialist Group. Boore, J.L. (1999). Survey and summary: Animal mitochondrial genomes. Nucleic Acids Research, 27 (8), 1767 – 1780.
Brochu, C. B. (1997). Morphology, fossils, divergence timing, and the phylogenetic relationships of Gavialis. Systematic Biology, 46 (3), 479 – 522.
Brochu, C. B. (2003). Phylogenetic approaches toward crocodylian history. Annual Review of Earth Planetary Sciences, 31, 357 – 397. Brochu, C.B. (2007). Systematics and taxonomy of Eocene Tomistomine crocodylians from Britian and Northern Europe. Palaeontology, 50 (4), 917 – 928. Brochu, C.A. (2009). Crocodylians (Crocodylia). In S.B. Hedges and S. Kumar (Eds.), The timetree of life (pp. 402–406). Oxford University Press. Broughton, R. and Dowling, T.E. (1994). Length variation in mitochondrial DNA of the minnow Cyprinella spiloptera. Genetics, 138, 179 – 190. Buroker, N.E., Brown, J.R., Gilbert, T.A., O’Hara, P.J., Beckenbach, A.T., Thomas, W.K. and Smith, M.J. (1990). Length heteroplasmy of sturgeon mitochondrial DNA: An illegitimate elongation model. Genetics, 124, 157 – 163. Burzynski, A., Zbawicka, M., Skibinski, D.O. and Wenne, R. (2003). Evidence for recombination of mtDNA in the marine mussel Mytilus trossulus from the Baltic. Molecular Biology and Evolution, 20(3), 388 – 392.
117
Casane, D., Dennebouy, N., Rochambeau, H., Mounolou, J.C. and Monnerot, M. (1994). Genetic analysis of systematic mitochondrial heteroplasmy in rabbits. Genetics, 138, 471 – 480. Cedeno – Vazquez, J.R., Rodriguez, D., Calme, S., Ross, J.P., Densmore, L.D. and Thorbjarnarson, J. (2008). Hybridization between Crocodylus acutus and Crocodylus moreletii in the Yucatan Peninsula: I. Evidence from mitochondrial DNA and morphology. Journal of Experimental Zoology, 309A, 661 – 673. Chang, D.D. and Clayton, D.A. (1985). Priming of human mitochondrial DNA replication occurs at the light – strand promoter. Proceedings of Natural Academy of Science, 82, 351 – 355. Chong, L.K., Tan, S.G., Yusoff, K. and Siraj, S.S. (2000). Identification and characterization of Malaysian river catfish, Mystus nemurus (C and V): RAPD and ALFP analysis. Biochemical Genetics, 38, 63 – 76
Clayton, D.A. (1984). Transcription of the mammalian mitochondrial genome. Annual Review of Biochemistry, 53, 573 – 594.
Clement, M., Posada, D. and Crandall, A.K. (2000). TCS: a computer program to estimate gene genealogies. Molecular Ecology, 9, 1657 – 1659.
Costa, F.O., deWaard, J.R., Boutillier, J., Ratnasingham, S., Robert, S. T., Hajibabaei, M. and Hebert, P.D. (2007). Biological identifications through DNA barcodes: the case of the Crustacea. Canadian Journal of Fisheries and Aquatic Sciences, 64 (24), 272 – 295.
Cox, J.H., and Gombek, F. (1985). A preliminary survey of the crocodile resource in Sarawak, East Malaysia. (IUCN / WWF Project No. MAL 74/85).
Crandall, K.A., Bininda – Emonds, O.R.P., Mace, G.M. and Wayne, R.K. (2000). Considering evolutionary processes in conservation biology. Trends in Ecology and Evolution, 15, 290 – 295. Davis, L.M., Glenn, T.C., Strickland, D.C., Guillette, L.J., Elsey, R.M., Rhodes, W.E., Dessauer, H.C. and Sawyer, R.H. (2002). Microsatellite DNA analysis support an East–West phylogeographic split of American alligator populations. Journal of Experimental Zoology, 294, 352 – 372. Delport, W., Ferguson, J.W.H., and Bloomer, P. (2002). Characterization and evolution of the mitochondrial DNA control region in hornbills (Bucerotiformes). Journal of Molecular Evolution 54, 794 – 806.
118
Densmore, L.D. and White, P.S. (1991). The systematics and evolution of the Crocodilia as suggested by restriction endonuclease analysis of mitochondrial and nuclear ribosomal DNA. Copeia, 3, 602 – 615. DeSalle, R., Freeman, T., Prager, E.M. and Wilson, A.C. (1987). Tempo and mode of sequence evolution in mitochondrial DNA of Hawaiian Drosophila. Journal of Molecular Evolution, 26, 157 – 164. de Thoisy, B., Hrbek, T., Farias, I.P., Vasconcelos, W.R. and Lavergne, A. (2006). Genetic structure and population dynamics of black caiman (Melanosuchus niger). Biological Conservation, 133, 474 – 482. Dever, J.A., Strauss, R.E., Rainwater, T.R., McMurry, S.T. and Densmore, L.D. (2002). Genetic diversity, population subdivision, and gene flow in Morelet’s crocodile (Crocodylus moreletii) from Belize, Central America. Copeia, 2002, 1078 – 1091. Dodson, J.J., Colombani, F. and Ng, P.K.L. (1995). Phylogeographic structure in mitochondrial DNA of a South-east Asian freshwater fish, Hemibagrus nemurus (Siluroidei; Bagridae) and Pleistocene sea level changes on the Sunda shelf. Molecular Ecology, 4, 331 – 346. Eaton, M.J., Martin, A., Thorbjarnarson, J. and Amato, G. (2009). Species-level diversification of African dwarf crocodiles (Genus Osteolaemus): A geographic and phylogenetic perspective. Molecular Phylogenetics and Evolution, 50, 496 – 506. Eberhard, J.R., Wright, T.F. and Berminghan, E. (2001). Duplication and concerted evolution of the mitochondrial control region in the parrot Genus Amazona. Molecular Biology and Evolution, 18 (7), 1330 – 1342. Esa, Y.B., Siraj, S.S., Daud, S.K., Rahim, K.A.A., Japning, J.R.R. and Tan, S.G. (2008). Mitochondrial DNA diversity of Tor tambroides Valenciennes (Cyprinidae) from five natural populations in Malaysia. Zoological Studies, 47 (3), 360 – 367. Excoffier, L.G. Laval, and Schneider, S. (2005) Arlequin ver. 3.0: An integrated software package for population genetics data analysis. Evolutionary Bioinformatics Online, 1, 47 – 50. Eyre-Walker, A., Smith, N.H. and Maynard – Smith, J. (1999). How clonal are human mitochondria? Proceedings of the Royal Society B-Biological Sciences, 266, 477 – 483.
Farias, I.P., Silveira, R.D., de Thoisy, B., Monjelo, L.A., Thorbjarnarson, J. and Hrbek, T. (2004). Genetic diversity and population structure of Amazonian crocodilians. Animal Conservation, 7, 265 – 272.
119
Felsenstein, J. (1985). Confidence limits on phylogenies: An approach using the bootstrap. Evolution, 39, 783 – 791.
Fernando, P., Vidya, T.N.C., Payne, J., Stuewe, M., Davison, G., Alfred, R.J., Andau, P., Bosi, E., Kilbourn, A. and Melnick, D.J. (2003). DNA analysis indicates that Asian elephants are native to Borneo and are therefore a high priority for conservation. PLOS Biology, 1 (1). Doi:10.1371/journal.pbi.0000006 Fleischer, R.C., Perry, E.A., Muralidharan, K., Stevens, E.E. and Wemmer, C.M. (2001). Phylogeography of the Asian elephant (Elephas maximus) based on mitochondrial DNA. Evolution. 55 (9), 1882 – 1892. Flint, N.S., van der Bank, F.H. and Grobler, J.P., (2000). A lack of genetic variation in commercially bred Nile crocodiles (Crocodylus niloticus) in the North – west Province of South Africa. Water SA, 26 (1), 105 – 110. Fontaine, K. M., Cooley, J. R. and Simon, C. (2007). Evidence for paternal leakage in hybrid periodical cicadas (Hemiptera: Magicicada spp). PLoS ONE. 2(9): e892. doi:10.1371/journal.pone.0000892. Frankham, R., Ballou, J.D. and Briscoe, D.A. (2002). Introduction to conservation genetics. Cambridge, United Kingdom: Cambridge University Press. Fraser, D.J. and Bernatchez, L. (2001). Adaptive evolutionary conservation: towards a unified concept for defining conservation units. Molecular Ecology, 10, 2741 – 2752. Fu, Y.X. (1997). Statistical tests of neutrality against population growth, hitchhiking and background selection. Genetics, 147, 915 – 925. Fu, Y.X. (1996). New statistical tests of neutrality for DNA samples from a population. Genetics, 143, 557 – 570. Fu, Y.X. and Li, W.H. (1993). Statistical tests of neutrality of mutations. Genetics, 133, 693 – 709. Galtier, N., Enard, D., Radondy, Y., Bazin, E. and Belkhir, K. (2006). Mutation hotspots in mammalian mitochondrial DNA. Genome Research, 16, 215 – 222. Galtier, N., Nabholz, B., Glemin, S. and Hurst, G.D.D. (2009). Mitochondrial DNA as a marker of molecular diversity: A reappraisal. Molecular Ecology, 18, 4541 – 4550. Gartside, D.F., Dessauer, H.C. and Jaonen, T. (1977). Genic homozygosity in an ancient reptile (Alligator missisipiensis). Biochemical Genetics, 15: 655 – 663.
120
Gatesy, J., Amato, G., Norell, M., DeSalle, R. and Hayashi, C. (2003). Combined support for wholesale taxic atavism in Gavialine crocodylians. Systematic Biology, 52 (3), 403 – 422. Glenn, T.C., Staton, J.L., Vu, A.T., Davis, L.M., Alvarado Bremer, J.R., Rhodes, W.E., Brisbin Jr, I.L. and Sawyer, R.H. (2002). Low mitochondrial DNA variation among American alligators and a novel non – coding region in crocodilians. Journal of Experimental Zoology (Mol Dev Evol), 294, 312 – 324. Grant, W.S. and Bowen, B.W. (1998). Shallow population in deep evolutionary lineages of marine fishes: Insights from sardines and anchovies and lessons for conservation. The American Genetic Association, 89, 415 – 426. Gyllesten, U.B., Wharton, D., Josefsson, A. and Wilson, A.C. (1991). Paternal inheritance of mitochondrial DNA in mice. Nature, 352, 255 – 257. Hagelberg, E., Goldman, N., Lio´, P., Whelan, S., Schiefenhovel, W., Clegg, J.B. and Bowden, D.K. (1999). Evidence for mitochondrial DNA recombination in a human population of island Melanesia. Proceedings of the Royal Society B: Biological Sciences, 266, 485 – 492. Hagelberg, E., Goldman, N., Lio´, P., Whelan, S., Schiefenhovel, W., Clegg, J.B. and Bowden, D.K. (2000). Evidence for mitochondrial DNA recombination in a human population of island Melanesia: correction. Proceedings of the Royal Society B-Biological Sciences, 267, 1595 – 1596. Harshman, J., Huddleston, C.J., Bollback, J.P., Parsons, T.J. and Braun, M. (2003). True and false gharials: A nuclear gene phylogeny of Crocodylia. Systematic Biology, 52 (3), 386 – 402. Hart, M.W. and Sunday, J. (2007). Things fall apart: biological species form unconnected parsimony networks. Biology Letters, 3, 509 – 512. Hasegawa, M., Kishino, H. and Yano, T. (1985). Dating of the human-ape splitting by a molecular clock of mitochondrial DNA. Journal of Molecular Evolution, 22, 160 – l74. Hauswirth, W.W., Walle, M.J.V.D., Laipis, P.J. and Olivo, P.D. (1984). Heterogenous mitochondrial DNA D – loop sequences in bovine tissue. Cell, 37, 1001 – 1007.
Herbert, P.D., Penton, E.H., Burns, J.M., Janzen, D.H. and Hallwachs, W. (2004). Ten species in one: DNA barcoding reveals cryptic species in the neotropical skipper butterfly Astraptes fulgerator. Proceedings of Natural Academy of Science, 101 (41), 14812 – 14817.
121
Hillis, D.M., Moritz, C. and Mable, B.K. (1996). Molecular Systematics (2nd ed.). Sunderland, Massachusetts: Sinauer Associates.
Hudson, R.R. (2000) A new statistic for detecting genetic differentiation. Genetics, 155, 2011–2014. Hudson, R.R., Slatkin, M. and Maddison, W.P. (1992). Estimation of levels of gene flow from DNA sequence data. Genetics, 132, 583 – 589. Hudson, R.R. (1990). Gene genealogies and the coalescent process. Oxford Surveys in Evolutionary Biology, 7, 1 – 44. Hwang, U – K. and Kim, W. (1999). General properties and phylogenetic utilities of nuclear ribosomal DNA and mitochondria DNA commonly used in molecular systematics. The Korean Journal of Parasitology, 37 (4), 215 – 228. Inger, R.F. and Voris, H.K. (2001). The biogeographical relations of the frogs and snakes of Sundaland. Journal of Biogeography, 28, 863 – 891. IUCN (2009): IUCN Red List of Threatened Species. Version 2009.1. URL: www.iucnredlist.org. Accessed 3rd August 2009. Jae – Heup, K., Eizirik, E., O’Brien, S.J. and Johnson, W.E. (2001). Structure and patterns of sequence variation in the mitochondrial DNA control region of the great cats. Mitochondrion, 14, 279 – 292. Janke, A., Gyllberg, A., Hughes, S., Aggarwal, R.K. and Arnason, U. (2005). Mitogenomic analyses place the Gharial (Gavialis gangeticus) on the crocodile tree and provide pre K / T divergence times for most crocodilians. Journal of Molecular Evolution, 61, 620 – 626. Kanthaswamy, S. and Smith, D.G. (2002). Population subdivision and gene flow among wild orangutans. Primates, 43 (4), 315 – 327.
Kimura, M. (1980) A simple method for estimating evolutionary rate of base substitutions through comparative studies of nucleotide sequences. Journal of Molecular Evolution, 16, 111 – 120.
Kimura, M. (1968). Evolutionary rate at the molecular level. Nature, 217, 624 – 626. Kobayashi, Y. and Tomida, Y. (2005). Anatomy of Toyotomaphimeia machikanensis (Crocodylia) from the Pleistocene of Japan and reassessment of its phylogenetic status. Journal of Vertebrate Paleontology, 25, 78A–79A.
122
Koehler, C.M., Lindberg, G.L., Brown, D.R., Beitz, D.R., Freeman, A.E., Mayfield, D.R. and Mayers, A.M. (1991). Replacement of bovine mitochondrial DNA by a sequence variant within one generation. Genetics, 129, 247 – 255.
Kress, W.J. and Erickson, D.L. (2008). DNA barcodes: Genes, genomics, and bioinformatics. Proceedings of the National Academy of Sciences, 105 (8), 2761–2762. Kruskal, J.B. (1956). On the shortest spanning subtree of a graph and the travelling salesman problem. Proceedings of the American Mathematical Society, 7, 48 – 50. Kumazawa, Y., and Endo, H. (2004). Mitochondrial genome of the Komodo Dragon: Efficient sequencing method with reptile-oriented primers and novel gene rearrangements. DNA Research, 11, 115–125.
Kumazawa, Y. and Nishida, N. (1995). Variations in mitochondrial tRNA gene organization of reptiles as phylogenetic marker. Molecular Biology and Evolution, 12 (5), 759 – 772.
Larizza, A., Pesole, G., Reyes, A., Sbisa, E. and Saccone, C. (2002). Lineage specificity of the evolutionary dynamics of the mtDNA D-Loop region in rodents. Molecular Biology and Evolution, 54, 145 – 155. Levinson, G., and Gutman, G.A. (1987). Slipped – strand mispairing: A major mechanism for DNA sequence evolution. Molecular Biology and Evolution, 4, 203 – 221. Librado, P. and Rozas, J. (2009). DnaSP v5: A software for comprehensive analysis of DNA polymorphism data. Bioinformatics, 25 (11), 1451–1452. Ludwig, A., May, B., Debus, L. and Jenneckens, I. (2000). Heteroplasmy in the mtDNA control region of sturgeon (Acipenser, Huso and Scaphirhynchus). Genetics, 156, 1933 – 1947. Lunt, D.H., Whipple, L.E. and Hyman, B.C. (1998). Mitochondrial DNA variable number tandem repeats (VNTRs): utility and problems in molecular ecology. Molecular Ecology, 7, 1441 – 1455. Luo, S-H, Kim, J-H, Johnson, W.E., van der Walt, J., Martenson, J, Yuhki, N., Miquelle, D. G., Uphyrkina, O., Goodrich, J. M. et al. (2004). Phylogeography and genetic ancestry of tigers (Panthera tigris). PLOS Biology, 2 (12). Doi:10.1371/journal.pbi.0020442 Lutz, S., Weisser, H., Heizmann, J. and Pollak, S. (1999). Mitochondrial heteroplasmy among maternally related individuals. Internation Journal of Legal Medicine, 113, 155 – 161.
123
Mathews, D.H., Disney, M.D., Childs, J.L., Schroeder, S.J., Zuker, M. and Turner, D.H. (2004). Incorporating chemical modification constraints into a dynamic programming algorithm for prediction of RNA secondary structure. Proceedings of the National Academy of Sciences USA, 101, 7287-7292. Mayr, E. (1963). Animal species and evolution. Cambridge, Massachusetts: Harvard University Press. McAliley, L.R., Willis, R.E., Ray, D.A., White, P.S., Brochu, C.A., Densmore, L.D. (2006). Are crocodiles really monophyletic? – Evidence for subdivisions from sequence and morphological data. Molecular Phylogenetics and Evolution, 39, 16 – 32. McBride, H., Neuspiel, M. and Wasiak, S. (2006). Mitochondria: More than just a powerhouse. Current Biology, 16 (14), 551 – 560. Mjelle, K.A., Karlsen, B.O., Jorgensen, T.E., Moum, T. and Johansen, S.D. (2008). Halibut mitochondrial genomes contain extensive heteroplasmic tandem repeat arrays involved in DNA recombination. BioMed Central Genomics, 9 (10). doi:10.1186/1471-2164-9-10 Moore, W.S. (1997). Mitochondrial gene trees versus nuclear gene trees, a reply to Hoelzer. Evolution, 51 (2), 627 – 629. Moritz, C. (1994). Defining “evolutionary significant units” for conservation. Trends in Ecology and Evolution, 9, 373 – 375. Mortiz, C., Dowling, T.E. and Brown, W.M. (1987). Evolution of animal mitochondrial DNA: Relevance for population biology and systematics. Annual Review of Ecology, Evolution and Systematics, 18, 269 – 292. Mundy, N.I., Winchell, C.S. and Woodruff, D.S. (1996). Tandem repeats and heteroplasmy in the mitochondrial DNA control region of the loggerhead shrike (Lanius lidovicianus). Journal of Heredity, 87, 21 – 26.
Nei, M. and Kumar, S. (2000). Molecular evolution and phylogenetics. New York: Oxford University Press.
Nei, M. (1987). Molecular evolutionary genetics. New York: Columbia University Press. Nesbo, C.L., Arab, M.O. and Jakobsen, K.S. (1998). Heteroplasmy, length and sequence variation in the mtDNA control regions of three percid fish species (Perca fluviatilis, Acerina cernua, Stizostedion lucioperca). Genetics, 148, 1907 – 1919.
124
Nilsson, M. (2009). The structure of the Australian and South American marsupial mitochondrial control region. Mitochondrial DNA, 20 (5),126 – 138 Paetkau, D. (1999). Using genetics to identify intraspecific conservation units: A critique of current methods. Conservation Biology, 13 (6), 1507 – 1509.
Page, R.D.M. (1996). TREEVIEW: An application to display phylogenetic trees on personal computers. Computer Applicarions in the Biosciences, 12, 357 – 358.
Patton, J.L., Da Silva, M.N.F. and Malcom, J.R. (1994). Gene geneology and differentiation among arboreal spiny rats (Rodentia: Echimyidae) of the Amazon Basin: A test of the riverine barrier hypothesis. Evolution, 48 (4), 1314 – 1323. Pavelitz, T., Rusche, L., Matera, A. G., Scharf, J. M. and Weiner, A. M. (1995) Concerted evolution of the tandem array encoding primate U2 snRNA occurs in situ, without changing the cytological context of the RNU2 locus. EMBO. Journal. 14, 169 – 177. Petri, B., Haeseler, A. and Paabo, S. (1996). Extreme sequence heteroplasmy in bat mitochondrial DNA. Biological Chemistry, 377, 661 – 667. Piras, P., Delfino, M., Del Favero, L. and Kotsakis, T. (2007). Phylogenetic position of the crocodylian Megadontosuchus arduini and Tomistomine palaeobiogeography. Acta Palaeontologica Polonica, 52 (2), 315 – 328. Posada, D. (2008). jModelTest: Phylogenetic Model Averaging. Molecular Biology and Evolution, 25, 1253 – 1256. Prim, R. C. (1957). Shortest connection networks and some generalizations. The Bell System Technical Journal, 36, 1389 – 1401. Quinn, T.W. and Mindell, D.P. (1996). Mitochondrial gene order adjacent to the control region in crocodile, turtle and tuatara. Molecular Phylogenetics and Evolution, 5 (2), 344 – 351. Ramos – Onsins, S.E. and Rozas, J. (2002). Statistical Properties of New Neutrality Tests Against Population Growth. Journal of Molecular Biology and Evolution, 19 (12), 2092 – 2100. Rand, D.M. and Harrison, R.G. (1989). Molecular population genetics of mtDNA size variation in crickets. Genetics, 121, 551 – 569. Ray, D.A., White, P.S., Duong, H.V., Cullen, T. and Densmore, L.D. (2000). Crocodilian Biology and Evolution. High levels of genetic variability in West
125
African dwarf crocodiles Osteolaemus tetraspsis tetraspis. (pp 58 – 63). Chipping Norton: Surrey Beatty and Sons. Ray, D.A. and Densmore, L. (2002). The crocodilian mitochondrial control region: General structure, conserved sequences and evolutionary implications. Journal of Experimental Zoology (Mol Dev Evol), 294, 334 – 345. Ray, D.A. and Densmore, L.D. (2003). Repetitive sequences in the crocodilian mitochondrial control region: Poly-A sequences and heteroplasmic tandem repeats. Molecular Biology and Evolution, 20 (6), 1006 – 1013. Ray, D.A., Dever, J.A., Platt, S.G, Rainwater, T.R., Finger, A.G., McMurry, S.T., Batzer, M.A., Barr, B., Stafford, P.J., McKnight, J. and Densmore, L.D. (2004). Low levels of nucleotide diversity in Crocodylus moreletii and evidence of hybridization with C. acutus. Conservation Genetics, 5, 449 – 462. Rodriguez, D., Cedeno – Vazquez, J.R., Forstner, M.R.J. and Densmore, L.D. (2008). Hybridization between Crocodylus acutus and Crocodylus moreletii in the Yucatan Peninsula: II. Evidence from microsatellites. Journal of Experimental Zoology, 309A, 1 – 13. Rogers, A.R. and Harpending, H. C. (1992). Population growth makes waves in the distribution of pairwise genetic differences. Molecular Biology and Evolution, 9, 552 – 569. Roos, J., Aggarwal, R.K., and Janke, A. (2007). Extended mitogenomic phylogenetic analyses yield new insight into crocodilian evolution and their survival of the Cretaceous – Tertiary boundary. Molecular Phylogenetics and Evolution, 45, 663 – 673. Roques, S., Godoy, J. A., Negro, J. J. and Hiraldo, F. (2004). Organization and Variation of the Mitochondrial Control Region in Two Vulture Species, Gypaetus barbatus and Neophron percnopterus. Journal of Heredity, 95 (4), 332 – 337. Rosenberg, N.A. and Nordborg, M. (2002) Genealogical trees, coalescent theory, and the analysis of genetic polymorphisms. Nature Reviews Genetics, 3, 380 – 390. Ryan, J.R. and Esa, Y.B. (2006). Phylogenetic analysis of hampala fishes (subfamily Cyprininae) in Malaysia inferred from partial mitochondrial cytochrome b DNA sequences. Zoological Studies, 23 (10), 893 – 901. Sambrook, J.E., and Russell, D.W. (2001). Molecular cloning: A laboratory manual (2nd ed.). New York: Cold Spring Harbor Laboratory Press.
126
Sbisa, E., Tanzariello, F., Reyes, A., Pesole, G. and Saccone, C. (1997). Mammalian mitochondrial D – loop region structural analysis: Identification of new conserved sequences and their functional and evolutionary implications. Gene, 205, 125 – 140.
Sebastian, A.C. (1993). The Tomistoma Tomistoma schlegelii in Southeast Asia, a status review and priorities for its conservation. In Crocodiles. Proceedings of the 12the Working Meeting of the Crocodile Specialist Group, IUCN – The World Conservation Union, 1, 98 – 112. Gland: IUCN/SSC Crocodile Specialist Group.
Simpson, B.K., Lopez, A., Latif, S. and Yusoh, A. (1998). Tomistoma (Tomistoma schlegelii) at Tasek Bera, Peninsular Malaysia. In Crocodiles. Proceedings of the 14th Working Meeting of the Crocodile Specialist Group, IUCN – The World Conservation Union, 1998, 32 – 45. Gland: IUCN/SSC Crocodile Specialist Group.
Slatkin, M. (1987). Gene flow and the geographic structure of natural populations. Science, 236, 787 – 792.
Soong, D. L., Chang, H. S., Ki, B. K., Yoon, S. L. and Jung, B. L. (1997). Sequence variation of mitochondrial DNA control region in Koreans. Forensics Science International. 87, 99 – 116.
Snyder, N.F.R., Derrickson, S.R., Bessinger, S.R., Wiley, J.W., Smith, T.B., Toone, W.D. and Miller, B. (1996). Limitations of captive breeding in endangered species recovery. Conservation Biology, 10, 338 – 348.
Stuebing, R., Mohd Sah, S.A., Lading, E. and Jong, J. (2004). The status of the false gharial (Tomistoma schlegelii Mueller) In Malaysia. In Proceedings of the 16th Working Meeting of the Crocodile Specialist Group, Darwin, NT, Australia. Gland: IUCN/SSC Crocodile Specialist Group.
Stuebing, R.B., Bezuijen, M.R., Auliya, M. and Voris, H.K. (2006). The current and historic distribution of Tomistoma schlegelii (the False Gharial) (Müller 1838) (Crocodylia, Reptilia). The Raffles Bulletin of Zoology, 54, 181 – 197. Swofford, D.L. (2003). PAUP*: Phylogenetic analysis using parsimony (* and other methods), version 4.0b 10. Sunderland, Massachusetts: Sinauer Associates.
Tajima, F. and Nei, M. (1984). Estimation of evolutionary distance between nucleotide sequences. Molecular Biology and Evolution, 1, 269 – 285.
Tajima, F. (1989). Statistical method for testing the neutral mutation hypothesis by DNA polymorphism. Genetics, 123, 585 – 595.
127
Tamura, K. and Nei, M. (1993) Estimation of the number of nucleotide substitutions in the control region of mitochondrial DNA in humans and chimpanzees. Molecular Biology and Evolution, 10, 512 – 526.
Tamura, K., Dudley, J., Nei, M. and Kumar, S. (2007) MEGA4: Molecular Evolutionary Genetics Analysis (MEGA) software version 4.0. Molecular Biology and Evolution, 24, 1596 – 1599.
Taylor, J. S. and Breden, F. (2000). Slipped – strand mispairing at noncontiguous repeats in Poecilia reticulate: A model for minisatellite birth. Genetics, 155, 1313 – 1320. Tomistoma Task Force (2007). Facilities Holding Tomistoma. http://tomistoma.org. Accessed 03 August 2009. Vasconcelos, W.R., Hrbek, T., Silveira, R.D., de Thoisy, B., Marioni, B. and Farais, I.P. (2006). Population genetic analysis of Caiman crocodiles (Linnaeus, 1958) from South America. Genetics and Molecular Biology, 29 (2), 220 – 230. Vasconcelos, W.R., Hrbek, T., Silveira, R.D., de Thoisy, B., Ruffeil, L.A.A.D.S. and Farais, I.P. (2008). Phylogeographic and conservation genetic analysis of the Black Caiman (Melanosuchus niger). Journal of Experimental Zoology, 309A, 600 – 613. Vawter, L. and Brown, W.M. (1986). Nuclear and mitochondria DNA comparisons reveal extreme rate variation in the molecular clock. Science, 234, 194 – 196. Venegas – Anaya, M., Crawford, A.J., Galvan, A.H.E., Sanjur, O., Densmore, L. D. and Bermingham, E. (2008). Mitochondrial DNA Phylogeography of Caiman crocodiles in Mesoamerica and South America. Journal of Experimental Zoology, 309A, 614 – 627. Voris, H.K. (2000). Maps of Pleistocene sea levels in Southeast Asia: shorelines, river systems and time durations. Journal of Biogeography, 27, 1153 – 1167. Warren, K.S., Verschoor, E.J., Langenhuijen, S., Heriyanto, Swan, R.A., Vigilant, L. and Heeney, J.L. (2001). Speciation and intrasubspecific variation of Bornean Orangutans, Pongo pygmaeus pygmaeus. Molecular Biology and Evolution, 18 (4), 472 – 480. Weaver, J.P., Rodriguez, D., Venegas – Anaya, M., Cedeno – Vasquez , J.R., Forstner, M.R.J. and Densmore, D.A. (2008). Genetic characterization of captive Cuban crocodiles (Crocodylus rhombifer) and evidence of hybridization with the American crocodile (Crocodylus acutus). Journal of Experimental Zoology, 309A, 600 – 613.
128
Wenick, P.W., Baker, A.J. and Tetanus, M.G.J. (1994). Mitochondrial control – region sequences in two shorebird species, the turnstone and the dunlin, and their utility in population genetic studies. Molecular Biology and Evolution, 11, 22 – 31. Wilkinson, G.S. and Chapman, A.M. (1991). Length and sequence variation in evening bat D – loop mtDNA. Genetics, 128, 607 – 617. Wilkinson, G.S., Mayer, F., Kerth, G. and Petri, B. (1997). Evolution of repeated sequence arrays in the D- loop region of bat mitochondrial DNA. Genetics, 146, 1035 – 1048. Willis, R.E., McAliley, L.R., Neeley, E.D. and Densmore, L.D. (2007). Evidence for placing the false gharials (Tomistoma schlegelii) into the family Gavialidae: Inferences from nuclear gene sequences. Molecular Phylogenetics and Evolution, 43 (3), 787 – 794. Wright, S. (1951). The genetical structure of populations. Annals of Eugenics, 15, 323 – 354. Xiao, B., Ma, F., Sun, Y. and Li, Q.W. (2006). Comparative analysis of complete mitochondrial DNA control region of four species of Strigiformes. Acta Genetica Sinica, 33 (11), 965 – 974. Zhang, Y., Wang, X., Ryder, O.A., Li, H., Zhang, H., Yong,Y. and Wang, P. (2002). Genetic diversity and conservation of endangered animal species. Pure and Applied Chemistry, 74 (4), 575 – 584. Zhang, Y., Nei, L., Huang, Y., Pu, Y. and Zhang, L. (2009). The mitochondrial DNA control region comparison studies of four hinged turtles and its phylogenetic significance of the genus Cuora sense Lato (Testudinata: Geomydidae). Genes and Genomics, 31 (5), 349 – 359. Zhao, X., Li, N., Guo, W., Hu, X., Liu, Z., Gong, G., Wang, A., Feng, J. and Wu, C. (2004). Further evidence for paternal inheritance of mitochondrial DNA in the sheep (Ovis aries). Heredity, 93, 399 – 403. Zouros, E., Freeman, K.R., Ball, A.O., and Pogson, G.H. (1992). Direct evidence for extensive mitochondrial DNA inheritance in the marine mussels Mytilus. Nature, 359, 412 – 414.
129
Appendix 1 Ventral approach to the caudal vein
Figure 1: Ventral approach to the caudal vein using an 18 G Spinocan needle. The needle is inserted approximately 10 cm from the vent.
130
Appendix 2 Genbank accession number for the respective specimens for cyt b – CR and the ND 6 – tRNAglu – cyt b marker.
Table 1: Laboratory voucher number and Genbank Accession Number following geographical origins for the respective gene markers. Gene marker Origin Lab voucher Genbank Accession Number
Sarawak SAR002 HM593977 Sarawak SAR002 HM593978 Sarawak SAR004 HM593979 Sarawak SAR005 HM593980 Peninsular Malaysia PM006 HM593981 Peninsular Malaysia PM007 HM593982 Peninsular Malaysia PM008 HM593983 Peninsular Malaysia PM009 HM593984 Peninsular Malaysia PM010 HM593985 Peninsular Malaysia PM011 HM593986 Peninsular Malaysia PM012 HM593987 Peninsular Malaysia PM013 HM593988 Peninsular Malaysia PM014 HM593989 Peninsular Malaysia PM015 HM593990 Peninsular Malaysia PM016 HM593991 Peninsular Malaysia PM017 HM593992 Peninsular Malaysia PM018 HM593993 Peninsular Malaysia PM019 HM593994 Peninsular Malaysia PM020 HM593995 Sarawak SAR021 HM593996 Sarawak SAR022 HM593997 Sarawak SAR023 HM593998 Unknown PM029 HM593999 Unknown PM030 HM594000 Hong Kong HK1 HM594001 Hong Kong HK2 HM594002 Hong Kong HK3 HM594003 Hong Kong HK4 HM594004 Unknown SZG3 HM594005 Unknown SZG10 HM594006 Unknown SZG6 HM594007 Unknown SZG2 HM594008 Unknown SZG8 HM594009 Unknown SZG7 HM594010 Unknown SZG5 HM594011
cyt b – CR
Unknown SZG4 HM594012
131
Unknown SZG1 HM594013 Unknown SZG9 HM594014 Sumatra SUM036 HM594015 Sumatra SUM037 HM594016 Sumatra SUM038 HM594017 West Kalimantan KAL039 HM594018 West Kalimantan KAL040 HM594019 West Kalimantan KAL041 HM594020 West Kalimantan KAL043 HM594021 West Kalimantan KAL044 HM594022 West Kalimantan KAL045 HM594023 Unknown J046 HM594024 Unknown J047 HM594025 Unknown J048 HM594026 Unknown J049 HM594027 Unknown J050 HM594028 Unknown J051 HM594029 Unknown J052 HM594030 Unknown J053 HM594031 Unknown J054 HM594032
Sarawak SAR002 HM594033 Sarawak SAR002 HM594034 Sarawak SAR004 HM594035 Sarawak SAR005 HM594036 Peninsular Malaysia PM006 HM594037 Peninsular Malaysia PM007 HM594037 Peninsular Malaysia PM008 HM594039 Peninsular Malaysia PM009 HM594040 Peninsular Malaysia PM010 HM594041 Peninsular Malaysia PM011 HM594042 Peninsular Malaysia PM012 HM594043 Peninsular Malaysia PM013 HM594044 Peninsular Malaysia PM014 HM594045 Peninsular Malaysia PM015 HM594046 Peninsular Malaysia PM016 HM594047 Peninsular Malaysia PM017 HM594048 Peninsular Malaysia PM018 HM594049 Peninsular Malaysia PM019 HM594050 Peninsular Malaysia PM020 HM594051 Sarawak SAR021 HM594052 Sarawak SAR022 HM594053 Sarawak SAR023 HM594054 Unknown PM029 HM594055 Unknown PM030 HM594056
ND 6 – tRNAglu – cyt b
Hong Kong HK1 HM594057
132
Hong Kong HK2 HM594058 Hong Kong HK3 HM594059 Hong Kong HK4 HM594060 Unknown SZG3 HM594061 Unknown SZG10 HM594062 Unknown SZG6 HM594063 Unknown SZG2 HM594064 Unknown SZG8 HM594065 Unknown SZG7 HM594066 Unknown SZG5 HM594067 Unknown SZG4 HM594068 Unknown SZG1 HM594069 Unknown SZG9 HM594070 Sumatra SUM036 HM594071 Sumatra SUM037 HM594072 Sumatra SUM038 HM594073 West Kalimantan KAL039 HM594074 West Kalimantan KAL040 HM594075 West Kalimantan KAL041 HM594076 West Kalimantan KAL043 HM594077 West Kalimantan KAL044 HM594078 West Kalimantan KAL045 HM594079 Unknown J046 HM594080 Unknown J047 HM594081 Unknown J048 HM594082 Unknown J049 HM594083 Unknown J050 HM594084 Unknown J051 HM594085 Unknown J052 HM594086 Unknown J053 HM594087 Unknown J054 HM594088
133
Appendix 3 Genetic Divergence for the cyt b – CR and ND 6 – tRNAglu – cyt b data
Table 1: Genetic distance of the cyt b – CR data using Tamura-Nei distance (Tamura and Nei, 1993), based on unequal base frequencies and unequal ratios of transitions to transversions (Ti:Tv) implemented in MEGA (v.4, Kumar et al., 2004)
Gavialis 0.127 0.127 0.125 0.127 0.127 Table 2: Genetic distance of the ND 6 – tRNAglu – cyt b data using Tamura-Nei distance (Tamura and Nei, 1993), based on unequal base frequencies and unequal ratios of transitions to transversions (Ti:Tv) implemented in MEGA (v.4, Kumar et al., 2004)
Figure 1. Neighbour Joining tree for the cyt b – CR data following Tamura Nei (Tamura and Nei, 1993) model generated with PAUP v4.0b using Gavialis as an outgroup. Clades are indicated following lineages (H1 to H6) and geographical regions are bracketed. (PM = Peninsular Malaysia, Sar = Sarawak, Sum = Sumatra, EK = east Kalimantan, U = Unknown)
Figure 2: Maximum Parsimony tree generated for the cyt b – CR data with PAUP v.4.0b using Gavialis as an outgroup. Clades are indicated following lineages (H1 to H6) and geographical regions are bracketed. (PM = Peninsular Malaysia, Sar = Sarawak, Sum = Sumatra, EK = east Kalimantan, U = Unknown).
H4 (PM)
H6 (EK)
H5 (U)
H2 (Sar)
H1 (PM and Sum)
136
Figure 3: Maximum Likelihood tree for the cyt b – CR data generated with PAUP v4.0b using Gavialis as an outgroup. Clades are indicated following lineages (H1 to H6) and geographical regions are bracketed. (PM = Peninsular Malaysia, Sar = Sarawak, Sum = Sumatra, EK = east Kalimantan, U = Unknown)
Figure 4: Neighbour Joining tree ND 6 – tRNAglu – cyt b data following Tamura Nei (Tamura and Nei, 1993) model generated with PAUP v4.0b using Gavialis as an outgroup. Clades are indicated following lineages (H1 to H6) and geographical regions are bracketed. (PM = Peninsular Malaysia, Sar = Sarawak, Sum = Sumatra, EK = east Kalimantan, U = Unknown)
Figure 5: Maximum Parsimony tree generated for ND 6 – tRNAglu – cyt b data with PAUP v.4.0b using Gavialis as an outgroup. Clades are indicated following lineages (H1 to H6) and geographical regions are bracketed. (PM = Peninsular Malaysia, Sar = Sarawak, Sum = Sumatra, EK = east Kalimantan, U = Unknown).
H3 (Sum)
H1 (PM and Sar)
H5 (U) and H6 (EK)
H4 (PM)
139
J049
J054
J048
J047
SZG9
SZG5
SZG8
SZG1
SZG7
SZG3
SZG2
SZG6
SZG10
SZG4
HK4
Sar023
Sar022
Sar021
PM020
PM019
PM018
PM017
PM016
PM015
PM014
PM012
PM010
PM009
PM008
PM007
Sar005
Sar004
Sar002
Sar003
HK1
HK2
HK3
Sum036
Sum037
Sum038
J045
J052
J053
PM029
PM030
J039
J040
J041
J043
J044
J046
J050
J051
PM006
PM011
PM013
Gavialis
99
62
54
59
57
61
91
Figure 6: Maximum Likelihood tree generated for ND 6 – tRNAglu – cyt b data with PAUP v4.0b using Gavialis as an outgroup. Clades are indicated following lineages (H1 to H6) and geographical regions are bracketed. (PM = Peninsular Malaysia, Sar = Sarawak, Sum = Sumatra, EK = east Kalimantan, U = Unknown).
H4 (PM)
H1 (PM / Sar)
H3 (Sum)
H5 (U)
H6 (EK)
140
Appendix 5 Haplotype Networks based on parsimony and distance cyt b – CR and ND 6 – tRNAglu – cyt b data
Figure 1: Haplotype network using TCS for the cyt b – CR data. The H4 haplotype was not parsimoniously connected at the 95 % limit.
141
Figure 2. Haplotype network using TCS for cyt b – CR data showing the H4 lineage connection with other lineages at 14 step manual connection limit
142
Figure 3: Haplotype network using TCS for the ND 6 – tRNAglu – cyt b data showing all haplotypes parsimoniously connected at 95% limit
143
Figure 4 . Minimum spanning network using cyt b – CR data showing the H4 lineage on a different evolutionary branch.
H 1
H 4
H 5
H 6
H 2
144
Appendix 4.10 . Minimum spanning network using ND 6 – tRNAglu – cyt b data showing the H4 lineage on a different evolutionary branch.
H 1
H 6
H 5
H 4
H 3
145
Appendix 6 Population subdivision and gene flow analysis for the cyt b – CR and ND 6 – tRNAglu – cyt b data
Table 1a: Population structure estimates using the cyt b – CR data following geographical regions using samples of known origins, excluding the H4 haplotype in the analysis. Above diagonal is the SNN values while below diagonal are the FST
values. The significant value of the SNN and FST estimates are p < 0.0001 and p < 0.001. The sample size for each population is 12 samples for Peninsular Malaysia, 7 for Sarawak, 3 for Sumatra and 5 for East Kalimantan.
Locations Peninsular
Malaysia Sarawak Sumatra east
Kalimantan Peninsular Malaysia
- 0.84 0.67 1.00
Sarawak
0.82 - 1.00 1.00
Sumatra
0.09 1.00 - 1.00
East Kalimantan
0.99 1.00 -
Table 1b: Gene flow estimates following Nm = 1- FST / 2 FST (Hudson et al. 1992) using the cyt b – CR data. Locations Nm from FST
Peninsular Malaysia X Sarawak
0.11
Peninsular Malaysia X Sumatra 5.00 Peninsular Malaysia X East Kalimantan 0.01 Sarawak X Sumatra
0
Sarawak X East Kalimantan 0 Sumatra X East Kalimantan
0
146
Table 2a: Population structure estimates using Protein coding 3’ ND6 – 5’ cyt b region data following geographical regions using samples of known origins, excluding the H4 haplotype in the analysis. Above diagonal is the SNN values while below diagonal are the FST values. The significant value of the SNN and FST estimates are p < 0.0001 and p < 0.001. The sample size for each population is 12 samples for Peninsular Malaysia, 7 for Sarawak, 3 for Sumatra and 5 for East Kalimantan. NGC Locations Peninsular
Malaysia Sarawak Sumatra east
Kalimantan Peninsular Malaysia
- 1.00 1.00 1.00
Sarawak
NS - 1.00 1.00
Sumatra
1.00 1.00 - 1.00
East Kalimantan
1.00 1.00 -
Table 2b: Gene flow estimates following Nm = 1- FST / 2 FST (Hudson et al., 1992) using 3’ ND6 – 5’ cyt b region data. Locations Nm from FST
Peninsular Malaysia X Sarawak
-
Peninsular Malaysia X Sumatra 0 Peninsular Malaysia X East Kalimantan 0
Sarawak X Sumatra
0
Sarawak X East Kalimantan 0 Sumatra X East Kalimantan
0
147
Appendix 7 Neutrality Test for the cyt b – CR and ND 6 – tRNAglu – cyt b data
Table 1: Neutrality test using cyt b – CR data and samples of known origins only. Bold font indicates significance at p < 0.05. Value in brackets are excluding H4 lineage in Peninsular Malaysia. Fu and Li’s D Fu’s Fs Rozas R2 Total 1.71719 7.909 0.1181 Total Peninsular Malaysia 1.50724
(0.75202) 6.563 (0.297)
0.1683 (0.1515)
Table 2: Neutrality test using ND 6 – tRNAglu – cyt b data and samples of known origins only. Bold font indicates significance at p < 0.05. Value in brackets are excluding H4 lineage in Peninsular Malaysia. Fu and Li’s D Fu’s Fs Rozas R2 Total 1.47748 2.439 0.0872 Total Peninsular Malaysia 1.39196
(n.a) 6.658 (n.a)
0.1714 (n.a)
148
Appendix 8 Multiple Sequence Alignment of the mtDNA repetitive region
Figure 1. Sequence alignment of the repetitive region generated after the CSB III using primer L 15790. The 3’ portion of the CSB III is indicated. Motifs R1 and R2 in the motif region are indicated in bold. The VNTR sequence is shaded grey and the motifs in the tandem repeats are in bold. The first 6 individuals are members of family unit, with TK008 being the maternal parent. The heteroplasmic bands of TK011 is indicated as ‘short’ for the 2.8 kb band and ‘long’ for the 3.0 kb band. TK006 is a homoplasmic individual which shared the same VNTRs sequence as the heteroplasmic individual.