Biological Journal of the Linnean Society (1997), 62: 421–442. With 5 figures Phylogeography of the bushmaster (Lachesis muta: Viperidae): implications for neotropical biogeography, systematics, and conservation KELLY R. ZAMUDIO Department of Zoology, University of Washington, Box 351800, Seattle, WA 98195-1800, U.S.A. HARRY W. GREENE Museum of Vertebrate Zoology and Department of Integrative Biology, 3101 Valley Life Sciences Building, University of California, Berkeley, CA 94720-3160, U.S.A. Received 28 November 1996; accepted for publication 9 May 1997 We used mitochondrial gene sequences to reconstruct phylogenetic relationships among subspecies of the bushmaster, Lachesis muta. These large vipers are widely distributed in lowland tropical forests in Central and South America, where three of four allopatric subspecies are separated by montane barriers. Our phylogeny indicates that the four subspecies belong to two clades, the Central American and South American lineages. We use published molecular studies of other taxa to estimate a ‘reptilian mtDNA rate’ and thus temporal boundaries for major lineage divergences in Lachesis. We estimate that the Central and South American forms diverged 18–6 Mya, perhaps due to the uplifting of the Andes, whereas the two Central American subspecies may have diverged 11–4 Mya with the uprising of the Cordillera de Talamanca that separates them today. South American bushmasters from the Amazon Basin and the Atlantic Forest are not strongly differentiated, perhaps due to episodic gene flow during the Pleistocene, when suitable habitat for this species was at times more continuous. Our results agree with previous evidence that genetic divergence among some neotropical vertebrates pre-dated Pleistocene forest fragmentation cycles and the appearance of the Panamanian Isthmus. Based on morphological, behavioral, and molecular evidence, we recognize three species of Lachesis. In addition to L. muta, the widespread South American form, the Central American forms are treated as distinct species (L. melanocephala and L. stenophrys), each deserving of special conservation status due to restricted distribution and habitat destruction. 1997 The Linnean Society of London ADDITIONAL KEY WORDS:—molecular clock – species concepts – vicariance – genetic differentiation – conservation – Serpentes. Correspondence to: Dr K.R. Zamudio, current address: Museum of Vertebrate Zoology, 3101 Valley Life Sciences Building, University of California, Berkeley, CA 94720-3160, U.S.A. e-mail: [email protected]421 0024–4066/97/110421+22 $25.00/0/bj970162 1997 The Linnean Society of London
Transcript
Biological Journal of the Linnean Society (1997), 62: 421–442. With 5 figures
Phylogeography of the bushmaster (Lachesismuta: Viperidae): implications for neotropicalbiogeography, systematics, and conservation
KELLY R. ZAMUDIO
Department of Zoology, University of Washington, Box 351800, Seattle, WA 98195-1800,U.S.A.
HARRY W. GREENE
Museum of Vertebrate Zoology and Department of Integrative Biology, 3101 Valley Life SciencesBuilding, University of California, Berkeley, CA 94720-3160, U.S.A.
Received 28 November 1996; accepted for publication 9 May 1997
We used mitochondrial gene sequences to reconstruct phylogenetic relationships amongsubspecies of the bushmaster, Lachesis muta. These large vipers are widely distributed inlowland tropical forests in Central and South America, where three of four allopatricsubspecies are separated by montane barriers. Our phylogeny indicates that the foursubspecies belong to two clades, the Central American and South American lineages. Weuse published molecular studies of other taxa to estimate a ‘reptilian mtDNA rate’ and thustemporal boundaries for major lineage divergences in Lachesis. We estimate that the Centraland South American forms diverged 18–6 Mya, perhaps due to the uplifting of the Andes,whereas the two Central American subspecies may have diverged 11–4 Mya with the uprisingof the Cordillera de Talamanca that separates them today. South American bushmastersfrom the Amazon Basin and the Atlantic Forest are not strongly differentiated, perhaps dueto episodic gene flow during the Pleistocene, when suitable habitat for this species was attimes more continuous. Our results agree with previous evidence that genetic divergenceamong some neotropical vertebrates pre-dated Pleistocene forest fragmentation cycles andthe appearance of the Panamanian Isthmus. Based on morphological, behavioral, andmolecular evidence, we recognize three species of Lachesis. In addition to L. muta, thewidespread South American form, the Central American forms are treated as distinct species(L. melanocephala and L. stenophrys), each deserving of special conservation status due torestricted distribution and habitat destruction.
Correspondence to: Dr K.R. Zamudio, current address: Museum of Vertebrate Zoology, 3101Valley Life Sciences Building, University of California, Berkeley, CA 94720-3160, U.S.A. e-mail:[email protected]
4210024–4066/97/110421+22 $25.00/0/bj970162 1997 The Linnean Society of London
Systematists have demonstrated patterns of strong differentiation between Centraland South American biotas, involving species as well as higher taxa (e.g. Savage,1966, 1982; Rosen, 1975; Wake & Lynch, 1976; Duellman, 1979; Gentry, 1982a;Cadle, 1985; Crother, Campbell & Hillis, 1992). Such analyses of individuallineages might corroborate previous biogeographic models as well as generate novelhypotheses, the predictions of which are testable with phylogeographic studies ofadditional groups with similar distributional patterns. Congruent phylogenetic pat-terns among diverse groups, interpreted in a geological context, can then be usedto infer a generalized history of the area under study (e.g. Kluge, 1989; Cracraft,1994). Such general historical explanations for patterns of differentiation within andamong taxa require estimates of the temporal framework for the separation oflineages within each group, because a common temporal framework may not applyto all groups with similar geographic distributions (Cadle, 1985). Thus, detailedstudies of specific taxa should include, whenever possible, a temporal estimateindependent of that assumed for the underlying biogeographic model.
Although a number of workers have focused on major lineage divergences withinlarge radiations of neotropical organisms (e.g. Cadle, 1984a,b,c; Prance, 1987;Cracraft & Prum, 1988; Ayres & Clutton-Brock, 1992), few investigators haveaddressed more recent differentiation among widespread species or populations (butsee Patton, da Silva & Malcolm, 1996; Patton, in press). Here we use mtDNAsequences to infer phylogenetic relationships among populations of four allopatricsubspecies of a widespread neotropical pitviper, the bushmaster (Lachesis muta), thenuse a molecular clock calibrated for ‘reptilian rates’ of mtDNA evolution to estimatetemporal boundaries for major divergence events within this lineage. Our objectiveshere are first to elucidate the evolutionary history of a prominent component of theCentral and South American herpetofauna, assess its relevance to neotropicalbiogeography and climatic history, and thereby contribute to the emerging rap-prochement of paleontological and neontological perspectives on neotropical biotas(e.g. Cadle & Greene, 1993; Webb & Rancy, 1996; Lundberg, 1997; Patton, inpress). Then, based on our phylogenetic hypothesis, published morphological andbehavioral differences, and the allopatric distributions of distinctive population
BUSHMASTER PHYLOGENY 423
40
10
20
80 50
0
10
6070
rhombeata
muta
78
15
9
87
12
8184
stenophrys
melanocephala
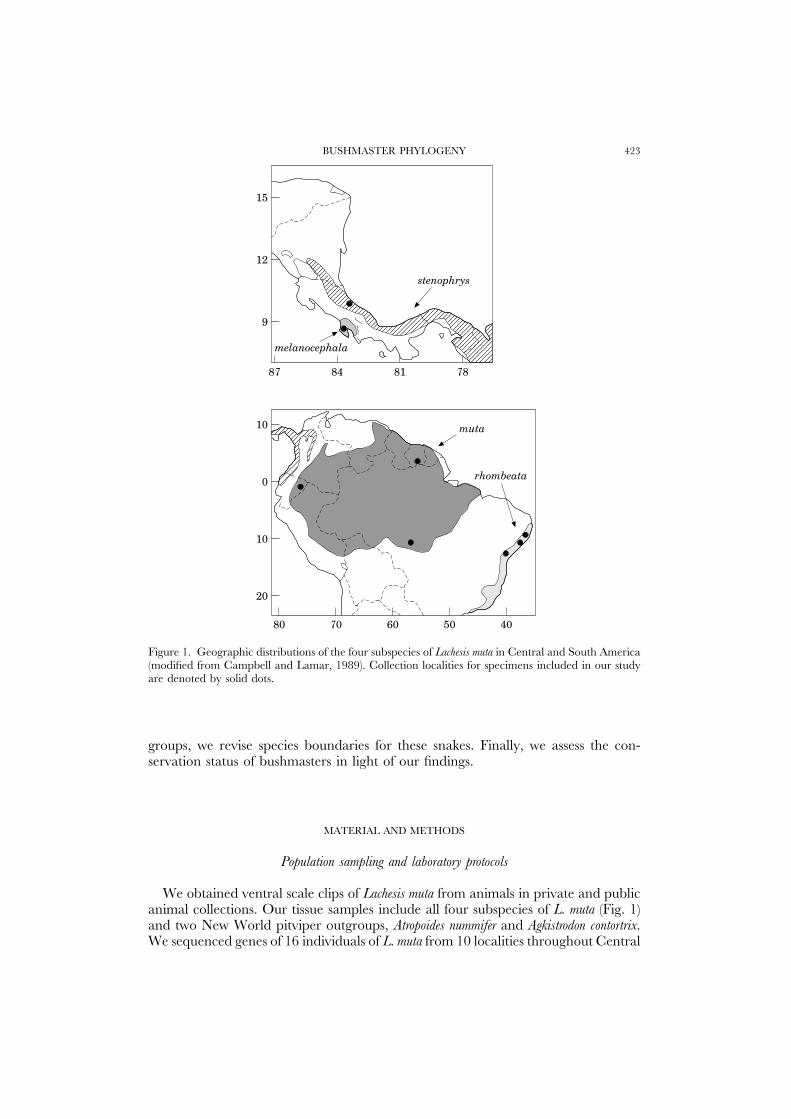
Figure 1. Geographic distributions of the four subspecies of Lachesis muta in Central and South America(modified from Campbell and Lamar, 1989). Collection localities for specimens included in our studyare denoted by solid dots.
groups, we revise species boundaries for these snakes. Finally, we assess the con-servation status of bushmasters in light of our findings.
MATERIAL AND METHODS
Population sampling and laboratory protocols
We obtained ventral scale clips of Lachesis muta from animals in private and publicanimal collections. Our tissue samples include all four subspecies of L. muta (Fig. 1)and two New World pitviper outgroups, Atropoides nummifer and Agkistrodon contortrix.We sequenced genes of 16 individuals of L. muta from 10 localities throughout Central
K. R. ZAMUDIO AND H. W. GREENE424
T 1. Unique mtDNA lineages of Lachesis used for phylogenetic reconstruction. The subspecies,number of individuals with each haplotype, localities of origin, and the sources of tissue samples are
listed for reference
mtDNA haplotype Subspecies Number Localities Source
Muta 1 L. m. muta 3 Tepoe, Surinam (2); D. RipaSurinam, exact locality Dallas Zoo, U.S.A.unknown (1)
Muta 2 L. m. muta 1 Surinam, exact locality Dallas Zoo, U.S.A.unknown
Muta 3 L. m. muta 1 Napo Waimo River area, Dallas Zoo, U.S.A.Ecuador
Muta 4 L. m. muta 3 Ribeirao Cascalheira (3), Instituto Butantan, BrazilMato Grosso, Brazil
Muta 5 L. m. muta 1 Pontes e Lacerda, Mato Instituto Butantan, BrazilGrosso, Brazil
Rhombeata 1 L. m. rhombeata 2 Sao Jose do Lage, Alagoas, Instituto Butantan, BrazilBrazil (1); Sao Paulino, D. RipaBahia, Brazil (1)
Rhombeata 2 L. m. rhombeata 1 Recife, Pemambuco, Brazil Instituto Butantan, BrazilMelanocephala 1 L. m. melanocephala 2 Rincon, Peninsula de Osa, D. Ripa
Costa Rica (2)Stenophrys 1 L. m. stenophrys 2 Bri-Bri (1) and Chiroles (1), D. Ripa
Costa Rica
and South America (Table 1), including all subspecies as well as geographically distantlocalities from throughout the range of the widespread Amazon Basin subspecies(L. m. muta). Although the small number of samples limits interpretation of geographicgenetic structuring within subspecies, they proved sufficient to elucidate phylogeneticrelationships among bushmaster subspecies and their biogeographical history.
Total cellular DNA was isolated from frozen tissue samples by standard proteinaseK extraction, followed by phenol/chloroform purifications (Maniatis, Frisch &Sambrook, 1982). Two segments of the mitochondrial genome were amplified withthe polymerase chain reaction (PCR; Saiki et al., 1988) and two pairs of primers.The regions sequenced correspond to 252 bases of the ND4 gene and 276 bases ofthe cytochrome b gene (cytb). The ND4 gene segment was amplified using primersND4 (5′-CAC CTA TGA CTA CCA AAA GCT CAT GTA GAA GC-3′) andLEU (5′-CAT TAC TTT TAC TTG GAT TTG CAC CA-3′) (Arevalo, Davis &Sites, 1994). Amplification conditions for the ND4 fragment consisted of 30 thermalcycles: 1 min denaturation at 93°C, 30 sec annealing at 56°C, and 2 min extensionat 72°C, followed by a 5 min extension at 72°C. The cytb fragment was amplifiedusing primers MVZ05 (5′-CGA AGC TTG ATA TGA AAA ACC ATC GTT G-3′) and MVZ 04′ (5′-GTA GCA CCT CAG AA[C/G/T] GAT ATT TG-3′).Amplification conditions for the cytb fragment consisted of 30 thermal cycles: 1 mindenaturation at 94°C, 1 min annealing at 45°C, and 2 min extension at 72°C,followed by a 5 min extension at 72°C. In every case, one primer was markedwith a biotinylated 5′ end. Four microliters of the resulting PCR products wereeletrophoresed on a 1% agarose gel and visualized with ethidium bromide stainingto verify product band size. Single-stranded template for sequencing was obtaineddirectly from the remaining amplified product by use of Streptavidin-coated magneticbeads (according to manufacturer’s protocol, Dynal, Inc.). The bead/DNA solutionwas used directly in dideoxy chain-termination sequencing (Sanger, Nicklen &
BUSHMASTER PHYLOGENY 425
Coulson, 1977) with Sequenase Version 2.0 (U.S. Biochemicals) and 35S labelleddATP. Sequences were obtained for only one direction, using primers ND4 andMVZ04′ in the sequencing reactions.
Data analyses
Sequences were read from one strand and aligned by eye to each other and topublished sequences of Xenopus (Roe et al., 1985). Pairwise sequence comparisons todetermine the distribution and amount of variation, and levels of saturation bycodon position were performed using the Molecular Evolutionary Genetics Program(MEGA, Version 1.01; Kumar, Tamura & Nei, 1993). Phylogenetic analysis wasperformed using aligned sequences for both gene regions combined (total 528nucleotides). We used only unique mtDNA lineages for phylogenetic reconstruction(Table 1), so our final data set, including the two outgroup species, is composed of11 unique mtDNA haplotypes. All mtDNA sequences included in this study havebeen entered in the GenBank/EMBL databases under accession numbers U96015-U96034.
We used maximum likelihood (ML; Felsenstein, 1981, 1993) and maximumparsimony analysis (Swofford, 1997), in combination with various weighting schemes,for phylogenetic inference. Each base position was treated as an unordered characterwith four alternative states. Trees were rooted by outgroup comparisons withsequences of two New World pitvipers (Akgistrodon contortrix and Atropoides nummmifer).We reconstructed and evaluated maximum likelihood trees using the DNAMLprogram in Phylip 3.5 (Felsenstein, 1993). In ML we used equal-weighting, whereall substitutions are weighted equally regardless of type or codon position, and threedifferential transitions/transversion weighting schemes (ts/tv=1/5, ts/tv=1/10,and ts/tv=1/15). Sequence of taxon entry in phylogenetic reconstructions can biasspecies position in the resulting tree (Maddison, 1991), so we used ten repeatedrandomized input orders for all ML analyses. Maximum parsimony phylogenieswere estimated using the exhaustive search option in PAUP∗ 4.0 (Swofford et al.,1996). We searched for most parsimonious trees by using four weighting schemes:one assuming equal weights for every codon position and the others downweightingonly third-position transitions relative to all other substitution types (by a factor of5, 10, and 15). For each weighting scheme, we also performed bootstrap analysesas a relative measure of clade support (Felsenstein, 1985; Hillis & Bull, 1993); thesewere based on 1000 replicates, each using the branch and bound algorithm.Parsimony and ML results were compared across all weighting methods for con-gruence of tree topologies.
Estimating evolutionary divergence times in Lachesis
Studies of mtDNA evolution among various vertebrate lineages indicate a mutationrate of approximately 2% sequence divergence per million years (Upholt & Dawid,1977; Brown, George & Wilson, 1979), and this ‘standard’ rate has been used todate divergences in numerous other taxa (e.g. Meyer et al., 1990; Thorpe et al.,1994; Riddle, 1995). Recent evidence underscores variation in the rate of mtDNAevolution among vertebrates (Avise et al., 1992; Martin, Naylor & Palumbi, 1992;
K. R. ZAMUDIO AND H. W. GREENE426
Rand, 1993, 1994), implying that rate calibrations for one group may not beappropriate for others. In particular, absolute rate-heterogeneity is associated prim-arily with body size and metabolic rate (Martin & Palumbi, 1993; Rand, 1994),such that endotherms and ectotherms exhibit distinct relationships, and rate ofmtDNA evolution and an organism’s body size are negatively correlated within eachgroup. Rates and associated errors of clocks should thus be calibrated for a specifictaxonomic group under study, based on the fossil record or vicariant events, andinterpreted with caution (Rand, 1994). To more accurately estimate the temporalscale of diversification in bushmasters, we calibrated the rate of mtDNA evolutionfor reptiles based on other published studies in this group. The requirements forinclusion in our rate estimate were that the ectotherm should be roughly similar inmass to Lachesis, large adults of which weigh 3–5 kg (Greene, unpublished data), andthat the ‘known’ divergence date (from fossils or geologic evidence) was at least5 Mya (to avoid biases associated with very recent divergences). We then used thehighest and lowest rates observed in the published studies to define boundaries ofdivergence times during the evolutionary history of Lachesis.
Five studies meet our criteria for estimating a ‘reptile mtDNA rate’ (Table 2).Lamb, Avise & Gibbons (1989) reported divergences and rates of evolution withinand between species of tortoises based on RFLP analysis of the entire mtDNAgenome; because they included more than one individual from within each speciesor lineage, we corrected for within-lineage sequence divergences (according to Aviseet al., 1992). Thorpe et al. (1994) applied a standard vertebrate clock (2%/my) toestimate colonization times for Gallotia galloti in the Canary Islands from two mainlandancestors; we combined their sequence data for cytochrome b, cytochrome oxidasesubunit I, and 12S rRNA to estimate a mitochondrial divergence rate, assumingcolonization occurred from ancestral populations at the time of the origin of theislands. We averaged the resulting rates from both putative ancestors and did notcorrect for within-lineage divergences, because the authors reported sequences foronly one individual from each species. We estimated a mitochondrial divergencerate for xantusiid lizards from the cytochrome b and rRNA 12S sequence-basedphylogeny of Hedges, Bezy & Maxson (1991), by assuming that the Cuban endemicCricosaura diverged from other xantusiids as the proto-Antilles drifted from theiroriginal Middle American position, approximately 70–60 Mya (Crother & Guyer,1996; Hedges, 1996). Finally, we used sequences for Galapagos iguanas andimmediate outgroup taxa (Rassmann, 1997) and estimated their divergence rate,assuming speciation began shortly after geologic origin of the islands. In this study,our estimated rate combined 16S and 12S gene fragments and was averaged acrossboth species.
RESULTS
Genetic differentiation
We obtained sequences of 528 base pairs (coding for 176 amino acids) from 16individuals of Lachesis muta and one individual each of Agkistrodon contortrix andAtropoides nummifer. No substitutions causing frameshifts were present, and sequencesfrom both gene segments were combined in the final analysis. Levels of uncorrected
BUSHMASTER PHYLOGENY 427
T
2.m
tDN
Aev
olut
ion
rate
sfo
rre
ptile
spec
ies
orlin
eage
s.T
heev
olut
iona
ryev
ent,
poss
ible
vica
rian
teve
nts,
%se
quen
cedi
verg
ence
,m
etho
dof
dive
rgen
cees
timat
ion,
and
appr
oxim
ate
dive
rgen
cera
tear
elis
ted
for
the
five
rept
iles
used
inth
isst
udy
Evo
lutio
nary
even
tV
icar
iant
even
t(ti
me
at%
sequ
ence
Met
hod
ofD
iver
genc
era
teR
efer
ence
sdi
verg
ence
,M
ya)
dive
rgen
cees
timat
ion
(%/m
y)
Xer
obat
es,
east
/wes
tB
ouse
emba
ymen
t(5
.5)
5.3a
RFL
P(e
ntir
e0.
95L
amb
etal
.,19
89m
tDN
A)
Gop
heru
s/X
erob
ates
Non
eb(2
3–15
)11
.2a
RFL
P(e
ntir
e0.
48–0
.75
Lam
bet
al.,
1989
mtD
NA
)G
allo
tia
gallot
i,fr
omO
rigi
n/co
loni
zatio
nof
12.5
cSe
quen
ce(c
ytb,
0.80
Tho
rpe
etal
.,19
94an
cest
ralp
opul
atio
nsis
land
(15.
7)C
OI,
12S
aver
aged
)C
rico
saur
a/ot
her
Frag
men
tatio
nof
isla
nd32
.6c
Sequ
ence
(cyt
b0.
47–0
.50
Hed
ges
etal
.,19
91xa
ntus
iids
arc
(60–
70)
and
12S
aver
aged
)A
mbl
yrhy
ncus
and
Ori
gin/
colo
niza
tion
of6.
6cSe
quen
ce(1
2S0.
73–1
.32
Ras
sman
n(in
pres
s)C
onol
ophu
s/m
ainl
and
isla
nd(9
–5)
and
16S
sist
ersp
ecie
sav
erag
ed)
a%
sequ
ence
dive
rgen
ceco
rrec
ted
for
with
inlin
eage
dive
rgen
ces:
p cor
r=p x
y−0.
5(p x+
p y),
whe
rep x
yis
the
mea
npa
irw
ise
gene
ticdi
stan
cebe
twee
nin
divi
dual
sin
popu
latio
nsx
and
y,an
dp x
and
p yar
enu
cleo
tide
dive
rsiti
esw
ithin
regi
ons
orpo
pula
tions
(Avi
seet
al.,
1993
).b
Div
erge
nce
time
ofge
nera
estim
ated
from
foss
ilre
cord
.cA
vera
geof
unco
rrec
ted
%se
quen
cedi
verg
ence
betw
een
sist
ersp
ecie
s.
K. R. ZAMUDIO AND H. W. GREENE428
T 3. Percent sequence divergences (uncorrected) among all unique mtDNA Lachesis haplotypesand two outgroups (Agkistrodon contortrix and Atropoides nummifer). Above diagonal: mean pairwise sequence
Figure 2. Saturation graphs for transitions and transversions at 1st, 2nd, and 3rd codon positions.Pairwise comparisons between all Lachesis haplotypes and two outgroups using uncorrected proportionaldistances and Tamura-Nei corrected distances are plotted for all six substitution categories. Deviationsfrom the isometric line indicate that changes in that particular class of mutation are possibly biaseddue to ‘multiple hits’ at any one nucleotide position.
sequence divergence among the nine unique Lachesis haplotypes ranged from 0.2%(among samples of the South American forms) to 9.1% (between L. m. melanocephalaand South American forms; Table 3). Uncorrected sequence divergences betweenLachesis and the outgroup taxa ranged from 13.8 to 17.0%. Of the total 528characters, 138 were variable and 69 were phylogenetically informative.
To assess levels of saturation of base substitutions at each codon position, weplotted uncorrected percent sequence divergences against Tamura-Nei estimates ofrelative sequence divergence for transitions and transversions at 1st, 2nd, and 3rdcodon positions (Fig. 2; modified from Moritz, Schneider & Wake, 1992; Villablanca,
BUSHMASTER PHYLOGENY 429
0 1 2 3 4 5%
melanocephala1 Peninsula de Osa, Costa Rica
outgroups
stenophrys1 Bri-bri/Chiroles, Costa Rica
rhombeata2 Pernambuco, Brazil
rhombeata1
muta5
muta4
Alagoas/Bahia, Brazil
muta3
Mato Grosso, Brazil
muta2
Equador
muta1
Surinam
Figure 3. Maximum likelihood phylogeny for nine unique haplotypes of Lachesis with all charactersweighted equally. The tree was rooted by the two outgroups sequenced in this study (Atropoides nummiferand Agkistrodon contortrix). Reconstructions with transitions and transversions weighted differentially areidentical in topology to the tree shown here. Except where indicated, branches are drawn proportionalto branch lengths estimated by the Maximum Likelihood algorithm and a % scale is included forreference.
1993). Non-isometric plots indicate increasing saturation of transitions or trans-versions at each codon position; third position transitions are potentially saturatedand thus may possibly bias phylogenetic reconstruction because of ‘multiple hits’.We therefore explored a number of different weighting schemes in our reconstructionsincluding equal-weighting, downweighting of third position transitions relative toother substitutions, and differential weighting of transitions relative to transversions.
Phylogenetic relationships
All weighting schemes in parsimony resulted in three most parsimonious trees,and the strict consensus of the three trees is represented in Figure 4. Parsimonyreconstruction under equal weighting resulted in three most parsimonious trees thatwere 183 steps in length (CI=0.842, RI=0.736). All differential weighting schemesresulted in 3 parsimonious trees that varied in length: L=459 (for 3rd positiontransitions downweighted 1:5), L=804 (1:10), and L=1149 (1:15), but were consistentin other measures of fit (CI=0.806, RI=0.731). Maximum likelihood reconstructions
K. R. ZAMUDIO AND H. W. GREENE430
melanocephala1 Peninsula de Osa, Costa Rica
outgroups
stenophrys1 Bri-bri/Chiroles, Costa Rica
rhombeata2 Pernambuco, Brazil
rhombeata1
muta5
muta4
Alagoas/Bahia, Brazil
muta3
Mato Grosso, Brazil
muta2
Equador
muta1
Surinam8784
8886
6767
6564
100
6564
6765
8688
8786
9894
9897
100
Figure 4. Strict consensus of three most parsimonious phylogenies for nine unique haplotypes ofLachesis. Numbers along the branches are bootstrap values from the four weighting schemes used inparsimony reconstruction. Bootstrap values were estimated from 1000 replicates and are listed (fromtop to bottom) for equal-weighting, and for third position transitions downweighted by a factor of 5,10, and 15 relative to other substitution types. A single number is listed at nodes where bootstrapswere identical for all weighting schemes.
yielded identical topologies to those obtained in parsimony. Ten independent MLreconstructions with equal weighting resulted in one tree (Fig. 3; LnL=−1608.4).Multiple ML runs with differential weighting of transitions and transversions resultedin identical topologies: LnL=−1577.5 for a ts/tv of 1:5, LnL=−1588.2 for ts/tvof 1:10, and LnL=−1598.3 for ts/tv of 1:15. These results suggest that the transitionbias evident in third codon positions in our data does not affect phylogeneticreconstruction.
Maximum likelihood (Fig. 3) and maximum parsimony (Fig. 4) methods, underall weighting assumptions, yielded identical phylogenetic trees for populations ofLachesis. A single basal divergence separates the four allopatric subspecies of L. mutainto South and Central American pairs. Further differentiation is present in theCentral American forms: the unique mtDNA haplotypes of L. m. stenophrys and L.m. melanocephala from either side of the Central American Cordillera exhibit cleargenetic differentiation. Divergence in the South American pair is less evident, inthat the Amazon Basin (L. m. muta) and Atlantic Forest forms (L. m. rhombeata) areclosely related and form a polytomy in our reconstruction.
Maximum parsimony bootstrap analyses and maximum likelihood branch lengthsindicate the relative support for all clades in our phylogeny (Figs 3 and 4). Themonophyly of both the South and Central American clades is supported by highbootstrap values (ranging from 94 to 100%), and long branches are indicative of
BUSHMASTER PHYLOGENY 431
T 4. Upper and lower time estimates for major divergences within Lachesis using the reptilemtDNA divergence rates. Overall sequence divergences are corrected for within-lineage variability
Between South and 8.44 0.47 17.9Central America 1.32 6.4
Between stenophrys and 5.30 0.47 11.0melanocephala 1.32 4.0
Between muta and 0.40 0.47 0.8rhombeata 1.32 0.3
deep differentiation between the two sister pairs. Divergence between the twoCentral American subspecies is also well supported, as is evident from the longbranches in the ML reconstruction (Fig. 3). Our sampling allows for only tentativeinterpretation of divergences within the South American lineage, but most branchesare relatively short and bootstrap resampling in the parsimony analysis offers limitedsupport for geographic differentiation within this clade. Although the haplotypesrepresenting the Atlantic Forest L. m. rhombeata are distinct and form their own clade(supported by bootstraps >85%), their phylogenetic placement is uncertain; there issome suggestion that L. m. rhombeata may be more closely related to particularpopulations of L. m. muta in southern regions of its distribution (e.g. Mato Grosso,Brazil). In any case, differentiation among the South American samples is lesspronounced than between the Central American subspecies.
Rates of reptile mtDNA evolution and divergences in Lachesis
The reptilian mtDNA rates we estimated vary from 0.47 to 1.32%/my (Table 3)and, although the particular mtDNA genes used in the five published studies weredifferent than those we used for Lachesis, all estimates are lower than the 2%/mycommonly used ‘vertebrate rate’ (based primarily on data for mammals). Our ratesare simply high and low point estimates based on five appropriate studies. Each ofthese estimates is only an approximate calibration, because they do not includecorrections for sequence errors or saturation of changes at most variable codonpositions. We are well aware of the difficulty of applying molecular clock estimates(e.g. Collins, 1996; Hillis, Mable & Moritz, 1996), and regard our ‘ballpark’estimates of mtDNA divergence rates only as a useful starting point in formulatingbiogeographic hypotheses for small to medium-sized ectotherms. Accordingly, alineage including Lachesis split from our outgroup pitvipers roughly 36–10 Mya, bythe mid-Miocene and perhaps much earlier. Divergence between South and CentralAmerican Lachesis might have occurred 18.0–6.5 Mya, the split between CentralAmerican L. m. melanocephala and L. m. stenophrys perhaps took place 11–4 Mya, and
K. R. ZAMUDIO AND H. W. GREENE432
Arid/wetglacialcycles
Cool/warmclimaticcycles
Gradual coolingand drying
PanamanianLandbridgeformed
Uplift ofTalamancas
Increased uplift andvolcanism in Andes
Rise of Andes
0Mya
10
20
<0.8 Mya
L. m
uta
mu
ta
L. m
uta
rh
ombe
ata
11–4 Mya
L. s
ten
oph
rys
L. m
elan
ocep
hal
a
18–6 Mya
Figure 5. Summary diagram of evolutionary history of Lachesis populations. The current phylogenyof Lachesis (left) is drawn according to the geological scale and the time ranges estimated by ourcalibration are listed for each node. To the right of the scale are the relevant abiotic changes inCentral and South America during this time period (modified from Potts and Behrensmeyer, 1992).
differentiation among the South American lineages happened only 300 000 to800 000 years ago (Table 4 and Fig. 5).
DISCUSSION
Biogeographical implications
Morphological and molecular evidence thus far offers limited insights on theorigin of Lachesis. Briefly, pitvipers probably diverged from other vipers in Eurasiaduring the early Tertiary, and invaded the New World via a Bering land bridge nolater than the Miocene (Cadle, 1987; Kraus, Mink & Brown, 1996). Studies to datesuggest that bushmasters are not basal to all other New World pitvipers or even toall other predominantly neotropical lineages, and there is as yet no strong evidencelinking Lachesis with any particular other pitviper lineages (Kraus, Mink & Brown,1996; Vidal et al., 1997). Therefore, although these snakes are often assigned toSouth American faunal assemblages in biogeographic analyses, from the perspectiveof vicariance biogeography, we cannot at this point exclude the hypothesis thatCentral American Lachesis are remnants of initial colonization of the tropics (fromthe north) rather than more recent immigrants from South America.
BUSHMASTER PHYLOGENY 433
The allopatric ranges of current subspecies, subdivided by major montane axes(the Andes and the Cordillera de Talamanca), suggest that vicariant geologic eventsunderlie differentiation in these snakes. Bushmasters typically occur at elevationsbelow 1000 m in moist tropical forests (Vial & Jımenez-Porras, 1967); the onlyexception is L. m. melanocephala in Costa Rica, which inhabits forests up to at least1500 m (Solorzano & Cerdas, 1986). In addition to the mountain ranges currentlyseparating Lachesis subspecies, our current understanding of Central and SouthAmerican geological history suggests a dynamic picture of tectonic movementinterspersed by temporary links between the two continents over the last 150 millionyears (Gentry, 1982a; Estes & Baez, 1985; Rasanen, Salo & Kalliola, 1987; Pindell& Barrett, 1990; Hoorne, 1993, 1994). Much of this history probably predates theevolution of Lachesis or its ancestors; however, given uncertainty about the firstappearance of vipers in the New World and about the age of Lachesis (Cadle, 1987),we review several geologic events which may have occurred during the evolutionof the bushmasters and, thus, may explain patterns of differentiation among popu-lations in this species.
Most interpretations of geologic data infer two connections between Central andSouth America during the last 100 million years. The first occurred during the lateCretaceous or early Tertiary (90–60 Mya) and was not a continuous land bridge,but rather a series of volcanic arcs connecting North and South America (alsoreferred to as the proto-Antilles; Gentry, 1982a; Pindell & Barrett, 1990; Crother& Guyer, 1996; Hedges, 1996). A northeastward drift of this system fragmented thedistributions of taxa across this island bridge at the beginning of the Tertiary(>80 Mya). There was in fact faunal exchange between the two continents (includingby dinosaurs, crocodilians, lizards, and primitive snakes) at the Cretaceous-Tertiaryboundary (Estes & Baez, 1985). Both continents were separated to at least somedegree by a marine barrier for much of the Tertiary, and this vicariant event hasbeen implicated in the diversification of various groups of organisms, including somefrogs, colubrid snakes, and angiosperms (Gentry, 1982a; Savage, 1982; Cadle, 1985).
The second proposed connection is the Pliocene formation of the Isthmian Linkat approximately 3.5 Mya, during which extensive volcanism led to the uplift ofislands that eventually coalesced into today’s Isthmus of Panama (Coates & Obando,1996). This re-establishment of a dispersal route between North and South Americaheavily influenced present distributions of a variety of organisms, particularly landmammals (Marshall et al., 1982; Webb, 1991); however, although some taxa dispersedwholesale during this interchange (references in Stehli & Webb, 1985), currentdistributional patterns indicate minimal interchange for Central and South Americanamphibians and reptiles (Cadle, 1985; Vanzolini & Heyer, 1985). For those lattergroups, dispersal subsequent to complete closure of the marine Panamanian Portalseems to have been limited to a few species which favor drier habitats (e.g. theneotropical rattlesnake Crotalus durissus), those conditions having predominated inthe area at that time (Cadle, 1987). Despite the lack of a continuous dispersal routeduring most of the Tertiary, fossil and recent phylogeographic evidence suggeststerrestrial faunal exchanges did occur between the continents during most of thistime (Cadle & Sarich, 1981; Estes & Baez, 1985). Reptiles in particular must havemoved between the northern and southern land masses, perhaps by means of shiftingisland chains that formed in the area occupied today by lower Central America.
Geological or climatic events with potentially major importance for neotropicalspecies during the Cenozoic included the uplift of the Andes, the uplift of the Central
K. R. ZAMUDIO AND H. W. GREENE434
American highlands, and the advent of Pleistocene climatic fluctuations associatedwith glacial advances and retreats at higher latitudes. The Andean orogeny iscomplex. It is well established that certain parts of the Andes already existed duringthe Cretaceous (Van der Hammen, 1961; Kroonenberg, Bakker & Van der Wiel,1990), although at much lower elevations. Mid-Miocene activity in the Andean axisuplifted much of the northern Cordillera to elevations above 1000 m approximately14–11 Mya (Potts & Behrensmeyer, 1992; Guerrero, 1993), and this was followedby a second more dramatic uplift during the Pliocene and Pleistocene (Potts &Behrensmeyer, 1992) when the mountains reached their present elevations above4000 m. The initial mid-Miocene uplift of the Andes is associated with wide-scalechange in the Neotropical flora (Gentry, 1982a; Van der Hammen, 1989) and majorphysiographic changes in the Amazon Basin (Rasanen et al., 1987; Hoorne, 1994).Our estimated time span for divergence between Central and South Americanclades of Lachesis (Table 4) overlaps that of a major uplift of the northern Andes (toabove 1000 m) and the development of high montane vegetation in the mid Miocene(15–12 Mya).
A second major physiographic development, the uplift of the Central Americanhighlands, might also have been an important vicariant event for bushmasters.Central American orogeny seems to have occurred from north to south, withmontane habitats first forming during the Miocene (Savage, 1982; Coates & Obando,1996). The uplift of the mountains of lower Central America (including the Cordillerade Talamanca, which presently separates the two Central American bushmasters inCosta Rica) occurred in the late Miocene or early Pliocene (8–5 Mya) and culminatedin the Pliocene closure of the Panamanian Portal (Coates & Obando, 1996). Thisuplift fragmented a homogeneous lowland Central American herpetofauna intoallopatric Atlantic and Pacific lowland assemblages (e.g. Savage, 1982; Crother etal., 1992). Today the Atlantic lowlands are composed primarily of humid evergreenforests while the Pacific Versant, with the exception of southeastern Costa Rica,encompasses subhumid to semi-arid deciduous or thorn forests. Moist tropical foresthabitat, inhabited by Pacific Coast Lachesis, is found on the Osa Peninsula andadjacent Golfo Dulce region. Our molecular data are consistent with a hypothesisthat Lachesis m. melanocephala and L. m. stenophrys diverged during the late Mioceneor early Pliocene, and their differentiation was at least broadly contemporary withuplift of the Cordillera de Talamanca, the range of mountains that now separatesthose taxa.
A final climatic event relevant to differentiation in Lachesis is the onset oftemperature-glacial variations and global cooling in the Cenozoic. Global coolingaccelerated in the late Neogene, with numerous reversals on all continental masses(Potts & Behrensmeyer, 1992), and culminated in large amplitude climatic oscillationsover the last million years. Tropical climates during the Quaternary were unstable(Van der Hammen & Absy, 1994) and Pleistocene climatic cycles have receivedconsiderable attention as factors underlying regional areas of high endemism in awide variety of Amazonian taxa, including birds (Haffer, 1969), lizards (Vanzolini& Williams, 1970), angiosperms (Prance, 1982, 1987), and butterflies (Brown,1982). Proponents of the ‘forest refugia’ hypothesis suggest that lowland forest wasfragmented into isolated patches during Pleistocene glacial cycles, resulting in patternsof differentiation observed today. This paleoclimatic speciation model has beenwidely critiqued (e.g. Cracraft & Prum, 1988; Bush, 1994; Colinvaux et al., 1996;Vitt & Zani, 1996) and is to a certain extent untestable by studies of differentiation
BUSHMASTER PHYLOGENY 435
in extant taxa, because there is no explicit expectation of area relationships imbeddedwithin the model (Patton, in press). Nonetheless, available paleoenvironmental,climatic, and organismal evidence offers a complex scenario for tropical SouthAmerica during the Pleistocene, and the possible effects of environmental changeson the genetic differentiation of tropical lowland taxa should be considered. In fact,the two South American bushmasters, Lachesis m. rhombeata and L. m. muta, are notstrongly differentiated and evidently experienced gene flow in the recent past.Currently, those two weakly differentiated taxa are separated by an expanse of dryand unsuitable habitat between coastal Atlantic Forest and the Amazon Basin, andthus Pleistocene climatic and vegetational changes might underlie their differentiation.
Our results indicate that the oldest genetic divergences within Lachesis reflectvicariant events that isolated groups of populations in regions occupied by three ofthe four subspecies today (Fig. 5). Given early divergences between Central andSouth American clades, the ancestral Lachesis probably was continuously distributedin Amazonian-Pacific lowlands before fragmentation by the mid-Miocene uplift ofthe Andes. Molecular evidence also implies that the ancestral lineages of Centraland South American Lachesis differentiated prior to formation of a continuousPanamanian Isthmus. Our temporal estimates of divergences also refute the forestrefugia hypothesis for speciation in Lachesis, in that the deepest branching withinthis clade occurred much earlier in the Tertiary rather than during Pleistoceneclimatic cycles. The genetic imprint of Pleistocene events might be present in recentdivergences among South American populations of L. muta, and a more detailedstudy within and between those subspecies will probably reveal diversification notevident in our results. Finally, our conclusion that initial divergence within bush-masters predates the Pliocene closing of the Panamanian portal underscores acontinuing enigma in Middle American biogeography (see e.g. Hanken and Wake,1982, for salamanders; Cadle, 1985, for other snakes), the interchange of terrestrialorganisms across what is usually portrayed as a marine barrier. Although somevipers occasionally disperse over water (e.g. Lazell, 1964), there is no evidence thatbushmasters do so. These large snakes are absent, for example, from the seeminglyhabitable Bocas del Toro archipelago although present on adjacent mainlandPanama (R.I. Crombie, pers. comm.); their presence on Trinidad presumably reflectsprior residency on that continental shelf island (cf. Henderson & Hedges, 1995).
Species concepts and bushmaster taxonomy
Throughout this century bushmasters have been regarded as a single polytypicspecies (e.g. Peters & Donoso-Barros, 1970; Hoge & Romano-Hoge, 1978; Campbell& Lamar, 1989), in keeping with a widely prevalent ‘inertial species concept’ (Good,1994: 194): taxa are “treated as conspecific because herpetologists are used to thembeing conspecific, not because evidence for or against conspecificity has beenrigorously examined.” As Ripa (1994) noted, Lachesis m. muta, L. m. melanocephala,and L. m. stenophrys are substantially distinctive among themselves, there are noconfirmed zones of intergradation or of overlapping occurrence (but see below), andno explicit justification exists for the current taxonomy of these vipers. Boulenger(1896) simply sunk Cope’s (1875) L. stenophrys into L. muta without comment, andSolorzano and Cerdas (1986) described L. m. melanocephala without defending theirdecision to treat it as a subspecies rather than a distinct species.
K. R. ZAMUDIO AND H. W. GREENE436
Morphological and behavioral differences among the subspecies of Lachesis mutaremain poorly explored, but parallel our molecular results (Table 5). The AtlanticForest bushmaster (L. m. rhombeata) resembles the widespread Amazonian subspecies(L. m. muta) in scalation, head and body shape, and behavioral response to danger,being weakly differentiated only by head colour pattern. Both Central Americantaxa are distinct from the South American bushmasters in scalation, head and bodyshape, and colour pattern. The Central American bushmaster (L. m. stenophrys) isdistinct from the other three subspecies in scalation, palatine bone shape, and colourpattern, as is the black-headed bushmaster (L. m. melanocephala) in scalation, colourpattern, and defensive behaviour; the latter resembles South American bushmastersin certain morphological attributes, whereas the former is derived in those respects.
Our studies confirm that the four allopatric subspecies of bushmasters aremorphologically and biochemically distinct. The concordance between mor-phological, behavioral, and molecular markers is evidence that at least three of theseallopatric population groups are on separate evolutionary trajectories, likely havingbeen isolated for long periods of time, and therefore are distinct evolutionary species(sensu Frost, Kluge & Hillis, 1992). Accordingly, we propose that they should beknown as Lachesis muta, the South American bushmaster; L. stenophrys (as first describedby Cope, 1875), the Central American bushmaster; and L. melanocephala (Solorzano& Cerdas, 1986; new combination), the black-headed bushmaster. Conversely, theAtlantic Forest bushmaster is weakly differentiated morphologically and molecularly,and our mtDNA data suggest that some populations of Amazonian L. m. muta mightbe more closely related to the Atlantic L. m. rhombeata than to other populations ofL. m. muta (likely on geographic grounds as well). The Atlantic bushmaster willcontinue to be recognized as a subspecies by those who feel that category fills auseful role in systematics, but we see no reason to upgrade that taxon to speciesstatus.
The bushmasters of eastern Panama and the Pacific lowlands of Colombia andEcuador remain problematic. Previous studies of other taxa have demonstrated aclose affiliation between species in the Choco lowlands of northwestern SouthAmerica and those in Central America (Haffer, 1967; Gentry, 1982b; Chapman,1917; Brumfield & Capparella, 1996). Campbell & Lamar (1989) believed thatChoco populations of Lachesis are probably referable to the widespread CentralAmerican taxon (L. stenophrys), although Martınez & Bolanos (1982) regarded aspecimen from eastern Panama as L. m. muta, based on its high ventral count. Wethink that interbreeding in nature between Central and South American bushmastersis highly unlikely, given the extent of unsuitable habitat in the Andes and the deepmtDNA divergence between those clades. Nevertheless, a range-wide analysis ofmorphological and molecular variation in bushmasters with particular emphasis onnorthwestern South American will clearly be relevant to hypotheses about thederivation of organisms in the Choco region (Chapman, 1917; Haffer, 1967;Brumfield & Capparella, 1996).
Conservation
Our findings have immediate implications for bushmaster conservation, in thatthey underscore the distinctiveness of each of the Central American forms as well astheir precarious status. Rather than weakly differentiated subspecies of a widespread
BUSHMASTER PHYLOGENY 437
T
5.M
orph
olog
ical
and
beha
vior
alva
riat
ion
amon
gbu
shm
aste
rs
Cha
ract
ers
L.
m.
mut
aL
.m
.rh
ombe
ata
L.
mel
anoc
epha
laL
.st
enop
hrys
Sour
ce
Ven
tral
scal
es21
3–23
0B
oule
nger
,18
96;
Roz
e,M
ales
>21
4>
214,
223–
225
211–
216
198–
204
1966
;Pe
ters
&D
onos
o-Fe
mal
es>
225
>22
620
9–21
619
9–20
9B
arro
s,19
70;
Solo
rzan
o&
Cer
das,
1986
Cau
dals
cale
s49
,36
–37
Cop
e,18
75;
Bou
leng
er,
Mal
es34
–37
4418
96;
Solo
rzan
o&
Cer
das,
Fem
ales
35–3
619
86D
orsa
lsca
les
35–3
7B
oule
nger
,18
96;
Mal
es35
36–3
833
–36
Solo
rzan
o&
Cer
das,
1986
Fem
ales
3536
–40
33–3
8Pr
enas
alsc
ales
Enl
arge
d,pr
otru
bera
nt,
Enl
arge
d,pr
otru
bera
nt,
Red
uced
,fla
t,ro
unde
dR
educ
ed,
flat,
roun
ded
Rip
a,19
94tr
iang
ular
tria
ngul
arIn
tern
asal
scal
esE
nlar
ged
Enl
arge
dR
educ
edR
educ
edR
ipa,
1994
Can
thal
scal
esE
long
ate,
dist
inct
,up
rais
edE
long
ate,
dist
inct
,up
rais
edO
val,
indi
stin
ct,
flatt
ened
Ova
l,in
dist
inct
,fla
tten
edR
ipa,
1994
Supr
alab
ials
8–11
8–11
7–9
7–9
Rip
a,19
94H
ead
patt
ern
Smal
ldis
tinct
spot
s,L
arge
dist
inct
spot
s,w
ide
Bla
ckU
nspo
tted
Pete
rs&
Don
oso-
Bar
ros,
narr
owpo
stoc
ular
stri
pe,
post
ocul
arst
ripe
,no
whi
te19
70;
Rip
a,19
94w
hite
bord
erbo
rder
Ant
erio
rla
tera
lblo
tche
sR
hom
boid
Rho
mbo
idV
ertic
alba
rsV
ertic
alba
rsR
ipa,
1994
Hea
dsh
ape
Smal
l,th
inSm
all,
thin
Lar
ge,
blun
tL
arge
,bl
unt
Rip
a,19
94B
ody
shap
eR
ound
Rou
ndL
ater
ally
com
pres
sed
Lat
eral
lyco
mpr
esse
dR
ipa,
1994
Ant
erio
rsu
rfac
eof
pala
tine
Con
cave
Unk
now
nC
onca
veSt
raig
htSo
lorz
ano
&C
erda
s,19
86;
bone
Gre
ene,
unpu
blis
hed
data
Def
ensi
vebe
havi
our
Usu
ally
calm
Usu
ally
calm
Agg
ress
ive
Usu
ally
calm
Solo
rzan
o&
Cer
das,
1986
;R
ipa,
1994
K. R. ZAMUDIO AND H. W. GREENE438
Amazonian snake, these are well differentiated lineages, the result of an ancientdivergence from South American populations and subsequent diversification withinCentral America. Lachesis stenophrys and especially L. melanocephala have extremelysmall overall distributions (Campbell & Lamar, 1989; Greene & Campbell, 1992),and both are restricted to relatively undisturbed tropical wet forests (Vial & Jımenez-Porras, 1967; Solorzano & Cerdas, 1986). Each species occurs within the CostaRican National Parks system (e.g. L. stenophrys at the La Selva Biological Preserveand adjacent lower reaches of Braulio Carillo National Park, L. melanocephala inCorcovado National Park), but outside of those and other reserves within theirdistributions, most remaining low and middle elevation forest has been convertedto agriculture (e.g. Monge-Najera, 1994). The range of each of these snake taxa isalready severely fragmented by habitat destruction, and each species is undoubtedlysubject to persecution by humans (e.g. wanton killing, commercial collecting).Bushmasters clearly warrant special consideration from wildlife agencies in CostaRica, Nicaragua, Panama, and perhaps elsewhere.
ACKNOWLEDGEMENTS
This study was made possible by the contribution of tissue samples from privateand institutional collections, including D.R. Boyer (Dallas Zoo), H. Suzuki and F.Furtado (Instituto Butantan, Brazil), and D. Ripa. We also thank J.A. Campbell, A.Meyer, J.L. Patton, J.W. Sites Jr, R.B. Huey, and two anonymous reviewers forhelpful comments on the manuscript; K. Rassmann for a preprint of her paper andcomments on the manuscript; R.I. Crombie for sharing his extensive field experiencewith neotropical snakes; N.C. Arens for tutoring us on the geological and floristichistory of South America; R.H. Ward (University of Utah) for generously facilitatingthe molecular aspects of this project; and L. Waits and L. Morrison for companyand support in the laboratory. Partial financial support was provided by the D.Snyder Fund for graduate research, University of Washington; a Sigma Xi Grant-in-Aid of research; a University of Washington Minority Education Division Fel-lowship; and a National Science Foundation Pre-doctoral Fellowship to K.Z.
REFERENCES
Arevalo E, Davis SK, Sites Jr JW. 1994. Mitochondrial DNA sequence divergence and phylogeneticrelationships among eight chromosome races of the Sceloporus grammicus complex (Phrynosomatidae)in central Mexico. Systematic Biology 43: 387–418.
Avise JC, Bowen BW, Lamb T, Meylan AB, Bermingham E. 1992. Mitochondrial DNA evolutionat a turtle’s pace: evidence for low genetic variability and reduced microevolutionary rate in theTestudines. Molecular Biology and Evolution 9: 457–473.
Ayres JM, Clutton-Brock TH. 1992. River boundaries and species range size in Amazonianprimates. American Naturalist 140: 531–537.
Boulenger GA. 1896. Catalogue of the snakes in the British Museum (Natural History). London: BritishMuseum of Natural History.
Brown KS. 1982. Historical and ecological factors in the biogeography of aposematic neotropicalbutterflies. American Zoologist 22: 453–471.
Brown WM, George M, Wilson AC. 1979. Rapid evolution of animal mitochondrial DNA.Proceedings of the National Academy of Sciences USA 76: 1967–1971.
BUSHMASTER PHYLOGENY 439
Brumfield RT, Capparella AP. 1996. Historical diversification of birds in northwestern SouthAmerica: a molecular perspective on the role of vicariant events. Evolution 50: 1607–1624.
Bush MB. 1994. Amazonian speciation: a necessarily complex model. Journal of Biogeography 21: 5–17.Cadle JE. 1984a. Molecular systematics of Neotropical xenodontine snakes: I. South American
xenodontines. Herpetologica 40: 8–20.Cadle JE. 1984b. Molecular systematics of Neotropical xenodontine snakes: II. Central American
xenodontines. Herpetologica 40: 21–30.Cadle JE. 1984c. Molecular systematics of Neotropical xenodontine snakes. III. Overview of xeno-
dontine phylogeny and the history of New World snakes. Copeia 1984: 641–652.Cadle JE. 1985. The neotropical colubrid snake fauna (Serpentes: Colubridae): lineage components
and biogeography. Systematic Zoology 34: 1–20.Cadle JE. 1987. Geographic distribution: problems in phylogeny and zoogeography. In: Seigel RA,
Collins JT, Novak SS, eds. Snakes: Ecology and evolutionary biology. New York: McMillan Publ. Co.,77–105.
Cadle JE, Greene HW. 1993. Phylogenetic patterns, biogeography, and the ecological structure ofneotropical snake assemblages. In: Ricklefs RE, Schluter D, eds. Species diversity in ecological communities:historical and geographical perspectives. Chicago: University of Chicago Press, 281–293.
Cadle JE, Sarich VM. 1981. An immunological assessment of the phylogentic position of NewWorld coral snakes. Journal of Zoology 195: 157–167.
Campbell JA, Lamar WW. 1989. The venomous reptiles of Latin America. Ithaca: Cornell UniversityPress.
Chapman FM. 1917. The distribution of bird-life in Colombia. Bulletin of the American Museum ofNatural History 36: 1–729.
Coates AG, Obando JA. 1996. The geologic evolution of the Central American Isthmus. In: JacksonJBC, Budd AF, Coats AG, eds. Evolution and environment in tropical America. Chicago: University ofChicago Press, 21–56.
Colinvaux PA, De Oliveira PE, Moreno JE, Miller MC, Bush MB. 1996. A long pollen recordfrom lowland Amazonia: forest and cooling in glacial times. Science 274: 85–88.
Collins T. 1996. Molecular comparisons of transisthmian species pairs: rates and patterns of evolution.In: Jackson JBC, Budd AF, Coats AG, eds. Evolution and environment in tropical America. Chicago:University of Chicago Press, 303–334.
Cope ED. 1875. On the Batrachia and Reptilia of Costa Rica, with notes on the herpetology andichthyology of Nicaragua and Peru. Journal of the Academy of Natural Sciences, Philadelphia 2: 93–154.
Cracraft J. 1994. Species diversity, biogeography, and the evolution of biotas. American Zoologist 34:33–47.
Cracraft J, Prum RO. 1988. Patterns and processes of diversification: speciation and historicalcongruence in some neotropical birds. Evolution 42: 603–620.
Crother BI, Campbell JA, Hillis DM. 1992. Phylogeny and historical biogeography of the palm-pitvipers, genus Bothriechis: biochemical and morphological evidence. In: Campbell JA, Brodie JrED, eds. Biology of the pitvipers. Tyler: Selva, 1–20.
Crother BI, Guyer C. 1996. Caribbean historical biogeography: was the dispersal-vicariance debateeliminated by an extraterrestrial bolide? Herpetologica 52: 440–465.
Duellman WE. 1979. The South American herpetofauna: a panoramic view. Monographs of the Museumof Natural History, University of Kansas 7: 1–28.
Estes R, Baez A. 1985. Herpetofaunas of North and South America during the late Creataceousand Cenozoic: evidence for interchange? In: Stehli FG, Webb SD, eds. The Great American BioticInterchange. New York: Plenum Press, 139–197.
Felsenstein J. 1981. Evolutionary trees from DNA sequences: a maximum likelihood approach.Journal of Molecular Evolution 17: 368–376.
Felsenstein J. 1985. Confidence limits on phylogenies: an approach using the bootstrap. Evolution39: 783–781.
Felsenstein J. 1993. PHYLIP: phylogeny inference package. Version 3.5. University of Washington, Seattle,Washington.
Frost DR, Kluge AG, Hillis DM. 1992. Species in contemporary herpetology: comments onphylogenetic inference and taxonomy. Herpetological Review 23: 46–54.
Gentry AH. 1982a. Neotropical floristic diversity: phytogeographical connections between Centraland South America, Pleistocene climatic fluctuations, or an accident of the Andean orogeny? Annalsof the Missouri Botanical Garden 69: 557–593.
K. R. ZAMUDIO AND H. W. GREENE440
Gentry AH. 1982b. Phytogeographic patterns as evidence for a Choco refuge. In: Prance GT, ed.Biological diversification in the tropics. New York: Columbia University Press, 112–136.
Good DA. 1994. Species limits in the genus Gerrhonotus (Squamata: Anguidae). Herpetological Monographs8: 180–202.
Greene HW, Campbell JA. 1992. The future of pitvipers. In: Cambell JA, Brodie ED Jr, eds. Biologyof the pitvipers. Tyler, Texas: Selva, 421–427.
Guerrero J. 1993. Magnetostratigraphy of the upper part of the Honda Group and Neiva Formation.Miocene uplift of the Colombian Andes. D.Phil. Thesis, Duke University.
Haffer J. 1967. Speciation in Colombian forest birds west of the Andes. American Museum Novitates294: 1–57.
Haffer J. 1969. Speciation in Amazonian forest birds. Science 165: 131–137.Hanken J, Wake DB. 1982. Genetic differentiation among plethodontid salamanders (genus Bolitoglossa)
in Central and South America: implications for the South American invasion. Herpetologica 38:272–287.
Hedges SB. 1996. Vicariance and dispersal in Caribbean biogeography. Herpetologica 52: 466–473.Hedges SB, Bezy RL, Maxson LR. 1991. Phylogenetic relationships and biogeography of xantusiid
lizards, inferred from mitochondrial DNA sequences. Molecular Biology and Evolution 8: 767–780.Henderson RW, Hedges SB. 1995. Origin of West Indian populations of the geographically
widespread boa Corallus enydris inferred from mitochrondrial DNA sequences. Molecular Phylogeneticsand Evolution 4: 88–92.
Hillis DM, Bull JJ. 1993. An empirical test of boot strapping as a method for assessing confidencein phylogenetic analysis. Systematic Biology 42: 182–192.
Hillis DM, Mable BK, Moritz C. 1996. Applications of molecular systematics: the state of the fieldand a look to the future. In: Hillis DM, Moritz C, Mable BK, eds. Molecular Systematics. Sunderland,Massachusetts: Sinauer Associates, 515–543.
Hoge AR, Romano-Hoge SARWL. 1978. Poisonous snakes of the world. Part I. Check list of thepit vipers Viperoidea, Viperidae, Crotalidae. Memorias do Instituto Butantan 42: 179–310.
Hoorne C. 1993. Marine incursions and the influence of Andean tectonics on the Miocene depositionalhistory of northwestern Amazonia: results of a palynostratigraphic study. Palaeogeography, Palaeo-climatology, Palaeoecology 105: 267–309.
Hoorne C. 1994. An environmental reconstruction of the palaeo-Amazon River system (middle-lateMiocene, NW Amazonia). Palaeogeography, Palaeoclimatology, Palaeoecology 112: 187–238.
Kluge AG. 1989. A concern for evidence and a phylogenetic hypothesis of relationships amongEpicrates (Boidae, Serpentes). Systematic Zoology 38: 7–25.
Kraus F, Mink DG, Brown WM. 1996. Crotaline intergeneric relationships based on mitochondrialDNA sequence data. Copeia 1996: 763–773.
Kroonenberg SB, Bakker JGM, Van der Wiel AM. 1990. Late Cenozoic uplift and paleogeaographyof the Colombian Andes: constraints on the development of high Andean biota. Geologie en Mijnbouw69: 279–290.
Kumar S, Tamura K, Nei M. 1993. MEGA: molecular evolutionary genetics analysis. Version 1.01.Pennsylvania State University, Pennsylvania.
Lamb T, Avise JC, Gibbons JW. 1989. Phylogeographic patterns in mitochondrial DNA of thedesert tortoise (Xerobates agassizi), and evolutionary relationships among the North American gophertortoises. Evolution 43: 76–87.
Lazell JD Jr. 1964. The Lesser Antillean representatives of Bothrops and Constrictor. Bulletin of the Museumof Comparative Zoology 132: 245–273.
Lundberg JG. 1997. Freshwater fishes and their paleobiotic implications. In: Kay RF, Madden RH,Cifelli RL, Flynn JJ, eds. Vertebrate paleontology in the neotropics: the Miocene fauna of La Venta, Colombia.Washington, DC: Smithsonian Institution Press, 67–91.
Maddison DR. 1991. The discovery and importance of multiple islands of most-parsimonious trees.Systematic Zoology 40: 315–328.
Maniatis TE, Frisch EF, Sambrook J. 1982. Molecular cloning: a laboratory manual. Cold SpringHarbor: Cold Spring Harbor Laboratory Publications.
Marshall LG, Webb SD, Sepkoski JJ, Raup DM. 1982. Mammalian evolution and the GreatAmerican Interchange. Science 215: 1351–1357.
Martin AP, Naylor GJP, Palumbi SR. 1992. Rates of mitochondrial DNA evolution in sharks areslow compared with mammals. Nature 357: 153–155.
Martin AP, Palumbi SR. 1993. Body size, metabolic rate, generation time, and the molecular clock.Proceedings of the National Academy of Sciences USA 90: 4087–4091.
BUSHMASTER PHYLOGENY 441
Martınez V, Bolanos R. 1982. The bushmaster, Lachesis muta muta (Linnaeus) [Ophidia: Viperidae]in Panama. Revista de Biologıa Tropical 30: 100–101.
Meyer A, Kocher TD, Basasibwaki P, Wilson A. 1990. Monophyletic origin of Lake Victoriacichlid fishes suggested by mitochondrial DNA sequences. Nature 347: 550–553.
Monge-Najera J. 1994. The forgotten banana connection: origin and evolution of environmentalawareness in Costa Rica. In: Monje-Najera J, ed. Sustainable development: the view from less industrializedcountries. San Jose, Costa Rica: Universidad de Estatal a Distancia Press, 85–127.
Moritz C, Schneider CJ, Wake DB. 1992. Evolutionary relationships within the Ensatina eschscholtziicomplex confirm the ring species interpretation. Systematic Biology 41: 273–291.
Patton JL. in press. Rivers, refuges, and ridges: the geography of speciation of Amazonian mammals.In: Betocher S, Howard D, eds. Endless forms: species and speciation. Oxford: Oxford University Press.
Patton JL, da Silva MNF, Malcolm JR. 1996. Hierarchical genetic structure and gene flow inthree sympatric species of Amazonian rodents. Molecular Ecology 5: 229–238.
Peters JA, Donoso-Barros R. 1970. Checklist of the neotropical Squamata, Part I, Snakes. Bulletinof the U.S. National Museum 297: 1–347.
Pindell JL, Barrett SF. 1990. Geological evolution of the Caribbean region; a plate tectonicperspective. In: Dengo G, Case JE, eds. The geology of North America, volume H. The Caribbean region.Boulder: The Geological Society of America, 405–432.
Potts R, Behrensmeyer AK. 1992. Late Cenozoic terrestrial ecosystems. In: Behrensmeyer AK,Damuth JD, DiMichele WA, Potts R, Sues H-D, Wing SL, eds. Terrestrial ecosystems throughtime – evolutionary paleoecology of terrestrial plants and animals. Chicago: Chicago University Press, 419–541.
Prance GT. 1982. A review of the phytogeographic evidences for pleistocene climate changes in theneotropics. Annals of the Missouri Botanical Gardens 69: 594–624.
Prance GT. 1987. Biogeography of neotropical plants. In: Whitmore TC, Prance GT, eds. Biogeographyand quaternary history in tropical America. Oxford: Oxford Science Publications, 46–65.
Rand DM. 1994. Thermal habit, metabolic rate and the evolution of mitochondrial DNA. Trends inEcology and Evolution 9: 125–131.
Rasanen ME, Salo JS, Kalliola RJ. 1987. Fluvial perturbance in the Western Amazon Basin:regulation by long-term Andean tectonics. Science 238: 1398–1401.
Rassmann K. 1997. Evolutionary age of the Galapagos iguanas pre-dates the age of the presentGalapagos islands. Molecular Phylogenetics and Evolution 7: 158–172.
Riddle BR. 1995. Molecular biogeography in the pocket mice (Perognathus and Chaetodipus) andgrasshopper mice (Onychomys): the late Cenozoic development of a North American aridlands rodentguild. Journal of Mammalogy 76: 283–301.
Ripa D. 1994. Reproduction of the Central American bushmaster (Lachesis muta stenophrys) and theblack-headed bushmaster (Lachesis muta melanocephala) for the first time in captivity. Bulletin of theChicago Herpetological Society 29: 165–183.
Roe BA, Ma D-P, Wilson RK, Wong JF-H. 1985. The complete nucleotide sequence of the Xenopuslaevis mitochondrial DNA genome. Journal of Biological Chemistry 260: 9759–9774.
Rosen DE. 1975. A vicariance model of Caribbean biogeography. Systematic Zoology 24: 341–364.Roze JA. 1966. La taxonomia y zoogeografıa de los ofidios de Venezuela. Caracas: Imprinta Universitaria.Saiki RK, Gelfand DH, Stoffel S, Scharf SJ, Higuchi R, Horn GT, Mullis KB, Erlich HA.
1988. Primer-directed enzymatic amplification of DNA with a thermostable DNA polymerase.Science 239: 487–491.
Sanger F, Nicklen S, Coulson AR. 1977. DNA sequencing with chain-terminating inhibitors.Proceedings of the National Academy of Sciences USA 74: 5463–5467.
Savage JM. 1966. The origins and history of the Central American herpetofauna. Copeia 1966:719–766.
Savage JM. 1982. The enigma of the Central American herpetofauna: dispersals or vicariance? Annalsof the Missouri Botanical Gardens 69: 464–547.
Solorzano A, Cerdas L. 1986. A new subspecies of the Bushmaster, Lachesis muta, from southeasternCosta Rica. Journal of Herpetology 20: 463–466.
Stehli FG, Webb SD. 1985. The Great American Biotic Interchange. New York: Plenum Press.Swofford DL. 1997. PAUP∗: Phylogenetic Analysis using Parsimony, beta test version 4.0 53d-54d. Sunderland:
Thorpe RS, McGregor DP, Cumming AM, Jordan WC. 1994. DNA Evolution and colonizationsequence of island lizards in relation to geological history: mtDNA RFLP, cytochrome b, cytochromeoxidase, 12S RRNA sequence, and nuclear RAPD analysis. Evolution 48: 230–240.
Upholt WI, Dawid IB. 1977. Mapping of mitochondrial DNA of individual sheep and goats: rapidevolution in the D loop region. Cell 11: 571–583.
Van der Hammen T. 1961. Late Cretaceous and Tertiary stratigraphy and tectogenesis of theColombian Andes. Geologie en Mijnbouw 51: 181–188.
Van der Hammen T. 1989. History of the montane forests of the northern Andes. Plant Systematicsand Evolution 162: 109–114.
Van der Hammen T, Absy ML. 1994. Amazonia during the last glacial. Palaeogeography, Palaeo-climatology, Palaeoecology 109: 247–261.
Vanzolini PE, Heyer WR. 1985. The American herpetofauna and the interchange. In: Stehli F,Webb D, eds. The Great American Biotic Interchange. New York: Plenum Press, 475–487.
Vanzolini PE, Williams EE. 1970. South American anoles: geographic differentiation and evolutionof Anolis chrysolepis species group (Sauria: Iguanidae). Arquivos de Zoologia, Universidade de Sao Paulo 19:1–298.
Vial JL, Jımenez-Porras JM. 1967. The ecogeography of the bushmaster, Lachesis muta, in CentralAmerica. American Midland Naturalist 78: 182–187.
Vidal N, Lecointre G, Vie JC, Gasc J-P. 1997. Molecular systematics of pitvipers: paraphyly ofthe Bothrops complex. Comptes Rendus de l’Academie des Sciences, Serie III, Sciences de la Vie 320: 95–101.
Villablanca FX. 1993. Population genetics and phylogenetics in kangaroo rats (Rodentia: Hetero-myidae). D.Phil. Thesis, University of California, Berkeley.
Vitt LJ, Zani PA. 1996. Ecology of the South American lizard Norops chrysolepis (Polychrotidae). Copeia1996: 56–68.
Wake DB, Lynch JF. 1976. The distribution, ecology, and evolutionary history of plethodontidsalamanders in tropical America. Scientific Bulletin of the Natural History Museum, Los Angeles County 25:1–65.
Webb SD. 1991. Ecogeography and the Great American Interchange. Paleobiology 17: 266–280.Webb SD, Rancy A. 1996. Late Cenozoic evolution of the neotropical mammal fauna. In: Jackson
JBC, Budd AF, Coats AG, eds. Evolution and environment in tropical America. Chicago: University ofChicago Press, 335–358.