Mal J Nutr 16(1): 13 - 37, 2010 Physical Activity Pattern and Energy Expenditure of Malaysian Adults: Findings from the Malaysian Adult Nutrition Survey (MANS) Poh BK 1* , Safiah MY 2 , Tahir A 3 , Siti Haslinda MD 4 , Siti Norazlin N 5 , Norimah AK 1 , Wan Manan WM 6 , Mirnalini K 7 , Zalilah MS 7 , Azmi MY 8 & Fatimah S 9 1 Department of Nutrition and Dietetics, Faculty of Allied Health Sciences Universiti Kebangsaan Malaysia Kuala Lumpur 2 Department of Nutrition and Dietetics, Faculty of Health Sciences Universiti Teknologi MARA, Kampus Puncak Alam, Selangor 3 Institute for Health Systems Research, Ministry of Health, Malaysia 4 Health Informatics Center, Ministry of Health, Malaysia 5 Department of Health, Penang 6 School of Health Sciences, Universiti Sains Malaysia, Kubang Kerian, Kelantan 7 Department of Nutrition and Dietetics, Faculty of Medicine and Health Sciences Universiti Putra Malaysia, Selangor 8 Department of Health, Johor 9 Nutrition Division, Department of Public Health, Ministry of Health Federal Government Administrative Complex, Putrajaya ABSTRACT This paper aims to report the physical activity pattern and energy expenditure of adults aged 18 – 59 years in the Malaysian Adults Nutrition Survey (MANS) carried out between October 2002 and December 2003. The survey included 7349 adults representative of Peninsular Malaysia (Northern, Southern, Central and East Coast), as well as Sabah and Sarawak. A total of 6926 adults, comprising 3343 men and 3583 women, completed the physical activity section of the survey. Physical activity data was obtained using a physical activity questionnaire and 24-hour physical activity recall. Basal metabolic rate (BMR) was calculated from Ismail et al. (1998) predictive equations; total energy expenditure (TEE) was then estimated through factorial calculations based on time allocated and energy cost of various activities. Physical activity level (PAL) was calculated as the ratio of TEE to BMR. It was found that almost three-quarters of Malaysian adults travelled by passive modes of transportation. Only a third reported having ever-exercised, and an even smaller proportion of the population (14%) had adequate exercise. The population also spent the majority of their time (74% of the day) in sedentary activities, such as sleeping or lying down; doing light intensity activities (15% of the day), and doing moderate to vigorous intensity activities (10% of the day). Mean BMR and TEE was significantly higher amongst men than women, while mean PAL values were similar for men [1.6 (1.6 – 1.7)] and women [1.6 (1.6 – 1.6)]. More men (16%) were categorised as having active PAL compared to women * Correspondence author: Assoc Prof Dr Poh Bee Koon; Email: [email protected]
Transcript
Mal J Nutr 16(1): 13 - 37, 2010
Physical Activity Pattern and Energy Expenditure ofMalaysian Adults: Findings from the Malaysian AdultNutrition Survey (MANS)
1 Department of Nutrition and Dietetics, Faculty of Allied Health SciencesUniversiti Kebangsaan Malaysia Kuala Lumpur
2 Department of Nutrition and Dietetics, Faculty of Health SciencesUniversiti Teknologi MARA, Kampus Puncak Alam, Selangor
3 Institute for Health Systems Research, Ministry of Health, Malaysia4 Health Informatics Center, Ministry of Health, Malaysia5 Department of Health, Penang6 School of Health Sciences, Universiti Sains Malaysia, Kubang Kerian, Kelantan7 Department of Nutrition and Dietetics, Faculty of Medicine and Health Sciences
Universiti Putra Malaysia, Selangor8 Department of Health, Johor9 Nutrition Division, Department of Public Health, Ministry of Health
Federal Government Administrative Complex, Putrajaya
ABSTRACT
This paper aims to report the physical activity pattern and energy expenditureof adults aged 18 – 59 years in the Malaysian Adults Nutrition Survey (MANS)carried out between October 2002 and December 2003. The survey included 7349adults representative of Peninsular Malaysia (Northern, Southern, Central andEast Coast), as well as Sabah and Sarawak. A total of 6926 adults, comprising3343 men and 3583 women, completed the physical activity section of the survey.Physical activity data was obtained using a physical activity questionnaire and24-hour physical activity recall. Basal metabolic rate (BMR) was calculated fromIsmail et al. (1998) predictive equations; total energy expenditure (TEE) was thenestimated through factorial calculations based on time allocated and energy costof various activities. Physical activity level (PAL) was calculated as the ratio ofTEE to BMR. It was found that almost three-quarters of Malaysian adults travelledby passive modes of transportation. Only a third reported having ever-exercised,and an even smaller proportion of the population (14%) had adequate exercise.The population also spent the majority of their time (74% of the day) in sedentaryactivities, such as sleeping or lying down; doing light intensity activities (15% ofthe day), and doing moderate to vigorous intensity activities (10% of the day).Mean BMR and TEE was significantly higher amongst men than women, whilemean PAL values were similar for men [1.6 (1.6 – 1.7)] and women [1.6 (1.6 – 1.6)].More men (16%) were categorised as having active PAL compared to women
Poh BK, Safiah MY, Tahir A, Siti Haslinda MD, Siti Norazlin N, Norimah AK et al.14
INTRODUCTION
In recent decades, there has been a shifttowards increased obesity and non-communicable diseases as a result of thelatest pattern of transition in physicalactivity, diet and nutritional status in humanhistory (Popkin, 2006). Increasedmechanisation at work, during travel, atleisure and in the home has markedlyreduced the need for moderate and highintensity activities (Livingstone et al., 2003).This has led to a global phenomenon ofphysical inactivity occurring in bothdeveloped and developing countries (WHO,2003).
Physical inactivity is a modifiable riskfactor for cardiovascular disease and avariety of other chronic diseases, includingdiabetes mellitus, colon and breast cancer,obesity, hypertension, bone and jointdiseases, as well as depression (WHO, 2003).Scientific evidence has accumulated over thelast decades to show the wide array of healthbenefits of physical activity (Vuori, 2001). Adecline in daily physical activity levels andinsufficient energy expenditure due to asedentary lifestyle is one of the causes ofenergy imbalance leading to increasingtrends of obesity levels (Saris et al., 2003).
In Malaysia, the pace of industriali-sation and urbanisation has been increasingrapidly in the past several decades leadingto a more sedentary lifestyle amongMalaysians. Although the Ministry of
Health had initiated, in 1991, the HealthyLifestyle Campaign with different themesover the years, including Promotion of Exerciseand Physical Activity in the year 1998 (Tee,1999), adult obesity levels have beenescalating (Azmi et al. 2009; IPH, 2008),leading to a suggestion of decreasingphysical activity levels in conjunction withincreasing dietary intakes consequent torapid socio-economic development andurbanisation.
Several large scale surveys havereported physical activity data of Malaysianadults, including the National Health andMorbidity Survey II (NHMS II) carried out inyear 1996 (IPH, 1999), World Health Surveyin 2003 (WHO, 2008), Malaysia Non-Communicable Diseases Surveillance-1(MyNCDS-1) in 2005/2006 (NCD, 2006),and the National Health and MorbiditySurvey III (NHMS III) in 2006 (IPH, 2008).
The NHMS II reported that only 11.6%of Malaysian adults surveyed were doingregular physical activity or adequate exercise(IPH, 1999), with twice as many men (16.2%)having adequate exercise as compared towomen (7.7%). However, the NHMS IIreported only data on exercise and did notdiscuss physical activity pattern or levels.On the other hand, the NHMS III obtainedphysical activity data using the InternationalPhysical Activity Questionnaire (IPAQ) andreported that 43.7% of adults surveyed werephysically inactive, with 35.3% men and50.5% women being classified as inactive
(10%), while more women (43%) were categorised as having sedentary PALcompared to their male counterparts (37%). The present study provides the firstin-depth report of the physical activity pattern, and national estimates of energyexpenditure and physical activity levels of Malaysian adults, and concluded thatMalaysian adults are generally sedentary. It is thus important that physicalactivity be further promoted and integrated into the lives of the population,preferably through various health promotion efforts as well as through thecommitment of the authorities in providing a suitable environment for an activelifestyle.
Keywords: Adults, energy expenditure, MANS, physical activity pattern
Physical Activity Pattern & Energy Expenditure of Adults: Findings from MANS 15
(IPH, 2008). Physical activity data from theNHMS II and NHMS III were incomparableas different questionnaires were used.
The World Health Survey (WHO, 2008)carried out in year 2003 in Malaysia reporteda much lower prevalence of physicalinactivity at 19.6% also using the IPAQ toevaluate physical activity. Prevalence ofphysical inactivity was found to be higheramongst women (23.2%) compared with men(16.0%). However, the MyNCDS-1 using thesame questionnaire found a very highprevalence of physical inactivity (60.1%),with 65.1% women and 55.4% men reportedas inactive (NCD, 2006).
Although these three surveys discussedabove used the same IPAQ to assess physicalactivity levels, the results from each of thesesurveys appear to differ widely. None of theselarge scale surveys reported the pattern ofphysical activity, nor did they report theenergy expenditure of Malaysian adults.Hence, this paper aims to report the dailyphysical activity pattern and energyexpenditure of Malaysian adults from theMalaysian Adult Nutrition Survey (MANS)2003.
METHODOLOGY
Survey design and sampling
The MANS was a population-householdcross-sectional survey designed to producea nationally representative sample of 18 –59-year-old population of Malaysia. Thesurvey utilised a stratified random samplingwith proportional allocation covering sixzones in Malaysia, namely Southern,Central, East Coast, and Northern zones ofPeninsular Malaysia, Sabah and Sarawak.The sampling frame comprised Enume-ration Blocks and Living Quarters obtainedfrom the Department of Statistics’ NationalHousehold Sampling Frame. This study wascommissioned by the Family Health andDevelopment Division, Ministry of Health,Malaysia. Data collection was carried outbetween October 2002 and July 2003. The
study design and operation of MANS is fullydescribed in Volume 1 – Methodology, of theMANS Report series (Safiah et al., 2008).
Subjects
A total of 7349 adults corresponding to atotal estimated population of 14,178,135were identified as eligible respondents in thissurvey. However, only 6926 subjectscomprising 3343 men and 3583 womencompleted the physical activity section of thesurvey, corresponding to a response rate of94.2%. Respondents who were physicallydisabled were excluded from the physicalactivity study. Informed consent wasobtained from respondents prior to theirparticipation in the survey.
The study population comprised 48%men and 52% women. Approximately 53%of the estimated population was from urbanareas and 47% was from rural areas.Proportions by zones were 33% from Centralregion, 19% Southern, 14% East Coast, 13%Northern, 11% Sabah and 10% Sarawak. Inthis survey, there was 53.8% Malays, 23.0%Chinese, 9.1% Indians, 5.7% BumiputeraSabah, 5.6% Bumiputera Sarawak, 2.3%other Bumiputera, and 0.4% Orang Asli ofPeninsular Malaysia. The highest proportionwas from the 20 – 29 years age group (30%),followed by 30 – 39 years (29%), 40 – 49 years(23%), 50 – 59 years (13%) and the smallestproportion from the 18 – 19 years age group(6%). The distribution by BMI status basedon WHO (1998) cutoffs was 9% under-weight, 50% normal weight, 28% overweightand 13% obese.
Socio-demographic and anthropometriccharacteristics
A questionnaire (Form A of the MANSquestionnaire) was used to obtaininformation on socio-demography,including sex, age, ethnicity, religion, maritalstatus, educational level, occupation, andmonthly household income.
Poh BK, Safiah MY, Tahir A, Siti Haslinda MD, Siti Norazlin N, Norimah AK et al.16
Anthropometric measurements in-cluded body weight and height. Bodyweight was measured to the nearest 0.1 kgusing digital weighing scale (SECA Model880, Germany). Height was measured to thenearest 0.1cm using a SECA bodymeter(Model 208, Germany). Body mass index(BMI) was calculated as weight (in kg)divided by height (in m) squared.
Physical activity assessment
Physical activity was measured using aphysical activity questionnaire and 24-hourphysical activity recall method (Form C ofthe MANS questionnaire). The questions onphysical activity were divided into two partsnamely, Part 1 comprising a brief habitualphysical activity questionnaire (Form C1),and Part 2 comprising a 24-hour physicalactivity recall form (Form C2). The physicalactivity questionnaire was used to obtaingeneral information on habitual physicalactivities carried out daily. The 24-hourrecall was used to obtain information ondaily physical activity pattern and amountof time spent on each activity. Both thequestionnaire and recall were administeredthrough face-to-face interview.
Physical activity questionnaire
The physical activity questionnaire (FormC1) was designed to complement thephysical activity recall and to provideinformation on transportation for going to/from work or school, climbing stairs, andalso habitual exercise or sports activities.Transportation includes those that are‘passive’ namely public transportation,driving and riding a motorcycle and thosethat are ‘active’ namely cycling and walking.
Exercise was defined as physicalactivity undertaken for the purpose ofrecreation, sport or health/fitness during thetwo weeks prior to the interview. A personwas considered to have exercised if he/sheanswered ‘Yes’ to the question whether he/she had ever carried out any type of exercise
in the last two weeks prior to the interview.A person was considered to have hadadequate exercise if he/she had performedany moderate or vigorous intensity exercisefor more than 3 times a week, each of whichlasted at least 20 minutes (NCCFN, 1999).
24-hour physical activity recall
The 24-hour physical activity recall form(Form C2) was designed in table format infive minute-intervals to obtain informationon physical activity and body positionduring the activity carried out. The recallwas carried out via face-to-face interview bytrained enumerators, and lasted about 20 –30 minutes per respondent. Respondentswere asked to recall all activities done theday before, starting from 12 midnight theprevious day until 12 midnight on the daybefore the interview. Activities were recordedat 5 minute-intervals to obtain a full 1-dayphysical activity pattern. Details of activitiesobtained included the body position duringthe activity (e.g. reclining, sitting, standingor walking) and a detailed description of theactivity (e.g. eating, sewing, typing, or briskwalking). Physical activity data werecomputed in minutes per day.
The activities were reclassified into threecategories of intensity of activities, namelylight, moderate, or vigorous-intensityactivities as described by Ainsworth et al.(2000). In general, an activity carried out at1.0 to less than 3.0 METs is categorised aslight intensity activity (e.g. sitting, bowling);3.0 to 6.0 METs is categorised as moderateintensity activity (e.g. brisk walking,climbing up stairs, mopping); and more than6.0 METs is categorised as strenuous orvigorous intensity activity (e.g. running,jogging). A list of activities groupedaccording to these categories can be foundin Volume 6 – Physical Activity of Adultsaged 18 – 59 years, of the MANS Report series(Poh et al., 2008).
Physical Activity Pattern & Energy Expenditure of Adults: Findings from MANS 17
Energy expenditure and basal metabolicrate
Basal metabolic rate (BMR), defined as theenergy expended by an individual who hadobserved overnight fasting and restingsupine, was calculated based on bodyweight using the predictive equations ofIsmail et al. (1998) that are sex and agespecific.
Total energy expenditure (TEE) wasestimated through factorial calculations thatcombined the time allocated to the physicalactivities and the energy cost of thoseactivities (FAO/WHO/UNU, 2005). Eachphysical activity was assigned a scoreindicating its intensity in terms of BMRmultiples adapted from FAO/WHO/UNU(2005) and Ainsworth et al. (2000). Forexample, an individual performing anactivity with a 4 BMR rating expends threetimes the energy required by that sameindividual sleeping (i.e., 4 x 1BMR)(Bernstein, Costanza & Morabia, 2004). Thedaily energy expenditure for the ith specificphysical activity, EEi, for i, i = 1, 2, 3, …, 65,for a given study participant was calculatedas:
EEi = [BMR multiple for ith activity] x[duration of ith activity (mins/day)] x[participant BMR (kcal/min)]
The daily total energy expenditure (TEE) foreach participant was then obtained as thesum of the participant’s EEi, that is: TEE =(EE1 + EE2 + … + EE65).
Physical activity level
Physical activity level (PAL) was calculatedas the ratio of TEE to BMR. The population’slifestyle was categorised into sedentary (PAL1.40 – 1.69), active (PAL 1.70 – 1.99) orvigorous (2.00 – 2.40) according to theclassification of FAO/WHO/UNU (2005).
Data analysis
Due to the complex design of the survey, thedata analysis had taken into account the
sample weights. A weight to compensate thesurvey design, non-response and poststratification of stratum, age, sex, andethnicity was calculated to estimateproportions, means, standard error, and 95%confidence interval (CI).
RESULTS
Mode of transportation
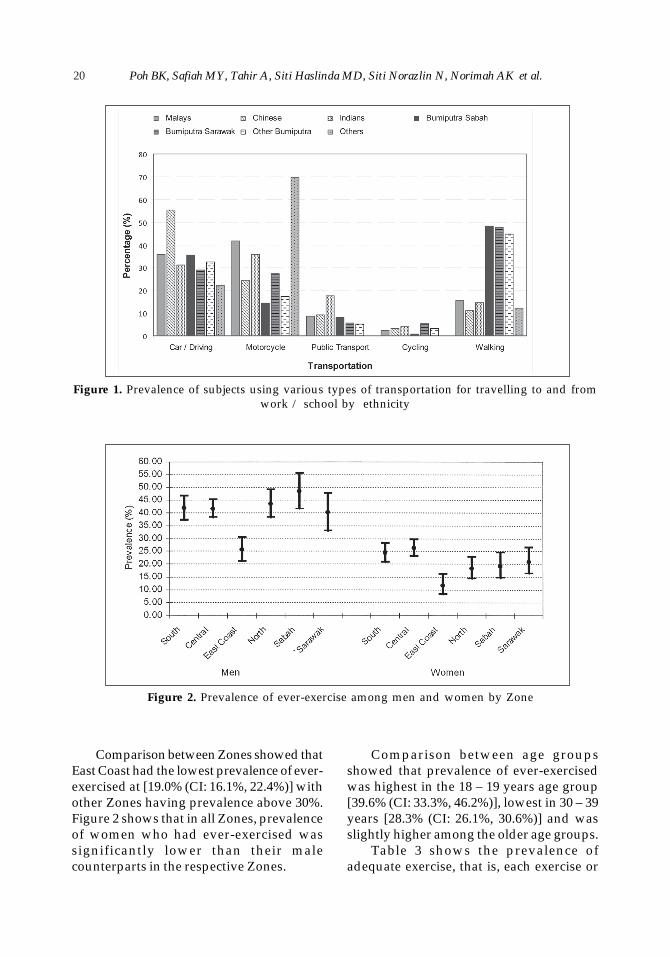
Table 1 shows the proportions oftransportation mode used for travelling toand from work according to socio-demographic groups. The majority ofMalaysians travelled by passive modes oftransportation, which is car [40.8% (CI:39.1%, 42.6%)] or motorcycle [33.6% (CI:32.0%, 35.3%)]. Only a small proportion usedpublic transport, such as bus, LRT orcommuter [9.2% (CI: 8.1%, 10.4%)].Proportion of active transportation modeswhich involves moderate intensity physicalactivity was low, that is only [2.9% (CI: 2.4%,3.6%)] cycled and [17.7% (CI: 16.4%, 19.1%)]walked to work.
It can also be observed that theproportion of women using public transportis about three times more than men (16.1%vs. 5.1%). On the other hand, the proportionof men using motorcycle is 2.5 times morethan women (43.4% vs. 17.0%). Proportionof women [24.3% (CI: 22.1%, 26.6%)] whowalked is also significantly higher than men[13.8% (CI: 12.2%, 15.6%)].
Comparison between urban and ruralareas showed that proportion of walking[23.0% (CI: 20.9%, 25.3%) vs 14.1% (CI: 12.5%,15.9%)] and motorcycling [43.3% (CI: 40.7%,45.8%) vs 27.2% (CI: 25.2%, 29.4%)] wassignificantly higher among the ruralpopulation, whereas proportion of car /driving [49.0% (CI: 46.5%, 51.5%) vs 28.4%(CI: 26.2%, 30.7%)] and public transport use[10.8% (CI: 9.2%, 12.7%) vs 6.7% (CI: 5.5%,8.2%)] was significantly higher in their urbancounterparts.
Comparing between age groups,proportion of walking [26.9% (CI: 20.5%,
Poh BK, Safiah MY, Tahir A, Siti Haslinda MD, Siti Norazlin N, Norimah AK et al.18
Table 1. Proportion of transportation for traveling to and from work (%, 95%CI)
Socio-demographic Car / Driving Motorcycle Public Cycling Walkinggroups Transport
All 40.8 33.6 9.2 2.9 17.7(39.1-42.6) (32.0-35.3) (8.1-10.4) (2.4-3.6) (16.4-19.1)
34.5%)] and use of public transport [(27.8%(CI: 21.1%, 35.6%)] was highest among theyoungest age group, namely 18 – 19 yearsold. Proportion of motorcycling was highestamong 20 – 29 year olds [37.6% (CI: 34.7%,40.6%)], whereas driving was highestamong 30 – 39 years [46.5% (CI: 43.7%,49.4%)] and 40 – 49 year olds [46.5% (CI:42.8%, 50.2%)].
Figure 1 summarises the proportion oftransportation use according to ethnicgroups. Walking is three times higher amongall Bumiputera groups as compared toMalays, Chinese, Indians and others.Proportion of car / driving, motorcycling andpublic transport are highest among Chinese[55.2% (CI: 51.5%, 58.8%)], others [69.7% (CI:42.2%, 87.9%)], and Indians [17.5% (CI:12.8%, 23.4%)], respectively.
Prevalence of exercise
Table 2 shows the prevalence of ever-exercised, which refers to involvement insports or exercise activities carried out in thetwo weeks prior to the interview/study.Prevalence of ever-exercised was 31.3% (CI:29.9%, 32.7%) among the population.Comparison between men and womenshows that there were twice as many men[40.0% (CI: 37.9%, 42.1%)] as women [22.3%(CI: 20.6%, 24.2%)] who ever-exercised.Prevalence of ever-exercise was significantlyhigher among urban [35.7% (CI: 33.8%,37.8%)] as compared to rural (24.9% (CI:23.1%, 26.8%) population, and wassignificantly higher in men from both urbanand rural areas as compared to women fromboth strata.
Table 1. Continued
Poh BK, Safiah MY, Tahir A, Siti Haslinda MD, Siti Norazlin N, Norimah AK et al.20
Figure 1. Prevalence of subjects using various types of transportation for travelling to and fromwork / school by ethnicity
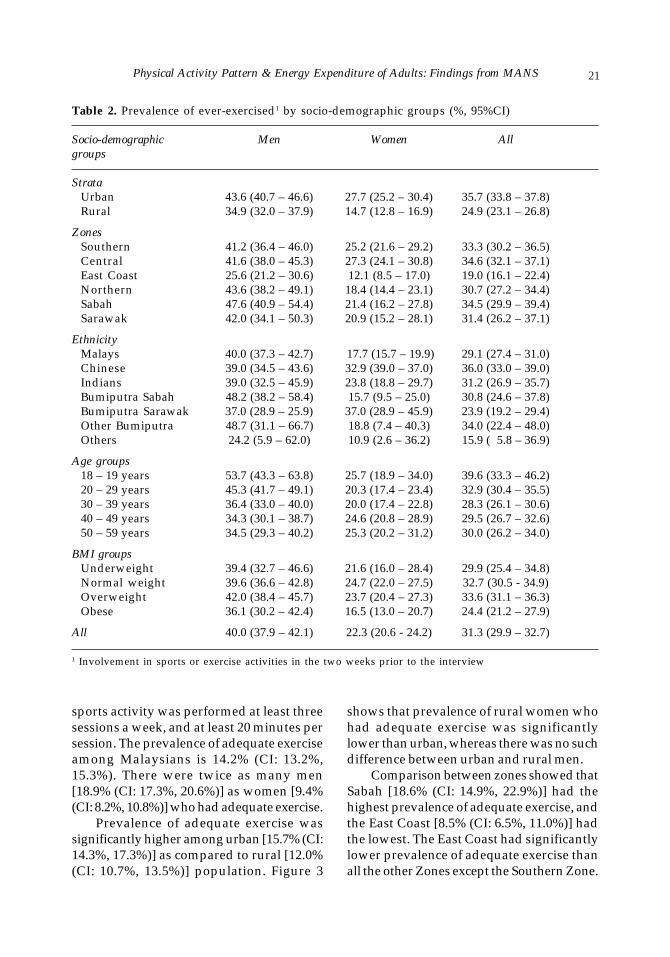
Figure 2. Prevalence of ever-exercise among men and women by Zone
Comparison between Zones showed thatEast Coast had the lowest prevalence of ever-exercised at [19.0% (CI: 16.1%, 22.4%)] withother Zones having prevalence above 30%.Figure 2 shows that in all Zones, prevalenceof women who had ever-exercised wassignificantly lower than their malecounterparts in the respective Zones.
Comparison between age groupsshowed that prevalence of ever-exercisedwas highest in the 18 – 19 years age group[39.6% (CI: 33.3%, 46.2%)], lowest in 30 – 39years [28.3% (CI: 26.1%, 30.6%)] and wasslightly higher among the older age groups.
Table 3 shows the prevalence ofadequate exercise, that is, each exercise or
Physical Activity Pattern & Energy Expenditure of Adults: Findings from MANS 21
Table 2. Prevalence of ever-exercised1 by socio-demographic groups (%, 95%CI)
All 40.0 (37.9 – 42.1) 22.3 (20.6 - 24.2) 31.3 (29.9 – 32.7) 1 Involvement in sports or exercise activities in the two weeks prior to the interview
sports activity was performed at least threesessions a week, and at least 20 minutes persession. The prevalence of adequate exerciseamong Malaysians is 14.2% (CI: 13.2%,15.3%). There were twice as many men[18.9% (CI: 17.3%, 20.6%)] as women [9.4%(CI: 8.2%, 10.8%)] who had adequate exercise.
Prevalence of adequate exercise wassignificantly higher among urban [15.7% (CI:14.3%, 17.3%)] as compared to rural [12.0%(CI: 10.7%, 13.5%)] population. Figure 3
shows that prevalence of rural women whohad adequate exercise was significantlylower than urban, whereas there was no suchdifference between urban and rural men.
Comparison between zones showed thatSabah [18.6% (CI: 14.9%, 22.9%)] had thehighest prevalence of adequate exercise, andthe East Coast [8.5% (CI: 6.5%, 11.0%)] hadthe lowest. The East Coast had significantlylower prevalence of adequate exercise thanall the other Zones except the Southern Zone.
Poh BK, Safiah MY, Tahir A, Siti Haslinda MD, Siti Norazlin N, Norimah AK et al.22
Table 3. Prevalence of adequate exercise1 by socio-demographic groups (%, 95%CI)
1 Involvement in sports or exercise activities for at least 3 times a week, at least 20 minutes each session.
In all Zones, prevalence of women who hadadequate exercise was significantly lowerthan men in the respective Zones.
Comparison between age groups showsthat prevalence of adequate exercise washighest at 18 – 19 years old [19.4% (CI: 14.7%,25.2%)], lowest at 30 – 39 years [11.0% (CI:9.6%, 12.6%)] and higher again among theolder age groups. Women in all age groupshad a significantly lower prevalence of
adequate exercise as compared to their malecounterparts in the same age groups.
Physical activity pattern
Table 4 shows the mean time spent on eachtype of physical activity based on bodyposition as reported by the respondents.Physical activities based on body positionare reported as sleeping and lying down,sitting, standing, walking, personal-care
Physical Activity Pattern & Energy Expenditure of Adults: Findings from MANS 23
Figure 3. Prevalence of adequate exercise (at least 3 times a week for 20 minutes or more eachtime) for men and women by Strata
Table 4. Physical activity pattern of Malaysian men and women (mean minutes, 95% CI)
Activities Men (N= 6,998,660) Women (N= 6,869,291) All (N=13,867,950)
Sleeping and 472.1 (466.5-477.6) 482.4 (477.9-486.8) 477.2 (473.6-480.7)lying down
Other activities2 9.4 (7.5-11.2) 5.3 (4.7-5.9) 7.4 (6.4-8.4)
1 Includes running, cycling, and all sports related activities2 Includes squatting, bending, carrying load, climbing, diving, and rowing
activities, climbing stairs, sports activities(including running, cycling, and all sports-related activities), and other activities(including squatting, bending, carrying load,climbing, diving and rowing).
Malaysian adults spent most of theirtime in the sitting position (mean 586.8minutes, or 40.8% of the day), followed bysleeping or lying down position (477.2minutes, or 33.1% of the day), standing (170.6minutes, or 11.8% of the day), walking (137.5
minutes, or 9.5% of the day), personal-careactivities (50.5 minutes, or 3.5% of the day).Heavy intensity activities, such as stair-climbing (2.1 minutes, or 0.1% of the day)and sports (7.9 minutes, or 0.6% of the day),as well as other activities (7.4 minutes, or0.5% of the day), are minimal.
Figure 4 shows the comparison ofphysical activity pattern between men andwomen. Generally, the physical activitypattern of both men and women are similar.
Poh BK, Safiah MY, Tahir A, Siti Haslinda MD, Siti Norazlin N, Norimah AK et al.24
However, significant differences can be seenbetween the sexes. On average, men spentsignificantly more time sitting [613.7 (605.6,621.9) minutes] vs [559.3 (552.9, 565.7)minutes], involved in sports [11.4 (10.2, 12.7)minutes vs 4.3 (3.6, 5.0) minutes], and otheractivities [9.4 (7.5, 11.2) minutes ]vs [5.3 (4.7,5.9) minutes] as compared to their femalecounterparts. On the other hand, womenspent significantly more time sleeping andlying down [482.4 (477.9, 486.8) minutes] vs472.1 (466.5, 477.6) minutes], standing [193.9(188.5, 199.4) minutes] vs [147.7 (142.1,153.3) minutes], and walking [141.5 (138.5,144.5) minutes] vs [133.6 (130.1, 137.1)minutes] as compared to their malecounterparts. There were no significantdifferences between men and women forpersonal care activities and stair-climbing.
Table 5 describes the daily physicalactivity pattern of working and non-workingmen and women. Generally, non-workingmen and women spent more time sleeping,resting, watching television, and onrecreation, as well as doing houseworkcompared with their working counterparts;while the opposite is true for time spentworking.
Figure 5 presents the physical activitypattern as percentage of a day (24 hours).Non-working women and men spentapproximately 33 and 34% of a day,respectively, (or about 8 hours a day or more)sleeping compared to only 31% (approxi-mately 7 and a half hours) among workingadults. The amount of time spent resting wasalso higher among non-working adults, onaverage 9% of a day (slightly more than 2hours), compared with working women andmen at 7 and 8%, respectively (or about 1hour 50 minutes). On the other hand, workingadults spent more than 20% of a day(approximately 5 hours or more) at workcompared with only 2 and 4 % (1 hour orless) among non-working women and men,respectively.
Non-working adults spent more time onhousework and childcare activities thanthose working (Figure 5). However, thedifferences between the sexes were larger,whereby working men spent only 2% of theirtime (approximately 30 minutes) and non-working men only 3% (approximately 40minutes) of their time on housework andchildcare activities. At 11% of the day(approximately 2.5 hours), working women
Figure 4. Physical activity pattern depicted as percentage of day by sex
Physical Activity Pattern & Energy Expenditure of Adults: Findings from MANS 25
Tab
le 5
. Dai
ly p
hysi
cal
acti
vity
pat
tern
of
wor
king
and
non
-wor
king
Mal
aysi
an m
en a
nd w
omen
(m
ean,
95%
CI)
Men
Wom
en
Act
ivit
ies
Wor
king
Non
-wor
king
Wor
king
Non
-wor
king
(N=
5,73
6,95
9 )
(N=
1,01
4,46
3)(N
=2,
875,
522
)(N
=3,
877,
146)
Slee
pin
g45
3.2
(447
.7 -
458
.8)
491.
3 (4
74.5
- 5
08.2
)45
1.1
(444
.3-4
58.0
)47
7.3
(472
.0-4
82.7
)R
esti
ng
109.
7 (1
05.4
- 1
14.0
)13
1.1
(116
.6 -
145
.7)
102.
5 (9
6.4-
108.
5)12
9.0
(122
.8-1
35.1
)W
orki
ng
319.
5 (3
09.4
- 3
29.6
)64
.0 (
44.7
- 8
3.2)
289.
8 (2
77.3
-302
.4)
28.5
(21
.4-3
5.7)
Hou
sew
ork
21.3
(19
.2 -
23.
3)38
.0 (
28.6
- 4
7.4)
129.
3 (1
22.2
-136
.4)
233.
3 (2
25.3
-241
.4)
Vil
lage
-typ
e ac
tivi
ties
10.6
(8.
7 -
12.5
)16
.6 (
10.2
- 2
3.0)
5.1
(3.4
-6.8
)7.
8 (6
.1-9
.4)
Chi
ldca
re a
ctiv
itie
s8.
1 (6
.9 -
9.2)
5.5
(1.7
- 9.
3)25
.8 (
22.4
-29.
1)65
.4 (
59.8
-71.
0)P
erso
nal
care
act
ivit
ies
49.9
(48
.9 -
50.
9)48
.7 (
45.2
- 5
2.1)
54.6
(53
.0-5
6.1)
49.0
(47
.7-5
0.3)
Pra
yin
g15
.3 (
14.3
- 1
6.4)
18.5
(15.
2 -
21.7
)16
.4 (
15.0
-17.
8)18
.7 (
17.2
-20.
2)R
elig
iou
s ac
tivi
ties
6.5
(4.1
- 9.
0)9.
4 (5
.4 -
13.3
)4.
7 (3
.2-6
.2)
8.2
(5.8
-10.
6)So
cial
act
ivit
ies
53.0
(49
.0 -
57.
0)76
.7 (
65.5
- 8
7.9)
28.7
(25
.3-3
2.0)
33.6
(30
.0-3
7.2)
Tra
nsp
orta
tion
-rel
ated
act
ivit
ies
84.4
(80
.9 -
87.
8)71
.4 (
59.0
- 8
3.8)
56.0
(52
.2-5
9.8)
32.5
(29
.3-3
5.7)
Mov
ing
abou
t49
.3 (
48.2
- 5
0.5)
56.0
(50
.0 -
61.
9)49
.4 (
47.8
-51.
1)48
.1 (
46.7
-49.
6)W
atch
ing
tele
visi
on13
8.3
(132
.8 -
143
.8)
214.
7 (1
88.9
- 2
40.5
)12
3.9
(117
.2-1
30.6
)18
9.8
(182
.1-1
97.5
)R
ecre
atio
nal
acti
viti
es21
.5 (
19.1
- 2
3.9)
50.0
(39
.1 -
60.
8)18
.5 (
15.5
-21.
6)21
.7 (
18.8
-24.
5)L
ight
-int
ensi
ty s
por
ts a
ctiv
itie
s1.
0 (0
.7 -
1.4)
1.8
(0.5
- 3.
1)0.
6 (0
.3-0
.9)
0.9
(0.5
-1.3
)M
oder
ate-
inte
nsit
y sp
orts
act
ivit
ies
3.3
(2.3
- 4.
3)6.
2 (3
.6 -
8.8)
1.1
(0.5
-1.7
)1.
3 (0
.6-1
.9)
Hea
vy-i
nten
sity
sp
orts
act
ivit
ies
3.5
(2.8
- 4.
2)9.
2 (6
.1 -
12.4
)0.
9 (0
.4-1
.4)
1.0
(0.6
-1.4
)E
atin
g71
.2 (
69.5
- 7
2.8)
66.8
(62
.3 -
71.
4)63
.2 (
61.3
-65.
2)66
.3 (
64.6
-68.
0)E
rran
ds-
rela
ted
act
ivit
ies
4.3
(3.4
- 5.
3)3.
4 (1
.4 -
5.5)
2.2
(1.6
-2.8
)2.
2 (1
.5-2
.8)
Mis
cell
aneo
us
acti
viti
es16
.0 (
13.9
- 1
8.1)
60.3
(39
.9 -
80.
6)16
.2 (
12.2
-20.
1)25
.5 (
20.6
-30.
4)
Poh BK, Safiah MY, Tahir A, Siti Haslinda MD, Siti Norazlin N, Norimah AK et al.26
spent more than triple the amount of timedoing housework and childcare activitiescompared to men. Non-working womenspent the most time on these activities atalmost double that of working women, thatis on average 21% of the day (almost 5 hours).
Another difference between workingand non-working adults is the amount oftime spent watching television. Non-working women and men spent 13 and 15%of a day, respectively, (between 3 and 3.5hours) watching television, while theirworking counterparts watched television foronly 9 and 10 %, respectively, (slightly morethan 2 hours) on average in a day.
Energy expenditure and physical activitylevel
Tables 6 and 7 presents the basal metabolicrate (BMR), total energy expenditure (TEE)and physical activity level (PAL) that werecalculated based on body weight andphysical activity of Malaysian men andwomen. Mean BMR of men [1439 (1432,1446) kcal/day] was higher than that of
women [1243 (1236, 1250) kcal/day].Similarly, mean TEE of men [2360 (2341,2379) kcal/day] was also higher than amongwomen [1989 (1972, 2006) kcal/day].However, mean PAL is similar for both men[1.6 (1.6 – 1.7)] and women [1.6 (1.6 – 1.6)]and is not significantly different.
A comparison between rural and urbanareas showed no significant differences inthe mean values of BMR, TEE and PAL ofboth men and women, with the exception ofBMR whereby urban men had significantlyhigher BMR as compared with their ruralcounterparts. This is due to urban menhaving higher body weights as comparedwith rural men.
Comparing among ethnicities, it can beseen that the mean BMR of Malays, Chineseand Indians are significantly higher thanthat of all the Bumiputera and otherethnicities. However, mean TEE did not differbetween ethnicities, and hence PAL wassimilar for all ethnic groups.
Comparison among age groups showedthat mean BMR and TEE of the 18 – 19 year
Figure 5. Physical activity pattern depicted as percentage of day among workingand non-working adults
Physical Activity Pattern & Energy Expenditure of Adults: Findings from MANS 27T
able
6.T
otal
ene
rgy
expe
ndit
ure
(T
EE
) an
d p
hysi
cal
acti
vity
lev
el (
PA
L)
of M
alay
sian
men
(m
ean,
95%
CI)
Soci
o-de
mog
raph
ic G
roup
sN
Bod
y w
eigh
t (kg
)B
MR
(kca
l/day
)T
EE
(kca
l/day
)P
AL
Stra
taU
rban
4,10
3,78
567
.5 (
66.7
-68.
3)14
53 (
1443
-146
3)23
73 (
2348
-239
9)1.
6 (1
.6-1
.6)
Ru
ral
2,89
4,87
564
.7(6
3.8-
65.5
)14
20(1
410-
1430
)23
41 (
2312
-237
1)1.
6 (1
.6-1
.7)
Zon
esSo
uth
ern
1,31
1,59
167
.9 (
66.5
-69.
2)14
59 (
1443
-147
5)23
97 (
2348
-244
6)1.
6 (1
.6-1
.7)
Cen
tral
2,47
7,00
267
.6 (
66.5
-68.
7)14
55(1
441-
1469
)23
53 (
2320
-238
5)1.
6 (1
.6-1
.6)
Eas
t C
oast
1,01
6,62
064
.5 (
62.9
-66.
2)14
17 (
1397
-143
6)22
88 (
2240
-233
7)1.
6 (1
.6-1
.6N
orth
ern
985,
369
66.1
(64
.8-6
7.5)
1436
(14
20-1
451)
2388
(23
37-2
439)
1.7
(1.6
-1.7
)Sa
bah
573,
195
64.0
(62
.5-6
5.5)
1409
(13
92-1
425)
2331
(22
84-2
377)
1.7
(1.6
-1.7
)Sa
raw
ak63
4,88
263
.5 (
61.7
-65.
4)14
06 (
1384
-142
7)24
11 (
2340
-248
2)1.
7 (1
.7-1
.8)
Eth
nici
tyM
alay
s3,
646,
295
66.3
(65
.5-6
7.2)
1440
(14
29-1
450)
2356
(23
31-2
382)
1.6
(1.6
-1.7
)C
hin
ese
2,04
1,43
068
.1 (
67.1
-69.
2)14
60 (
1448
-147
2)23
87 (
2351
-242
3)1.
6 (1
.6-1
.7)
Ind
ians
546,
004
67.2
(65
.2-6
9.3)
1449
(14
24-1
474)
2415
(23
28-2
501)
1.7
(1.6
-1.7
)O
ther
Bum
iput
era
202,
521
60.7
(57
.1-6
4.4)
1373
(13
31-1
415)
2221
(21
01-2
341)
1.6
(1.6
-1.7
)Sa
bah
Bum
iput
era
257,
242
61.6
(59
.4-6
3.7)
1384
(13
60-1
408)
2262
(21
93-2
332)
1.6
(1.6
-1.7
)Sa
raw
ak B
um
ipu
tera
290,
611
60.3
(58
.1-6
2.5)
1368
(13
43-1
392)
2314
(22
37-2
391)
1.7
(1.6
-1.7
)O
ther
s14
,556
58.5
(54
.1-6
2.8)
1346
(13
01-1
392)
2129
(18
79-2
379)
1.6
(1.4
-1.7
)
Age
gro
ups
18 –
19
year
s67
9,00
059
.2 (
55.5
-62.
8)13
70 (
1322
-141
7)21
86 (
2101
-227
1)1.
6 (1
.5-1
.7)
20 –
29
year
s2,
058,
002
65.2
(64
.2-6
6.3)
1450
(14
36-1
463)
2364
(23
25-2
404)
1.6
(1.6
-1.7
)30
– 3
9 ye
ars
1,79
8,82
368
.3 (
67.4
-69.
2)14
48 (
1439
-145
7)24
15 (
2384
-244
6)1.
7 (1
.6-1
.7)
40 –
49
year
s1,
499,
258
68.3
(67
.3-6
9.2)
1448
(14
38-1
458)
2402
(23
68-2
437)
1.7
(1.6
-1.7
)50
– 5
9 ye
ars
963,
577
67.1
(65
.8-6
8.5)
1436
(14
22-1
450)
2306
(22
63-2
349)
1.6
(1.6
-1.6
)
BM
I gr
oups
Und
erw
eigh
t62
6,36
548
.1 (
47.4
-48.
8)12
30 (
1221
-123
9)19
33 (
1876
-199
0)1.
6 (1
.5-1
.6)
Nor
mal
wei
ght
3,71
3,30
760
.4 (
60.0
-60.
8)13
73 (
1368
-137
8)22
72 (
2250
-229
4)1.
7 (1
.6-1
.7)
Ove
rwei
ght
2,01
1,97
775
.0 (
74.5
-75.
5)15
35 (
1530
-154
1)25
29 (
2497
-256
1)1.
6 (1
.6-1
.7)
Obe
se63
6,97
291
.1 (
89.3
-93.
0)17
25 (
1698
-175
2)27
63 (
2701
-282
5)1.
6 (1
.6-1
.6)
All
6,99
8,66
066
.3 (
65.7
-66.
9)14
39 (
1432
-144
6)23
60 (
2341
-237
9)1.
6 (1
.6-1
.7)
Poh BK, Safiah MY, Tahir A, Siti Haslinda MD, Siti Norazlin N, Norimah AK et al.28T
able
7:T
otal
ene
rgy
expe
ndit
ure
(T
EE
) an
d p
hysi
cal
acti
vity
lev
el (
PA
L)
of M
alay
sian
wom
en (
mea
n, 9
5%C
I)
Soci
o-de
mog
raph
ic G
roup
sN
Bod
y w
eigh
t (kg
)B
MR
(kca
l/day
)T
EE
(kca
l/day
)P
AL
Stra
taU
rban
4,01
1,82
557
.9 (
57.3
-58.
3)12
43 (
1234
-125
2)19
82 (
1961
-200
5)1.
6 (1
.6-1
.6)
Ru
ral
2,85
7,46
658
.1 (
57.3
-58.
9)12
44 (
1234
-125
5)19
97 (
1971
-202
3)1.
6 (1
.6-1
.6)
Zon
esSo
uth
ern
1,28
1,25
759
.7 (
58.5
-60.
8)12
67 (
1252
-128
2)20
45 (
2008
-208
2)1.
6 (1
.6-1
.6)
Cen
tral
2,36
9,30
658
.2 (
57.3
-59.
2)12
45 (
1232
-125
7)19
82 (
1951
-201
3)1.
6 (1
.6-1
.6)
Eas
t C
oast
966,
863
56.9
(55
.5-5
8.3)
1230
(12
11-1
248)
1963
(19
17-2
009)
1.6
(1.6
-1.6
)N
orth
ern
1,03
5,88
758
.9 (
57.6
-60.
2)12
56 (
1238
-127
3)19
71 (
1931
-201
1)1.
6 (1
.6-1
.7)
Saba
h57
6,34
154
.7 (
53.2
-56.
3)12
02 (
1182
-122
3)19
28 (
1885
-197
1)1.
6 (1
.6-1
.6)
Sara
wak
639,
637
56.8
(55
.3-5
8.2)
1228
(12
09-1
247)
2025
(19
72-2
077)
1.6
(1.6
-1.7
)
Eth
nici
tyM
alay
s3,
444,
664
59.4
(58
.6-6
0.1)
1260
(12
50-1
269)
2025
(20
02-2
048)
1.6
(1.6
-1.6
)C
hin
ese
2,02
9,22
156
.7 (
55.8
-57.
6)12
29 (
1217
-124
1)19
33 (
1901
-196
5)1.
6 (1
.6-1
.6)
Ind
ians
583,
719
60.2
(58
.6-6
1.8)
1270
(12
49-1
291)
2039
(19
84-2
093)
1.6
(1.6
-1.6
)O
ther
Bum
iput
era
196,
784
53.9
(50
.7-5
7.1)
1194
(11
52-1
237)
1959
(18
15-2
103)
1.6
(1.5
-1.8
)Sa
bah
Bum
iput
era
296,
822
52.1
(50
.1-5
4.1)
1166
(11
39-1
194)
1886
(18
26-1
945)
1.6
(1.6
-1.7
)Sa
raw
ak B
um
ipu
tera
294,
336
55.6
(53
.7-5
7.4)
1210
(11
86-1
234)
1971
(19
09-2
033)
1.6
(1.6
-1.7
)O
ther
s23
,744
55.4
(50
.6-6
0.2)
1210
(11
41-1
279)
2076
(19
06-2
245)
1.7
(1.6
-1.8
)
Age
gro
ups
18 –
19
year
s69
7,86
551
.8 (
49.8
-53.
9)11
39 (
1112
-116
5)17
49 (
1676
-182
3)1.
5 (1
.5-1
.6)
20 –
29
year
s2,
016,
402
56.4
(55
.4-5
7.3)
1197
(11
84-1
209)
1890
(18
60-1
920)
1.6
(1.6
-1.6
)30
– 3
9 ye
ars
1,76
9,52
459
.0 (
58.1
-59.
8)12
72 (
1261
-128
3)20
75 (
2050
-210
1)1.
6 (1
.6-1
.6)
40 –
49
year
s1,
438,
022
60.8
(59
.7-6
1.8)
1295
(12
82-1
309)
2122
(20
92-2
153)
1.6
(1.6
-1.7
)50
– 5
9 ye
ars
947,
478
60.0
(58
.6-6
1.4)
1286
(12
68-1
303)
2011
(19
73-2
049)
1.6
(1.5
-1.6
)
BM
I gr
oups
Und
erw
eigh
t72
1,44
641
.3 (
40.6
-42.
1)10
18 (
1008
-102
9)16
00 (
1560
-164
1)1.
6 (1
.5-1
.6)
Nor
mal
wei
ght
3,23
8,19
452
.1 (
51.8
-52.
5)11
67 (
1162
-117
1)18
67 (
1850
-188
5)1.
6 (1
.6-1
.6)
Ove
rwei
ght
1,69
5,34
364
.1 (
63.6
-64.
6)13
27 (
1321
-133
3)21
38 (
2110
-216
5)1.
6 (1
.6-1
.6)
Obe
se94
5,86
079
.2 (
78.0
-80.
3)15
21 (
1507
-153
6)24
56 (
2407
-250
4)1.
6 (1
.6-1
.6)
All
6,86
9,29
158
.0 (
57.5
-58.
5)12
43 (
1236
-125
0)19
89 (
1972
-200
6)1.
6 (1
.6-1
.6)
Physical Activity Pattern & Energy Expenditure of Adults: Findings from MANS 29
olds were significantly lower than all otherage groups. However, the mean PAL of allage groups was similar and showed nosignificant difference.
Among BMI groups, the mean BMR andTEE increased significantly with each BMIcategory. This is expected as the basis ofcalculation of BMR and consequently of TEEis body weight dependent. Nonetheless, thePAL of the BMI groups did not show such atrend.
Table 8 shows the proportion ofMalaysian adults with sedentary,moderately active and active lifestyle basedon PAL. The majority of Malaysians adultsare either sedentary [39.7% (CI: 38.2%,41.1%)] or moderately active [47.6% (CI:46.1%, 49.0%)], while only a smallproportion are active [12.8% (CI: 11.9%,13.8%)].
Comparison between strata shows thatthe proportions of urban adults in each PALcategory are very similar to those of ruraladults. However, comparison between thesexes in Figure 6 shows that the proportionof men (15.7%) who were active was higherthan their female counterparts (9.8%), whilethe opposite is true of a sedentary lifestyle(women 42.6% versus men 36.7%).
Comparison between zones (Table 8)shows that Sarawak had the highestproportion of active adults [18.0% (CI: 14.3%,22.3%)], while the East Coast has the lowest[9.9% (CI: 7.8%, 12.3%)]. On the other hand,the Northern region had the highestproportion of sedentary adults [44.3% (CI:40.6%, 48.0%)], while Sarawak had thelowest [31.1% (CI: 26.3%, 36.3%)].
Comparison among ethnicity, agegrouping and BMI grouping did not showany significant differences or any cleartrends in physical activity levels.
DISCUSSION
In this survey, we found that the majority ofMalaysian adults were generally physicallyinactive in almost all aspects studied,
including mode of transportation andexercise habits, as well as physical activitypatterns.
Passive transportation mode wasprevalent amongst the adult population.Almost 75% travelled to and from work orschool by passive transportation, namelydriving a car or riding a motorcycle. Only asmall proportion (21%) used activetransportation, namely walking and cycling.Our results are similar to the situation inCanada where more than 80% of thepopulation travelled by passivetransportation using car, truck or van(Statistics Canada, 2006). Similarly, in theUnited States, the proportion of walkingtrips is low (8.6%) compared to other travelmodes, such as use of personal vehicles(86.6%) (DOT/BTS, 2003). In addition,Saelens, Sallis & Frank (2003) reported thatwalking and biking trips were consistentlyhigher in high-walkable neighbourhoods ascompared to those for low-walkableneighbourhoods. This shows that the builtenvironment is an important aspect indetermining the mode of transportationchosen by a population. Although this studydoes not provide data on the builtenvironment of our Malaysian neighbour-hoods, it can be observed that with very fewexceptions, most neighbourhoods do nothave walking or cycling paths to encouragehigher physical activity amongst itscommunity.
There is growing concern that themodern society may have ‘engineered’physical activity out of the people’s dailylives by building neighbourhoods so that itis difficult, and in many cases dangerous, towalk or cycle around (Jackson & Kochtitzky,2002). This is particularly worrying asdeclines in active transport are known tohave contributed to overweight and obesity.In China, a country that has recently evolvedfrom wide-spread use of active trans-portation (bicycling) to passive tranportation(cars, buses and motorcycles), it was foundthat this change in transportation mode has
Poh BK, Safiah MY, Tahir A, Siti Haslinda MD, Siti Norazlin N, Norimah AK et al.30
Table 8. Proportion of sedentary, moderately active and vigorous lifestyles of Malaysian adults(%, 95%CI)
All 39.7 (38.2-41.1) 47.6 (46.1-49.0) 12.8 (11.9-13.8)
contributed to a doubling of the risk ofbecoming overweight or obese (Bell, Ge &Popkin, 2002).
Exercise prevalence is also low amongstMalaysian adults. Only a third of the adultsreported having ever-exercised within thetwo weeks prior to being interviewed for thesurvey. The proportion of women (22%) whohad ever-exercised was about half that of
men (40%). These results differ from thatreported in the NHMS II survey, where theproportions of ever-exercised were lessdivergent between men (38%) and women(25%) (IPH, 1999).
Of concern is the very small proportionof Malaysian adults (14.2%) who hadadequate exercise. Again, the proportion ofwomen (9%) who had adequate exercise was
Physical Activity Pattern & Energy Expenditure of Adults: Findings from MANS 31
only half that of men (19%). In comparison,NHMS II reported a prevalence of 12% of thepopulation having adequate exercise, with8% women and 16% men. However, it mustbe noted that these percentages are notdirectly comparable as the definition ofadequate exercise used in this survey was“at least 3 times a week for 20 minutes eachsession”, whereas that used in the NHMSsurvey was “at least 3 times a week for 15minutes each session”. In comparison, the2004 National Health Survey in Singapore(Bhalla et al., 2006) found that 25% of theiradult population had regular exercise,which was defined exactly the same as foradequate exercise in MANS survey.Comparison with previous surveys inSingapore found that prevalence of regularexercise had been increasing from 14% inthe year 1992, to 17% in 1998, and to thecurrent 25% in year 2004 (Bhalla et al., 2006).Similar to our findings, there were moreSingaporean men (29%) who had regularexercise as compared to their femalecounterparts (20%).
It is also observed in this survey that theurban Malaysian population (16%) had a
higher proportion having adequate exerciseas compared to their rural counterparts(12%). Other surveys have also reported thatlevels of leisure-time physical activity werehigher among those with higher educationand income (de Almeida et al., 1999).Livingstone et al. (2003) explained that thisvariance may be attributed to occupationalactivity, which is not studied in manysurveys, whereby lower income and lowereducated subjects may have beenmisclassified due to their lack of interest inbeing active during leisure time as theyalready have physically demanding jobs.This is reflected in the study of Mbalilaki etal. (2007) who reported that most individualsliving in rural areas work in agriculture andare involved in heavy physical activities,while most of urban inhabitants havesedentary work and more leisure-timeactivities.
Sedentary activities appear to be mostprevalent amongst adult Malaysians. Thissurvey found that the Malaysian adultpopulation spent most of their time insedentary activities such as sitting (41% ofthe day) and sleeping or lying down (33% of
Figure 6. Proportion of Malaysian adults according to physical activity level (Sedentary: PAL = 1.40 – 1.69;Moderately active: PAL = 1.70 – 1.99; Active: PAL = 2.00 – 2.40)
Poh BK, Safiah MY, Tahir A, Siti Haslinda MD, Siti Norazlin N, Norimah AK et al.32
the day). Time spent on light intensityactivities, including standing and personalcare activities, amounted to onlyapproximately 15% of the day; whilemoderate to vigorous intensity activities,such as walking, stair climbing and sports,took up only about 10% of the day. Incomparison, Malaysian soldiers spent only21.3% of the day sitting (Ismail, Isa &Janudin, 1996). However, they reported asimilar amount of time sleeping/lying down(31.6% of the day). Similarly, Malaysiansportsmen spent approximately 34.5% of theday sleeping, and only 24.0% of the daysitting (Ismail, Wan Nudri & Zawiah, 1995).This shows that the Malaysian adultpopulation were generally more inactivecompared to their counterparts in the armedforces and sports.
There appears to be some differences inthe way the working and non-workingpopulation spent their time. On average,working people spent less time sleeping ascompared to their non-working counter-parts. As expected, working people spent agreater proportion of the day at work, whilethose without full time employment spentmore time watching television. Non-workingwomen also spent a significantly greaterproportion of their day on housework andchildcare activities as compared to theirworking counterparts.
In Great Britain, average sleeping timeis 8.46 hours (35.3% of the day), with womenspending on average slightly more timesleeping than men (Allender et al., 2006). Ina study of middle-aged adults in the US(Lauderdale et al., 2006), it was found thatobjectively measured sleep duration usingwrist actigraphy averages 6.13 hours per day(25.5% of the day), whereas self-reportedsleep duration was longer, at 6.65 hours(27.7% of the day) during weekdays and 7.26hours (30.3% of the day) on weekends.Comparatively, our Malaysian adultpopulation spent more time sleeping thanthose in the US study, but less than adults inGreat Britain.
The 2005 Health Survey in Great Britainfound that the amount of time spentwatching television was 148 minutes perday (2 hours and 28 minutes, or 10.3% of theday), with men watching on average 24minutes more television than women. Timespent on household chores and childcareactivities averages 193 minutes (3 hours and13 minutes, or 13.4% of the day), with menspending only half the time that women doon these activities (Allender et al., 2006). Itwould appear that our Malaysianpopulation spent more time watchingtelevision as well as on household choresand child care activities as compared to theirBritish counterparts. However, this findingcould be due to the fact that approximately30% of our Malaysian subjects werehousewives. Nevertheless, the pattern of menspending half the time doing householdchores and childcare activities as comparedto women holds true for both populations.
Total energy expenditure (TEE) of theMalaysian adult population was estimatedfrom calculations of basal metabolic rate(BMR) based on body weight, and self-reported physical activity recall. The overallenergy expenditure values are in similarranges to those reported by Walsh et al. (2004)in their study comparing self-reported energyexpenditure versus that measuredobjectively by doubly-labelled water (DLW)in women. The mean TEE of overweightwomen in the present study was 2138 kcal/day, while that reported by Walsh et al. (2004)using DLW technique among women in thesame weight category was 2234 kcal/day.However, Walsh et al. (2004) found that theTEE estimated from self-reportedquestionnaire among their subjects’ wasoverestimated when compared with thatmeasured using DLW technique. Anotherstudy by Conway et al. (2002) among menalso found that TEE estimated from physicalactivity recall was higher than thatmeasured by DLW technique. Although self-reported physical activity may not be the bestmethod to assess energy expenditure, the
Physical Activity Pattern & Energy Expenditure of Adults: Findings from MANS 33
method has been used in many surveys(Steffen et al., 2006). Moreover, studies haveshown that energy expenditure estimatedfrom self-reported physical activity has goodagreement with that obtained from DLW andaccelerometry techniques at the populationgroup level (Corder et al., 2009).
The overall physical activity level ofboth Malaysian men and women at meanPAL 1.6 is considered sedentary. However,when the population was categorised intoPAL groups, it was found that almost halfthe population (47.6%) was moderatelyactive. There were more men categorised asactive compared to women, and morewomen categorised as sedentary ascompared to their male counterparts.Another study by Paul, Novotny & Rumpler(2004) using DLW technique in healthyadults in the US also showed that men (1.64± 0.19) and women (1.69 ± 0.19) had similarPAL levels as that found in our study. Astudy in Siberia (Snodgrass et al., 2006), onthe other hand, found that women (1.50 ±0.20) had significantly lower PAL than men(1.68 ± 0.33). On the other hand, Tooze et al.,(2007) reported that their sample of middle-aged women in Washington DC hadsignificantly higher PAL (1.75 ± 0.02)compared to their male counterparts (1.69 ±0.01). Nevertheless, the average PAL levelsof these various studies revolve around thesedentary to moderate levels of physicalactivity as in our Malaysian population.
Overall, the results from most surveysrevealed that men are more active thanwomen (Livingstone et al., 2003). Anationally representative survey in everymember state of the European Union foundthat women participated less and for shorterperiods of time in leisure-time physicalactivity (de Almeida et al., 1999). Halldin etal. (2007) also reported that men were morevigorously active than women during leisuretime. It is important to note, however, thatalthough most reports concluded that menare more active than women, this differenceis usually in the context of participation in
sports and other leisure activities,particularly those that are of vigorousintensity (Livingstone et al., 2003), and maynot reflect whole day physical activity levels.
The findings from this survey also foundthat men were more involved in vigorousintensity physical activities, includingexercise and sports, as compared to women.We also found that according to PAL values,more men were categorised as active whilemore women were categorised as sedentary.This survey shows that Malaysian men arecomparatively more active than Malaysianwomen. However, on the whole, both sexesare still considered generally sedentary, fromthe point of view of their overall physicalactivity levels, as well as in the sedentaryphysical activities that the populationengages in.
One of the limitations of this study isthe use of the recall method to assessphysical activity. As discussed previously,self-report methods are usually affected byvarious factors, including lack ofcooperation and inability to recall everyactivity that was performed. Also, thefactorial method was used to calculate totalenergy expenditure, and this method isconstrained by insufficient data on energycost of various types of physical activity.Hence, estimates had to be made using theclosest value, which would affect the overallenergy expenditure. Nevertheless thisproblem is not unique to this particularstudy, but occurs for all studies that employsthis methodology. Although the mostaccurate is the doubly-labelled water (DLW)technique, it is not possible to employ thishighly expensive method in populationstudies.
CONCLUSION
Generally, the Malaysian adult populationis considered sedentary. Participation inexercise is low, and only minimal time isspent on vigorous intensity activities, suchas sports and stair-climbing. Choice of
Poh BK, Safiah MY, Tahir A, Siti Haslinda MD, Siti Norazlin N, Norimah AK et al.34
transportation also tended towards thepassive modes of transportation. There aredifferences in the way Malaysian workingand non-working men and women, fromrural and urban areas spent their time. Thesedifferences could be due to the differingnature of the occupations of men andwomen, as well as to the differing lifestyle ofurban and rural populations.
We stress the importance of furtherpromoting physical activity as part of ahealthy lifestyle for the Malaysianpopulation, as an active lifestyle will improvephysical fitness and health as well as reducethe incidence of obesity amongst thepopulation. Various health promotionefforts should include a physical activitycomponent, and most importantly theauthorities need to be committed towardsproviding a built environment that issuitable for an active lifestyle.
The present survey is the first to providean in-depth glimpse of the physical activitypattern of Malaysian adults. It is also thefirst to provide national estimates of energyexpenditure and physical activity levels ofMalaysian adults. Future studies are neededto explore the associations between physicalactivity, nutritional status and chronicdiseases among the Malaysian population.Other factors influencing physical activitypattern such as the built environment, aswell as barriers and enhancers to a morephysically active lifestyle should also bestudied. It is also recommended thatphysical activity be maintained as acomponent for future national surveys andnational nutrition surveillance in order tofurther understand the activity patterns ofMalaysians, and to track the changes inphysical activity levels over the years.
ACKNOWLEDGEMENT
The Malaysian Adult Nutrition Survey(MANS) was funded by the Ministry ofHealth. The authors would like to extendtheir grateful thanks to the Director-General
of the Ministry of Health for permission topublish this paper. The support given by therespective state nutrition officers, researchofficers, data enumerators and many otherswho helped throughout the study is alsogratefully acknowledged.
REFERENCES
Ainsworth BE, Haskell WL, Whitt MC, IrwinMl, Swartz AM, Strath SH, O’Brien WL,Bassett DR, Schmitz KH, EmplaincourtPO, Jacobs DR & Leon AS (2000).Compendium of physical activities: anupdate of activity codes and METintensities. Med Sci Sports Exerc. 32(9Suppl): S498–504.
Allender S, Peto V, Scarborough P, Boxer A& Rayner M (2006). Diet, PhysicalActivity and Obesity Statistics. London:British Heart Foundation.
Azmi MY, Junidah R, Siti Mariam A, SafiahMY, Fatimah S, Norimah AK, Poh BK,Kandiah M, Zalilah MS, Wan AbdulManan WM, Siti Haslinda MD & TahirA (2009). Body mass index of adults:Findings of the Malaysian AdultNutrition Survey (MANS). Mal J Nutr15(2): 97–119.
Bell AC, Ge K & Popkin BM (2002). The roadto obesity or the path to prevention:motorized transportation and obesity inChina. Obes Res 10: 277–283.
Bernstein MS, Costanza MC & Morabia A(2004). Association of physical activityintensity levels with overweight andobesity in a population-based sample ofadults. Preventive Medicine 38(1): 94–104.
Bhalla V, Fong CW, Chew SK & Satku K(2006). Changes in the levels of majorcardiovascular risk factors in the multi-ethnic population in Singapore after 12years of a national non-communicable
Physical Activity Pattern & Energy Expenditure of Adults: Findings from MANS 35
disease intervention programme.Singapore Med J 47(10): 841–850.
Conway JM, Seale JL, Jacobs DR Jr, Irwin ML& Ainsworth BE (2002). Comparison ofenergy expenditure estimates fromdoubly labeled water, a physical activityquestionnaire, and physical activityrecords. Am J Clin Nutr. 75: 519 –525.
Corder K, van Sluijs EMF, Wright A,Whincup P, Wareham NJ & Ekelund U(2009). Is it possible to assess free-livingphysical activity and energy expendturein young people by self-report? Am J ClinNutr 89: 862–870.
de Almeida MDV, Graca P, Afonso C,D’Amicis A, Lappalainen R & DamkjaerS (1999). Physical activity levels andbody weight in a nationallyrepresentative sample in the EuropeanUnion. Publ Health Nutr. 2(1a): 105–113.
DOT/BTS (2003). National HouseholdTravel Survey 2001 Highlights Report.U.S. Department of Transportation,Bureau of Transportation Statistics,Washington D.C. [WWW document]. URLh t t p : / / w w w . b t s . g o v / p r o g r a m s /national_household_ travel_survey/(Accessed 28 October 2009).
FAO/WHO/UNU (2005). Human energyrequirements. Report of a Joint FAO/WHO/UNU Expert Consultation heldin Rome on 17 – 24 October 2001. Foodand Nutrition Technical Report Series.Rome: FAO.
Halldin M, Rosell M, de Faire U & Hellénius(2007). The metabolic syndrome:Prevalence and association to leisure-time and work-related physical activityin 60-year-old men and women. Nutr,Metabol Cardiovas Dis 17(5): 349–357.
IPH (Institute for Public Health) (1999).Exercise. A report of The National Healthand Morbidity Survey 1996. Volume 13.Institute for Public Health, Ministry ofHealth Malaysia, Kuala Lumpur.
IPH (Institute for Public Health) (2008). TheThird National Health and MorbiditySurvey (NHMS III) 2006, GeneralFindings. Ministry of Health Malaysia,Kuala Lumpur.
Ismail MN, Wan Nudri WD & Zawiah H(1995). Daily energy intake, energyexpenditure and activity patterns ofselected Malaysian sportsmen. Mal JNutr 1: 141–149.
Ismail MN, Isa M & Janudin A (1996). Energyrequirements of Malaysian soldiers in abase camp. Mal J Nutr 2: 168–174.
Ismail MN, Ng KK, Chee SS, Roslee R &Zawiah H (1998). Predictive equationsfor the estimation of basal metabolic ratein Malaysian adults. Mal J Nutr 4:81–90.
Jackson RJ & Kochtitzky C (2002). Creatinga HealthyEnvironment: The Impact ofthe Built Environment on Public Health.[WWW document]. URL http://w w w . s p r a w l w a t c h . o r g / h e a l t h . p d f(Accessed 26 February 2002).
Lauderdale DS, Knutson KL, Yan LL,Rathouz PJ, Hulley SB, Sidney S & Liu K(2006). Objectively measured sleepcharacteristics among early-middle-aged adults: The Cardia Study. Am JEpidemiol 164: 5–16.
Livingstone MBE, Robson PJ, Wallace JMW& McKinley MC (2003). How active arewe? Levels of routine physical activityin children and adults. Proc Nutr Society.62: 681–701.
Poh BK, Safiah MY, Tahir A, Siti Haslinda MD, Siti Norazlin N, Norimah AK et al.36
Mbalilaki J, Hellènius M, Masesa Z,Høstmark A, Sundquist J & Strømme S(2007). Physical activity and bloodlipids in rural and urban Tanzanians.Nutr, Metabol Cardiovas Dis 17(5): 344–348.
NCD (Disease Control Division) (2006).Malaysia NCD Surveillance 2006: NCDRisk Factors in Malaysia. Ministry ofHealth Malaysia, Putrajaya.
NCCFN (National Coordinating Committeeon Food and Nutrition) (1999).Malaysian Dietary Guidelines. Ministryof Health Malaysia, Kuala Lumpur.
Paul DR, Novotny JA & Rumpler WV (2004).Effects of the interaction of sex and foodintake on the relation between energyexpenditure and body composition. AmJ Clin Nutr 79: 385–389.
Poh BK, Safiah MY, Tahir A, Siti HaslindaMD, Farina Z, Siti Norazlin N & MohdHasyami S (2008). Physical Activity ofAdults aged 18 to 59 years. MalaysianAdult Nutrition Survey 2003. Volume 6.Ministry of Health Malaysia, Putrajaya.
Popkin BM (2006). Global nutritiondynamics: the world is shifting rapidlytoward a diet linked with non-communicable diseases. Am J Clin Nutr84: 289–298.
Saelens BE, Sallis JF & Frank LD (2003).Environmental Correlates of Walkingand Cycling: Findings from theTransportation, Urban Design, andPlanning Literatures. Ann Behav Med25(2):80–91.
Safiah MY, Siti Haslinda MD, Ahmad MahirR & Siti Fatimah A (2008). Methodology.Malaysian Adult Nutrition Survey 2003.Volume 1. Ministry of Health Malaysia,Putrajaya.
Saris WHM, Blair SN, van Baak MA, EatonSB, Davies PSW, Di Pietro L, FogelholmM, Rissanen A, Schoeller D, SwinburnB, Tremblay A, Westerterp KR & WyattH (2003). How much physical activityis enough to prevent unhealthy weightgain? Outcome of the IASO 1st StockConference and Consensus Statement.Obesity Rev 4: 101–114.
Snodgrass JJ, Leonard WR, Tarskaia LA &Schoeller DA (2006). Total energyexpenditure in the Yakut (Sakha) ofSiberia as measured by the doublylabeled water method. Am J Clin Nutr 84:798–806.
Statistics Canada (2006). Mode oftransportation to work, 2006 Census.[WWW document]. URL http://www40.statcan.gc.ca/l01/cst01/labor42a-eng.htm [Accessed 28 October 2009].
Tee ES (1999). Nutrition of Malaysians:where are we heading? Mal J Nutr 5:87–109.
Tooze JA, Schoeller DA, Subar AF, Kipnis V,Schatzkin A & Troiano RP (2007). Totaldaily energy expenditure among middle-aged men and women: the OPEN Study.Am J Clin Nutr 86:382–387.
Vuori IM (2001). Health benefits of physicalactivity with special reference tointeraction with diet. Publ Health Nutr4(2B): 517–528.
Physical Activity Pattern & Energy Expenditure of Adults: Findings from MANS 37
Walsh MC, Hunter GR, Sirikul B & GowerBA (2004). Comparison of self-reportedwith objectively assessed energyexpenditure in black and white womenbefore and after weight loss. Am J ClinNutr 79: 1013–1019.
WHO (1998). Obesity: Preventing andmanaging the global epidemic. Reportof a WHO Consultation on Obesity.World Health Organization, Geneva.
WHO (2003). Diet, nutrition and theprevention of chronic diseases. Reportof a Joint WHO/FAO Expert Consul-tation. WHO Technical Report Series916. World Health Organization,Geneva.
WHO (2008). WHO Global Infobase onPhysical Activity – data from the WorldHealth Survey 2003. [WWW document].URL http://www.who.int/infobase(accessed 29 May 2008).