Physical and chemical factors controlling mercury and methylmercury concentrations in stream water Mark E. Brigham and Dennis A. Wentz 5 th National Monitoring Conference San José, California May 7-11, 2006 U.S. Department of the Interior U.S. Geological Survey
Transcript
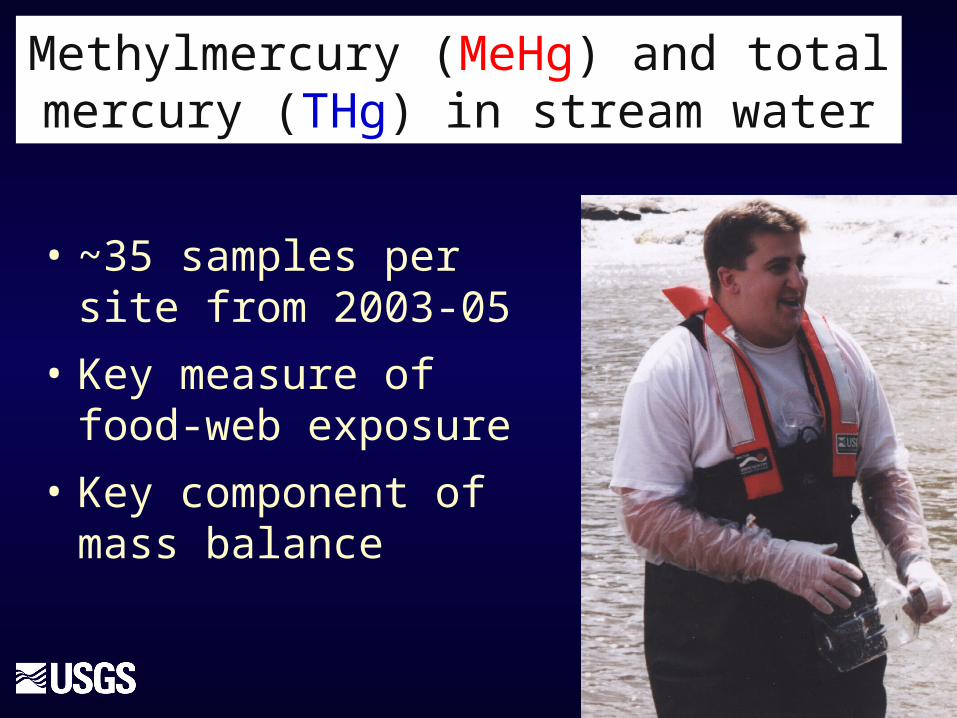
Physical and chemical factors controlling mercury and methylmercury concentrations in stream water
Mark E. Brigham and Dennis A. Wentz
5th National Monitoring ConferenceSan José, CaliforniaMay 7-11, 2006
U.S. Department of the InteriorU.S. Geological Survey
Willamette Basin
Georgia-Florida Coastal Plain
Western Lake Michigan
Drainages
Reference stream
Urban stream
USGS NAWQA mercury study areas
Aqueous methylmercury (MeHg) is a major control on mercury bioaccumulation.
Mean Hg in
forage fish
(μg/g wet wt.)
N ≈ 24 at each site
(2 species x 12 individuals)
R2 = 0.8418
0.00
0.05
0.10
0.15
0.20
0.0 0.1 0.2 0.3 0.4 0.5
Mean aqueous MeHg (ng/L)
N ≈ 35 at each site
What controls aqueous MeHg (and THg) concentrations in
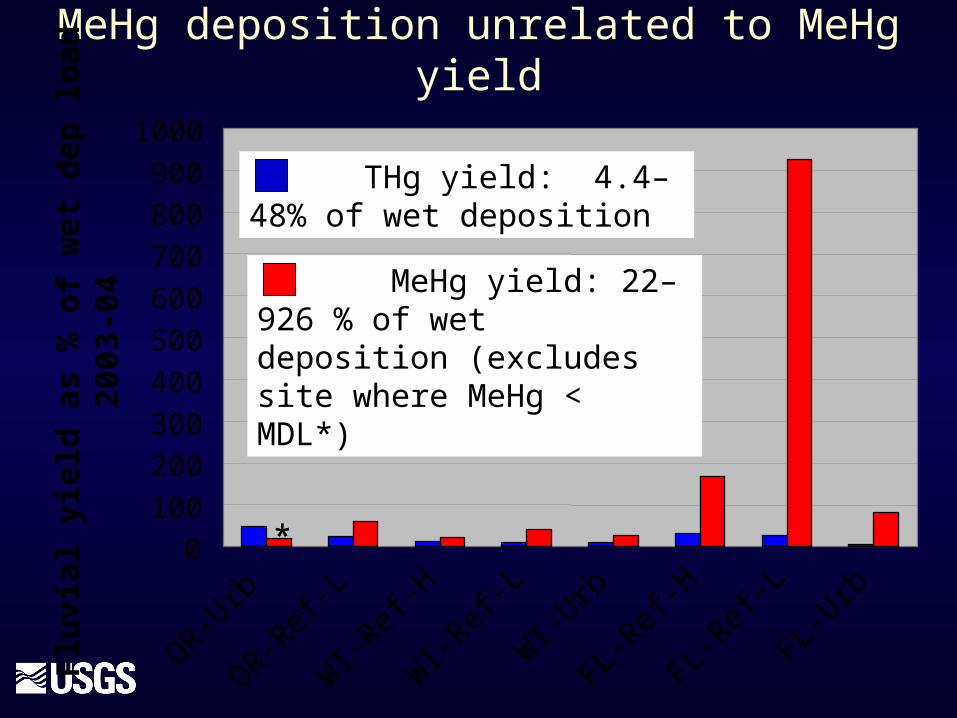
Runoff-mobilized Hg-DOC complexes controls: -- THg in most streams -- MeHg in half the study streams.
Evidence for watershed inputs of MeHg
Evidence against in-channel methylation as dominant source
Santa Fe River, Florida
Log10 [Q] (cfs)
Log 1
0 [
FT
Hg]
(ng
/L)
Log 1
0 [
FM
eHg]
(ng
/L)
Negative relation between MeHg and flow?
Evidence for in-channel methylation?
Or, high [MeHg] in wetlands during low-flow periods?
St Mary’s River, Florida
Log10 [Q] (cfs)
Log 1
0 [
FT
Hg]
(ng
/L)
Log 1
0 [
FM
eHg]
(ng
/L)
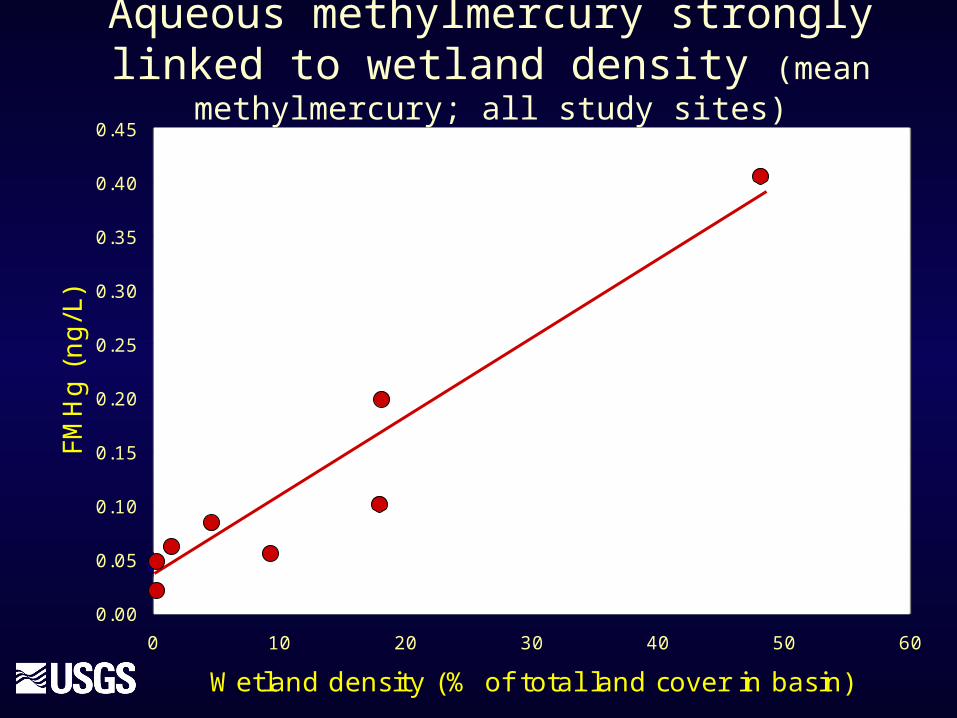
Aqueous methylmercury strongly linked to wetland density (mean methylmercury; all study sites)
R2 = 0.9224
0.00
0.05
0.10
0.15
0.20
0.25
0.30
0.35
0.40
0.45
0 10 20 30 40 50 60
Wetland density (% of total land cover in basin)
FMH
g (
ng/L
)
Log 1
0 T
Hg
conc
entr
atio
n (n
g/L)
DOC and Suspended Sediment—a potential screening tool for total mercury…
R2=0.62
Log10 DOC (mg/L)
Log10 Susp Sed
(mg/L)
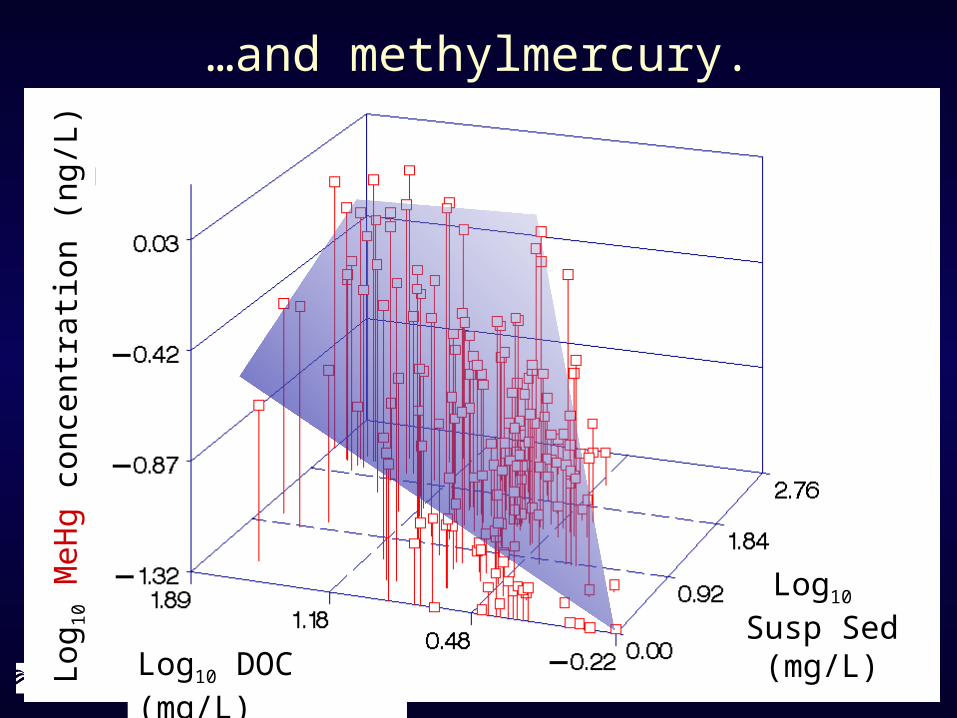
…and methylmercury.Lo
g 10 M
eHg
conc
entr
atio
n (n
g/L)
Log10 DOC (mg/L)
Log10 Susp Sed
(mg/L)
What have we learned about THg and MeHg in streams?
Summary
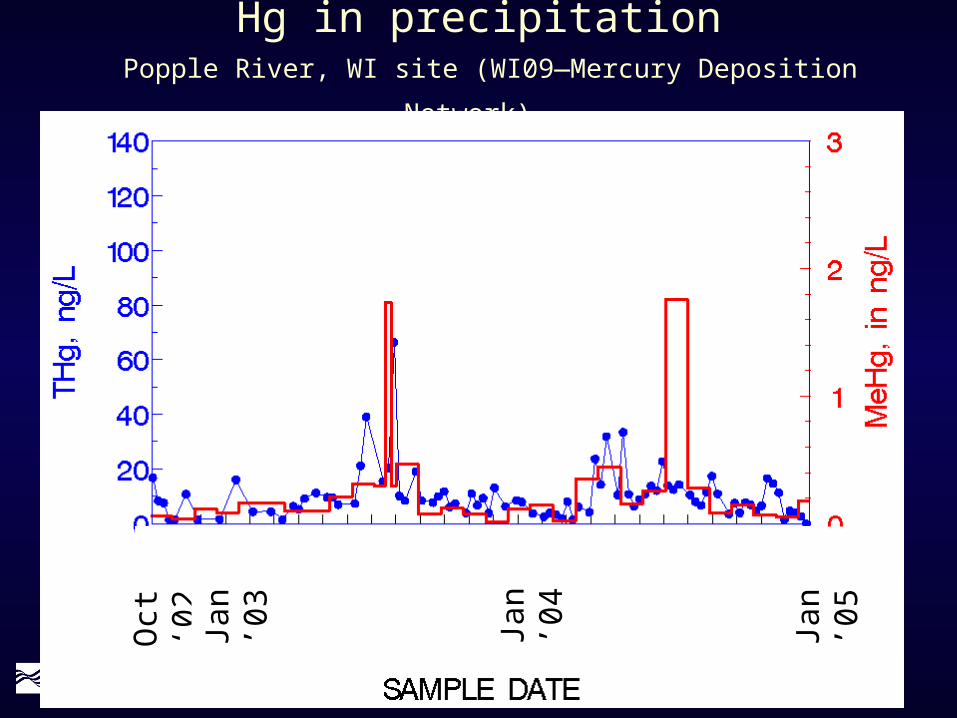
Precipitation and watershed influences
• Precipitation inputs– main source of THg to ecosystem– Could account for all MeHg in
some streams• Watershed inputs
– major vector for MeHg and THg delivery to streams, particularly in wetland-rich basins
Summary
Concentration relationships
• DOC and suspended sediment– Control THg & MeHg in streams
(MeHg picture is noisier)– key explanatory variables– perhaps a useful screening tool– Erosion control—useful to reduce
particulate Hg, and hence THg
Summary
Role of channel sediments
• MeHg source? – At most, a minor source of MeHg to
stream water– Low MeHg at low flow (evidence
against substantial inputs from sediments)…
– …except at one site (either sediment methylation or seasonally high MeHg from wetlands)
• MeHg sink? – Fast demethylation rates in sand, a
dominant substrate in some streams
Implications for monitoring THg & MeHg in streams
• Sample size (N)—depends on objectives…– BAF’s: Perhaps as few as N ≈ 6, well
spaced seasonally (see: Paller and others, 2004, Archives of Environ. Contam. & Toxicology)
– Concentration relationships & fluvial loads: N ≥ 35, well spaced seasonally and hydrologically
Acknowledgements
USGS: Dennis Wentz, Barb Scudder, Lia Chasar, Amanda Bell, Michelle Lutz, Dave Krabbenhoft, Mark Marvin-DiPasquale, George Aiken, Robin Stewart, Carol Kendall, Bill Orem, Rod DeWeese, Jeff Isely, and many others…
USGS: NAWQA and several other USGS programs
MDN site support: USGS, Wisconsin DNR, Oregen DEQ, Forest Service, US Fish & Wildlife Service, St. John’s River Water Management District (FL)