3.6.1 Initial and most recent geographical injection sites ..................... 20 3.6.2 History of injecting in geographical sites ..................................... 21 3.6.3 Frequency of use of geographical injection sites ........................ 22 3.6.4 Factors associated with injections in public locations ................. 23
4.0 DISCUSSION ......... ............................................................................. 25 4.1 Major Findings of the Study .................................................................. 25
4.2 Prevalence of use of physical injection sites......................................... 25 4.3 Risk perceptions of use of physical injection sites .............................. 27 4.4 Injection-related problems .................................................................... 28 4.5 Factors and harms associated with the use of multiple
injection sites ........ ............................................................................. 29 4.6 Prevalence of use of geographic injection sites .................................... 30 4.7 Factors and harms associated with frequent public injecting ................ 31 4.8 Summary and conclusions.................................................................... 32 5.0 REFERENCES ....... ............................................................................. 33
LOCATION OF TABLES AND FIGURES Table 1: Demographic characteristics ................................................................ 7 Table 2: Drug use history .................................................................................... 9 Table 3: Risk taking behaviours ........................................................................ 11 Table 4: History of injection-related problems ................................................... 12 Table 5: Sites of initial and most recent injection ............................................... 13 Table 6: Person who administered initial injection ............................................. 14 Table 7: History of physical injection sites ......................................................... 15 Table 8: Drugs injected in physical injection sites ............................................. 17 Table 9: Risk perceptions of physical injection sites .......................................... 18 Table 10: Linear regression predicting number of injection sites
ever used ............................................................................................. 20 Table 11: Geographical location of initial and most recent injection .................... 21 Table 12: History of injection in geographical sites .............................................. 22 Table 13: Frequency of use of geographical injection sites in
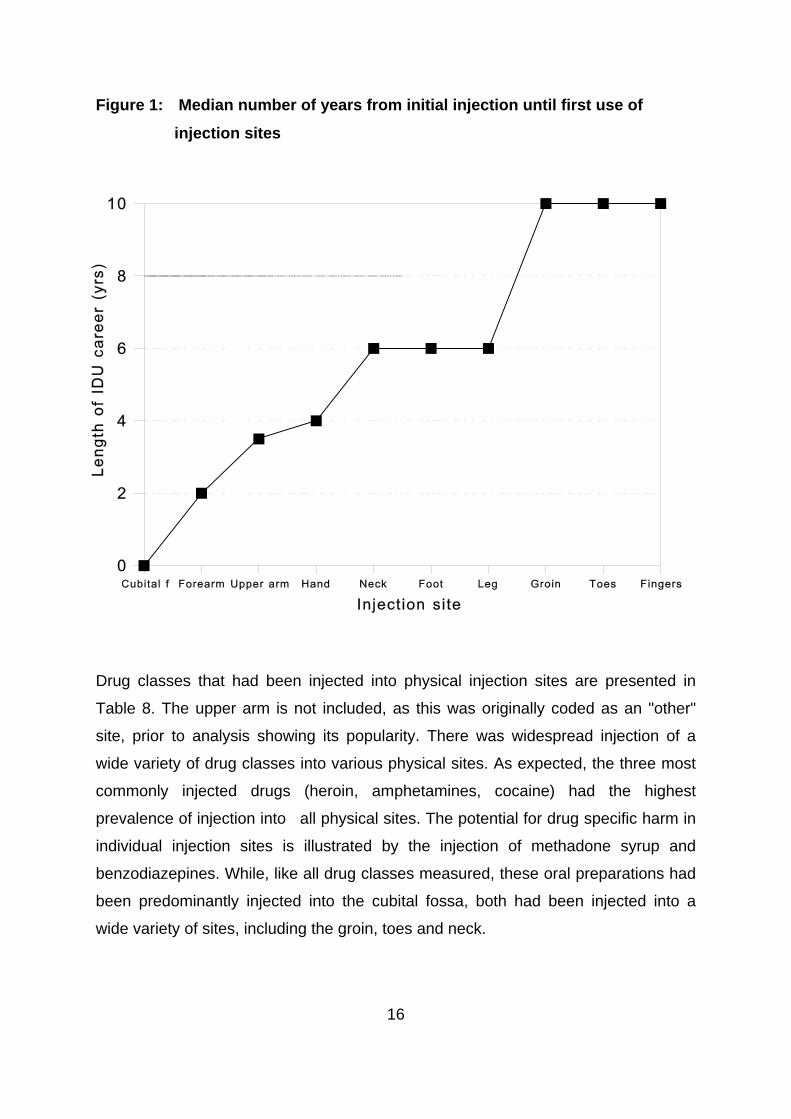
preceding six months ........................................................................... 23 Table 14: Logistic regression predicting frequent public injections ...................... 24 Figure 1: Median number of years from initial injection until
first use of injection sites ..................................................................... 16
ACKNOWLEDGMENTS
This research was funded by the Department of Health and Family Services. The
authors wish to thank the staff at the following organisations for their assistance: Pitt
St Centre, Resources and Education Program for Injecting Drug Users, We Help
Ourselves, Odyssey House, the Kirketon Road Centres and the Drug Intervention
Service Cabramatta. In particular, we wish to thank Ingrid van Beek, Julie Dixon, Sue
Heard, Lisa Maher, Rebecca McKetin, James Pitts and Garth Popple.
vi
EXECUTIVE SUMMARY
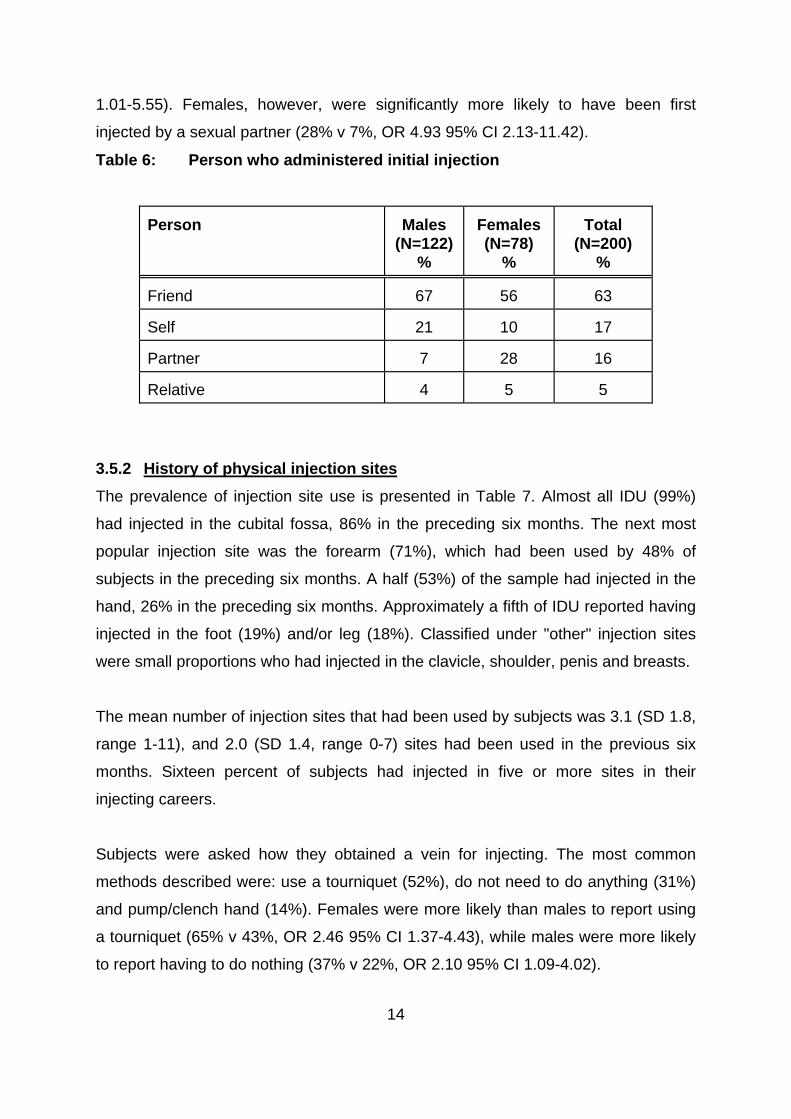
A sample of 200 injecting drug users were interviewed about their physical injection
sites (body parts) and the geographical locations in which they injected. The use of
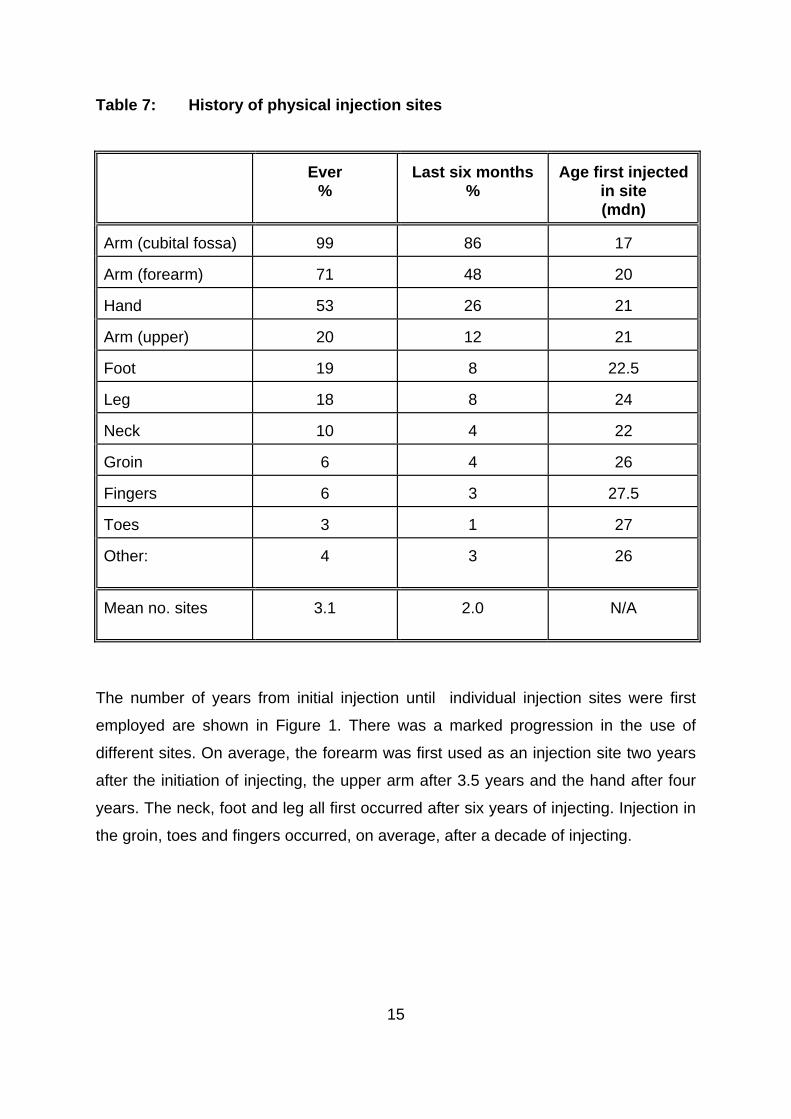
multiple physical injection sites was common. The mean number of injection sites
that had been used by subjects was 3.1, and 2.0 sites had been used in the previous
six months. Sixteen percent of subjects had injected in five or more sites. Almost all
(99%) had injected in the cubital fossa (crook of the arm). The next most popular site
was the forearm (71%). Other sites included the hand (53%), foot (19%), leg (18%),
neck (10%) and groin (6%). There was a clear progression in sites used, from the
cubital fossa at initial injection to the use of sites such as the groin after 10 years of
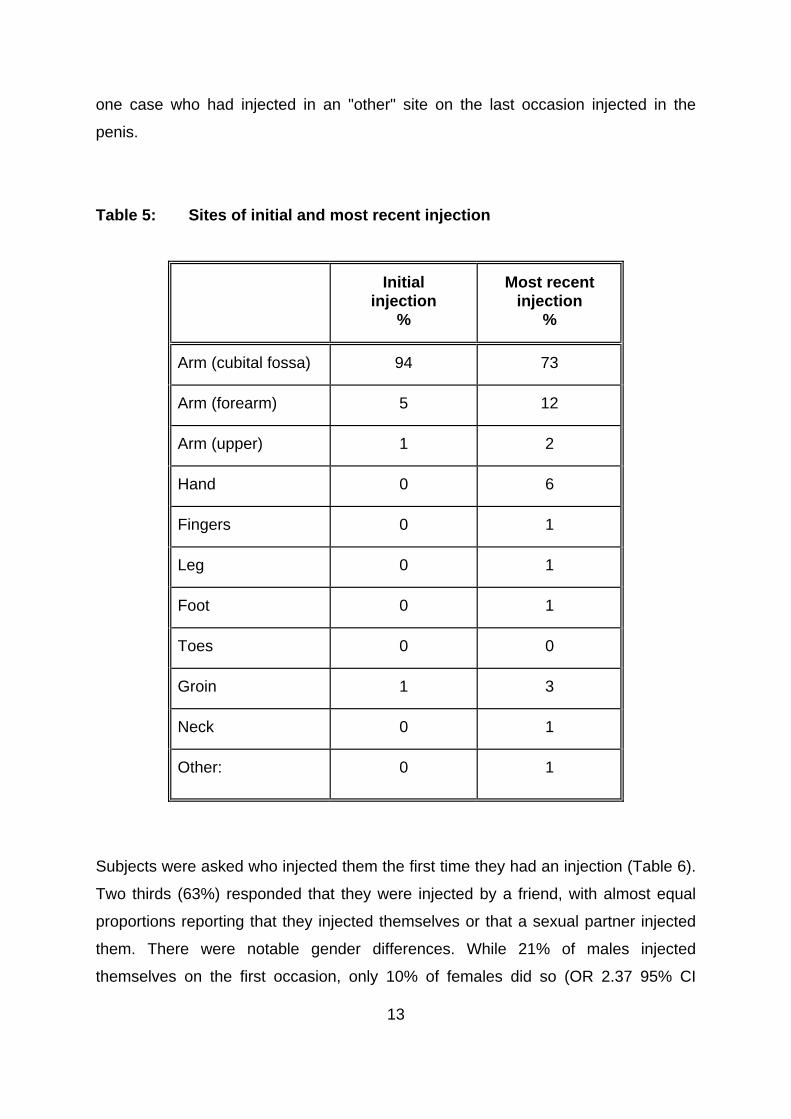
injecting. Compared to the initial injection, the most recent injection was significantly
more likely to be in a site other than the cubital fossa (27% v 6%).
more injection sites.
during the preceding six months.
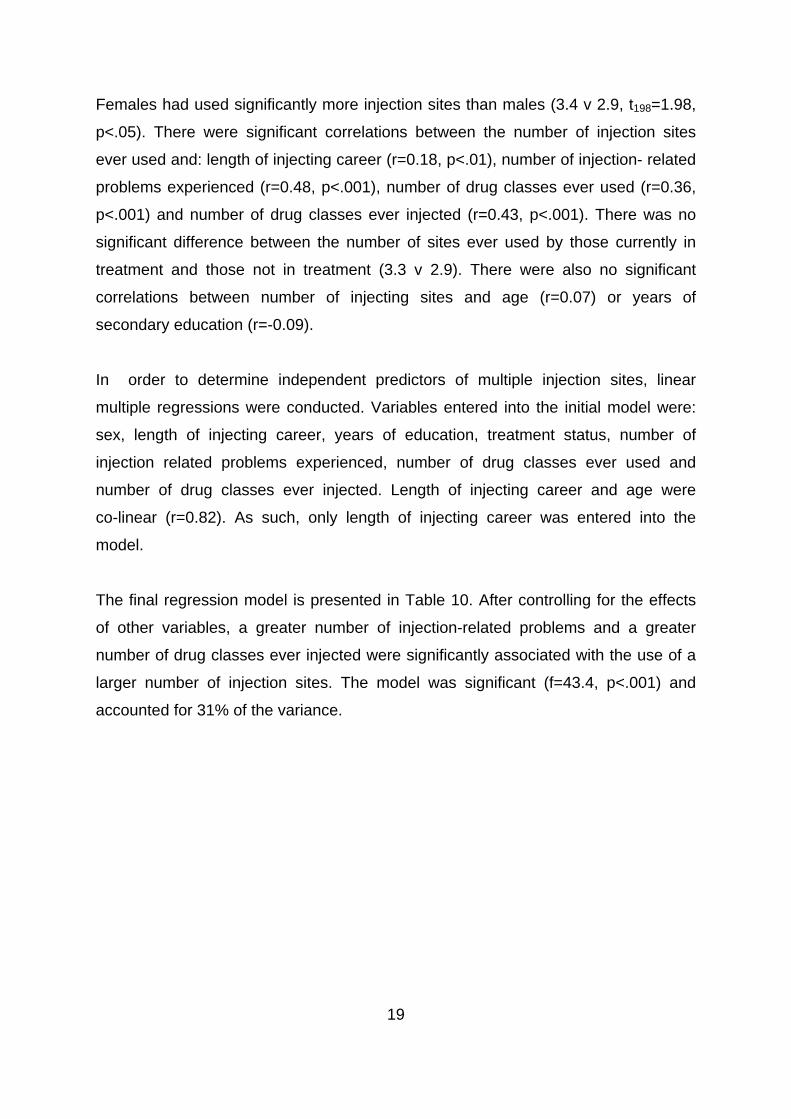
Females had used significantly more injection sites than males. There were
significant correlations between the number of injection sites ever used and: length
of injecting career, number of injection related problems experienced, number of
drug classes ever used and number of drug classes ever injected. Linear multiple
regressions revealed that a greater number of injection-related problems and a
greater number of drug classes ever injected were independently associated with the
use of
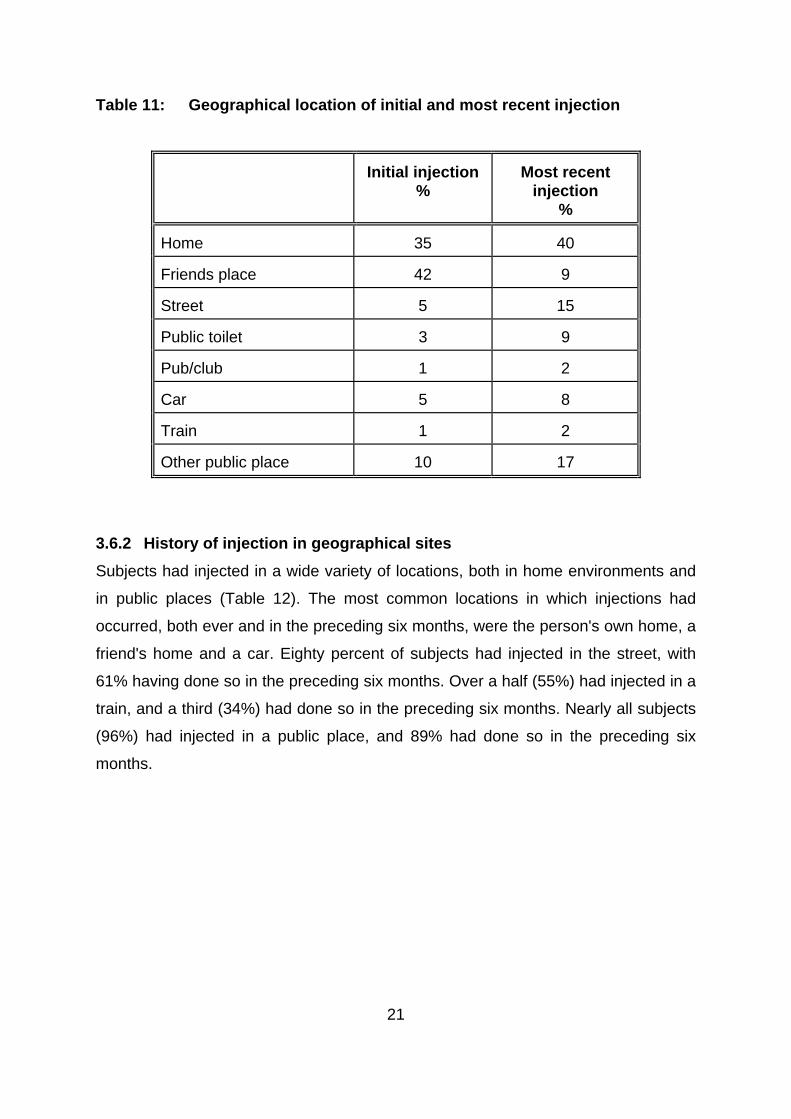
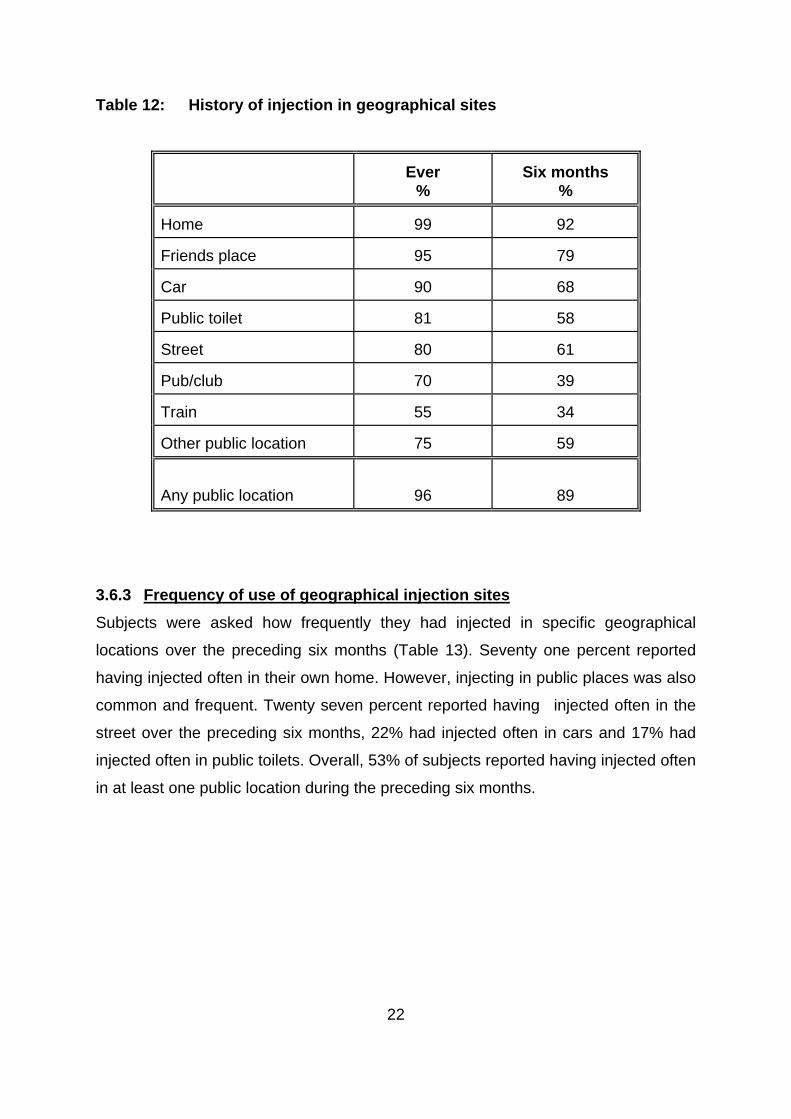
Nearly all subjects (96%) had injected in a public place, and 89% had done so in the
preceding six months. Large proportions had injected in all locations studied,
including cars (90%), public toilets (81%), the street (80%) and trains (55%).
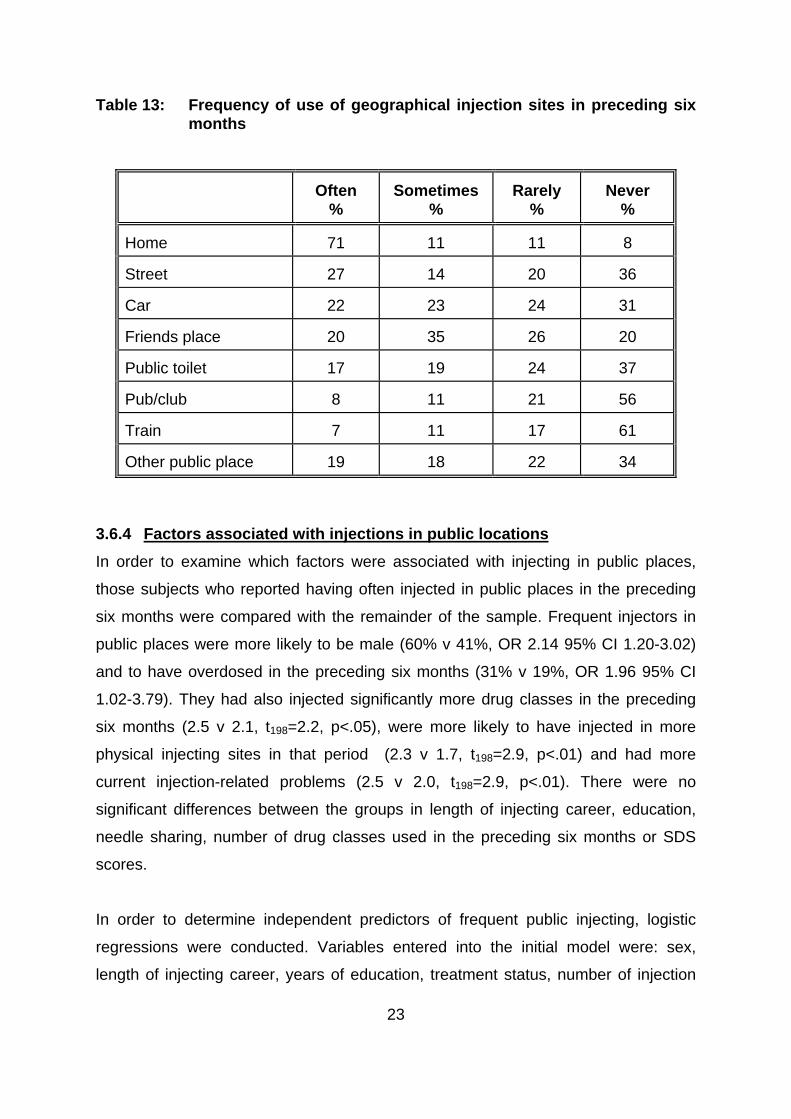
Injecting in public places also occurred frequently. Twenty seven percent had
injected often in the street over the preceding six months, 22% had injected often in
cars and 17% had injected often in public toilets. Overall, 53% of subjects had
injected often in at least one public location
vii
Frequent injectors in public places were more likely to be male, and to have
overdosed in the preceding six months. They had injected significantly more drug
classes in the preceding six months, had injected in more physical injecting sites in
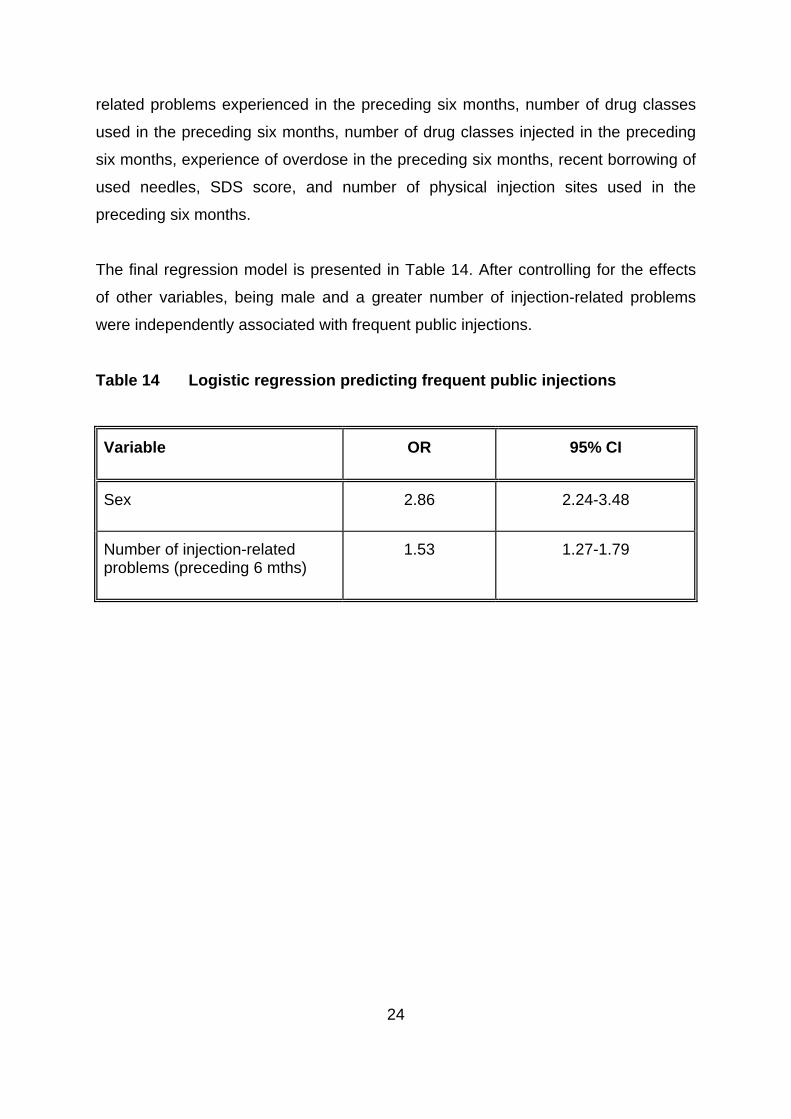
that period and had more current injection-related problems. Logistic regressions
indicated that, after controlling for the effects of other variables, being male and
having a greater number of injection-related problems were independently
associated with frequent public injections.
viii
1
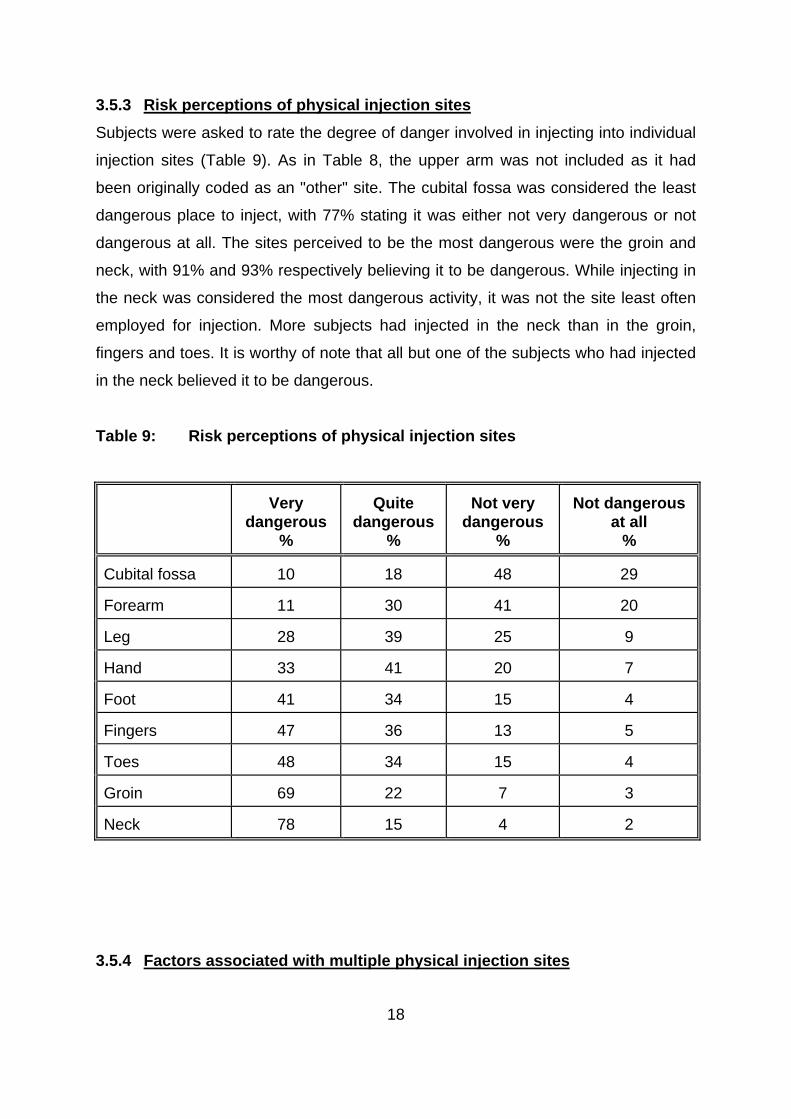
y more dangerous injection sites.
tions such as endocarditis.
1.0 INTRODUCTION
A great deal of research has been conducted in recent years on the injecting
risk-taking behaviours of injecting drug users (IDU). However, this research has
focussed almost exclusively upon the risk of blood borne transmission of HIV and
hepatitis through the sharing of injecting equipment. It has long been recognised,
however, that the act of injecting per se, however, carries health risks1-5. Frequent
injections may, for example, cause vascular damage, irrespective of "safe" injecting
practices. Damage to a favourite injection site may, in course, lead to the use of
other, potentiall
To the knowledge of the authors, only one study to date has examined the
prevalence of injection sites among IDU6. This British study reported widespread use
of a variety of sites. While almost all of these British IDU had injected in their arms
(99%), significant proportions had injected in legs (42%), feet (38%), groin (24%) and
necks (14%). Injection sites were distinguished by their age of first use, with a mean
age of 20 years for injection in the arm and 28 years for injection in the groin and
neck, suggesting a career in which the more obvious injection sites are used up.
While injecting in any site carries risks, the risk of injecting in sites such as the groin
and neck is substantially greater than in sites such as the cubital fossa (crook of the
arm). It is difficult for the person to see what they are doing in such sites, increasing
the risk damaging the vein or hitting an artery. As the veins in sites such as these are
substantially larger, any damage to them may result in serious circulatory problems
and an increased risk of life threatening infec
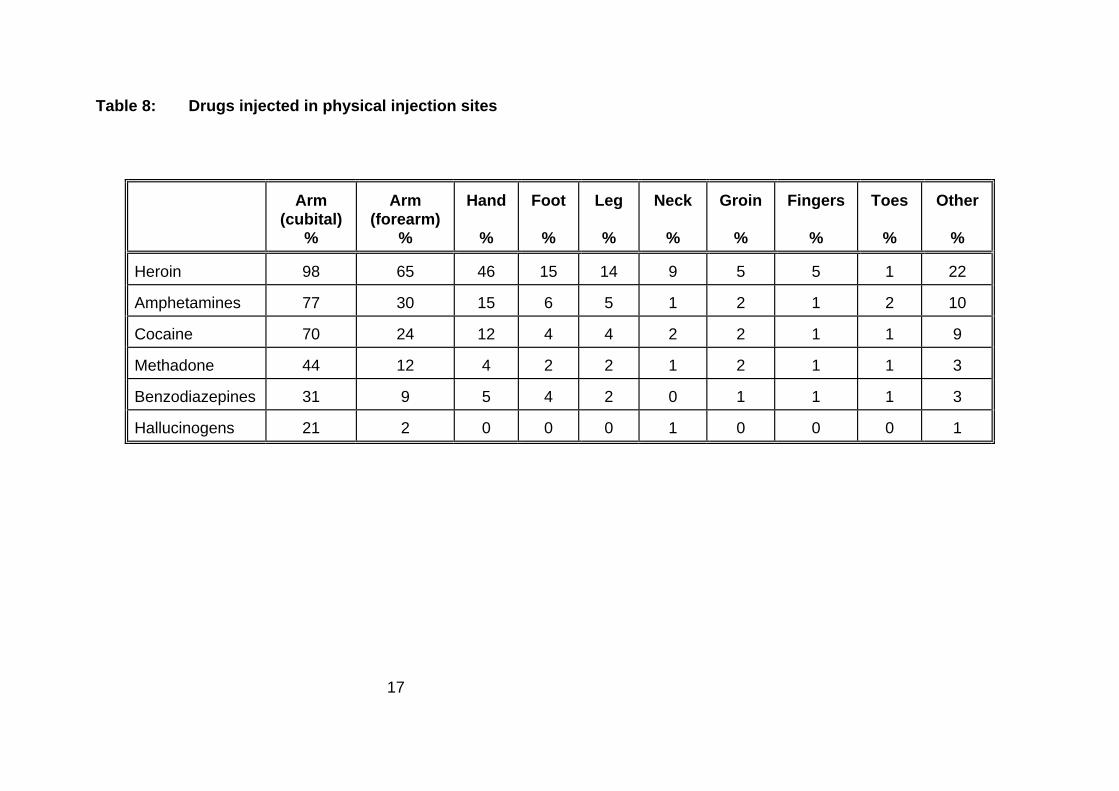
There are also clear health implications regarding the types of drugs injected into
injection sites. The injection of oral preparations such as benzodiazepines and
methadone syrup is common among IDU in Australia and elsewhere7-11, and has
serious health consequences. The injection of temazepam has been associated with
amputations and death11-13. The injection of methadone syrup, common in Sydney8,
has been associated with fistulas, abscesses/infections in injection sites and venous
thrombosis8,14.
2
ms, are
urrently unknown.
and associated harms, beyond
ose associated with the sharing of injecting equipment.
of a
follows
. To document the physical injection site histories of IDU, and associated
nt the geographical injection site histories of IDU, and associated
arms.
took place from February to September of 1999, by means of
An issue related to the physical injection site practices of IDU concerns the
geographical location of such injections. A recent British study reported a higher rate
of overdose among those IDU who injected in public places such as streets, parks
and toilets15. Street injectors also injected more frequently and had more vascular
problems than other IDU. In New South Wales between 1992 and 1996, a quarter of
heroin overdose deaths occurred in public places16. During this period, in the region
of Sydney with the largest street-based heroin market, 70% of deaths occurred in
public places17. The risk of overdose in public places may reflect a more dependent,
risky individual. Alternatively, factors such as more rapid injecting so as to avoid
detection, with a consequently larger bolus effect, may be implicated. The
geographical injecting practices of IDU in Australia, and associated har
c
Given the paucity of data on the physical and geographical injecting practices of IDU,
the current study examined these behaviours. The study aimed to provide a more
complete picture of the injecting practices of IDU
th
1.1 Study Aims
The study aimed to examine the physical and geographical injecting sites
sample of Sydney injecting drug users. Specifically, the aims of the study were as
:
1
factors and harms;
2. To docume
factors and h
2.0 METHOD
2.1 Procedure
All respondents were volunteers who were paid A$20 for their participation in the
study. Recruitment
3
rs, either by telephone or in person, and were
creened for eligibility to be interviewed for the study. To be eligible for the study
at
ny information they provided would be kept strictly confidential and anonymous.
tered a structured interview that took between 30 and 45
e conducted by one of the research team.
mographic characteristics
advertisements placed in treatment agencies, rock magazines, needle exchanges
and by word of mouth.
Respondents contacted the researche
s
respondents must have injected a drug at least six times in the preceding six months
or be in treatment for drug dependence.
All respondents were guaranteed, both at the time of screening and interview, th
a
Respondents were adminis
minutes to complete. All interviews wer
2.2 Structured Interview
2.2.1 De
emographic details obtained included: gender, age, suburb of residence, level of
education, employment status, drug treatment history and
D
high school and tertiary
prison record.
2.2.2 Drug use history
In order to gain an indication of drug use history, respondents were asked which
drug classes they had ever used, which ones they had ever injected, and which ones
they had injected in the last 6 months. An estimation of how many days they had
used each of the drug classes during the 6 months preceding interview was also
ought. Further questions were asked about the first drug ever injected and their age
. Heroin dependence was measured by the Severity of
s
when they first injected
Dependence Scale (SDS)18.
2.2.3 Risk behaviours
The needle risk component of the Opiate Treatment Index (OTI)19 was used in
assessing injecting behaviours in the month preceding interview that placed
respondents at risk of either contracting or transmitting blood borne viruses.
4
e they had last overdosed and whether they had ever been
dministered naloxone.
Those subjects who had ever used heroin were asked how many times they had
overdosed, how long sinc
a
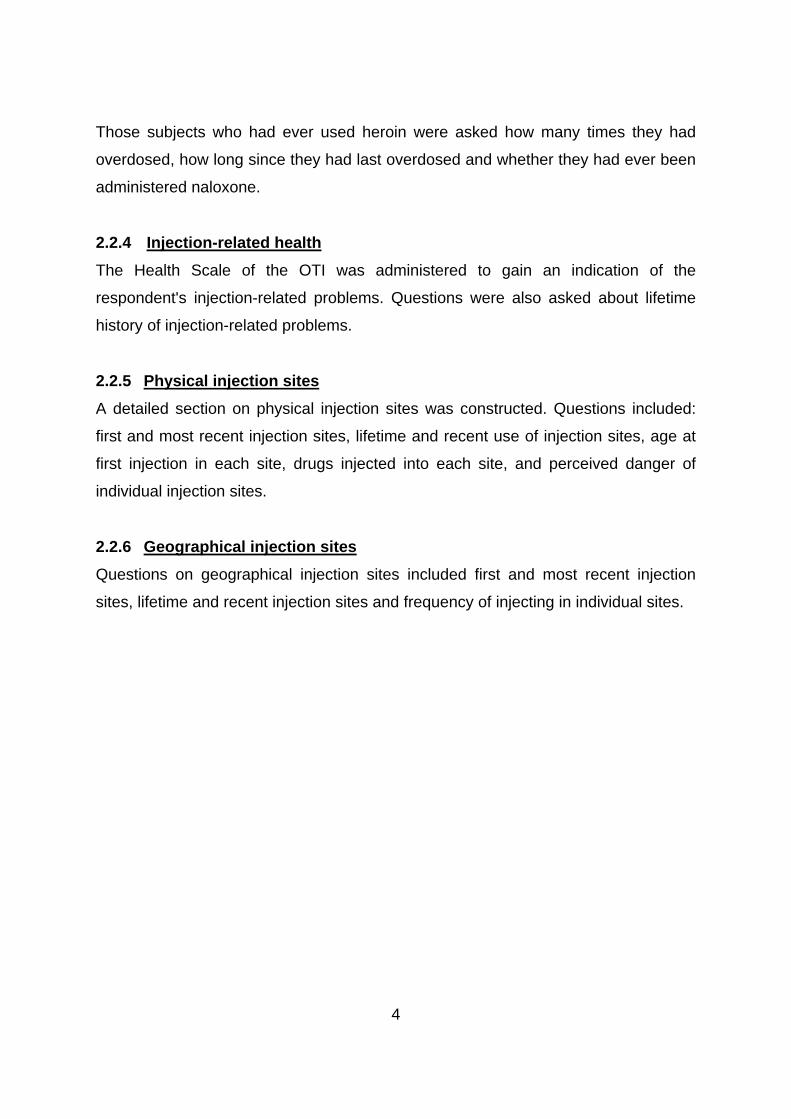
2.2.4 Injection-related health
The Health Scale of the OTI was administered to gain an indication of the
respondent's injection-related problems. Questions were also asked about lifetime
istory of injection-related problems. h
2.2.5 Physical injection sites
A detailed section on physical injection sites was constructed. Questions included:
first and most recent injection sites, lifetime and recent use of injection sites, age at
first injection in each site, drugs injected into each site, and perceived danger of
dividual injection sites. in
2.2.6 Geographical injection sites
Questions on geographical injection sites included first and most recent injection
ites, lifetime and recent injection sites and frequency of injecting in individual sites.
s
5
ion 6.1.4)20.
2.3 Statistical Analyses
T-tests were used for continuous data. Where distributions were highly skewed,
medians were reported. For dichotomous categorical variables, Odds Ratios (OR)
and 95% Confidence Intervals (95% CI) were reported. In order to determine factors
associated with multiple physical injection sites, simultaneous multiple regressions
were conducted. Logistic regressions were performed to determine factors
associated with injecting in public places. All analyses were conducted using SPSS
for Windows (vers
6
.
n full-time employment.
e 15-250).
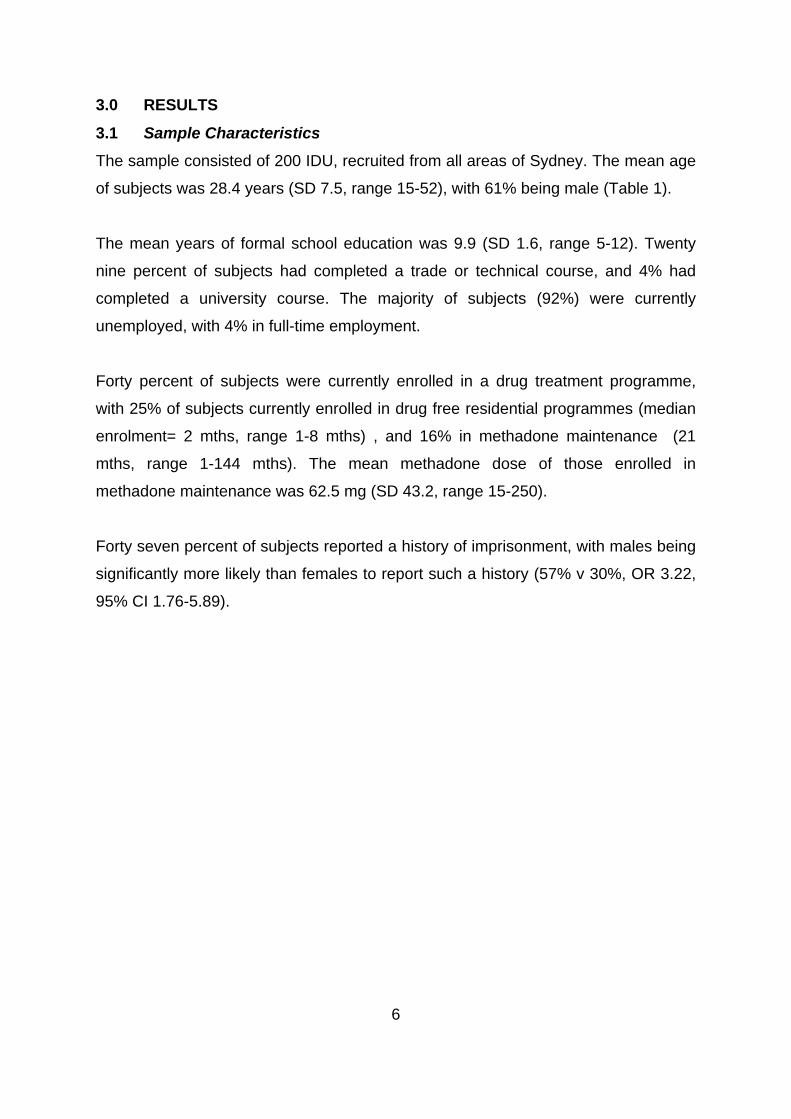
3.0 RESULTS
3.1 Sample Characteristics
The sample consisted of 200 IDU, recruited from all areas of Sydney. The mean age
of subjects was 28.4 years (SD 7.5, range 15-52), with 61% being male (Table 1)
The mean years of formal school education was 9.9 (SD 1.6, range 5-12). Twenty
nine percent of subjects had completed a trade or technical course, and 4% had
completed a university course. The majority of subjects (92%) were currently
unemployed, with 4% i
Forty percent of subjects were currently enrolled in a drug treatment programme,
with 25% of subjects currently enrolled in drug free residential programmes (median
enrolment= 2 mths, range 1-8 mths) , and 16% in methadone maintenance (21
mths, range 1-144 mths). The mean methadone dose of those enrolled in
methadone maintenance was 62.5 mg (SD 43.2, rang
Forty seven percent of subjects reported a history of imprisonment, with males being
significantly more likely than females to report such a history (57% v 30%, OR 3.22,
95% CI 1.76-5.89).
7
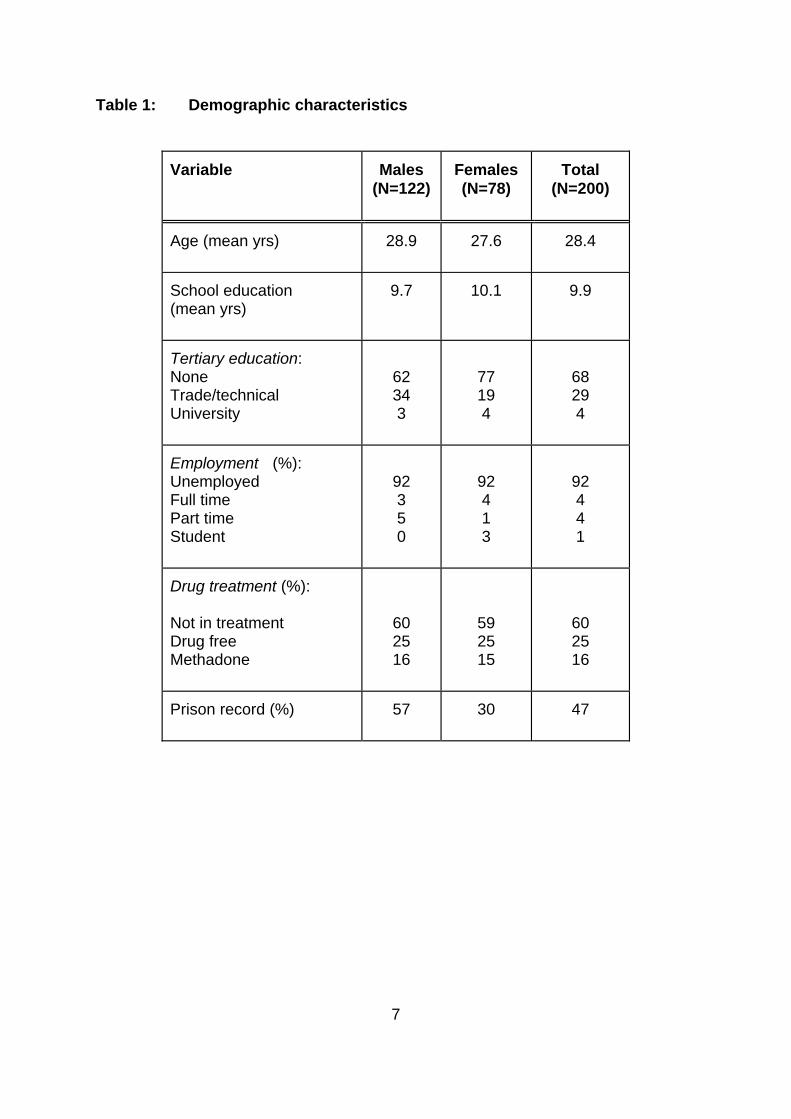
Table 1: Demographic characteristics
Variable Males
(N=122) Females (N=78)
Total (N=200)
Age (mean yrs)
28.9 27.6 28.4
School education (mean yrs)
9.7 10.1 9.9
Tertiary education: None Trade/technical University
62 34 3
77 19 4
68 29 4
Employment (%): Unemployed Full time Part time Student
92 3 5 0
92 4 1 3
92 4 4 1
Drug treatment (%): Not in treatment Drug free Methadone
60 25 16
59 25 15
60 25 16
Prison record (%)
57 30 47
8
caine.
six months.
(46%).
5).
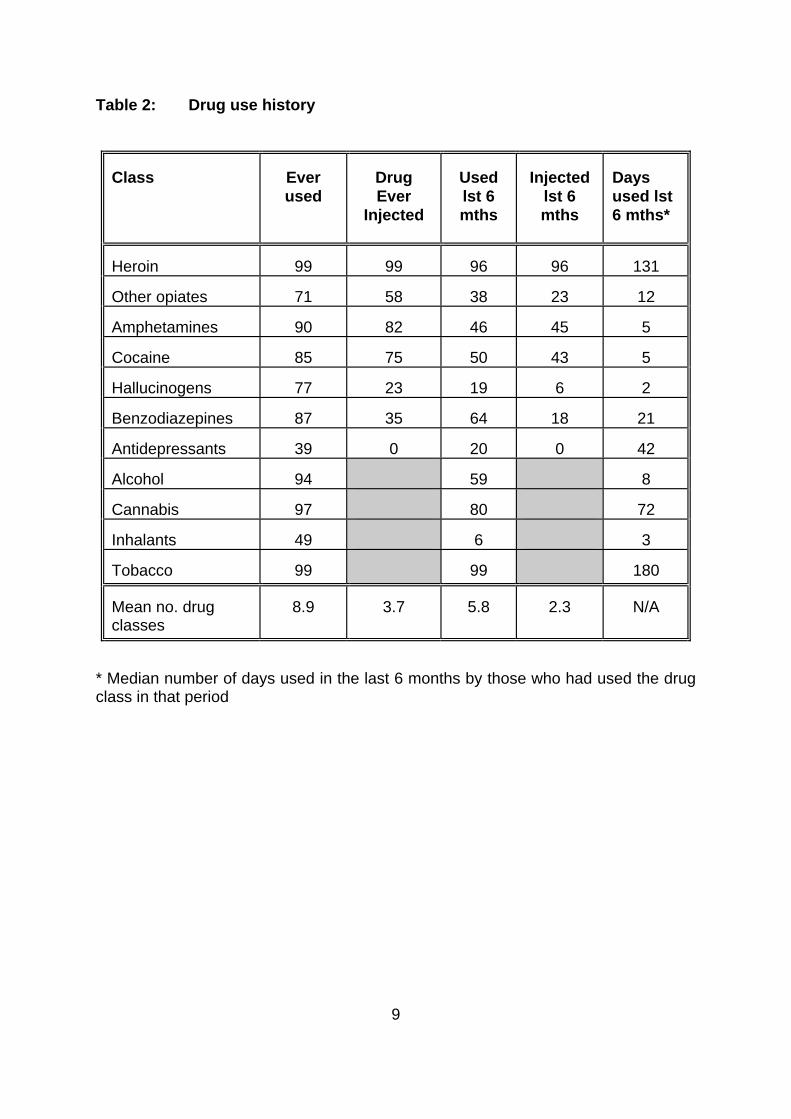
3.2 Drug Use History
The mean age of first injection was 18.2 yrs (SD 4.3, range 11-46). Heroin was the
drug first injected by 51% of subjects, with 43% having first injected amphetamines,
and 3% co
The sample engaged in a wide variety of polydrug use (Table 2). The mean number
of drug classes ever used was 8.9 (SD 1.9, range 2-11), with 5.8 (SD 2.1, range
1-10) classes having been used in the preceding six months. A mean of 3.7 (SD 1.4,
range 1-6) classes had ever been injected, with 2.3 (SD 1.2, range 0-5) classes
having been injected in the preceding
The most commonly used drug classes over the preceding six months were tobacco


![injecting [ 2 ] › pdf › HRDVD5.pdf · when you stop injecting, things seldom return to normal. The information in this booklet aims to reduce the harms of injecting by helping](https://static.documents.pub/doc/80x56/5f0c9cd87e708231d4364591/injecting-2-a-pdf-a-hrdvd5pdf-when-you-stop-injecting-things-seldom.jpg)


