84
i Physical and Mental Health Condition Prevalence and Comorbidity among Fee-for-Service Medicare- Medicaid Enrollees Centers for Medicare & Medicaid Services September, 2014
| Date post: | 14-Aug-2018 |
| Category: |
Documents |
| Upload: | vuongkhanh |
| View: | 214 times |
| Download: | 0 times |
i
Physical and Mental Health Condition Prevalence and Comorbidity among Fee-for-Service Medicare-Medicaid Enrollees Centers for Medicare & Medicaid Services
September, 2014

ii
Executive Summary
Introduction
This study provides a descriptive view of diagnosed physical and mental health condition prevalence and comorbidity rates among fee-for-service (FFS) Medicare-Medicaid dually enrolled beneficiaries, overall, as well as by different enrollee subpopulations and by state.
Our total study population included 5.3 million individuals who were simultaneously enrolled in Medicare and Medicaid at any given point in time in 2008. In order to ensure the most accurate findings, the study population was limited to Medicare-Medicaid enrollees with a minimum of six or more months of Medicare (Parts A and B) or Medicaid fee-for-service enrollment during calendar year 2008 (CY 2008). Individuals enrolled in either a Medicare managed care plan or a Medicaid comprehensive risk-based or behavioral health managed care program at any time during CY 2008 were excluded from the study population.
We obtained the physical and mental health condition indicators, which are derived from Medicare and Medicaid claims data, from the 2008 Medicare-Medicaid Linked Enrollee Analytic Data Source (MMLEADS) that is a component of the CMS Chronic Condition Warehouse (CCW).
Key Findings
Among our FFS Medicare-Medicaid enrollee study population, 60% had diagnoses across at least three of the physical and mental health categorical condition groups included in our study. A full quarter had diagnoses spanning five or more condition groups. Three quarters of our study population had at least one heart-related condition diagnosis. Almost one half (41%) had one or more mental health condition (excluding substance use disorders1).
In our subgroup analyses, we generally found the highest condition prevalence among those with one or more stays in a LTC facility. This was especially true for depressive disorders for which we found that the prevalence was roughly double the prevalence of those with no nursing home stay in the same year. The prevalence of reported depression was also found to escalate fairly sharply within the first few months of beneficiaries’ time in a nursing home.
In this study, we found Medicare-Medicaid enrollees’ total health care expenditures in 2008 to increase sharply with number of co-occurring conditions in the same year. Relative to those beneficiaries with no physical or mental health condition on record in the same year, who incurred $875 per member per month (PMPM) on average, those with diagnoses across two comorbid condition groups incurred an average of $1,628 PMPM; those with five or more comorbid condition groups incurred an average of $3,940 PMPM in Medicare and Medicaid expenditures.
1 Alcohol and drug abuse and dependence disorders were not included in this study due to the fact that they were not available as CCW variables at the time of this study.
iii
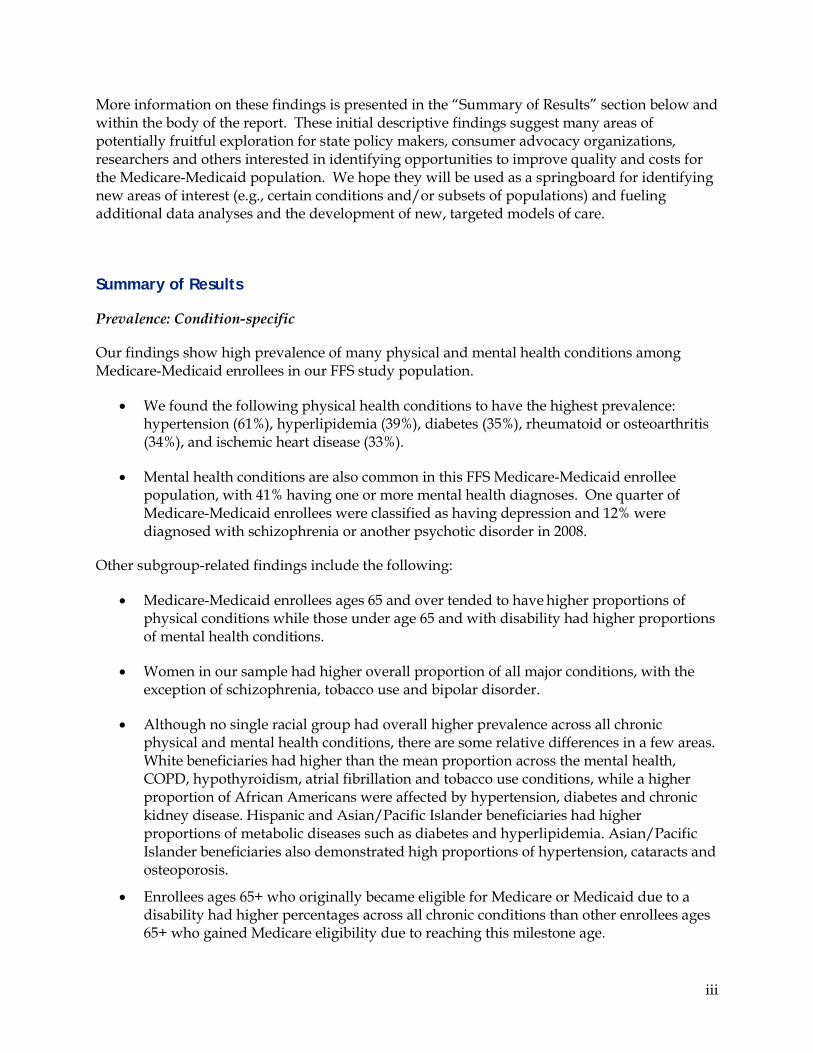
More information on these findings is presented in the “Summary of Results” section below and within the body of the report. These initial descriptive findings suggest many areas of potentially fruitful exploration for state policy makers, consumer advocacy organizations, researchers and others interested in identifying opportunities to improve quality and costs for the Medicare-Medicaid population. We hope they will be used as a springboard for identifying new areas of interest (e.g., certain conditions and/or subsets of populations) and fueling additional data analyses and the development of new, targeted models of care.
Summary of Results
Prevalence: Condition-specific
Our findings show high prevalence of many physical and mental health conditions among Medicare-Medicaid enrollees in our FFS study population.
• We found the following physical health conditions to have the highest prevalence: hypertension (61%), hyperlipidemia (39%), diabetes (35%), rheumatoid or osteoarthritis (34%), and ischemic heart disease (33%).
• Mental health conditions are also common in this FFS Medicare-Medicaid enrollee population, with 41% having one or more mental health diagnoses. One quarter of Medicare-Medicaid enrollees were classified as having depression and 12% were diagnosed with schizophrenia or another psychotic disorder in 2008.
Other subgroup-related findings include the following:
• Medicare-Medicaid enrollees ages 65 and over tended to have higher proportions of physical conditions while those under age 65 and with disability had higher proportions of mental health conditions.
• Women in our sample had higher overall proportion of all major conditions, with the exception of schizophrenia, tobacco use and bipolar disorder.
• Although no single racial group had overall higher prevalence across all chronic physical and mental health conditions, there are some relative differences in a few areas. White beneficiaries had higher than the mean proportion across the mental health, COPD, hypothyroidism, atrial fibrillation and tobacco use conditions, while a higher proportion of African Americans were affected by hypertension, diabetes and chronic kidney disease. Hispanic and Asian/Pacific Islander beneficiaries had higher proportions of metabolic diseases such as diabetes and hyperlipidemia. Asian/Pacific Islander beneficiaries also demonstrated high proportions of hypertension, cataracts and osteoporosis.
• Enrollees ages 65+ who originally became eligible for Medicare or Medicaid due to a disability had higher percentages across all chronic conditions than other enrollees ages 65+ who gained Medicare eligibility due to reaching this milestone age.
iv
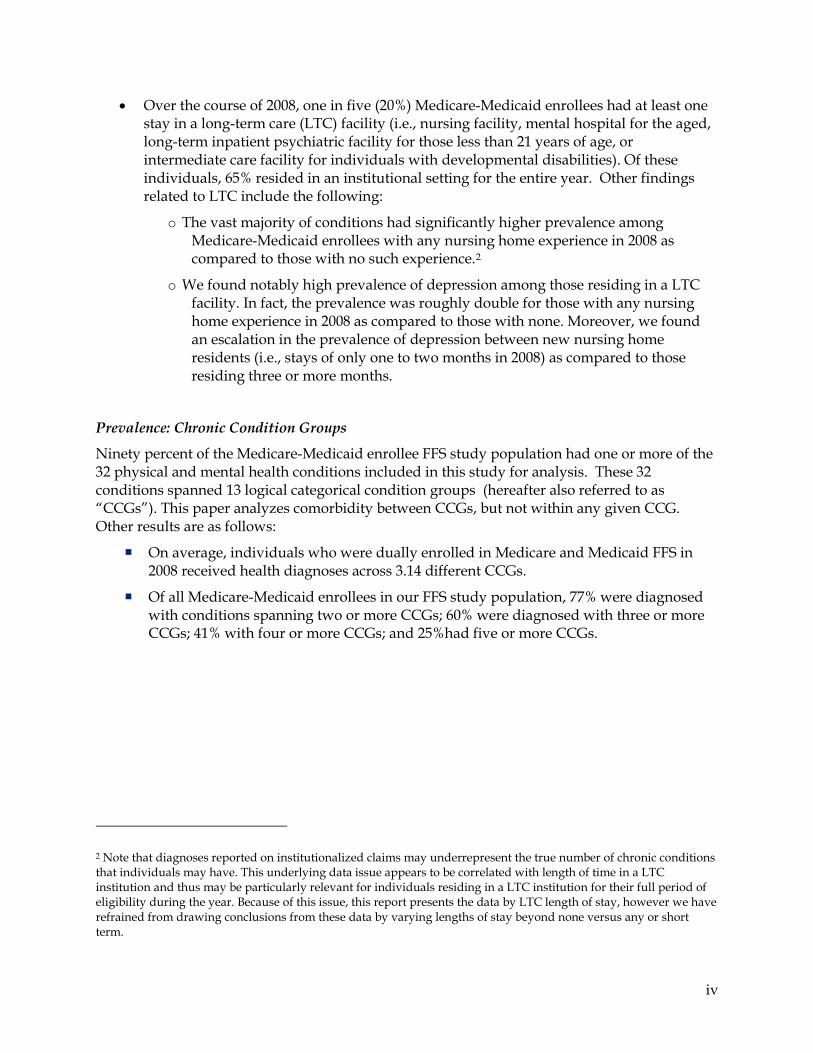
• Over the course of 2008, one in five (20%) Medicare-Medicaid enrollees had at least one stay in a long-term care (LTC) facility (i.e., nursing facility, mental hospital for the aged, long-term inpatient psychiatric facility for those less than 21 years of age, or intermediate care facility for individuals with developmental disabilities). Of these individuals, 65% resided in an institutional setting for the entire year. Other findings related to LTC include the following:
o The vast majority of conditions had significantly higher prevalence among Medicare-Medicaid enrollees with any nursing home experience in 2008 as compared to those with no such experience.2
o We found notably high prevalence of depression among those residing in a LTC facility. In fact, the prevalence was roughly double for those with any nursing home experience in 2008 as compared to those with none. Moreover, we found an escalation in the prevalence of depression between new nursing home residents (i.e., stays of only one to two months in 2008) as compared to those residing three or more months.
Prevalence: Chronic Condition Groups
Ninety percent of the Medicare-Medicaid enrollee FFS study population had one or more of the 32 physical and mental health conditions included in this study for analysis. These 32 conditions spanned 13 logical categorical condition groups (hereafter also referred to as “CCGs”). This paper analyzes comorbidity between CCGs, but not within any given CCG. Other results are as follows:
On average, individuals who were dually enrolled in Medicare and Medicaid FFS in 2008 received health diagnoses across 3.14 different CCGs.
Of all Medicare-Medicaid enrollees in our FFS study population, 77% were diagnosed with conditions spanning two or more CCGs; 60% were diagnosed with three or more CCGs; 41% with four or more CCGs; and 25%had five or more CCGs.
2 Note that diagnoses reported on institutionalized claims may underrepresent the true number of chronic conditions that individuals may have. This underlying data issue appears to be correlated with length of time in a LTC institution and thus may be particularly relevant for individuals residing in a LTC institution for their full period of eligibility during the year. Because of this issue, this report presents the data by LTC length of stay, however we have refrained from drawing conclusions from these data by varying lengths of stay beyond none versus any or short term.

v
Percentage of Medicare-Medicaid Enrollees with 0 to 4+ Categorical Condition Groups
Source: CY 2008 CCW Medicare and Medicaid data, FFS enrollees with at least six months enrollment in Medicare Parts A and B and/or Medicaid.
Affecting almost three quarters (72%) of the Medicare-Medicaid enrollee population, heart conditions were the most common of all CCGs.
The second most prevalent CCG was the category of mental health conditions, affecting close to one half (41%) of FFS Medicare-Medicaid enrollees3.
Other highly prevalent condition groups include the musculoskeletal disorders of osteoporosis, rheumatoid arthritis and osteoarthritis (37%), diabetes mellitus (35%) and anemia (31%).
Beneficiaries in LTC facilities, older enrollees, female enrollees and Full Benefit enrollees had a higher prevalence of comorbid CCGs. Specifically,
o Between 65-80% of Medicare-Medicaid enrollees residing in a LTC facility for any length of time had 4+ comorbid CCGs, compared to only 34% of those with no LTC experience in the year.
o 49% of Medicare-Medicaid enrollees ages 65 and older had 4+ comorbid CCGs, compared to 30% of those under age 65. Moreover, a direct relationship was found with increasing age, with 57% of those ages 85 and older having 4+ comorbid CCGs.
o 46% of females, compared to 33% of males, had 4+ comorbid CCGs.
o 45% of Asian/Pacific Islander beneficiaries had two or three comorbid CCGs compared to other race groups (ranging 35-37%).
o 44% of Full Benefit enrollees had diagnoses spanning four or more CCGs, compared to 35% of QMB-only and 32% of other Partial Benefit enrollees.
3 The mental health category did not include alcohol and drug abuse and dependence because these flags were not available at the time this report was developed.
10%
13%
17%
19%
41%
0
1
2
3
4+

vi
Comorbidity: Chronic Condition Groups
Similar to the CCG prevalence rates noted above, the five most common comorbid condition groups in our FFS study population were the following: heart conditions, mental health conditions, anemia, musculoskeletal disorders and diabetes. Specifically:
o The heart conditions category was the most highly co-occurring condition group; more than two-thirds of enrollees with any other studied condition also were found to have one or more of the studied heart conditions; and
o Mental health conditions constituted the second most frequently co-occurring condition group, affecting more than half of all individuals with recorded tobacco use, hip or pelvic fracture, metabolic disorder, stroke or lung disease. In addition, mental health conditions co-occurred in no less than 39% of all Medicare-Medicaid enrollees in our sample, across all other CCGs studied.
The data indicate that as comorbidity increases, the costs of care increase as well. More specifically, our analysis of combined Medicare and Medicaid per member per month (PMPM) expenditures demonstrated that costs increase sharply with comorbidity. Costs roughly double between individuals with no physical or mental health condition ($875) and those with two comorbid condition groups ($1,628) and once again roughly double when individuals reach five comorbid CCGs ($3,940).

vii
Table of Contents
Executive Summary ..................................................................................................................................ii
Table of Contents ................................................................................................................................... vii
Table of Tables and Figures ................................................................................................................ viii
Introduction ............................................................................................................................................... 1
Findings ...................................................................................................................................................... 3
A. Condition-specific Prevalence .................................................................................................. 3 1. Condition Prevalence among Medicare-Medicaid Enrollees, Overall ..................... 3 2. Condition-specific Prevalence by Subpopulations .................................................... 5 3. Condition-specific Prevalence by Multidimensional Subpopulations .................... 15 4. State-specific Prevalence ................................................................................................. 20
B. Comorbidity .............................................................................................................................. 23 1. Categorical Condition Groups ....................................................................................... 23 2. Comorbidity across Categorical Condition Groups, Overall .................................... 23 3. Per Member per Month (PMPM) Expenditures by Number of Comorbid CCGs.. 25 4. Comorbidity, by Subpopulations .................................................................................. 26 5. Prevalence of Specific Pairs of Comorbid Conditions ................................................ 31
Conclusion and Next Steps ................................................................................................................... 33
Appendix A: Methodology .................................................................................................................... 34
A. Study population ...................................................................................................................... 34 B. Data Sources .............................................................................................................................. 35 C. Enrollee Dimensions ................................................................................................................ 35 D. Data Preparation Procedures .................................................................................................. 37 E. From Conditions to Comorbidity........................................................................................... 38
Appendix B: Study population ............................................................................................................. 39
A. Comparison of Study Population to Total Medicare-Medicaid Enrollee Population .... 39 B. Study Population Inclusion/Exclusion Criteria .................................................................. 45
Appendix C: Enrollee Characteristics and Definitions ................................................................... 51
Appendix D: Supplemental Tables for CCW Conditions ............................................................... 55
Appendix E: National Supplemental Tables and Figures ............................................................... 57
Appendix F: State Supplemental Tables and Figures ...................................................................... 60
Appendix G: Acronym List ................................................................................................................... 74

viii
Table of Tables and Figures
Table 1: CCW Condition Counts and Proportions among FFS Medicare-Medicaid enrollees, CY 2008 ................................................................................................................................................ 4
Table 2: CCW Condition Prevalence by Age, Top 25 Conditions, among FFS Medicare-Medicaid enrollees, CY 2008 ........................................................................................................... 5
Table 3: CCW Condition Prevalence by Sex, Top 25 Conditions, among FFS Medicare-Medicaid enrollees, CY 2008 ........................................................................................................... 6
Table 4: CCW Condition Prevalence by Race, Top 25 Conditions, among FFS Medicare-Medicaid enrollees, CY 2008 ........................................................................................................... 8
Table 5: CCW Condition Prevalence by Length of Institutional Long Term Care, Top 25 Conditions, among FFS Medicare-Medicaid enrollees, CY 2008 ............................................. 9
Table 6: CCW Condition Prevalence by Medicare-Medicaid Eligibility, Top 25 Conditions, among FFS Medicare-Medicaid enrollees, CY 2008 .................................................................. 11
Table 7: CCW Condition Prevalence by Original Reason for Medicare Eligibility, Top 25 Conditions, among FFS Medicare-Medicaid enrollees, CY 2008 ........................................... 12
Table 8: CCW Condition Prevalence by Medicaid Basis of Eligibility, Top 25 Conditions, among FFS Medicare-Medicaid enrollees, CY 2008 .................................................................. 14
Table 9: CCW Condition Prevalence by Age and Sex (multidimensional), Top 25 Conditions, among FFS Medicare-Medicaid enrollees, CY 2008 .................................................................. 15
Table 10: CCW Condition Prevalence by Age and Race, Top 25 Conditions, among FFS Medicare-Medicaid enrollees, CY 2008 ....................................................................................... 16
Table 11: CCW Condition Prevalence by Age and Institutional Status, Top 25 Conditions, among FFS Medicare-Medicaid enrollees, CY 2008 .................................................................. 18
Table 12: CCW Condition Prevalence by Age and Original Reason for Medicare Eligibility, Top 25 Conditions, among FFS Medicare-Medicaid enrollees, CY 2008 .............................. 19
Table 13: Chronic Condition Prevalence by State, Top 25 Conditions, among FFS Medicare-Medicaid enrollees, CY 2008 ......................................................................................................... 21
Table 15: Categorical Condition Group Prevalence, Chronic Condition Warehouse Indicators, CY 2008 .............................................................................................................................................. 23
Table 16: Percentage of Medicare-Medicaid Enrollees with 0 to 4+ Categorical Condition Groups, CY 2008 .............................................................................................................................. 24
Figure 1a: Percentage of Medicare-Medicaid Enrollees with 0 to 4+ Categorical Condition Groups, CY 2008 .............................................................................................................................. 24
Figure 1b: Percentage of Individuals with 1+ to 7+ Categorical Condition Groups, CY 2008 . 24
Table 24: Per Member per Month (PMPM) Cost by Number of Categorical Condition Groups, CY 2008 .............................................................................................................................................. 25
Figure 5: Total per Member per Month (PMPM) Cost by Number of Categorical Condition Groups, CY 2008 .............................................................................................................................. 26

ix
Table 17: Percentage of Individuals with 0 to 4+ Categorical Condition Groups, by Race, CY 2008 ..................................................................................................................................................... 27
Table 18: Percentage of Individuals with 0 to 4+ Categorical Condition Groups , by Age, CY 2008 ..................................................................................................................................................... 27
Table 19: Percentage of Individuals with 0 to 4+ Categorical Condition Groups, by Sex, CY 2008 ..................................................................................................................................................... 28
Figure 2: Percentage of Individuals by Number of Categorical Condition Groups, by Sex, CY 2008 ..................................................................................................................................................... 28
Table 20: Percentage of Individuals with 0 to 4+ Categorical Condition Groups, by Long-Term Care Status, CY 2008 ............................................................................................................. 29
Table 21: Percentage of Individuals with 0 to 4+ Categorical Condition Groups, by Original Reason for Medicare Entitlement, CY 2008 ................................................................................ 29
Table 22: Percentage of Individuals with 0 to 4+ Categorical Condition Groups, by Medicaid Basis of Eligibility Status, CY 2008 .............................................................................................. 30
Table 23: Percentage of Individuals with 0 to 4+ Categorical Condition Groups, by Enrollee Type, CY 2008 ................................................................................................................................... 31
Table 25: Prevalence of Comorbidity Pairs, CY 2008........................................................................ 32
Table A-1: Medicare-Medicaid Enrollee FFS Study population Characteristics, CY 2008 ........ 36
Table B-1: Comparison of the FFS-only Medicare-Medicaid Enrollee Study Population to the Overall Medicare-Medicaid Enrollee Population on Demographic Characteristics, CY 2008 ..................................................................................................................................................... 40
Table B-2: Comparison of Study Population to Total Population Annual Medicare-Medicaid Enrollee Eligibility Status, among FFS Medicare-Medicaid enrollees, CY 2008 ................ 41
Table B-3: Proportion of Medicare-Medicaid Enrollees meeting all Study Population Criteria, by State, CY 2008 ............................................................................................................................. 44
Table B-4: Percentage of Medicare-Medicaid Enrollees with Medicare Parts A and B by State, CY 2008 .............................................................................................................................................. 46
Table B-5: Percentage of Medicare-Medicaid Enrollees in Medicaid FFS by State, among FFS Medicare-Medicaid Enrollees, CY 2008 ...................................................................................... 47
Table B-6: Percent of Enrollees in FFS Systems (Medicare and Medicaid) by State and Age, CY 2008 .............................................................................................................................................. 49
Table D-1: CCW Condition Counts and Prevalence among Study Population, among FFS Medicare-Medicaid Enrollees, CY 2008 ...................................................................................... 55
Table D-2: CCW Condition Flag to Categorical Condition Group Crosswalk, CY 2008 ........... 56
Table E-1: Percentage of Individuals with 1+ to 7+ Categorical Condition Groups, by Race (CCW), CY 2008 ................................................................................................................................ 57
Table E-2: Percentage of Individuals with 1+ to 7+ Categorical Condition Groups, by Basis of Eligibility Status (CCW), CY 2008 ................................................................................................ 57

x
Figure E-1: Percentage of Individuals with 1+ to 7+ Categorical Condition Groups by Long-Term Care Status (CCW), CY 2008 ............................................................................................... 58
Figure E-2: Percentage of Individuals with 1+ to 7+ Categorical Condition Groups by Original ............................................................................................................................................. 58
Reason for Eligibility Code (CCW), CY 2008 ..................................................................................... 58
Figure E-3: Percentage of Individuals with 1+ to 7+ Categorical Condition Groups by Medicare-Medicaid Enrollee Type (CCW), CY 2008 ................................................................ 59
Table F-1: Medicare-Medicaid Enrollee Study Population Age and Sex by State, among FFS Medicare-Medicaid enrollees, CY 2008 ....................................................................................... 60
Table F-2: Medicare-Medicaid Enrollee Study Population Race by State, among FFS Medicare-Medicaid enrollees, CY 2008 ....................................................................................... 61
Table F-3: Medicare-Medicaid Enrollee Study Population Institutional Status by State, among FFS Medicare-Medicaid Enrollees, CY 2008 ................................................................. 63
Figure F-1: Percentage of Enrollees with No Chronic Conditions, Chronic Condition Warehouse, CY 2008 ........................................................................................................................ 65
Table F-4: Percentage of Individuals with 0 to 5+ Categorical Condition Groups, for States with Low Percentages of Individuals with Comorbidities (CCW), CY 2008 ....................... 67
Table F-5: Percentage of Individuals with 0 to 5+ Categorical Condition Groups, for States with High Percentages of Individuals with Comorbidities (CCW), CY 2008 ...................... 70

1
Introduction
Of the 47.9 million individuals enrolled in Medicare4 and of the 63.8 million persons covered by Medicaid5 in 2008, 9.1 million Americans were simultaneously enrolled in both programs at any given point in the year6. These Medicare-Medicaid enrollees are either low income and elderly or low income and living with a disabling condition or end-stage renal disease (ESRD).
For individuals dually enrolled in both the Medicare and Medicaid programs, Medicare covers the vast majority of medical services that individuals need, with Medicaid often paying certain Medicare cost-sharing.7 In addition, for “Full Benefit” enrollees Medicaid also covers services that are not covered by Medicare, such as nursing home stays and community-based long term services and supports. The extent of benefits available to Medicare-Medicaid enrollees varies significantly by state and by beneficiary income-level.8
To become eligible for Medicare, persons must either have turned age 65, or must have been determined by the Social Security Administration to have a Medicare-qualifying disability or ESRD.9 Most individuals enrolled in Medicare receive Medicare Part A fee-for-service (FFS) coverage of inpatient hospital care, skilled nursing facility stays, home health services and hospice care. Medicare Part B includes FFS coverage of physician services, hospital outpatient care, durable medical equipment (DME) and certain types of home health care. However, as an alternative to FFS care (Medicare Parts A and B) Medicare-enrolled individuals may instead select a managed care plan under Medicare Part C (Medicare Advantage). Finally, Medicare Part D covers costs associated with prescription drugs.
In 2008, Medicaid eligibility was based on financial need, the details of which vary by each state given that it is a state-administered benefit program jointly funded by the state and federal governments.10 Just as eligibility criteria vary by state, so do the benefits. However states must
4 http://www.ccwdata.org/web/guest/medicare-charts/medicare-enrollment-charts 5 https://www.ccwdata.org/cs/groups/public/documents/document/tablea2.pdf 6 http://www.cms.gov/Medicare-Medicaid-Coordination/Medicare-and-Medicaid-Coordination/Medicare-Medicaid-Coordination-Office/Downloads/Dual_Enrollment_2006-2011_Final_Document.pdf 7 This first level of coverage is called “Partial Benefit”. In this report we have divided this group into partial-benefit “Qualified Medicare Beneficiaries”, or “QMB-only” and other “partial benefit” Medicare-Medicaid enrollees. QMB-only beneficiaries receive assistance with Medicare premiums and other cost-sharing requirements but do not qualify for other Medicaid benefits. Other “partial benefit” enrollees receive Medicaid assistance with their Medicare premiums, but they are not eligible for other cost-sharing assistance or Medicaid benefits. 8 www.cms.gov/Medicare-Medicaid-Coordination/Medicare-and-Medicaid-Coordination/Medicare-Medicaid-
Coordination-Office/Downloads/MedicareMedicaidEnrolleeCategories.pdf 9 Beneficiaries qualify for Medicare after having worked for at least 10 years in Medicare-covered employment and are 65 years or older and a United States citizen or permanent resident of the United States. Beneficiaries under age 65 might also qualify for coverage if they have a disability or has been diagnosed with End-Stage Renal disease (ESRD - permanent kidney failure requiring dialysis or transplant). It is important to note that coverage for beneficiaries not yet 65 years of age begins after a beneficiary has received disability benefits (Social Security Disability Income (SSDI)) for 24 months, and not 24 months from the date s/he may have developed disability. Additionally, beneficiaries diagnosed with amyotrophic lateral sclerosis (ALS - often referred to as Lou Gehrig's Disease) are eligible for Medicare coverage the first month of diagnosis. Beneficiaries diagnosed with ESRD are eligible for Medicare after a 3-month waiting period. 10 Title XIX of Social Security Act; it should be noted that the Qualified Individuals (QI) program is federally funded.

2
cover certain federally mandated eligibility groups and they must also provide the federally mandated minimum services and benefits.
The purpose of this research was to determine the extent to which Medicare-Medicaid FFS enrollees are affected by a range of physical and mental health conditions. Given the heterogeneity of this population, we also sought to explore condition prevalence and CCG comorbidity differences according to different demographic subgroups. This research employed FFS data from the CMS Chronic Conditions Warehouse (CCW) which includes the Medicare-Medicaid Linked Enrollee Analytic Data Source (MMLEADS) and the physical and multiple health condition indicators (i.e., “flags”) which were generated using both Medicare and Medicaid FFS claims data.11 These indicators are based on fee-for-service claims that are submitted by health care providers for reimbursement by Medicaid and Medicare. As such, it should be noted that the indicators do not include conditions that have not been diagnosed by health care providers.
11 https://www.ccwdata.org/web/guest/condition-categories

3
Findings
A description of the methods used for these analyses can be found in Appendix A. Detail regarding the study population and related considerations can be found in Appendix B. Further descriptions of variables can be found in Appendix C.
A. Condition-specific Prevalence
1. Condition Prevalence among Medicare-Medicaid Enrollees, Overall
Table 1 shows the prevalence of chronic health conditions among Medicare-Medicaid enrollees in our FFS study population sorted from most prevalent to least prevalent (Appendix D includes the same table sorted alphabetically). These data illustrate the proportions of chronic conditions among Medicare-Medicaid enrollees.
The top 10 conditions in this FFS Medicare-Medicaid enrollee population are the following:
1. Hypertension (61%) 2. Hyperlipidemia (39%) 3. Diabetes (35%) 4. Rheumatoid or osteoarthritis (34%) 5. Ischemic heart disease (33%) 6. Anemia (31%) 7. Depression (any instance, including bipolar) (25%) 8. Congestive heart failure (23%) 9. Alzheimer’s disease, related disorders, or senile dementia (19%) 10. Chronic obstructive pulmonary disease, COPD (19%)
The most prevalent classes of conditions include cardiovascular, metabolic and mental health conditions. Among cardiovascular/circulatory conditions, prevalence is above 10% for hypertension (61%), ischemic heart disease (33%), heart failure (23%) and COPD (19%). The metabolic disorders also exhibit marked prevalence: hyperlipidemia (39%) and diabetes (35%). The following mental health conditions also demonstrate prevalence above 10%: anxiety disorders (15%), depression (25%) and schizophrenia and other psychotic disorders (12%).

4
Table 1: CCW Condition Counts and Proportions among FFS Medicare-Medicaid enrollees, CY 2008
Chronic or Clinical Condition Indicator Number Percentage 1 Hypertension 3,197,377 60.7% 2 Hyperlipidemia 2,028,532 38.5% 3 Diabetes 1,846,997 35.1% 4 Rheumatoid or Osteoarthritis 1,776,766 33.8% 5 Ischemic Heart Disease 1,727,757 32.8% 6 Anemia 1,628,761 30.9% 7 Depression (Any Instance, including Bipolar episode) 1,324,634 25.2% 8 Major Depressive Disorder 1,289,765 24.5% 9 Congestive Heart Failure 1,196,062 22.7%
10 Alzheimer’s Disease, Related Disorders, or Senile Dementia 996,606 18.9% 11 Chronic Obstructive Pulmonary Disease (COPD) 993,239 18.9% 12 Chronic Kidney Disease 888,207 16.9% 13 Cataract 809,883 15.4% 14 Anxiety Disorders 788,136 15.0% 15 Schizophrenia and Other Psychotic Disorders12 618,617 11.8% 16 Tobacco Use Disorders 602,755 11.5% 17 Acquired Hypothyroidism 524,641 10.0% 18 Alzheimer’s Disease 483,689 9.2% 19 Glaucoma 450,366 8.6% 20 Osteoporosis 441,980 8.4% 21 Asthma 423,673 8.1% 22 Bipolar Disorder 397,796 7.6% 23 Schizophrenia 390,543 7.4% 24 Stroke/Transient Ischemic Attack 374,240 7.1% 25 Atrial Fibrillation 338,705 6.4% 26 Benign Prostatic Hyperplasia 213,894 4.1% 27 Breast Cancer 111,337 2.1% 28 ADHD and Other Conduct Disorders 103,998 2.0% 29 Personality Disorders 96,844 1.8% 30 PTSD 75,610 1.4% 31 Prostate Cancer 74,758 1.4% 32 Hip/Pelvic Fracture 68,058 1.3% 33 Colorectal Cancer 63,561 1.2% 34 Acute Myocardial Infarction 57,515 1.1% 35 Lung Cancer 49,283 0.9% 36 Endometrial Cancer 11,756 0.2%
Source: CY 2008 CCW Medicare and Medicaid data, FFS enrollees with at least six months enrollment in Medicare Parts A and B.
12 The indicator for schizophrenia and other psychotic disorders is broader than the indicator for schizophrenia; it includes other psychotic disorders in addition to schizophrenia.

5
2. Condition-specific Prevalence by Subpopulations
In addition to calculating the prevalence of each of the major health conditions, we examined prevalence across different fee-for-service population segments, including dimensions such as age, sex, race, long-term care (LTC) status, Medicare original reason for enrollment, Medicaid basis of eligibility, and state. Here, we summarize some of the trends observed among the top 25 conditions with the highest prevalence among Medicare-Medicaid enrollees in our FFS study population.
a. Age
Table 2 provides the fee-for-service chronic condition prevalence for the top 25 conditions by age group. Table 2 shows that all of the conditions except for asthma and mental health conditions (depression, anxiety disorders, schizophrenia and other psychotic disorders, tobacco use, and bipolar disorders) exhibit higher prevalence among the older age groups. While the physical health conditions are higher among those over the age of 64, the prevalence is not consistently higher among the population age 85 and older. The population under age 40 consistently has the highest proportion of mental health conditions and the lowest proportion of physical health conditions.
Table 2: CCW Condition Prevalence by Age, Top 25 Conditions, among FFS Medicare-Medicaid enrollees, CY 2008
Age Category Detailed Age Category Overall
Prevalence <65 65+ < 40 40-64 65-84 85+ Number of Enrollees 2,226,698 3,038,127 496,706 1,729,992 2,334,406 703,721 5,264,825 Hypertension 43.0% 73.8% 19.9% 49.6% 72.5% 77.9% 60.7% Hyperlipidemia 31.2% 43.9% 14.1% 36.1% 47.8% 30.9% 38.5% Diabetes 27.4% 40.7% 12.6% 31.7% 42.7% 34.2% 35.1% Rheumatoid or Osteoarthritis 23.7% 41.1% 9.1% 27.9% 39.2% 47.4% 33.8% Ischemic Heart Disease 18.7% 43.2% 4.9% 22.6% 41.6% 48.4% 32.8% Anemia 21.4% 37.9% 14.7% 23.4% 34.5% 49.2% 30.9% Depression (Any Instance, including Bipolar disorder) 30.2% 21.5% 27.8% 30.9% 20.0% 26.5% 25.2%
Major Depressive Disorder 28.9% 21.3% 26.1% 29.7% 19.7% 26.6% 24.5% Heart Failure 11.7% 30.8% 4.1% 13.9% 26.8% 43.8% 22.7% Alzheimer’s Disease, Related Disorders, or Senile Dementia 4.5% 29.5% 1.6% 5.4% 21.0% 57.5% 18.9%
Chronic Obstructive Pulmonary Disease 14.8% 21.9% 5.6% 17.4% 22.1% 21.1% 18.9%
Chronic Kidney Disease 11.9% 20.5% 7.5% 13.2% 19.2% 25.0% 16.9% Cataract 7.5% 21.2% 1.4% 9.2% 22.0% 18.5% 15.4% Anxiety Disorders 19.7% 11.5% 20.3% 19.5% 11.3% 12.4% 15.0% Schizophrenia and Other Psychotic Disorders 16.2% 8.5% 17.5% 15.9% 7.5% 11.6% 11.8%
Tobacco Use Disorders 18.9% 6.0% 16.5% 19.5% 7.4% 1.4% 11.5% Acquired Hypothyroidism 7.6% 11.7% 4.9% 8.3% 10.3% 16.5% 10.0%
6
Age Category Detailed Age Category Overall
Prevalence <65 65+ < 40 40-64 65-84 85+ Number of Enrollees 2,226,698 3,038,127 496,706 1,729,992 2,334,406 703,721 5,264,825 Alzheimer’s Disease 1.0% 15.2% 0.2% 1.2% 10.1% 32.0% 9.2% Glaucoma 4.7% 11.4% 1.9% 5.4% 11.2% 12.3% 8.6% Osteoporosis 3.4% 12.1% 1.0% 4.1% 10.8% 16.4% 8.4% Asthma 9.9% 6.7% 9.2% 10.1% 7.2% 5.2% 8.1% Bipolar Disorder 14.2% 2.7% 18.6% 12.9% 3.0% 1.9% 7.6% Schizophrenia 13.5% 2.9% 15.0% 13.1% 3.3% 1.6% 7.4% Stroke/Transient Ischemic Attack 3.7% 9.6% 1.2% 4.4% 8.7% 12.6% 7.1%
Atrial Fibrillation 1.8% 9.8% 0.4% 2.2% 8.1% 15.4% 6.4% Source: CY 2008 CCW Medicare and Medicaid data, FFS enrollees with at least six months enrollment in Medicare Parts A and B.
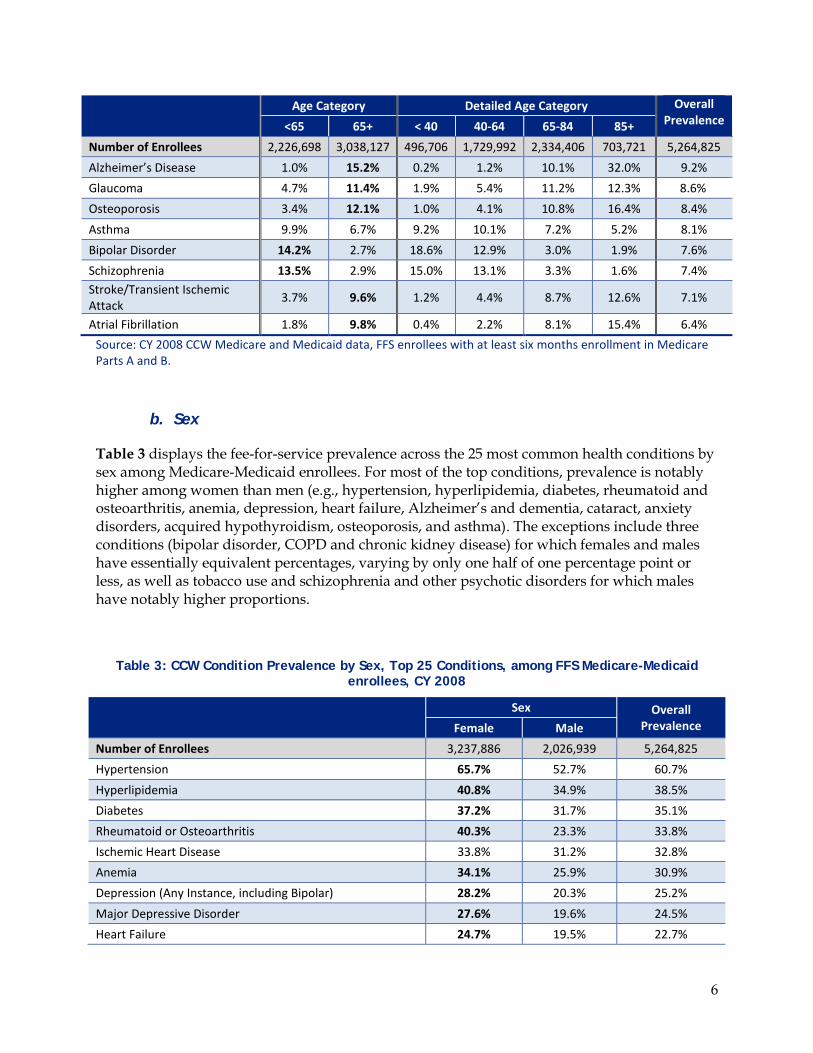
b. Sex
Table 3 displays the fee-for-service prevalence across the 25 most common health conditions by sex among Medicare-Medicaid enrollees. For most of the top conditions, prevalence is notably higher among women than men (e.g., hypertension, hyperlipidemia, diabetes, rheumatoid and osteoarthritis, anemia, depression, heart failure, Alzheimer’s and dementia, cataract, anxiety disorders, acquired hypothyroidism, osteoporosis, and asthma). The exceptions include three conditions (bipolar disorder, COPD and chronic kidney disease) for which females and males have essentially equivalent percentages, varying by only one half of one percentage point or less, as well as tobacco use and schizophrenia and other psychotic disorders for which males have notably higher proportions.
Table 3: CCW Condition Prevalence by Sex, Top 25 Conditions, among FFS Medicare-Medicaid enrollees, CY 2008
Sex Overall
Prevalence Female Male Number of Enrollees 3,237,886 2,026,939 5,264,825 Hypertension 65.7% 52.7% 60.7% Hyperlipidemia 40.8% 34.9% 38.5% Diabetes 37.2% 31.7% 35.1% Rheumatoid or Osteoarthritis 40.3% 23.3% 33.8% Ischemic Heart Disease 33.8% 31.2% 32.8% Anemia 34.1% 25.9% 30.9% Depression (Any Instance, including Bipolar) 28.2% 20.3% 25.2% Major Depressive Disorder 27.6% 19.6% 24.5% Heart Failure 24.7% 19.5% 22.7%

7
Sex Overall
Prevalence Female Male Number of Enrollees 3,237,886 2,026,939 5,264,825 Alzheimer’s Disease, Related Disorders, or Senile Dementia 22.0% 14.0% 18.9% Chronic Obstructive Pulmonary Disease 19.0% 18.6% 18.9% Chronic Kidney Disease 16.7% 17.2% 16.9% Cataract 17.2% 12.4% 15.4% Anxiety Disorders 16.9% 12.0% 15.0% Schizophrenia and Other Psychotic Disorders 10.2% 14.3% 11.8% Tobacco Use Disorders 9.7% 14.3% 11.5% Acquired Hypothyroidism 13.0% 5.1% 10.0% Alzheimer’s Disease 11.2% 5.9% 9.2% Glaucoma 9.7% 6.7% 8.6% Osteoporosis 12.2% 2.4% 8.4% Asthma 9.5% 5.7% 8.1% Bipolar Disorder 7.4% 7.8% 7.6% Schizophrenia 5.5% 10.5% 7.4% Stroke/Transient Ischemic Attack 7.5% 6.4% 7.1% Atrial Fibrillation 7.0% 5.5% 6.4% Source: CY 2008 CCW Medicare and Medicaid data, FFS enrollees with at least six months enrollment in Medicare Parts A and B.
c. Race/Ethnicity
Table 4 shows fee-for-service prevalence by race for the 25 most prevalent chronic health conditions. Among the three most populous racial groups (White, African American, and Hispanic), there is some condition-specific variation in prevalence. For example, compared to the overall prevalence, White beneficiaries had disproportionately high percentages of mental health conditions (depression, anxiety disorders, and bipolar disorders), Alzheimer’s and dementia, COPD, tobacco use, hypothyroidism, and atrial fibrillation. Compared to the overall prevalence, African American beneficiaries had disproportionately high percentage of hypertension, diabetes, anemia, chronic kidney disease, schizophrenia and glaucoma. Hispanic beneficiaries had proportions that were higher than the overall or mean proportion across all race groups combined for metabolic conditions (i.e., diabetes and hyperlipidemia), rheumatoid or osteoarthritis, ischemic heart disease, anemia, glaucoma and osteoporosis. Likewise, Asian/Pacific Islander beneficiaries demonstrate particularly high proportions of hyperlipidemia and higher than average proportion of hypertension, diabetes, cataract, glaucoma and osteoporosis. American Indian and Alaskan Native persons with dual Medicare-Medicaid coverage displayed higher than average prevalence of diabetes, tobacco use disorders, and asthma.

8
Table 4: CCW Condition Prevalence by Race, Top 25 Conditions, among FFS Medicare-Medicaid enrollees, CY 2008
Research Triangle Institute Race Code
Overall Prevalence White African
American Hispanic Asian/ Pacific
Islander
American Indian/ Alaskan Native
Other Unknown
Number of Enrollees 3,201,384 1,043,027 676,851 238,138 52,966 44,733 7,726 5,264,825 Hypertension 57.0% 68.7% 63.9% 68.1% 54.3% 59.2% 58.4% 60.7% Hyperlipidemia 37.3% 34.9% 46.3% 50.3% 28.8% 43.4% 32.7% 38.5% Diabetes 31.2% 39.8% 44.5% 39.1% 38.6% 36.9% 30.2% 35.1% Rheumatoid or Osteoarthritis 33.4% 32.3% 37.8% 34.3% 32.4% 31.1% 30.6% 33.8%
Ischemic Heart Disease 33.0% 29.5% 37.2% 33.9% 25.2% 33.7% 32.2% 32.8% Anemia 29.2% 34.7% 33.5% 31.9% 23.7% 30.8% 36.8% 30.9% Depression (Any Instance or episode, including Bipolar)
30.0% 17.4% 20.9% 8.6% 21.1% 20.0% 22.0% 25.2%
Major Depressive Disorder 29.1% 17.2% 20.4% 8.4% 21.2% 19.6% 21.7% 24.5%
Heart Failure 23.3% 23.8% 20.8% 17.0% 17.1% 20.0% 26.0% 22.7% Alzheimer’s Disease, Related Disorders, or Senile Dementia
21.4% 16.3% 14.5% 12.3% 10.2% 13.2% 25.1% 18.9%
Chronic Obstructive Pulmonary Disease 22.0% 14.2% 14.3% 11.8% 18.0% 12.6% 14.7% 18.9%
Chronic Kidney Disease 15.4% 22.2% 16.5% 14.8% 17.2% 15.8% 21.0% 16.9% Cataract 15.3% 13.0% 17.4% 21.7% 11.9% 16.5% 14.6% 15.4% Anxiety Disorders 18.7% 8.7% 11.1% 4.7% 12.8% 11.1% 11.9% 15.0% Schizophrenia and Other Psychotic Disorders 12.9% 12.9% 7.4% 4.7% 8.7% 8.5% 15.7% 11.8%
Tobacco Use Disorders 13.5% 11.3% 5.3% 2.4% 15.0% 7.1% 6.3% 11.5% Acquired Hypothyroidism 12.3% 5.4% 8.1% 4.6% 9.7% 6.9% 10.1% 10.0%
Alzheimer’s Disease 10.5% 7.6% 7.5% 5.2% 3.6% 5.3% 11.2% 9.2% Glaucoma 6.7% 11.8% 11.3% 12.2% 6.5% 10.3% 9.7% 8.6% Osteoporosis 8.8% 4.1% 10.8% 16.2% 5.7% 8.1% 8.4% 8.4% Asthma 7.8% 9.0% 8.2% 6.9% 9.0% 7.4% 6.5% 8.1% Bipolar Disorder 9.5% 5.2% 4.1% 1.8% 6.0% 6.0% 6.3% 7.6% Schizophrenia 7.7% 9.2% 4.8% 3.3% 5.8% 6.1% 11.3% 7.4% Stroke/Transient Ischemic Attack 7.0% 8.5% 6.0% 5.6% 4.7% 5.8% 6.6% 7.1%
Atrial Fibrillation 7.8% 4.2% 4.3% 4.8% 3.9% 5.3% 7.1% 6.4% Source: CY 2008 CCW Medicare and Medicaid data, FFS enrollees with at least six months enrollment in Medicare Parts A and B.

9
d. Length of Time in Long-Term Care Institution
Table 5 shows fee-for-service prevalence by the amount of time enrollees spent in LTC institutions (e.g., nursing facility; a LTC mental hospital for the aged; a long-term inpatient psychiatric facility for those under 21 years of age; an intermediate care facility for individuals with developmental disabilities) in 2008. We found Medicare-Medicaid enrollees residing in such LTC settings to have significantly higher prevalence across the vast majority of chronic conditions studied than those with no time in a LTC institution. For example, significantly higher proportions of Medicare-Medicaid enrollees who resided in an institutional setting for all of 2008 had diagnoses of Alzheimer’s Disease (with and without other dementias) or schizophrenia and other psychotic disorders. Further, among the latter category, it appears that the “other psychotic disorders” component may be a strong driver of the high prevalence among those residing full-year in a LTC facility. In addition, the data indicate that those residing in a LTC setting for any length of time in 2008 had roughly double the proportion across both measures of depression as compared to those with no institutional experience in the same year. Furthermore, we noted a sharp difference of nearly ten percentage points in diagnosed depression between those with one to two months in an LTC as compared to those with three or more months in an LTC.
Please note that, while the data suggest that Medicare-Medicaid enrollees who were in an institutional setting for the full year (or their full period of eligibility in the year) have lower proportions across many conditions of many conditions (with the exception of Alzheimer’s and related disorders, depression, schizophrenia and other psychotic disorders, and cataract) than do individuals with only part-year time in an institutional setting, all proportions listed in Table 5—particularly those related to full-year time in an institution—may be an artifact of other factors. For example, the prevalence of those full-year LTC stays are likely to be higher in reality than these results reflect because institutional claims may be fewer in number if they are not needed for payment purposes and/or the claims may be less likely to contain the range of a beneficiary’s diagnoses. These issues may pertain disproportionately to full-year LTC stays as compared to those with only partial year stays whose outpatient claims histories for the year may be more complete records and thus may better reflect reality. Therefore, conclusions in this report are limited to comparisons between those with no LTC utilization and those with only short-term LTC stays or any LTC stay and we have refrained from bolding any of the percentages in Table 5.
Table 5: CCW Condition Prevalence by Length of Institutional Long Term Care, Top 25 Conditions, among FFS Medicare-Medicaid enrollees, CY 2008
Length of Institutional Long Term Care Overall Prevalence None 1-2
months 3+
months Entire Year
Number of Enrollees 4,189,236 173,423 205,813 696,353 5,264,825 Hypertension 56.6% 84.8% 85.6% 72.0% 60.7% Hyperlipidemia 39.9% 49.7% 43.5% 26.2% 38.5% Diabetes 32.7% 48.8% 48.6% 42.0% 35.1% Rheumatoid or Osteoarthritis 31.2% 52.8% 49.8% 39.6% 33.8%

10
Length of Institutional Long Term Care Overall Prevalence None 1-2
months 3+
months Entire Year
Number of Enrollees 4,189,236 173,423 205,813 696,353 5,264,825 Ischemic Heart Disease 28.7% 56.9% 58.3% 44.1% 32.8% Anemia 24.0% 61.5% 66.0% 54.5% 30.9% Depression (Any Instance, including Bipolar) 20.5% 39.3% 47.9% 42.8% 25.2% Major Depressive Disorder 19.7% 36.6% 44.2% 44.3% 24.5% Heart Failure 16.8% 48.2% 52.5% 43.3% 22.7% Alzheimer’s Disease, Related Disorders, or Senile Dementia 7.7% 31.0% 58.3% 71.8% 18.9%
Chronic Obstructive Pulmonary Disease 16.3% 39.6% 36.8% 23.9% 18.9% Chronic Kidney Disease 13.2% 38.7% 41.4% 26.5% 16.9% Cataract 13.8% 15.8% 19.2% 24.0% 15.4% Anxiety Disorders 13.7% 23.0% 23.5% 18.2% 15.0% Schizophrenia and Other Psychotic Disorders 8.7% 15.7% 23.2% 25.7% 11.8% Tobacco Use Disorders 12.4% 18.6% 12.4% 3.4% 11.5% Acquired Hypothyroidism 7.7% 18.0% 20.2% 18.8% 10.0% Alzheimer’s Disease 3.1% 13.0% 29.3% 39.1% 9.2% Glaucoma 8.4% 8.8% 8.6% 9.3% 8.6% Osteoporosis 6.7% 16.1% 17.2% 14.4% 8.4% Asthma 8.2% 15.0% 10.7% 4.6% 8.1% Bipolar Disorder 7.3% 9.6% 9.1% 8.0% 7.6% Schizophrenia 7.0% 8.2% 8.3% 9.5% 7.4% Stroke/Transient Ischemic Attack 4.1% 17.4% 23.9% 17.9% 7.1% Atrial Fibrillation 4.3% 16.5% 19.7% 12.8% 6.4%
Source: CY 2008 CCW Medicare and Medicaid data, FFS enrollees with at least six months enrollment in Medicare Parts A and B.
e. Medicare-Medicaid Eligibility Status
Table 6 shows the fee-for-service prevalence for the top 25 conditions by Medicare-Medicaid eligibility status, including Partial Benefit, Qualified Medicare Beneficiaries (QMB-only), and Full Benefit. For the vast majority of health conditions, the proportions are greater among Full Benefit and lower among Partial Benefit Medicare-Medicaid enrollees. This is particularly true for Alzheimer’s disease, anemia, depression and rheumatoid or osteoarthritis. The exceptions are hyperlipidemia and tobacco use, both of which appear to be higher among partial benefit Medicare-Medicaid enrollees.

11
Table 6: CCW Condition Prevalence by Medicare-Medicaid Eligibility, Top 25 Conditions, among FFS Medicare-Medicaid enrollees, CY 2008
Medicare-Medicaid Eligibility Status Overall
Prevalence Partial Benefit QMB-only Full Benefit
Number of Enrollees 632,356 671,462 3,961,007 5,264,825 Hypertension 58.6% 60.3% 61.2% 60.7% Hyperlipidemia 40.4% 41.4% 37.8% 38.5% Diabetes 32.8% 32.5% 35.9% 35.1% Rheumatoid or Osteoarthritis 28.7% 33.6% 34.6% 33.8% Ischemic Heart Disease 32.1% 29.8% 33.4% 32.8% Anemia 23.1% 23.5% 33.5% 30.9% Depression (Any Instance, including Bipolar) 19.1% 21.6% 26.7% 25.2% Major Depressive Disorder 17.7% 20.0% 26.4% 24.5% Heart Failure 18.6% 17.5% 24.3% 22.7% Alzheimer’s Disease, Related Disorders, or Senile Dementia 6.6% 6.7% 23.0% 18.9%
Chronic Obstructive Pulmonary Disease 16.8% 18.7% 19.2% 18.9% Chronic Kidney Disease 14.0% 13.9% 17.8% 16.9% Cataract 12.8% 13.2% 16.2% 15.4% Anxiety Disorders 12.3% 14.5% 15.5% 15.0% Schizophrenia and Other Psychotic Disorders 5.4% 7.0% 13.6% 11.8% Tobacco Use Disorders 12.7% 15.1% 10.6% 11.5% Acquired Hypothyroidism 7.7% 8.4% 10.6% 10.0% Alzheimer’s Disease 2.5% 2.6% 11.4% 9.2% Glaucoma 7.1% 7.7% 8.9% 8.6% Osteoporosis 5.1% 6.4% 9.3% 8.4% Asthma 6.1% 7.9% 8.4% 8.1% Bipolar Disorder 5.4% 6.9% 8.0% 7.6% Schizophrenia 3.9% 5.4% 8.3% 7.4% Stroke/Transient Ischemic Attack 3.9% 4.5% 8.1% 7.1% Atrial Fibrillation 5.7% 5.0% 6.8% 6.4%
Source: CY 2008 CCW Medicare and Medicaid data, FFS enrollees with at least six months enrollment in Medicare Parts A and B. Note: While “QMB-only” Medicare-Medicaid enrollees are technically considered “partial benefit,” in this report the QMB-only enrollment category is presented separately from “partial benefit” category, which refers only to all other types of partial benefit Medicare-Medicaid enrollees: Specified Low-income Medicare Beneficiaries (i.e., “SLMB-only”), Qualified Disabled Working Individuals (i.e., “QDWI”), and Qualifying Individuals (i.e., “QI”).

12
f. Original Reason for Medicare Eligibility
Table 7 shows fee-for-service prevalence by original reason for Medicare eligibility. As expected, two main reasons for this eligibility (i.e., age and having a qualifying disability) account for 98% of Medicare-Medicaid enrollees13.
In general, most chronic physical health conditions tend to be associated with qualifying for Medicare due to turning age 65, and in general, most mental health conditions (e.g., depression, anxiety disorders, bipolar disorders, schizophrenia) are associated with qualifying for Medicare due to disability. Enrollees eligible as the result of end-stage renal disease (ESRD), alone or with another Medicare-qualifying disability have very high proportions of anemia, depression, diabetes, heart disease, heart failure, hypertension, and hyperlipidemia. The very high percentages of chronic kidney disease (CKD) in the two ESRD columns reflect the fact that CKD includes both CKD as well as ESRD diagnoses.
Table 7: CCW Condition Prevalence by Original Reason for Medicare Eligibility, Top 25 Conditions, among FFS Medicare-Medicaid enrollees, CY 2008
Original Reason for Medicare Eligibility Overall
Prevalence Age 65+ With Disability
End-Stage Renal
Disease
With Disability and End-Stage Renal Disease
Number of Enrollees 2,414,210 2,762,196 33,992 54,427 5,264,825 Hypertension 73.7% 48.6% 86.0% 86.9% 60.7% Hyperlipidemia 43.3% 34.2% 40.7% 45.6% 38.5% Diabetes 39.2% 30.7% 57.6% 62.1% 35.1% Rheumatoid or Osteoarthritis 40.7% 28.2% 16.8% 18.9% 33.8% Ischemic Heart Disease 42.5% 23.9% 46.8% 49.4% 32.8% Anemia 37.8% 23.1% 90.0% 86.7% 30.9% Depression (Any Instance, including Bipolar) 20.5% 29.5% 17.3% 18.7% 25.2%
Major Depressive Disorder 20.3% 28.4% 17.4% 19.1% 24.5% Heart Failure 30.2% 15.4% 48.6% 48.1% 22.7% Alzheimer’s Disease, Related Disorders, or Senile Dementia 30.7% 9.1% 5.8% 5.5% 18.9%
Chronic Obstructive Pulmonary Disease 20.3% 17.8% 14.4% 14.7% 18.9% Chronic Kidney Disease 19.8% 11.7% 97.2% 96.3% 16.9% Cataract 21.0% 10.6% 10.8% 11.4% 15.4% Anxiety Disorders 10.8% 18.8% 9.1% 9.4% 15.0% Schizophrenia and Other Psychotic Disorders 7.4% 15.8% 4.2% 4.6% 11.8%
13 Note that for the 65+ population, the classification “originally entitled based on disability” only captures Medicare disability status; some persons in this age group could have been eligible for Medicaid based on disability but who had not reached the end of their Medicare 24-month waiting period by the time they turned 65.

13
Original Reason for Medicare Eligibility Overall
Prevalence Age 65+ With Disability
End-Stage Renal
Disease
With Disability and End-Stage Renal Disease
Number of Enrollees 2,414,210 2,762,196 33,992 54,427 5,264,825 Tobacco Use Disorders 5.0% 17.0% 15.4% 15.8% 11.5% Acquired Hypothyroidism 11.6% 8.6% 7.8% 7.7% 10.0% Alzheimer’s Disease 16.4% 3.1% 1.1% 1.0% 9.2% Glaucoma 11.7% 5.9% 6.1% 7.1% 8.6% Osteoporosis 12.6% 4.9% 3.5% 3.9% 8.4% Asthma 6.1% 9.8% 7.3% 6.8% 8.1% Bipolar Disorder 2.0% 12.6% 2.2% 2.7% 7.6% Schizophrenia 1.8% 12.5% 1.4% 1.8% 7.4% Stroke/Transient Ischemic Attack 9.4% 5.1% 8.2% 7.8% 7.1% Atrial Fibrillation 10.0% 3.3% 5.9% 6.0% 6.4% Source: CY 2008 CCW Medicare and Medicaid data, FFS enrollees with at least six months enrollment in Medicare Parts A and B.
g. Medicaid Basis of Eligibility
Table 8 shows fee-for-service health condition prevalence by Medicaid basis of eligibility. Not surprisingly, the data show a consistent pattern with the Medicare data in that, with the exception of asthma, those qualifying for Medicaid due to age tended to have higher than average percentages across most chronic physical health conditions. In contrast, those qualifying for Medicaid due to disability or blindness had much higher proportions of depression, anxiety, bipolar disorder and schizophrenia. In addition, the small number of children who are dually eligible for both Medicare and Medicaid (both in and not in the foster care system) had notably high proportions of bipolar disorder and chronic kidney disease/ESRD14.
14 The high prevalence of ESRD among children reflects the fact that a child of any age, including an infant born with end-stage renal disease, can qualify for Medicare on his/her parents’ Social Security account even though the parents are working and not themselves entitled to Social Security benefits.

14
Table 8: CCW Condition Prevalence by Medicaid Basis of Eligibility, Top 25 Conditions, among FFS Medicare-Medicaid enrollees, CY 2008
Source: CY 2008 CCW Medicare and Medicaid data, FFS enrollees with at least six months enrollment in Medicare Parts A and B.
Medicaid Basis of Eligibility Overall
Prevalence Age 65+ Blind/With Disability Child Adult Unemployed
Adult
Foster Care Child
Breast & Cervical Cancer
Unknown
Number of Enrollees 2,631,974 2,380,523 312 36,923 62 146 521 214,364 5,264,825 Hypertension 74.0% 47.5% 40.1% 33.9% 33.9% 18.5% 47.2% 50.4% 60.7% Hyperlipidemia 43.2% 34.1% 12.5% 24.1% 32.3% 2.7% 30.7% 32.2% 38.5% Diabetes 40.1% 30.2% 12.8% 22.5% 24.2% 5.5% 27.5% 30.4% 35.1% Rheumatoid or Osteoarthritis 40.9% 26.8% 7.4% 19.8% 17.7% 2.7% 24.6% 26.2% 33.8% Ischemic Heart Disease 43.1% 22.2% 7.4% 14.4% 24.2% 3.4% 15.7% 28.6% 32.8% Anemia 38.3% 23.6% 33.0% 18.9% 29.0% 20.6% 26.1% 23.9% 30.9% Depression (Any Instance, including Bipolar) 21.8% 28.8% 13.5% 32.0% 17.7% 17.1% 23.0% 24.1% 25.2% Major Depressive Disorder 21.6% 27.7% 13.5% 30.5% 11.3% 17.8% 22.3% 23.5% 24.5% Heart Failure 31.2% 14.0% 8.0% 8.3% 8.1% 3.4% 11.1% 18.2% 22.7% Alzheimer’s Disease, Related Disorders, or Senile Dementia 31.5% 6.1% 2.6% 1.7% 4.8% 0.0% 2.1% 10.3% 18.9%
Chronic Obstructive Pulmonary Disease 21.9% 16.0% 3.5% 9.0% 8.1% 2.1% 12.9% 15.9% 18.9% Chronic Kidney Disease 20.8% 12.8% 44.2% 10.5% 21.0% 20.6% 8.1% 15.4% 16.9% Cataract 21.2% 9.6% 2.6% 4.4% 4.8% 2.1% 9.4% 9.7% 15.4% Anxiety Disorders 11.6% 18.6% 8.0% 19.8% 16.1% 15.8% 11.9% 15.0% 15.0%
Schizophrenia and Other Psychotic Disorders 8.6% 15.5% 4.8% 5.9% 0.0% 13.7% 1.5% 9.8% 11.8%
Tobacco Use Disorders 5.8% 17.3% 5.1% 17.6% 12.9% 8.2% 12.7% 15.7% 11.5% Acquired Hypothyroidism 12.1% 7.9% 2.6% 5.6% 3.2% 2.7% 8.1% 7.2% 10.0% Alzheimer’s Disease 16.5% 1.7% 1.0% 0.4% 3.2% 0.0% 0.4% 4.4% 9.2% Glaucoma 11.3% 5.9% 1.6% 3.9% 3.2% 2.1% 6.1% 5.3% 8.6% Osteoporosis 12.3% 4.5% 1.0% 1.6% 1.6% 0.7% 7.3% 4.3% 8.4%
Asthma 6.3% 10.0% 5.5% 10.6% 3.2% 9.6% 7.7% 6.9% 8.1% Bipolar Disorder 2.7% 12.7% 9.0% 14.1% 6.5% 17.8% 3.7% 9.1% 7.6% Schizophrenia 2.7% 12.8% 2.9% 4.6% 0.0% 12.3% 0.8% 6.8% 7.4%
Stroke/Transient Ischemic Attack 9.9% 4.3% 2.9% 2.3% 6.5% 1.4% 2.7% 5.0% 7.1% Atrial Fibrillation 10.2% 2.5% 1.0% 1.3% 3.2% 0.0% 1.3% 4.9% 6.4%

15
3. Condition-specific Prevalence by Multidimensional Subpopulations
Our earlier analyses showed significant differences in fee-for-service condition prevalence across enrollee subpopulations. We observe some of the largest subpopulation differences between the population under age 65 and the population over age 65. For this reason, we combined age with several other enrollee characteristics to see if other differences (e.g., by race or sex) persist when age is taken into account. Tables 9 through 12 present the race, sex, institutional status and original reason for Medicare eligibility findings with stratification by age (i.e., <65 and 65+).
a. Age and Sex
Table 9 presents fee-for-service condition prevalence for specific age and sex subpopulations. Earlier, in Table 3, we observed higher proportions of conditions among women than among men (exceptions include COPD, chronic kidney disease, schizophrenia and other psychotics disorders, tobacco use, and bipolar). The general pattern of higher condition prevalence rates among women persists after the data are stratified by age, though there are differences for some specific conditions. For example, males age 65 and older have higher proportions of heart disease and stroke, while women under the age of 65 have higher proportions of bipolar disorder. In other cases, we observe changes in the magnitude of the sex differences after accounting for age. When the age groups are pooled, women have an 8% higher prevalence of depression than men (28% compared to 20%), while in the under 65 population, women’s prevalence of depression is 14% higher than men’s (37% compared to 23%). Although there are some differences, the general trend of higher condition prevalence among women than among men persists after accounting for age.
Table 9: CCW Condition Prevalence by Age and Sex (multidimensional), Top 25 Conditions, among FFS Medicare-Medicaid enrollees, CY 2008
Female < 65 Male < 65 Female 65+ Male 65+ Overall Prevalence
Number of Enrollees 1,123,724 1,102,974 2,114,162 923,965 5,264,825 Hypertension 45.5% 40.4% 76.5% 67.4% 60.7% Hyperlipidemia 32.8% 29.5% 45.0% 41.4% 38.5% Diabetes 29.8% 25.0% 41.1% 39.8% 35.1% Rheumatoid or Osteoarthritis 30.0% 17.3% 45.8% 30.4% 33.8% Ischemic Heart Disease 18.7% 18.7% 41.9% 46.2% 32.8% Anemia 24.3% 18.5% 39.3% 34.8% 30.9% Depression (Any Instance, including Bipolar) 37.0% 23.3% 23.5% 16.8% 25.2%
Major Depressive Disorder 35.4% 22.2% 23.4% 16.4% 24.5% Heart Failure 12.2% 11.2% 31.4% 29.3% 22.7% Alzheimer’s Disease, Related Disorders, or Senile Dementia 4.3% 4.8% 31.4% 25.0% 18.9%
16
Female < 65 Male < 65 Female 65+ Male 65+ Overall Prevalence
Number of Enrollees 1,123,724 1,102,974 2,114,162 923,965 5,264,825 Chronic Obstructive Pulmonary Disease 16.4% 13.1% 20.4% 25.2% 18.9%
Chronic Kidney Disease 11.4% 12.4% 19.4% 23.0% 16.9% Cataract 8.5% 6.5% 21.9% 19.6% 15.4% Anxiety Disorders 23.9% 15.4% 13.1% 7.8% 15.0% Schizophrenia and Other Psychotic Disorders 13.1% 19.4% 8.6% 8.2% 11.8%
Tobacco Use Disorders 18.9% 18.8% 4.8% 8.8% 11.5% Acquired Hypothyroidism 10.8% 4.2% 14.2% 6.0% 10.0% Alzheimer’s Disease 1.0% 1.0% 16.7% 11.8% 9.2% Glaucoma 5.3% 4.0% 12.1% 9.9% 8.6% Osteoporosis 5.2% 1.5% 15.9% 3.4% 8.4% Asthma 13.5% 6.2% 7.4% 5.1% 8.1% Bipolar Disorder 16.2% 12.1% 2.8% 2.5% 7.6% Schizophrenia 10.5% 16.6% 2.8% 3.2% 7.4% Stroke/Transient Ischemic Attack 3.9% 3.5% 9.5% 10.0% 7.1% Atrial Fibrillation 1.6% 2.0% 9.9% 9.6% 6.4%
Source: CY 2008 CCW Medicare and Medicaid data, FFS enrollees with at least six months enrollment in Medicare Parts A and B.
b. Age and Race/Ethnicity
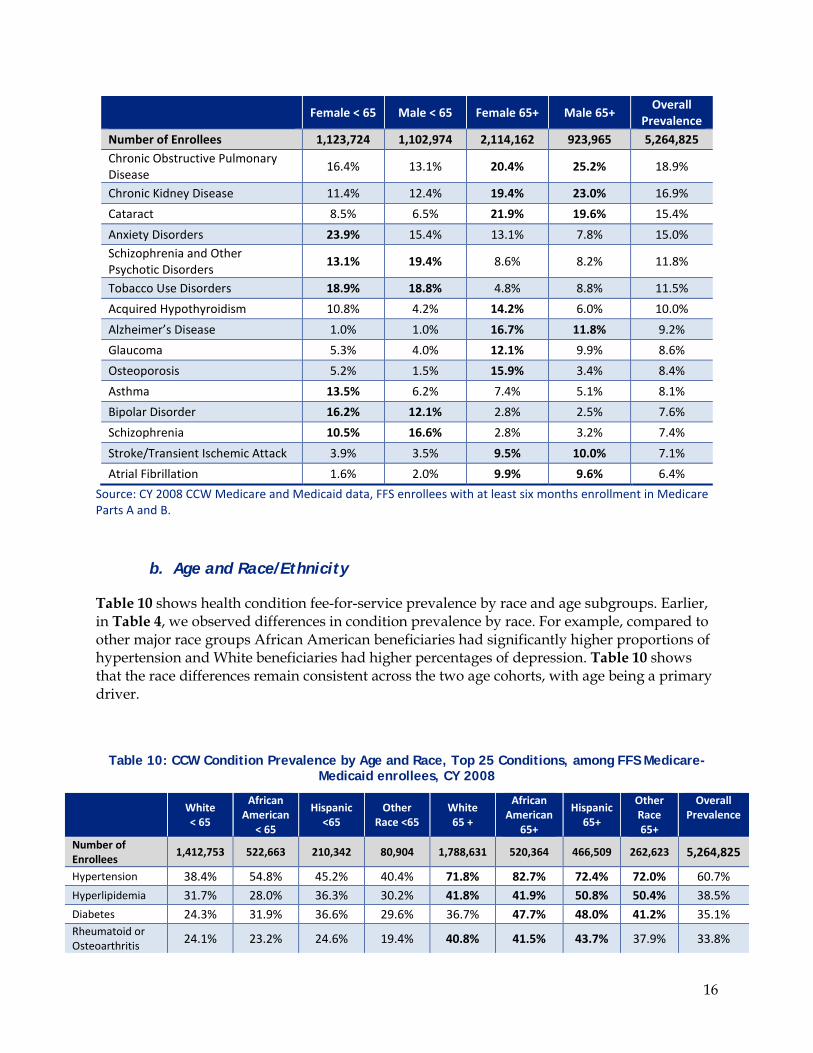
Table 10 shows health condition fee-for-service prevalence by race and age subgroups. Earlier, in Table 4, we observed differences in condition prevalence by race. For example, compared to other major race groups African American beneficiaries had significantly higher proportions of hypertension and White beneficiaries had higher percentages of depression. Table 10 shows that the race differences remain consistent across the two age cohorts, with age being a primary driver.
Table 10: CCW Condition Prevalence by Age and Race, Top 25 Conditions, among FFS Medicare-Medicaid enrollees, CY 2008
White < 65
African American
< 65
Hispanic <65
Other Race <65
White 65 +
African American
65+
Hispanic 65+
Other Race 65+
Overall Prevalence
Number of Enrollees 1,412,753 522,663 210,342 80,904 1,788,631 520,364 466,509 262,623 5,264,825
Hypertension 38.4% 54.8% 45.2% 40.4% 71.8% 82.7% 72.4% 72.0% 60.7% Hyperlipidemia 31.7% 28.0% 36.3% 30.2% 41.8% 41.9% 50.8% 50.4% 38.5% Diabetes 24.3% 31.9% 36.6% 29.6% 36.7% 47.7% 48.0% 41.2% 35.1% Rheumatoid or Osteoarthritis 24.1% 23.2% 24.6% 19.4% 40.8% 41.5% 43.7% 37.9% 33.8%

17
White < 65
African American
< 65
Hispanic <65
Other Race <65
White 65 +
African American
65+
Hispanic 65+
Other Race 65+
Overall Prevalence
Number of Enrollees 1,412,753 522,663 210,342 80,904 1,788,631 520,364 466,509 262,623 5,264,825
Ischemic Heart Disease 17.8% 19.8% 22.5% 16.8% 45.0% 39.3% 43.8% 37.3% 32.8%
Anemia 18.1% 28.1% 26.6% 22.4% 38.0% 41.4% 36.6% 33.1% 30.9% Depression (Any Instance, including Bipolar)
34.3% 20.8% 28.0% 24.5% 26.5% 13.9% 17.8% 8.6% 25.2%
Major Depressive Disorder 32.4% 20.8% 27.3% 24.1% 26.4% 13.7% 17.2% 8.4% 24.5%
Heart Failure 10.2% 15.9% 12.6% 10.5% 33.7% 31.8% 24.6% 19.8% 22.7% Alzheimer’s Disease, Related Disorders, or Senile Dementia
4.8% 4.1% 4.2% 3.9% 34.5% 28.6% 19.2% 15.0% 18.9%
Chronic Obstructive Pulmonary Disease
17.1% 11.2% 9.7% 10.1% 25.9% 17.2% 16.4% 13.8% 18.9%
Chronic Kidney Disease 9.3% 17.4% 15.0% 14.6% 20.2% 26.9% 17.1% 15.7% 16.9%
Cataract 7.8% 6.2% 8.3% 7.5% 21.2% 19.8% 21.4% 23.0% 15.4% Anxiety Disorders 23.8% 11.0% 15.7% 15.1% 14.7% 6.5% 9.0% 4.5% 15.0% Schizophrenia and Other Psychotic Disorders
16.2% 17.1% 13.8% 17.1% 10.3% 8.7% 4.5% 2.7% 11.8%
Tobacco Use Disorders 21.4% 16.3% 10.2% 13.4% 7.3% 6.2% 3.0% 2.5% 11.5%
Acquired Hypothyroidism 9.1% 4.0% 6.6% 6.2% 14.8% 6.9% 8.8% 5.7% 10.0%
Alzheimer’s Disease 1.1% 0.8% 1.0% 0.7% 18.0% 14.4% 10.4% 6.5% 9.2%
Glaucoma 3.7% 6.7% 6.1% 4.7% 9.0% 16.9% 13.6% 13.0% 8.6% Osteoporosis 3.8% 1.8% 4.1% 3.3% 12.7% 6.3% 13.8% 16.5% 8.4% Asthma 9.7% 10.6% 9.9% 8.2% 6.3% 7.4% 7.4% 7.0% 8.1% Bipolar Disorder 17.0% 8.7% 9.8% 10.9% 3.6% 1.8% 1.5% 0.7% 7.6% Schizophrenia 13.4% 14.6% 11.5% 14.8% 3.3% 3.7% 1.8% 1.0% 7.4% Stroke/Transient Ischemic Attack 3.3% 4.9% 3.6% 3.5% 10.0% 12.2% 7.2% 6.2% 7.1%
Atrial Fibrillation 1.9% 1.7% 1.6% 1.9% 12.5% 6.6% 5.5% 5.7% 6.4% Source: CY 2008 CCW Medicare and Medicaid data, FFS enrollees with at least six months enrollment in Medicare Parts A and B.
c. Age and Institutional Status
Table 11 shows that differences in fee-for-service prevalence by institutional status vary by age. Regardless of institutional status, beneficiaries age 65 and greater appear to have much higher prevalence across the vast majority of the physical health conditions. In an inverse way, there

18
was a consistently higher proportion of mental health conditions among those under age 65, irrespective of LTC length of stay. However, among those with full-year LTC utilization, depression and anxiety were the main outliers, even contrary to the trend of lower prevalence among those with full-year institutional stays. Surpassing their under 65 counterparts with full-year LTC stays, nearly one half of all enrollees ages 65+ had claims-based evidence of clinical depression.15
Table 11: CCW Condition Prevalence by Age and Institutional Status, Top 25 Conditions, among FFS Medicare-Medicaid enrollees, CY 2008
No LTC <
65
Part Year LTC < 65
Full Year LTC < 65
No LTC 65+
Part Year LTC65+
Full Year LTC 65+
Overall Prevalence
Number of Enrollees 2,027,848 84,917 113,933 2,161,388 294,319 582,420 5,264,825 Hypertension 41.7% 71.0% 44.4% 70.6% 89.4% 77.4% 60.7% Hyperlipidemia 31.0% 41.0% 27.1% 48.2% 47.9% 26.1% 38.5% Diabetes 26.2% 49.0% 33.3% 38.8% 48.6% 43.7% 35.1% Rheumatoid or Osteoarthritis 23.4% 38.5% 17.9% 38.5% 54.8% 43.8% 33.8%
Ischemic Heart Disease 17.6% 40.6% 21.0% 39.1% 62.6% 48.6% 32.8% Anemia 18.8% 57.1% 42.5% 29.0% 65.9% 56.8% 30.9% Depression (Any Instance, including Bipolar) 28.7% 56.0% 37.2% 12.8% 40.5% 43.9% 25.2%
Major Depressive Disorder 27.4% 53.1% 37.0% 12.5% 37.2% 45.7% 24.5% Heart Failure 10.2% 35.8% 21.6% 23.0% 54.8% 47.5% 22.7% Alzheimer’s Disease, Related Disorders, or Senile Dementia
2.6% 17.2% 30.0% 12.5% 54.0% 80.0% 18.9%
Chronic Obstructive Pulmonary Disease 13.9% 34.5% 15.6% 18.6% 39.1% 25.6% 18.9%
Chronic Kidney Disease 10.6% 36.1% 17.8% 15.6% 41.3% 28.3% 16.9% Cataract 6.5% 12.3% 22.5% 20.6% 19.1% 24.3% 15.4% Anxiety Disorders 19.2% 33.5% 18.4% 8.5% 20.3% 18.1% 15.0% Schizophrenia and Other Psychotic Disorders 14.9% 30.8% 30.0% 3.0% 16.6% 24.8% 11.8%
Tobacco Use Disorders 18.9% 33.2% 7.5% 6.4% 10.1% 2.6% 11.5% Acquired Hypothyroidism 6.8% 15.3% 15.3% 8.5% 20.3% 19.5% 10.0%
15 Please note that, while the data suggest that Medicare-Medicaid enrollees who lived in an institution for the full year (or their full period of eligibility in the year) have lower prevalence of some conditions than do individuals with only part-year time in an institutional setting, these rates—particularly those related to full-year in an institutional setting—may be an artifact of other factors. For example, the prevalence of those full-year LTC stays are likely to be higher in reality than they appear by these findings because institutional claims may be fewer in number if they are not needed for payment purposes and/or the claims may be less likely to contain the range of a beneficiary’s diagnoses. Since these issues may pertain disproportionately to full-year LTC stays, conclusions in this report are limited to comparisons between those with no LTC utilization and those with only short-term or any LTC stay and we have refrained from bolding any of the results presented in Table 11.

19
No LTC <
65
Part Year LTC < 65
Full Year LTC < 65
No LTC 65+
Part Year LTC65+
Full Year LTC 65+
Overall Prevalence
Number of Enrollees 2,027,848 84,917 113,933 2,161,388 294,319 582,420 5,264,825 Alzheimer’s Disease 0.5% 3.6% 7.7% 5.5% 27.1% 45.2% 9.2% Glaucoma 4.5% 5.2% 6.4% 12.1% 9.7% 9.8% 8.6% Osteoporosis 2.9% 7.9% 8.9% 10.2% 19.3% 15.4% 8.4% Asthma 9.8% 17.9% 5.3% 6.7% 11.2% 4.4% 8.1% Bipolar Disorder 13.6% 24.7% 15.9% 1.4% 4.9% 6.4% 7.6% Schizophrenia 12.8% 22.9% 20.3% 1.6% 4.1% 7.4% 7.4% Stroke/Transient Ischemic Attack 2.7% 15.3% 11.8% 5.3% 22.6% 19.1% 7.1%
Atrial Fibrillation 1.5% 7.0% 3.2% 6.9% 21.5% 14.7% 6.4% Source: CY 2008 CCW Medicare and Medicaid data, FFS enrollees with at least six months enrollment in Medicare Parts A and B.
d. Age and Original Reason for Medicare Eligibility
In Tables 6 and 7, we observed that enrollees eligible for Medicare and/or Medicaid as the result of reaching age 65 had higher fee-for-service prevalence of all of the top chronic health conditions than those eligible for either program due to disability; in contrast, those eligible for Medicare and/or Medicaid due to disability had higher prevalence of mental health conditions than those qualifying for either program based on their age. In Table 12, we observe higher prevalence of chronic physical health conditions for enrollees age 65 and older who became eligible for Medicare as the result of disability. However, the very highest prevalence of these chronic physical health conditions were found among persons age 65+ who had become eligible for Medicare due to an ESRD diagnosis.
Table 12: CCW Condition Prevalence by Age and Original Reason for Medicare Eligibility, Top 25 Conditions, among FFS Medicare-Medicaid enrollees, CY 2008
Medicare Original Reason for Medicare Eligibility
With Disability
With Disability Age 65+
End Stage Renal
Disease
End Stage Renal
Disease All Reasons
Age in 2008 < 65 65+ 65+ < 65 65+ All Ages
Number of Enrollees 2,147,216 614,980 2,413,908 79,180 9,239 5,264,825 Hypertension 41.4% 73.9% 73.7% 86.1% 90.4% 60.7% Hyperlipidemia 30.8% 46.2% 43.3% 42.7% 52.7% 38.5% Diabetes 26.3% 46.2% 39.2% 58.5% 76.4% 35.1% Rheumatoid or Osteoarthritis 24.0% 42.7% 40.7% 16.6% 30.6% 33.8% Ischemic Heart Disease 17.7% 45.6% 42.5% 46.1% 67.3% 32.8% Anemia 19.0% 37.5% 37.8% 87.8% 89.4% 30.9% Depression (Any Instance, including Bipolar) 30.7% 25.4% 20.5% 18.1% 18.4% 25.2%
Major Depressive Disorder 29.3% 25.1% 20.3% 18.5% 17.7% 24.5% Heart Failure 10.4% 32.6% 30.2% 46.9% 60.0% 22.7%
20
Medicare Original Reason for Medicare Eligibility
With Disability
With Disability Age 65+
End Stage Renal
Disease
End Stage Renal
Disease All Reasons
Age in 2008 < 65 65+ 65+ < 65 65+ All Ages
Number of Enrollees 2,147,216 614,980 2,413,908 79,180 9,239 5,264,825 Alzheimer’s Disease, Related Disorders, or Senile Dementia 4.6% 24.9% 30.7% 4.4% 16.3% 18.9%
Chronic Obstructive Pulmonary Disease 14.8% 28.2% 20.3% 13.7% 21.9% 18.9%
Chronic Kidney Disease 8.8% 22.1% 19.8% 96.7% 96.4% 16.9% Cataract 7.4% 21.9% 21.0% 10.2% 19.9% 15.4% Anxiety Disorders 20.1% 14.6% 10.8% 9.5% 8.0% 15.0% Schizophrenia and Other Psychotic Disorders 16.7% 12.7% 7.4% 4.2% 6.4% 11.8%
Tobacco Use Disorders 18.9% 10.1% 5.0% 16.6% 7.3% 11.5% Acquired Hypothyroidism 7.6% 12.2% 11.6% 7.3% 11.3% 10.0% Alzheimer’s Disease 1.0% 10.6% 16.4% 0.7% 4.2% 9.2% Glaucoma 4.6% 10.4% 11.7% 6.0% 12.2% 8.6% Osteoporosis 3.4% 10.1% 12.6% 3.4% 7.1% 8.4% Asthma 10.0% 8.9% 6.1% 7.0% 6.4% 8.1% Bipolar Disorder 14.6% 5.4% 2.0% 2.6% 1.7% 7.6% Schizophrenia 14.0% 7.4% 1.8% 1.7% 1.1% 7.4% Stroke/Transient Ischemic Attack 3.5% 10.4% 9.4% 7.4% 12.6% 7.1% Atrial Fibrillation 1.7% 8.9% 10.0% 5.2% 12.5% 6.4% Source: CY 2008 CCW Medicare and Medicaid data, FFS enrollees with at least six months enrollment in Medicare Parts A and B.
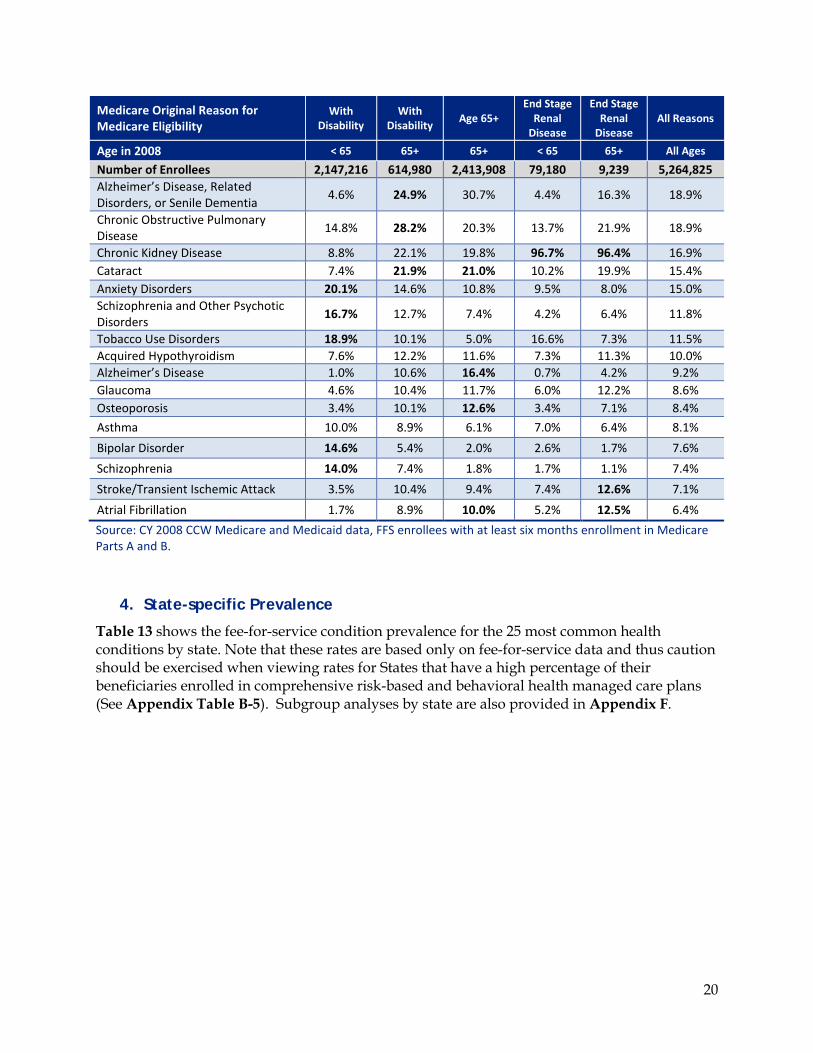
4. State-specific Prevalence
Table 13 shows the fee-for-service condition prevalence for the 25 most common health conditions by state. Note that these rates are based only on fee-for-service data and thus caution should be exercised when viewing rates for States that have a high percentage of their beneficiaries enrolled in comprehensive risk-based and behavioral health managed care plans (See Appendix Table B-5). Subgroup analyses by state are also provided in Appendix F.

21
Table 13: Chronic Condition Prevalence by State, Top 25 Conditions, among FFS Medicare-Medicaid enrollees, CY 2008 St
ate
Hype
rten
sion
Hype
rlipi
dem
ia
Diab
etes
Rheu
mat
oid
or O
steo
arth
ritis
Isch
emic
Hea
rt D
isea
se
Anem
ia
Depr
essi
on (A
ny In
stan
ce,
incl
udin
g Bi
pola
r)
Maj
or D
epre
ssiv
e Di
sord
er
Hear
t Fai
lure
Alzh
eim
er’s
Dis
ease
, Rel
ated
Di
sord
ers,
or S
enile
Dem
entia
Chro
nic
Obs
truc
tive
Pulm
onar
y Di
seas
e
Chro
nic
Kidn
ey D
isea
se
Cata
ract
Anxi
ety
Diso
rder
s
Schi
zoph
reni
a an
d O
ther
Ps
ycho
tic D
isor
ders
Toba
cco
Use
Dis
orde
rs
Acqu
ired
Hypo
thyr
oidi
sm
Alzh
eim
er’s
Dis
ease
Gla
ucom
a
Ost
eopo
rosi
s
Asth
ma
Bipo
lar D
isor
der
Schi
zoph
reni
a
Stro
ke/T
rans
ient
Isch
emic
At
tack
Atria
l Fib
rilla
tion
NAT’L 61% 39% 35% 34% 33% 31% 25% 25% 23% 19% 19% 17% 15% 15% 12% 12% 10% 9% 9% 8% 8% 8% 7% 7% 6% AK 46% 25% 25% 31% 19% 20% 20% 18% 15% 11% 19% 13% 9% 12% 11% 20% 7% 4% 5% 7% 9% 7% 8% 4% 5% AL 66% 36% 34% 38% 30% 30% 18% 18% 23% 17% 20% 15% 13% 12% 10% 12% 9% 9% 8% 6% 7% 5% 5% 7% 6% AR 59% 30% 30% 33% 31% 24% 23% 22% 23% 18% 21% 13% 13% 15% 11% 13% 9% 9% 7% 7% 6% 6% 5% 8% 6% AZ 50% 28% 33% 26% 22% 19% 13% 13% 13% 7% 13% 16% 11% 8% 5% 8% 9% 3% 6% 6% 7% 4% 3% 3% 4% CA 60% 41% 37% 34% 33% 33% 18% 17% 21% 14% 15% 16% 19% 10% 10% 7% 8% 6% 10% 10% 8% 6% 7% 6% 5% CO 43% 29% 25% 25% 18% 17% 23% 20% 12% 8% 15% 12% 12% 13% 9% 15% 10% 3% 5% 6% 7% 9% 7% 3% 3% CT 59% 39% 34% 29% 31% 31% 31% 30% 21% 26% 17% 17% 18% 17% 17% 10% 11% 13% 10% 9% 9% 10% 11% 8% 9% DC 65% 32% 39% 25% 28% 34% 15% 15% 22% 17% 10% 21% 15% 6% 16% 11% 5% 9% 12% 5% 8% 8% 11% 8% 3% DE 63% 48% 35% 32% 33% 30% 22% 20% 20% 17% 18% 19% 17% 12% 10% 11% 8% 8% 11% 8% 9% 7% 7% 7% 7% FL 65% 46% 38% 39% 44% 40% 31% 29% 25% 22% 24% 18% 17% 16% 13% 11% 10% 12% 10% 10% 8% 7% 8% 8% 7% GA 68% 37% 35% 35% 29% 31% 20% 20% 22% 17% 19% 19% 12% 13% 9% 13% 8% 9% 7% 6% 7% 5% 6% 7% 6% HI 61% 49% 34% 25% 24% 30% 13% 13% 17% 16% 14% 18% 16% 8% 10% 6% 7% 7% 9% 14% 10% 4% 8% 7% 6% IA 65% 34% 35% 36% 35% 30% 26% 25% 30% 32% 24% 18% 19% 13% 11% 7% 15% 14% 8% 9% 6% 4% 4% 7% 11% ID 44% 27% 29% 29% 20% 18% 29% 28% 18% 15% 17% 13% 10% 16% 12% 15% 12% 6% 5% 6% 8% 12% 8% 4% 6% IL 59% 36% 35% 34% 32% 31% 28% 27% 26% 19% 18% 17% 14% 14% 15% 11% 10% 9% 7% 7% 9% 10% 10% 7% 6% IN 57% 33% 34% 32% 31% 29% 31% 30% 24% 21% 23% 17% 14% 19% 16% 15% 12% 11% 6% 8% 8% 9% 8% 7% 6% KS 60% 27% 33% 36% 31% 35% 33% 33% 31% 38% 20% 17% 16% 15% 15% 9% 16% 21% 6% 9% 5% 7% 6% 8% 9% KY 62% 41% 34% 35% 35% 26% 26% 26% 23% 15% 27% 15% 11% 23% 10% 18% 11% 8% 5% 7% 8% 7% 4% 6% 6% LA 68% 37% 35% 37% 33% 30% 22% 21% 24% 17% 20% 18% 12% 13% 10% 11% 9% 9% 8% 7% 8% 5% 6% 9% 6% MA 50% 35% 29% 26% 25% 25% 34% 33% 16% 18% 14% 14% 16% 23% 14% 13% 9% 7% 9% 7% 9% 13% 9% 5% 6% MD 64% 43% 37% 33% 32% 35% 23% 22% 22% 20% 17% 20% 13% 11% 12% 12% 10% 9% 8% 9% 9% 11% 9% 9% 7% ME 52% 42% 28% 25% 28% 21% 29% 27% 15% 12% 17% 13% 16% 19% 7% 15% 12% 5% 9% 7% 6% 9% 4% 4% 7% MI 53% 37% 33% 29% 35% 26% 20% 18% 18% 7% 17% 13% 10% 11% 8% 14% 8% 3% 6% 4% 6% 8% 6% 4% 5% MN 33% 25% 22% 20% 12% 15% 35% 36% 8% 8% 12% 11% 9% 23% 20% 20% 9% 2% 5% 4% 9% 15% 16% 3% 3% MO 61% 37% 35% 40% 32% 26% 34% 32% 24% 19% 26% 18% 15% 20% 14% 17% 12% 10% 7% 8% 10% 11% 9% 8% 7% MS 69% 33% 37% 37% 28% 27% 20% 20% 24% 16% 19% 16% 15% 12% 10% 10% 7% 9% 9% 6% 6% 5% 6% 7% 6%

22
Stat
e
Hype
rten
sion
Hype
rlipi
dem
ia
Diab
etes
Rheu
mat
oid
or O
steo
arth
ritis
Isch
emic
Hea
rt D
isea
se
Anem
ia
Depr
essi
on (A
ny In
stan
ce,
incl
udin
g Bi
pola
r)
Maj
or D
epre
ssiv
e Di
sord
er
Hear
t Fai
lure
Alzh
eim
er’s
Dis
ease
, Rel
ated
Di
sord
ers,
or S
enile
Dem
entia
Chro
nic
Obs
truc
tive
Pulm
onar
y Di
seas
e
Chro
nic
Kidn
ey D
isea
se
Cata
ract
Anxi
ety
Diso
rder
s
Schi
zoph
reni
a an
d O
ther
Ps
ycho
tic D
isor
ders
Toba
cco
Use
Dis
orde
rs
Acqu
ired
Hypo
thyr
oidi
sm
Alzh
eim
er’s
Dis
ease
Gla
ucom
a
Ost
eopo
rosi
s
Asth
ma
Bipo
lar D
isor
der
Schi
zoph
reni
a
Stro
ke/T
rans
ient
Isch
emic
At
tack
Atria
l Fib
rilla
tion
MT 44% 22% 26% 29% 20% 19% 28% 28% 19% 21% 20% 13% 13% 15% 12% 13% 13% 9% 5% 8% 7% 9% 8% 5% 6% NC 64% 39% 36% 31% 27% 30% 23% 22% 20% 17% 19% 19% 15% 16% 11% 14% 9% 8% 9% 7% 9% 7% 7% 7% 6% ND 50% 28% 28% 29% 24% 22% 32% 31% 23% 23% 17% 15% 17% 18% 14% 10% 13% 10% 7% 8% 6% 7% 8% 4% 7% NE 55% 24% 30% 34% 30% 27% 31% 31% 29% 36% 18% 17% 19% 14% 15% 6% 15% 16% 7% 10% 5% 7% 6% 7% 11% NH 48% 35% 29% 27% 24% 22% 39% 37% 17% 22% 19% 13% 13% 25% 15% 18% 12% 12% 7% 8% 8% 11% 9% 6% 7% NJ 66% 45% 39% 35% 43% 40% 23% 22% 28% 27% 18% 18% 18% 13% 13% 8% 10% 14% 11% 10% 9% 7% 9% 9% 8% NM 49% 29% 33% 32% 21% 20% 21% 20% 16% 12% 15% 13% 12% 13% 7% 10% 13% 5% 5% 8% 7% 6% 5% 5% 4% NV 56% 36% 30% 31% 27% 24% 22% 21% 19% 15% 21% 16% 11% 15% 11% 15% 9% 6% 5% 8% 8% 9% 7% 7% 5% NY 61% 43% 37% 34% 40% 39% 23% 23% 25% 22% 17% 17% 18% 12% 13% 8% 11% 10% 13% 10% 9% 7% 9% 8% 7% OH 61% 39% 36% 37% 34% 30% 33% 32% 25% 22% 24% 20% 15% 20% 16% 16% 12% 11% 7% 8% 10% 11% 10% 9% 7% OK 61% 33% 33% 38% 34% 26% 28% 27% 26% 17% 25% 15% 12% 17% 11% 16% 11% 8% 6% 8% 8% 8% 7% 8% 6% OR 42% 28% 26% 22% 19% 17% 23% 22% 15% 12% 14% 13% 9% 13% 9% 16% 9% 5% 4% 5% 7% 7% 7% 4% 5% PA 68% 35% 39% 40% 46% 44% 35% 36% 37% 49% 22% 24% 22% 15% 16% 6% 16% 24% 9% 13% 6% 6% 6% 14% 13% RI 54% 40% 31% 24% 27% 27% 32% 31% 16% 20% 17% 13% 17% 22% 15% 13% 9% 10% 8% 7% 10% 11% 10% 5% 6% SC 65% 38% 35% 31% 27% 29% 19% 18% 21% 17% 17% 19% 13% 14% 9% 13% 8% 9% 8% 6% 8% 5% 6% 7% 5% SD 45% 23% 28% 24% 23% 22% 25% 24% 21% 20% 15% 12% 15% 12% 11% 9% 12% 7% 6% 6% 5% 5% 6% 3% 6% TN 63% 42% 33% 32% 34% 24% 19% 17% 20% 8% 21% 14% 13% 14% 4% 14% 8% 3% 6% 6% 6% 5% 3% 4% 6% TX 67% 42% 41% 38% 40% 36% 27% 25% 28% 23% 17% 19% 16% 15% 10% 9% 12% 12% 9% 11% 6% 6% 5% 8% 6% UT 34% 22% 25% 23% 15% 14% 28% 25% 12% 5% 9% 11% 9% 19% 11% 11% 8% 1% 3% 4% 7% 10% 9% 3% 3% VA 63% 39% 36% 31% 28% 29% 24% 24% 21% 19% 19% 18% 11% 16% 12% 16% 10% 9% 7% 8% 9% 8% 8% 8% 6% VT 45% 31% 27% 25% 24% 20% 28% 28% 15% 14% 16% 11% 13% 18% 8% 14% 10% 6% 7% 5% 7% 7% 5% 5% 7% WA 38% 23% 27% 20% 17% 15% 23% 22% 11% 6% 12% 11% 9% 14% 10% 14% 6% 2% 5% 3% 7% 11% 8% 4% 4% WI 48% 31% 28% 29% 22% 22% 29% 28% 19% 20% 14% 16% 14% 17% 14% 14% 11% 9% 7% 7% 8% 9% 9% 4% 7% WV 58% 41% 33% 31% 33% 24% 29% 28% 19% 14% 25% 15% 10% 22% 9% 15% 11% 8% 5% 6% 7% 8% 5% 5% 6% WY 42% 20% 27% 27% 23% 17% 28% 28% 20% 19% 22% 11% 13% 12% 10% 13% 14% 7% 4% 8% 6% 8% 5% 5% 6%
Source: CY 2008 CCW Medicare and Medicaid data, FFS enrollees with at least six months enrollment in Medicare Parts A and B.
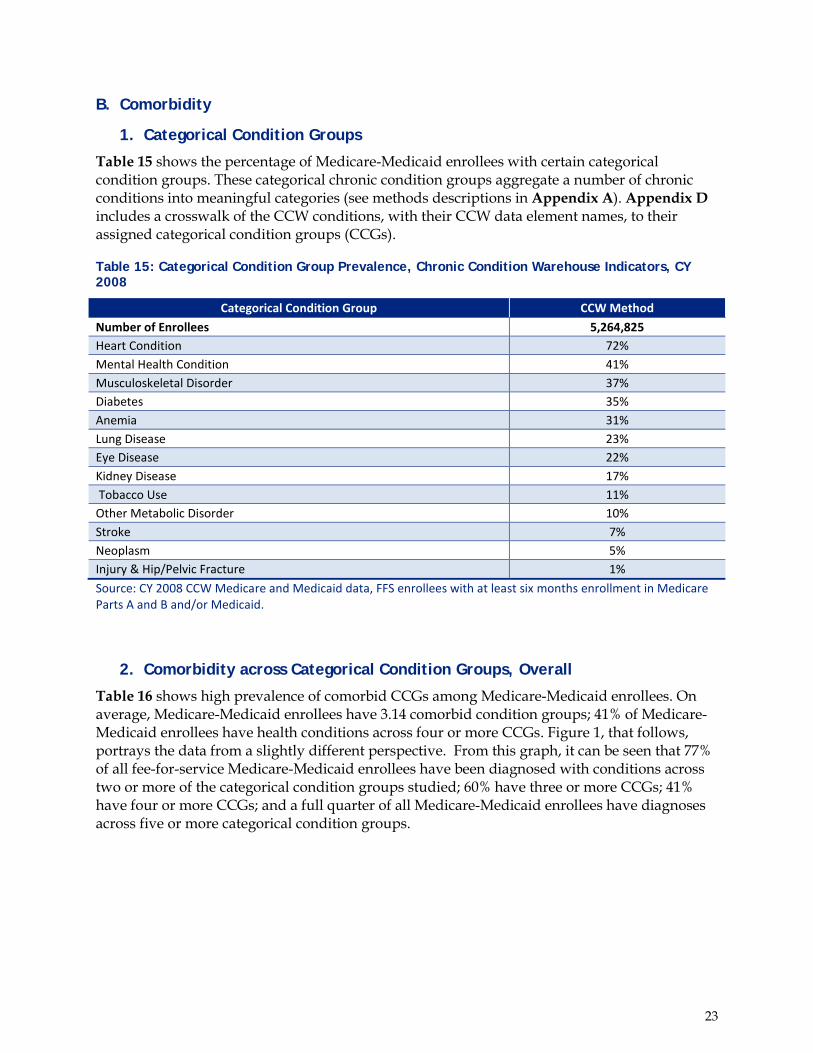
23
B. Comorbidity
1. Categorical Condition Groups
Table 15 shows the percentage of Medicare-Medicaid enrollees with certain categorical condition groups. These categorical chronic condition groups aggregate a number of chronic conditions into meaningful categories (see methods descriptions in Appendix A). Appendix D includes a crosswalk of the CCW conditions, with their CCW data element names, to their assigned categorical condition groups (CCGs).
Table 15: Categorical Condition Group Prevalence, Chronic Condition Warehouse Indicators, CY 2008
Categorical Condition Group CCW Method Number of Enrollees 5,264,825 Heart Condition 72% Mental Health Condition 41% Musculoskeletal Disorder 37% Diabetes 35% Anemia 31% Lung Disease 23% Eye Disease 22% Kidney Disease 17% Tobacco Use 11% Other Metabolic Disorder 10% Stroke 7% Neoplasm 5% Injury & Hip/Pelvic Fracture 1% Source: CY 2008 CCW Medicare and Medicaid data, FFS enrollees with at least six months enrollment in Medicare Parts A and B and/or Medicaid.
2. Comorbidity across Categorical Condition Groups, Overall
Table 16 shows high prevalence of comorbid CCGs among Medicare-Medicaid enrollees. On average, Medicare-Medicaid enrollees have 3.14 comorbid condition groups; 41% of Medicare-Medicaid enrollees have health conditions across four or more CCGs. Figure 1, that follows, portrays the data from a slightly different perspective. From this graph, it can be seen that 77% of all fee-for-service Medicare-Medicaid enrollees have been diagnosed with conditions across two or more of the categorical condition groups studied; 60% have three or more CCGs; 41% have four or more CCGs; and a full quarter of all Medicare-Medicaid enrollees have diagnoses across five or more categorical condition groups.
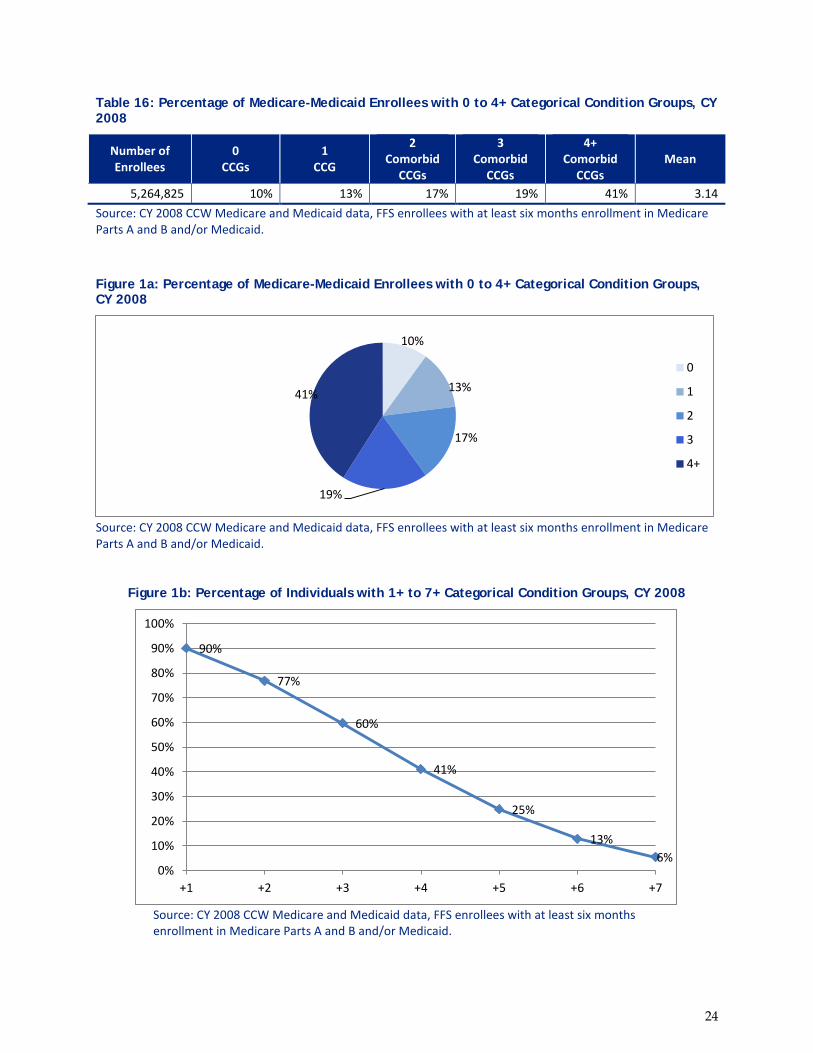
24
Table 16: Percentage of Medicare-Medicaid Enrollees with 0 to 4+ Categorical Condition Groups, CY 2008
Number of Enrollees
0 CCGs
1 CCG
2 Comorbid
CCGs
3 Comorbid
CCGs
4+ Comorbid
CCGs Mean
5,264,825 10% 13% 17% 19% 41% 3.14 Source: CY 2008 CCW Medicare and Medicaid data, FFS enrollees with at least six months enrollment in Medicare Parts A and B and/or Medicaid.
Figure 1a: Percentage of Medicare-Medicaid Enrollees with 0 to 4+ Categorical Condition Groups, CY 2008
Source: CY 2008 CCW Medicare and Medicaid data, FFS enrollees with at least six months enrollment in Medicare Parts A and B and/or Medicaid.
Figure 1b: Percentage of Individuals with 1+ to 7+ Categorical Condition Groups, CY 2008
Source: CY 2008 CCW Medicare and Medicaid data, FFS enrollees with at least six months
enrollment in Medicare Parts A and B and/or Medicaid.
10%
13%
17%
19%
41%
0
1
2
3
4+
90%
77%
60%
41%
25%
13% 6%
0%
10%
20%
30%
40%
50%
60%
70%
80%
90%
100%
+1 +2 +3 +4 +5 +6 +7

25
3. Per Member per Month (PMPM) Expenditures by Number of Comorbid CCGs
This section illustrates the relationship between comorbidity and healthcare expenditures. We computed the per member per month (PMPM) expenditures for each member of the study population by dividing person-level total Medicare and Medicaid spending by the beneficiary’s total months of eligibility within 2008. Table 24 and Figure 5 show the PMPM expenditures for enrollees with up to 12 comorbid CCGs identified by number of CCGs.
It is apparent from these data that expenditures escalate rapidly with comorbidity. Total PMPM costs nearly double between the no chronic conditions group and the two comorbid conditions group; total PMPM spending roughly double again between the two and the five comorbid CCGs. These data show the impact of multi-morbidity on member Medicaid, Medicare, and total PMPM expenditures and the total estimated expenditures in this Medicare-Medicaid enrollee population. Figure 5 shows that as the number of comorbid CCGs increases, the Medicare and Medicaid total costs of care increase almost exponentially.
Table 24: Per Member per Month (PMPM) Cost by Number of Categorical Condition Groups, CY 2008
CCG Count
Medicaid PMPM
Medicare PMPM
Total PMPM
Number of Enrollees
Total Expenditures
0 $692 $183 $875 521,556 $456,361,500
1 $922 $464 $1,386 693,798 $961,604,028
2 $923 $705 $1,628 906,020 $1,475,000,560
3 $1,036 $1,074 $2,110 978,892 $2,065,462,120
4 $1,240 $1,661 $2,901 858,276 $2,489,858,676
5 $1,473 $2,467 $3,940 628,392 $2,475,864,480
6 $1,684 $3,491 $5,175 384,733 $1,990,993,275
7 $1,859 $4,664 $6,523 193,033 $1,259,154,259
8 $2,008 $5,885 $7,893 74,836 $590,680,548
9 $2,105 $7,012 $9,116 20,906 $190,579,096
10 $2,168 $7,803 $9,971 3,942 $39,305,682
11 $2,363 $8,796 $11,158 412 $4,597,096
12 $2,673 $10,335 $13,008 29 $377,232 Source: CY 2008 CCW Medicare and Medicaid data, FFS enrollees with at least six months enrollment in Medicare Parts A and B and/or Medicaid.

26
Figure 5: Total per Member per Month (PMPM) Cost by Number of Categorical Condition Groups, CY 2008
Source: CY 2008 CCW Medicare and Medicaid data, FFS enrollees with at least six months enrollment in Medicare Parts A and B and/or Medicaid.
4. Comorbidity, by Subpopulations
Among different subgroups of Medicare-Medicaid enrollees, there is considerable variation in the extent to which conditions are co-occurring or comorbid with each other. In this section, we analyze the numbers of and means of comorbid CCGs among enrollee subgroups, identifying subgroups on the basis of race, age, sex, LTC status, original reason for Medicare eligibility, Medicaid basis of eligibility, and Medicare-Medicaid eligibility type.
a. Race/Ethnicity
As seen in Table 17, Asian/Pacific Islander beneficiaries have the highest total percentage of beneficiaries with one or more CCGs, and a notably higher proportion having 2 or 3 comorbid conditions (45%) than the other race groups (ranging from 35-37%). Among those with four or more comorbid conditions, White, African American and Hispanic Medicare-Medicaid enrollees have the highest proportions, at 41-42%.
$875 $1,386 $1,628
$2,110 $2,901
$3,940
$5,175
$6,523
$7,893
$9,116 $9,971
$11,158
$13,008
$0
$2,000
$4,000
$6,000
$8,000
$10,000
$12,000
$14,000
0 1 2 3 4 5 6 7 8 9 10 11 12 13 14 15 16 17
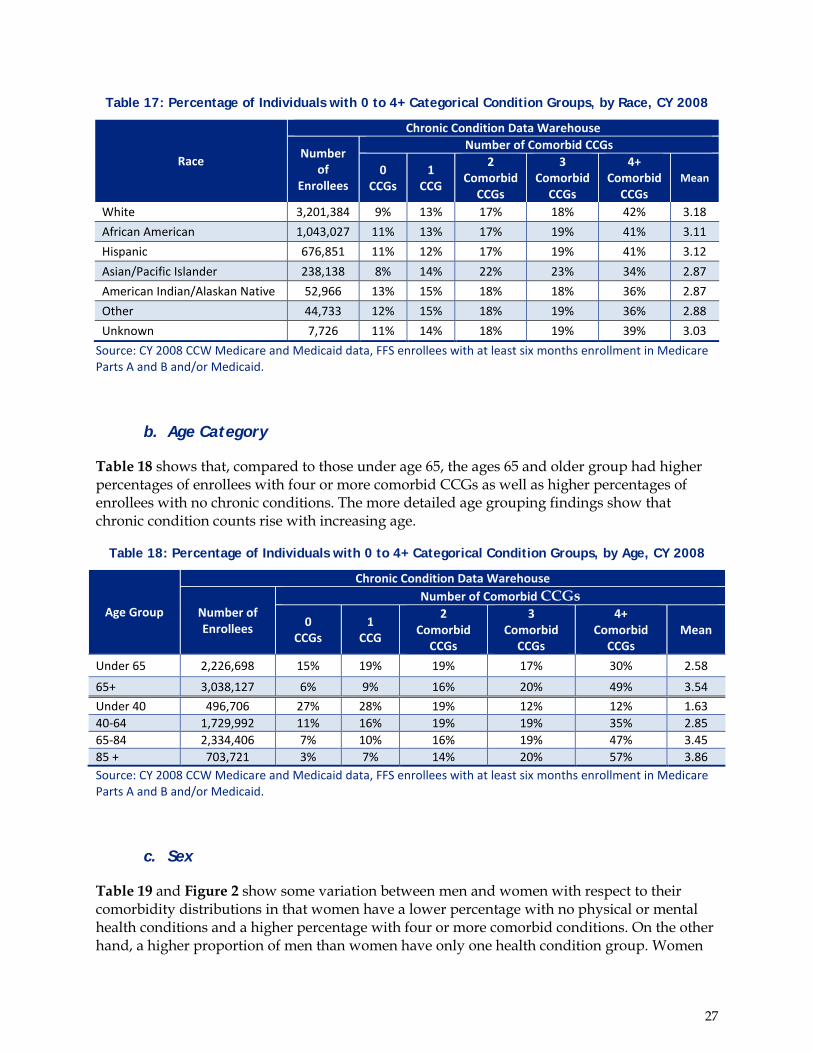
27
Table 17: Percentage of Individuals with 0 to 4+ Categorical Condition Groups, by Race, CY 2008
Race
Chronic Condition Data Warehouse
Number of
Enrollees
Number of Comorbid CCGs
0 CCGs
1 CCG
2 Comorbid
CCGs
3 Comorbid
CCGs
4+ Comorbid
CCGs Mean
White 3,201,384 9% 13% 17% 18% 42% 3.18 African American 1,043,027 11% 13% 17% 19% 41% 3.11 Hispanic 676,851 11% 12% 17% 19% 41% 3.12 Asian/Pacific Islander 238,138 8% 14% 22% 23% 34% 2.87 American Indian/Alaskan Native 52,966 13% 15% 18% 18% 36% 2.87 Other 44,733 12% 15% 18% 19% 36% 2.88 Unknown 7,726 11% 14% 18% 19% 39% 3.03
Source: CY 2008 CCW Medicare and Medicaid data, FFS enrollees with at least six months enrollment in Medicare Parts A and B and/or Medicaid.
b. Age Category
Table 18 shows that, compared to those under age 65, the ages 65 and older group had higher percentages of enrollees with four or more comorbid CCGs as well as higher percentages of enrollees with no chronic conditions. The more detailed age grouping findings show that chronic condition counts rise with increasing age.
Table 18: Percentage of Individuals with 0 to 4+ Categorical Condition Groups, by Age, CY 2008
Age Group
Chronic Condition Data Warehouse
Number of Enrollees
Number of Comorbid CCGs
0 CCGs
1 CCG
2 Comorbid
CCGs
3 Comorbid
CCGs
4+ Comorbid
CCGs Mean
Under 65 2,226,698 15% 19% 19% 17% 30% 2.58
65+ 3,038,127 6% 9% 16% 20% 49% 3.54 Under 40 496,706 27% 28% 19% 12% 12% 1.63 40-64 1,729,992 11% 16% 19% 19% 35% 2.85 65-84 2,334,406 7% 10% 16% 19% 47% 3.45 85 + 703,721 3% 7% 14% 20% 57% 3.86 Source: CY 2008 CCW Medicare and Medicaid data, FFS enrollees with at least six months enrollment in Medicare Parts A and B and/or Medicaid.
c. Sex
Table 19 and Figure 2 show some variation between men and women with respect to their comorbidity distributions in that women have a lower percentage with no physical or mental health conditions and a higher percentage with four or more comorbid conditions. On the other hand, a higher proportion of men than women have only one health condition group. Women

28
and men are relatively similar in the extent to which they have two or three comorbid CCGs. Displayed a different way, Figure 2 shows that women have consistently higher cumulative frequencies of CCGs than men; though, at very high numbers (e.g., 7+ CCGs) these proportions converge.
Table 19: Percentage of Individuals with 0 to 4+ Categorical Condition Groups, by Sex, CY 2008
Sex
Chronic Condition Data Warehouse
Number of Enrollees
Number of Comorbidities
0 CCGs
1 CCG
2 Comorbid
CCGs
3 Comorbid
CCGs
4+ Comorbid
CCGs Mean
Female 3,237,886 7% 11% 16% 20% 46% 3.39 Male 2,026,939 15% 17% 18% 17% 33% 2.73 Source: CY 2008 CCW Medicare and Medicaid data, FFS enrollees with at least six months enrollment in Medicare Parts A and B and/or Medicaid.
Figure 2: Percentage of Individuals by Number of Categorical Condition Groups, by Sex, CY 2008
Source: 2008 CCW Medicare and Medicaid data, FFS enrollees with at least six months enrollment in Medicare Parts A and B and/or Medicaid.
d. Long-Term Care Status
Table 20 shows comorbidity prevalence by LTC utilization: no institutional care, one to two months of institutional care, over three months of institutional care, and institutional care for the entire period of eligibility. Please note that these results should be interpreted with caution due to possible differences in coding practices between ambulatory and institutional settings. However, from these findings, one can safely conclude that, not surprisingly, enrollees using no institutional care had the lowest numbers of conditions and comorbid CCGs.

29
Table 20: Percentage of Individuals with 0 to 4+ Categorical Condition Groups, by Long-Term Care Status, CY 2008
LTC Status
Chronic Condition Data Warehouse
Number of
Enrollees
Number of Comorbidities
0 CCGs
1 CCG
2 Comorbid
CCGs
3 Comorbid
CCGs
4+ Comorbid
CCGs Mean
No Institutional Care 4,189,236 12% 15% 19% 20% 34% 2.78
1-2 Institutional Months
173,423 1% 2% 6% 12% 79% 4.93
3+ Institutional Months
205,813 1% 2% 6% 11% 80% 5.11
Institutional Entire Period
696,353 2% 5% 10% 17% 65% 4.26
Source: CY 2008 CCW Medicare and Medicaid data, FFS enrollees with at least six months enrollment in Medicare Parts A and B and/or Medicaid.
e. Original Reason for Medicare Eligibility
There are four bases for Medicare eligibility. Table 21 shows comorbidity prevalence by Medicare reason for eligibility: ages 65 and older, disability, and end stage renal disease (ESRD). About three quarters of Medicare-Medicaid enrollees qualifying for Medicare based on an ESRD diagnosis have at least three additional other chronic health conditions in addition to their CKD/ESRD. Almost half of enrollees eligible for Medicare due to age have four or more comorbid CCGs (48%), compared to just over a third of enrollees eligible due to disability (34%). Substantial differences also exist in the percentage of enrollees with no comorbid CCGs between Medicare eligibility due to age (7%) compared to eligibility based on disability (13%).
Table 21: Percentage of Individuals with 0 to 4+ Categorical Condition Groups, by Original Reason for Medicare Entitlement, CY 2008
Medicare Original Reason for Eligibility
Chronic Condition Data Warehouse
Number of Enrollees
Number of Comorbidities
0 CCGs
1 CCG
2 Comorbid
CCGs
3 Comorbid
CCGs
4+ Comorbid
CCGs Mean
65+ 2,414,210 7% 9% 16% 20% 48% 3.47 Disability 2,762,196 13% 17% 18% 18% 34% 2.80 End Stage Renal Disease (ESRD) 33,992 1% 2% 6% 17% 74% 4.50
Disability & Current ESRD 54,427 1% 1% 5% 17% 76% 4.58
Source: CY 2008 CCW Medicare and Medicaid data, FFS enrollees with at least six months enrollment in Medicare Parts A and B and/or Medicaid.

30
f. Basis of Medicaid Eligibility
Similar to Medicare reason for eligibility, Table 22 shows the comorbidity prevalence and counts for Medicare-Medicaid enrollees by Medicaid basis of eligibility. The groups with the highest prevalence of having two or more conditions groups are the age 65+ group at 86% and the breast and cervical cancer group at 85%. At 70%, the blind/disability group comes in third for the proportion diagnosed with conditions spanning at least two condition groups. Similarly, the mean number of comorbid CCGs is 3.55 for the 65+ group, 3.28 for the breast and cervical cancer group, and 2.73 for the blind/disabled group.
Table 22: Percentage of Individuals with 0 to 4+ Categorical Condition Groups, by Medicaid Basis of Eligibility Status, CY 2008
Medicaid Basis of Eligibility Group
Chronic Condition Data Warehouse
Number of Enrollees
Number of Comorbidities
0 CCGs
1 CCG
2 Comorbid
CCGs
3 Comorbid
CCGs
4+ Comorbid
CCGs Mean
65+ 2,631,974 6% 9% 16% 20% 50% 3.55
Blind/Disability 2,380,523 13% 17% 19% 18% 33% 2.73
Adult 36,923 17% 23% 21% 17% 21% 2.18
Breast & Cervical Cancer 521 3% 12% 22% 19% 44% 3.28
Child 312 22% 22% 19% 18% 18% 1.96
Foster Care Child 146 39% 28% 10% 10% 12% 1.38
Unemployed Adult 62 31% 15% 19% 13% 23% 2.10 Source: CY 2008 CCW Medicare and Medicaid data, FFS enrollees with at least six months enrollment in Medicare Parts A and B and/or Medicaid.
g. Medicare-Medicaid Enrollee Status
Table 23 shows chronic condition counts by Medicare-Medicaid enrollee type. The data show the highest comorbidity counts and means for Full Benefit Medicare-Medicaid enrollees and the lowest counts and means for those with partial benefits. Specifically, at 3.25 CCGs on average, Full Benefit dual enrollees appear to be responsible for driving the overall average of 3.14; QMB-only and other Partial Benefit Medicare-Medicaid enrollees had lower mean CCG counts, on average, at 2.88 and 2.71 respectively. In addition, 44% of Full Benefit enrollees had four or more comorbid CCGs, compared to 35% and 32% of QMB-only and other Partial Benefit enrollees respectively.

31
Table 23: Percentage of Individuals with 0 to 4+ Categorical Condition Groups, by Enrollee Type, CY 2008
Medicare-Medicaid Enrollee
Type
Chronic Condition Data Warehouse
Number of Enrollees
Number of Comorbidities
0 CCGs
1 CCG
2 Comorbid
CCGs
3 Comorbid
CCGs
4+ Comorbid
CCGs Mean
Full Benefit 3,961,007 9% 13% 16% 18% 44% 3.25
QMB-only 671,462 11% 15% 19% 20% 35% 2.88
Partial Benefit 632,356 13% 15% 20% 20% 32% 2.71 Source: CY 2008 CCW Medicare and Medicaid data, FFS enrollees with at least six months enrollment in Medicare Parts A and B and/or Medicaid. Note: While “QMB-only” Medicare-Medicaid enrollees are technically considered “partial benefit,” in this report the QMB-only enrollment category is presented separately from “partial benefit” category, which refers only to all other types of partial benefit Medicare-Medicaid enrollees: Specified Low-income Medicare Beneficiaries (i.e., “SLMB-only”), Qualified Disabled Working Individuals (i.e., “QDWI”), and Qualifying Individuals (i.e., “QI”).
5. Prevalence of Specific Pairs of Comorbid Conditions
This study found high prevalence of comorbidity among Medicare-Medicaid enrollees, particularly among those over age 65. In this section, we explore specific pairs of conditions that are most prevalent and associated with highest expenditures. These types of analyses are helpful for identifying combinations of conditions for which effective targeted interventions may have the greatest potential impact on beneficiary health.
Table 25 shows pairs of co-occurring conditions where each column shows the percentage with the column chronic condition that also has the chronic condition category indicated in each row. For example, this table shows that 92% of Medicare-Medicaid enrollees who have diabetes (column) also have a heart condition (row). Alternatively, 45% of individuals with a heart condition (column) have co-occurring diabetes (row). The number of enrollees with each given combination of chronic conditions is the same in all instances; for example, there are 1.8 million enrollees with diabetes and approximately 3.8 million with a heart condition. The 1.7 million Medicare-Medicaid enrollees with both diabetes and a heart condition comprise 92% of the 1.8 million with diabetes, as compared to the mere 45% of the 3.8 million with a heart condition.
Reflecting the highest CCG prevalence rates presented earlier, the five most common co-occurring condition groups were found to be: heart conditions, mental health conditions, anemia, musculoskeletal disorders and diabetes.
This table reveals that heart-related conditions are, by far, the most highly co-occurring condition group studied. Over two-thirds of enrollees with any given condition also have a heart condition; for example, 95% of enrollees who have had a stroke and 95% of enrollees who have kidney disease also have one or more heart conditions. Proportionately, however, fewer individuals with a heart condition have other comorbid conditions.

32
Mental health conditions are the second most frequent co-occurring CCG. One or more mental health conditions were found to co-occur in 54% of those with a history of stroke, 61% of those with hip or pelvic fracture, 52% of those with lung disease and 55% of those with a metabolic disorder. In addition, 63% of those with an indication of tobacco use on their claims also had evidence of one or more mental health condition. In addition, mental health conditions were found to co-occur in no less than 39% of Medicare-Medicaid enrollees across all other CCGs studied.
The third most co-occurring CCG is the category of anemia which was found to co-occur in 53% of Medicare-Medicaid enrollees with stroke, 75% of those with a hip or pelvic fracture and 65% of those with kidney disease.
Table 25: Prevalence of Comorbidity Pairs, CY 2008
Categorical Chronic Condition Group Denominator
CCW Comorbidity Analysis (%)
Men
tal H
ealth
Co
nditi
on
Ane
mia
Str
oke
Dia
bete
s
Eye
Dise
ase
Hea
rt C
ondi
tion
Hip
/Pel
vic
Frac
ture
Kid
ney
Dise
ase
Lun
g Di
seas
e
Mus
culo
skel
etal
Di
sord
er
Neo
plas
m
Oth
er M
etab
olic
Di
sord
er
Tob
acco
Use
Mental Health Condition 47 54 42 39 42 61 45 52 46 40 55 63
Anemia 36 53 43 39 38 75 65 42 41 49 48 29
Stroke 9 12 10 9 9 16 14 10 9 10 11 7
Diabetes 36 49 51 43 45 40 60 43 41 42 42 32
Eye Disease 21 28 29 27 26 26 26 24 28 29 27 15
Heart Condition 75 90 95 92 86 93 95 87 87 88 87 74 Injury Hip/Pelvic Fracture 2 3 3 1 2 2 2 2 2 2 3 1
Kidney Disease 18 36 34 29 20 22 32 25 21 26 25 18
Lung Disease 30 31 33 28 26 28 36 34 31 35 31 48 Musculoskeletal Disorder 42 50 48 44 48 45 66 45 49 47 50 38
Neoplasm 6 9 8 7 7 7 10 9 8 7 7 7 Other Metabolic Disorder 13 15 15 12 12 12 21 15 14 13 12 9
Tobacco Use 18 11 12 11 8 12 10 12 24 12 13 10
Source: CY 2008 CCW Medicare and Medicaid data, FFS enrollees with at least six months enrollment in Medicare Parts A and B and/or Medicaid.

33
Conclusion and Next Steps
In this paper, we explored physical and mental health condition prevalence and comorbidity among FFS-enrolled Medicare-Medicaid enrollees. Not surprisingly, we found a 90% of Medicare-Medicaid enrollees to have one or more diagnoses across at least one CCG category.
In general, the data show higher prevalence of physical health conditions among enrollees 65 years of age and older and higher prevalence of mental health conditions among enrollees under age 65 and with disability.
We found high prevalence of comorbidity in this FFS Medicare-Medicaid dually enrolled population, with 77% of Medicare-Medicaid enrollees having two or more conditions and 41% having four or more of the conditions studied. Subgroup analysis revealed particularly high numbers of comorbid conditions among Medicare-Medicaid beneficiaries in LTC facilities in 2008, a finding that was particularly true for depressive disorders. Prevalence was also generally higher among older enrollees, female enrollees, enrollees of Asian/Pacific Islander descent and Full Benefit enrollees. Per member per month Medicare and Medicaid expenditures were found to escalate as the numbers of comorbid conditions increase, with the sharpest escalation at the point of four or more comorbid conditions. Upon studying the range of possible pairs of co-occurring condition groups, heart-related conditions and mental health conditions were found to be the two categorical condition groups that most frequently co-occurred with other condition groups, with heart-related conditions co-occurring in 74% to 95% and mental health conditions co-occurring in 39% to 63% of all other categorical condition groups.
This FFS-study on diagnosed chronic physical and mental health conditions included those physical and mental health conditions that are available as variables in the CCW. We recognize that this is not necessarily an exhaustive list of all possible chronic conditions. Future work will build on analyses presented in this report by exploring the prevalence of additional health conditions, including substance abuse disorders, HIV/AIDS, viral hepatitis and potentially disabling conditions, among others.16
It is the hope and intention of CMS that States, consumer advocacy organizations and researchers will take the high-level national analyses presented in this report to a deeper level, by employing the Medicare-Medicaid Linked Enrollee Analytic Data Source (MMLEADS) or other data resources to better understand the physical and mental health conditions and comorbidities affecting Medicare-Medicaid dually enrolled populations and pertinent subpopulations and conditions at specific state and regional levels. Ultimately CMS hopes that these and subsequent findings be used to further identify and address through policy and programmatic change, areas in which there is potential for improved outcomes and cost for Medicare-Medicaid enrollees and specific subpopulations thereof.
16 While conditions that are often associated with physical and intellectual disability are now available as CCW flags or indicators, they were not available at the time of this analysis. Additional CCW condition flags will also be available later in 2014.

34
Appendix A: Methodology
This report was prepared for the CMS Medicare-Medicaid Coordination Office by The Lewin Group, Inc.
A. Study population
Our ultimate study population was the result of several sequential exclusions that we imposed on the data. First, the study was limited to individuals who were co-enrolled in Medicare and Medicaid for one or more months in calendar year 2008. Among this group of “ever-enrolled” Medicare-Medicaid enrollees, we limited the study to those with a minimum of six or more months of Medicare or Medicaid eligibility status during calendar year 2008 (CY 2008) because longer periods of enrollment increase the likelihood that enrollees will seek medical care during their enrollment period. Medicare enrollees also had to be enrolled in both the Medicare Part A and B programs during their period of Medicare eligibility. Enrollment in Medicare Parts A and B ensured that we did not miss an entire category of claims for enrollees.17 For example, claims for an enrollee only participating in Medicare Part A would necessarily omit all physician claims since Part A does not cover outpatient physician services. These inclusion criteria decrease the likelihood that the CCW indicators would fail to identify the studied conditions among our study population.
In addition, we excluded enrollees who were ever enrolled in either a Medicare managed care plan or Medicaid comprehensive risk-based or behavioral health managed care program at any time during CY 2008. The study was limited to FFS because the completeness and accuracy of Medicaid encounter data varies by state18 and Medicare encounter data had not yet started being collected during this study period.
All in all, the inclusion criteria produce a study population of 5,264,825, representing 59% of all Medicare-Medicaid enrollees (8,961,506). The characteristics of the study population are quite similar to those of all Medicare-Medicaid enrollees in terms of age, sex, race, and Medicare and Medicaid eligibility (as shown in Table A-1, subsection C). Appendix B provides additional detail about our study population inclusion criteria and discusses the implications of our inclusion criteria for the findings.
17 Medicare Part D was not factored in because prescription drug claims do not include diagnosis information. 18 Claims data track the services provided to individuals; since provider reimbursement is conditional upon submission of accurate and complete claims, claims data for FFS enrollees tend to be quite comprehensive. Managed care organizations (MCOs) submit encounter data to provide information about managed care member utilization and costs. Because reimbursement is not conditional upon receipt of encounter data, these data may be less complete than FFS claims data. During a previous study, we found that the quality and comprehensiveness of 2008 Medicaid encounter data varied by state, but we were unable to determine whether these gaps were a function of incomplete encounter data, or if they suggested gaps in the delivery of care to enrollees. For an in-depth discussion, see “Evaluating Encounter Data Completeness.: For Researchers using the Centers for Medicare & Medicaid Services’ Chronic Condition Data Warehouse (CCW).”

35
B. Data Sources
Our analyses employed several data files that are housed within the CCW.19 These files include: the Medicare-Medicaid Linked Enrollee Analytic Data Source (MMLEADS), the Timeline file, and the Geographic Variation Database Files (GVDB) Part A claim files. Appendix C provides a description of the key variables and the associated logic used to identify the study population and defines these subpopulation characteristics for the calculation of prevalence.
C. Enrollee Dimensions
The study population includes 5.3 million Medicare-Medicaid enrollees who satisfied the inclusion criteria. Table A-1 presents the demographic characteristics of our Medicare-Medicaid enrollee study population. Please see Appendix B for a comparison of demographic characteristics between our study population and the larger population of Medicare-Medicaid dual enrollees.
Three quarters of our study population qualified for Medicare, full Medicaid benefits and Medicaid assistance with Medicare cost-sharing. The remaining quarter of partial benefit Medicare-Medicaid enrollees were split almost evenly between “Qualified Medicare Beneficiaries” and beneficiaries eligible for other partial benefits.20 Our study population is somewhat evenly split between those under age 65 and with disability (42%) and those ages 65 and older (57.5%). Thirteen percent were 85 years of age and older. Women comprise 61.5% of Medicare-Medicaid enrollees in our study population. The three largest racial groups account for 94% of the total study population: White (61%), African American (20%), and Hispanic (13%). Almost 80% of the study population used no institutional care in 2008; among the 20% of Medicare-Medicaid enrollees who utilized these services at any time over the year, 65% spent the entire year in a LTC institution such as a nursing facility, a LTC mental hospital for the aged, a long-term inpatient psychiatric facility for those less than 21 years of age, or an intermediate care facility for individuals with developmental disabilities. While most Medicare-Medicaid enrollees were over the age 65, more than half (54%) originally qualified for Medicare based on disability or ESRD. For Medicaid basis of eligibility, the proportion qualifying due to
19 The CCW was originally developed to house all Medicare claims data plus indicators for 21 chronic conditions for all Medicare-beneficiaries, plus another six conditions that were subsequently added. The CCW has undergone multiple other enhancements as well, such as the inclusion of Medicaid claims data, Medicare home health and nursing home assessment data, and the development of a timeline file. Most recently, the Medicare-specific flags have been extended to Medicaid-only and Medicare-Medicaid enrollees, and indicators of severe and persistent mental illness have been built for all Medicare, Medicaid and dually eligible beneficiaries. Indicators for conditions that are often associated with developmental, intellectual and physical disabilities have also been added to the CCW for all beneficiaries; however these were not available at the time this data analysis was performed. The original 27 chronic conditions have observation periods ranging from one to three years, while the mental health and disability-related conditions have two year look back periods. Note that depression is an indicator in both sets: in the first set it encompasses all instances of depression (including depressive episodes occurring with bipolar disorder) over one year, while in the second set it is limited to major depressive disorder types 1 or 2, but with an observation period of two years of claims. 20 Partial benefit Medicare-Medicaid enrollees include individuals receiving Medicare benefits through one of the following programs: specified low-income Medicare beneficiaries (SLMB-only), qualified disabled working individual (QDWI), and qualifying individual (QI).

36
Table A-1: Medicare-Medicaid Enrollee FFS Study population Characteristics, CY 2008
Enrollees (5,264,825) Percentage
Medicare-Medicaid Eligibility Status Type Full Benefit 3,961,007 75.2% Qualified Medicare Beneficiary (QMB-only) 671,462 12.7% Partial Benefit 632,356 12.0%
Age Category Under 65 2,226,698 42.3% 65 and Over 3,038,127 57.5%
Detailed Age Category Under 40 496,706 9.4% 40-64 1,729,992 32.9% 65-84 2,334,406 44.3% 85 and Over 703,721 13.4%
Sex Female 3,237,886 61.5% Male 2,026,939 38.5%
Research Triangle Institute (RTI) Race Code White 3,201,384 60.8% African American 1,043,027 19.8% Hispanic 676,851 12.9% Asian/Pacific Islander 238,138 4.5% American Indian/Alaskan Native 52,966 1.0% Other 44,733 0.8% Unknown 7,726 0.1%
Length of Institutional Long-Term Care No Institutional LTC 4,189,236 79.6% 1-2 Months of Institutional LTC 173,423 3.3% 3+ Months of Institutional LTC 205,813 3.9% Institutional LTC Entire Period 696,353 13.2%
Original Reason for Medicare Eligibility Code 65+ 2,414,210 45.9% Disability 2,762,196 52.5% End Stage Renal Disease (ESRD) 33,992 0.6% Disability & ESRD 54,427 1.0%
Most Recent Annual Medicaid Basis of Eligibility 65+ 2,631,974 50.0% Blind/Disability 2,380,523 45.2% Adult 36,923 0.70% Other 215,405 4.10%
Source: CY 2008 CCW Medicare and Medicaid data, FFS enrollees with at least six months enrollment in Medicare Parts A and B. Note: While “QMB-only” Medicare-Medicaid enrollees are technically considered “partial benefit,” in this report the QMB-only enrollment category is presented separately from “partial benefit” category, which refers only to all other types of partial benefit Medicare-Medicaid enrollees: Specified Low-income Medicare Beneficiaries (i.e., “SLMB-only”), Qualified Disabled Working Individuals (i.e., “QDWI”), and Qualifying Individuals (i.e., “QI”).

37
disability (45%) more closely mirrors the proportion of Medicare-Medicaid enrollees currently under age 65 (42%).
D. Data Preparation Procedures
We used the MMLEADS Medicare and Medicaid beneficiary characteristics file to define our study population. After applying the exclusion criteria defined in Section A, we merged (by beneficiary ID) member characteristics with the condition variables that are contained on the MMLEADS chronic condition file, matching on 100% of observations. The selected physical and mental health conditions for this study included those that had CCW indicators already developed and present within the CCW. These variables identify conditions using a combination of Medicaid and Medicare claims information.
Each combined CCW condition variable has one of four possible values for each beneficiary:
0 – Claims and enrollment criteria not met 1 – Claims criteria met, enrollment criteria not met 2 – Claims criteria not met, enrollment criteria met 3 – Claims and enrollment criteria met
In computing the prevalence, we counted enrollees with a reported value of either 1 or 3 as having the condition. The enrollment criteria used in the CCW algorithm requires an enrollee to be eligible for two years in order to meet the enrollment criteria. Since our study population criteria only required enrollees to be eligible for six months, we considered enrollees to have any given condition if they were eligible for at least six months but less than two years and met the claims criteria for the condition (i.e., enrollees with a value of 1).
One of the enrollee characteristics reported in our findings is state of residence. The MMLEADS beneficiary characteristics file report both a Medicare and Medicaid state of residence. In the results that follow, we used derived state code, which for Medicare-Medicaid enrollees is based upon the Medicaid state.
This report presents descriptive data showing prevalence of select health and mental health conditions for individuals dually enrolled in Medicare and Medicaid in 2008. Chronic condition prevalence measures the number of people with a certain disease, disorder, or condition within a specified population at a specific time.21 Condition prevalence can be measured in multiple ways using methods such as patient surveys or medical record reviews. Since our measure of prevalence is based on claims data, our method captures conditions for which individuals sought and/or received medical care as well as situations in which individuals received care for some other condition, illness or accident and a given study condition was coded by a provider in a non-primary diagnosis field.
21 Timmreck, TC. An Introduction to Epidemiology. Jones & Bartlett Learning, 2002.

38
Due to our sample size of more than five million people, even extremely small differences in summary statistics between groups have very small 95% confidence limits and are statistically significant at conventional alpha error tolerance levels. As a result, we do not include confidence intervals or p-values in the data tables of these descriptive statistics. However, we have taken the liberty to call attention – using bolded font – to some findings that are substantially larger than the “Overall [Row] Prevalence” for any given table.
E. From Conditions to Comorbidity
To generate counts of comorbid CCGs, we combined the CCW variables into broader disease groups or categorical conditions groups (CCGs). We classified 32 CCW chronic conditions into 13 CCGs. Appendix D includes a table that shows which specific CCW chronic conditions fall into each CCG. We identified which CCGs each enrollee had and used the number of CCGs to identify the number of comorbid CCGs per enrollee.

39
Appendix B: Study population
This Appendix provides additional detail about the inclusion criteria defining the study populations. The Appendix first shows the percentage of Medicare-Medicaid enrollees included in our study population by state. We next present descriptive data about the full Medicare-Medicaid enrollee population by state. These data explore which inclusion criteria result in larger and smaller numbers of enrollee exclusions by state. We conclude this Appendix by presenting data on Medicare-Medicaid enrollee eligibility type for our study population in comparison to all Medicare-Medicaid enrollees. This table highlights the impact of using our study population in states where the study population is less representative of the Medicare-Medicaid enrollee population.
A. Comparison of Study Population to Total Medicare-Medicaid Enrollee Population
Of the 8,961,506dually enrolled Medicare-Medicaid enrollees in 2008, the final study population of 5,264,825 Medicare-Medicaid enrollees who satisfied the inclusion criteria comprised 59% of the total national Medicare-Medicaid enrollee population. It is always important to understand the extent to which a study population is representative of the population to which generalizations or conclusions will be made. This is particularly important in our study given that the study population was the result of exclusionary criteria, rather than a random selection. Table B-1 of Appendix B presents a comparison of demographic characteristics between the study population and the larger overall Medicare-Medicaid enrollee population. This factor plus the state’s share of the national picture (see Table B-3) will have the most influence in terms of the generalizability of the study population to all Medicare-Medicaid enrollees and all States. Other factors, such as the state-variation in satisfying the study population criteria and state-variation in managed care penetration rates, are presented as well in Table B-3 and beyond.
Across some demographic categories, we found our study population to be remarkably similar to the overall population of Medicare-Medicaid enrollees. For example, our study population appears to have the same ratio of women to men as compared to the overall population, with women making up about 62% of Medicare-Medicaid enrollees. In addition, our study population and the overall population have the same proportion of enrollees ages 85 and older (13.4%).
Across other categories, however, there appear to be slight differences. For example, our study population has a slightly greater proportion of individuals under the age of 65 (42%) and originally qualifying for Medicare based on disability (52.5%), as compared to the overall Medicare-Medicaid enrollee population (39.2% and 49.1%, respectively). Our study population also had a slightly greater proportion of individuals who were in an institutional setting for the entire calendar year (13.2% versus 11%) and slightly fewer persons of Hispanic/Latino (12.9% versus 14.6%) or Asian (4.5% versus 5.6%) descent than the Medicare-Medicaid enrollee population at large. Finally, Medicare-Medicaid enrollees qualifying for QMB benefits represented 12.7% of our study population but 10.8% of the overall dually eligible population.
In sum, since the proportions are essentially similar or only slightly different across the FFS-only study population and the national Medicare-Medicaid enrollee population, at least as measured by these dimensions, we conclude that our study population is relatively

40
representative of the national Medicare-Medicaid enrollee population. This means that it is relatively safe to generalize or extend the findings in this report to the dually eligible population at large. However, it should be noted that these comparisons may vary by state and thus the findings may not be generalizable at the state level. The next section addresses this issue.
Table B-1: Comparison of the FFS-only Medicare-Medicaid Enrollee Study Population to the Overall Medicare-Medicaid Enrollee Population on Demographic Characteristics, CY 2008
Characteristics of Medicare-Medicaid Enrollees Study Population Overall Population
Number of Enrollees 5,264,825 8,961,056 Enrollees Percentage Enrollees Percentage
Age Category Under 65 2,226,698 42.3% 3,515,512 39.2% 65 and Over 3,038,127 57.5% 5,445,994 60.8%
Detailed Age Category Under 40 496,706 9.4% 792,339 8.8% 40-64 1,729,992 32.9% 2,723,173 30.4% 65-84 2,334,406 44.3% 4,244,304 47.4% 85 and Over 703,721 13.4% 1,201,690 13.4%
Sex Female 3,237,886 61.5% 5,562,031 62.1% Male 2,026,939 38.5% 3,399,475 37.9%
Research Triangle Institute (RTI) Race Code White 3,201,384 60.8% 5,195,804 57.9% African American 1,043,027 19.8% 1,778,145 19.8% Hispanic 676,851 12.9% 1,309,923 14.6% Asian/Pacific Islander 238,138 4.5% 499,057 5.6% American Indian/Alaskan Native 52,966 1.0% 79,392 0.9% Other 44,733 0.8% 84,443 0.9% Unknown 7,726 0.1% 14,742 0.1%
Length of Institutional Long-Term Care No Institutional LTC 4,189,236 79.6% 7,273,402 81.2% 1-2 Months of Institutional LTC 173,423 3.3% 311,453 3.4% 3+ Months of Institutional LTC 205,813 3.9% 336,538 3.8% Institutional LTC Entire Period 696,353 13.2% 985,797 11.0%
Original Reason for Medicare Eligibility Code 65+ 2,414,210 45.9% 4,432,768 49.5% Disability 2,762,196 52.5% 4,398,944 49.1% End Stage Renal Disease (ESRD) 33,992 0.6% 53,825 0.6% Disability & ESRD 54,427 1.0% 75,969 0.8%
Most Recent Annual Medicaid Basis of Eligibility 65+ 2,631,974 50.0% 4,640,305 51.8% Blind/Disability 2,380,523 45.2% 3,761,344 42.0% Not Eligible 214,364 4.1% 403,650 4.5%

41
Characteristics of Medicare-Medicaid Enrollees Study Population Overall Population
Number of Enrollees 5,264,825 8,961,056 Enrollees Percentage Enrollees Percentage
Adult 36,923 0.7% 81,517 0.9% Breast & Cervical Cancer 521 0.0% 1,074 0.0% Child 312 0.0% 570 0.0% Foster Care Child 146 0.0% 230 0.0% Unemployed Adult 62 0.0% 237 0.0% Unknown/Missing 0 0.0% 8,015 0.1%
Medicare-Medicaid Eligibility Status Type Full Benefit 3,961,007 75.2% 6,879,572 76.7%
Qualified Medicare Beneficiary (QMB-only) 671,462 12.7% 967,263 10.8%
Partial Benefit 632,356 12.0% 1,114,671 12.4%
Source: CY 2008 CCW Medicare and Medicaid data. Note: While “QMB-only” Medicare-Medicaid enrollees are technically considered “partial benefit,” in this report the QMB-only enrollment category is presented separately from “partial benefit” category, which refers only to all other types of partial benefit Medicare-Medicaid enrollees: Specified Low-income Medicare Beneficiaries (i.e., “SLMB-only”), Qualified Disabled Working Individuals (i.e., “QDWI”), and Qualifying Individuals (i.e., “QI”).
To further explore the differences found between the study population and the overall population of Medicare-Medicaid enrollees, Table B-2 compares Medicare-Medicaid enrollee eligibility status for the study population to that of the entire Medicare-Medicaid enrollee population by state. This shows that while the vast majority of states are fairly comparable between their study population and population, with respect to the full versus partial benefit compositions, some states show some differences. For example, in Colorado, full benefit enrollees comprise 39% of the study population but 76% of the study population. Arizona, Kansas, Michigan, Oregon, Pennsylvania and Tennessee follow a similar trend. In the opposite direction, Montana full benefit enrollees make up 85% of the study population but only 69% of the state’s overall population.
Table B-2: Comparison of Study Population to Total Population Annual Medicare-Medicaid Enrollee Eligibility Status, among FFS Medicare-Medicaid enrollees, CY 2008
State
Study Population: Medicare-Medicaid Eligibility Annual
Medicare-Medicaid Enrollee Eligibility Status by State
Overall Population: Medicare-Medicaid Eligibility Annual Medicare-Medicaid Enrollee Eligibility Status by
State Partial Benefit QMB-only Full
Benefit Partial Benefit QMB-only Full
Benefit AK 2.4% 0.1% 97.5% 2.4% 0.2% 97.4% AL 20.4% 28.7% 51.0% 23.8% 28.7% 47.4% AR 17.2% 19.8% 63.0% 19.6% 19.9% 60.5% AZ 47.4% 7.0% 45.6% 19.1% 3.3% 77.6%

42
State
Study Population: Medicare-Medicaid Eligibility Annual
Medicare-Medicaid Enrollee Eligibility Status by State
Overall Population: Medicare-Medicaid Eligibility Annual Medicare-Medicaid Enrollee Eligibility Status by
State Partial Benefit QMB-only Full
Benefit Partial Benefit QMB-only Full
Benefit CA 1.1% 0.7% 98.2% 1.7% 0.8% 97.5% CO 23.5% 37.6% 38.8% 10.5% 13.6% 75.8% CT 10.7% 11.0% 78.4% 13.0% 10.9% 76.1% DC 0.3% 16.0% 83.8% 0.3% 15.8% 83.9% DE 26.4% 28.0% 45.6% 25.2% 26.7% 48.1% FL 14.0% 23.8% 62.2% 18.2% 24.8% 56.9% GA 18.6% 26.2% 55.2% 19.4% 24.8% 55.8% HI 6.5% 0.4% 93.1% 8.9% 0.5% 90.6% IA 12.8% 13.5% 73.7% 8.5% 8.0% 83.5% ID 11.9% 14.4% 73.7% 14.7% 14.3% 71.0% IL 8.9% 4.2% 86.9% 9.0% 4.2% 86.9% IN 14.3% 20.5% 65.3% 15.5% 19.8% 64.7% KS 23.3% 22.8% 53.9% 12.9% 13.7% 73.4% KY 18.0% 25.1% 56.9% 17.2% 22.1% 60.7% LA 15.7% 20.4% 63.9% 19.6% 21.1% 59.4% MA 2.1% 0.3% 97.7% 5.3% 0.3% 94.4% MD 12.7% 20.9% 66.4% 12.9% 20.2% 66.9% ME 10.8% 31.4% 57.9% 11.0% 31.4% 57.6% MI 86.1% 4.9% 9.0% 11.3% 0.9% 87.9% MN 13.1% 2.9% 84.0% 9.5% 1.9% 88.6% MO 3.8% 6.7% 89.5% 8.7% 7.0% 84.3% MS 17.8% 27.2% 55.0% 18.8% 26.7% 54.5% MT 7.3% 7.6% 85.1% 14.8% 16.3% 68.9% NC 16.6% 0.5% 82.9% 19.3% 0.5% 80.2% ND 10.9% 15.5% 73.6% 11.2% 14.9% 73.9% NE 16.6% 0.3% 83.1% 9.7% 0.2% 90.1% NH 12.8% 15.2% 72.1% 12.8% 14.7% 72.5% NJ 13.6% 0.2% 86.2% 12.8% 0.2% 87.0%
NM 1.7% 42.1% 56.2% 14.0% 24.8% 61.2% NV 14.9% 21.8% 63.3% 20.7% 22.5% 56.8% NY 5.2% 2.4% 92.4% 9.1% 3.3% 87.6% OH 11.5% 18.5% 70.1% 13.6% 17.9% 68.5% OK 14.4% 0.2% 85.5% 16.5% 0.2% 83.3% OR 24.8% 33.7% 41.5% 15.9% 15.9% 68.2% PA 30.2% 1.3% 68.5% 14.7% 0.6% 84.7% RI 8.0% 1.4% 90.6% 12.3% 2.0% 85.7% SC 11.4% 0.2% 88.4% 13.2% 0.2% 86.6% SD 13.9% 18.3% 67.8% 14.8% 18.0% 67.2%

43
State
Study Population: Medicare-Medicaid Eligibility Annual
Medicare-Medicaid Enrollee Eligibility Status by State
Overall Population: Medicare-Medicaid Eligibility Annual Medicare-Medicaid Enrollee Eligibility Status by
State Partial Benefit QMB-only Full
Benefit Partial Benefit QMB-only Full
Benefit TN 42.0% 53.6% 4.4% 12.1% 12.7% 75.2% TX 16.3% 24.3% 59.4% 16.8% 19.7% 63.5% UT 19.6% 3.1% 77.3% 9.6% 1.4% 89.0% VA 14.3% 14.6% 71.1% 15.8% 14.3% 69.9% VT 21.6% 7.4% 71.0% 21.7% 7.6% 70.7% WA 7.5% 8.4% 84.1% 11.6% 12.4% 76.0% WI 6.0% 22.5% 71.5% 6.5% 20.3% 73.2% WV 16.0% 22.1% 62.0% 17.0% 21.8% 61.2% WY 13.2% 18.5% 68.3% 13.6% 18.1% 68.2%
Unknown 4.1% 6.6% 89.3% 5.0% 6.5% 88.5% Source: CY 2008 CCW Medicare and Medicaid data, all FFS enrollees with at least six months enrollment in Medicare Parts A and B. Note: While “QMB-only” Medicare-Medicaid enrollees are technically considered “partial benefit,” in this report the QMB-only enrollment category is presented separately from “partial benefit” category, which refers only to all other types of partial benefit Medicare-Medicaid enrollees: Specified Low-income Medicare Beneficiaries (i.e., “SLMB-only”), Qualified Disabled Working Individuals (i.e., “QDWI”), and Qualifying Individuals (i.e., “QI”).
While the findings portrayed in Tables B-1 and B-2 suggest that the study population is mostly representative of the overarching population, caution should be exercised when applying the national results to the state-level. First, the extent to which the national results reflect State-specific results depends in part on the size of the state’s Medicare-Medicaid enrollee study population relative to the total study population (see Table B-3, column 4). For example, California and New York have a greater influence on the national results, than do states with much smaller populations such as Alaska and Wyoming.
Second, there is significant variation in the extent to which each state’s study population comprises that state’s overall Medicare-Medicaid enrollee population (see Table B-3, column 5). For example, while 36 states also have study populations that meet or exceed the national average of 59%, 7 state study populations fall below 25% of their corresponding state Medicare-Medicaid enrollee population. However, and even though this variation is largely a function of state-specific managed care penetration rates (see FFS enrollment in Table B-3, column 6), it is not necessarily significant, in and of itself, since we determined in Table B-1 that the study population generally reflects the population. On the other hand, this state-level variation is significant when viewed from the perspective of a given state’s share of the total study population. In summary, since the national-level results presented in this report are not necessarily generalizable to specific states, those interested in understanding a specific state should refer to the state-level findings presented in this report.

44
Table B-3: Proportion of Medicare-Medicaid Enrollees meeting all Study Population Criteria, by State, CY 2008
State
(1) Number of individuals in a State’s
overall Medicare-Medicaid enrollee
Population
(2) Proportion of the National
Medicare-Medicaid enrollee
Population comprised by
State Medicare-Medicaid enrollee
population
(3) Number
of Medicare-Medicaid enrollees in our FFS
Study Populatio
n
(4) Proportion of our National
Medicare-Medicaid FFS
Enrollee Study Population that is Comprised by
each State’s Medicare-Medicaid
enrollee FFS Study
Population
(5) Proportion of the Medicare-
Medicaid enrollee overall population
that meets FFS study population
criteria (i.e., extent to which the study
population comprises the
overall population)
(6) Proportion of the
Medicare-Medicaid enrollee overall
population enrolled
exclusively in Medicare FFS
(7) Proportion of the
Medicare-Medicaid enrollee overall
population Meeting
Medicare Parts A and B
Coverage Criteria
Total 8,961,506 100.00% 5,260,404 100.00% 58.7% 76.5% 94.8% AK 13,919 0.2% 12,889 0.2% 92.6% 98.7% 98.2% AL 203,418 2.3% 129,577 2.5% 63.7% 70.8% 97.1% AR 121,086 1.4% 94,326 1.8% 77.9% 83.7% 98.6% AZ 152,604 1.7% 16,634 0.3% 10.9% 38.1% 92.2% CA 1,183,977 13.2% 673,683 12.8% 56.9% 71.6% 87.3% CO 78,193 0.9% 17,593 0.3% 22.5% 64.6% 91.6% CT 102,623 1.1% 79,225 1.5% 77.2% 82.2% 95.0% DC 21,219 0.2% 15,532 0.3% 73.2% 79.1% 90.7% DE 23,459 0.3% 19,143 0.4% 81.6% 90.2% 96.4% FL 580,269 6.5% 324,370 6.2% 55.9% 66.5% 97.7% GA 258,408 2.9% 186,054 3.5% 72.0% 77.6% 94.4% HI 32,402 0.4% 22,422 0.4% 69.2% 77.2% 96.4% IA 78,980 0.9% 35,067 0.7% 44.4% 89.4% 97.8% ID 31,658 0.4% 23,870 0.5% 75.4% 81.8% 98.2% IL 316,329 3.5% 247,369 4.7% 78.2% 83.8% 90.3% IN 153,633 1.7% 129,205 2.5% 84.1% 91.0% 97.5% KS 61,084 0.7% 20,646 0.4% 33.8% 90.9% 96.1% KY 171,198 1.9% 134,390 2.6% 78.5% 84.4% 95.3% LA 177,788 2.0% 139,030 2.6% 78.2% 83.1% 98.4%
MA 249,723 2.8% 194,784 3.7% 78.0% 85.5% 97.3% MD 106,661 1.2% 83,836 1.6% 78.6% 86.4% 98.3% ME 90,194 1.0% 79,641 1.5% 88.3% 93.1% 96.4% MI 257,334 2.9% 20,844 0.4% 8.1% 91.2% 98.3% MN 127,256 1.4% 58,156 1.1% 45.7% 56.8% 97.2% MO 180,905 2.0% 140,382 2.7% 77.6% 86.8% 95.5% MS 148,066 1.7% 123,191 2.3% 83.2% 87.6% 97.8% MT 22,003 0.2% 15,644 0.3% 71.1% 92.6% 98.0% NC 306,714 3.4% 234,636 4.5% 76.5% 84.2% 98.6% ND 15,273 0.2% 12,936 0.2% 84.7% 91.5% 95.6% NE 40,871 0.5% 15,327 0.3% 37.5% 92.0% 97.1% NH 31,244 0.3% 26,995 0.5% 86.4% 92.6% 94.8% NJ 200,814 2.2% 136,554 2.6% 68.0% 80.8% 89.1%

45
State
(1) Number of individuals in a State’s
overall Medicare-Medicaid enrollee
Population
(2) Proportion of the National
Medicare-Medicaid enrollee
Population comprised by
State Medicare-Medicaid enrollee
population
(3) Number
of Medicare-Medicaid enrollees in our FFS
Study Populatio
n
(4) Proportion of our National
Medicare-Medicaid FFS
Enrollee Study Population that is Comprised by
each State’s Medicare-Medicaid
enrollee FFS Study
Population
(5) Proportion of the Medicare-
Medicaid enrollee overall population
that meets FFS study population
criteria (i.e., extent to which the study
population comprises the
overall population)
(6) Proportion of the
Medicare-Medicaid enrollee overall
population enrolled
exclusively in Medicare FFS
(7) Proportion of the
Medicare-Medicaid enrollee overall
population Meeting
Medicare Parts A and B
Coverage Criteria
NM 62,997 0.7% 27,278 0.5% 43.3% 76.9% 92.2% NV 40,980 0.5% 27,375 0.5% 66.8% 74.6% 96.3% NY 721,052 8.0% 439,121 8.3% 60.9% 69.0% 93.1% OH 303,211 3.4% 218,312 4.2% 72.0% 80.2% 95.6% OK 112,093 1.3% 91,804 1.7% 81.9% 88.2% 97.5% OR 89,138 1.0% 30,931 0.6% 34.7% 52.9% 93.1% PA 376,970 4.2% 82,179 1.6% 21.8% 58.3% 97.1% RI 39,033 0.4% 23,069 0.4% 59.1% 63.1% 90.9% SC 147,357 1.6% 108,749 2.1% 73.8% 78.8% 96.0% SD 20,287 0.2% 17,934 0.3% 88.4% 94.6% 98.4% TN 272,969 3.0% 46,951 0.9% 17.2% 76.9% 97.6% TX 597,425 6.7% 342,922 6.5% 57.4% 78.3% 98.5% UT 30,452 0.3% 6,699 0.1% 22.0% 72.8% 90.8% VA 171,409 1.9% 132,671 2.5% 77.4% 83.9% 95.8%
VT 27,839 0.3% 25,278 0.5% 90.8% 95.7% 96.7%
WA 149,049 1.7% 2,385 0.0% 1.6% 85.5% 97.4% WI 144,886 1.6% 96,059 1.8% 66.3% 84.2% 97.6% WV 77,728 0.9% 64,514 1.2% 83.0% 87.6% 98.3% WY 9,992 0.1% 8,863 0.2% 88.7% 96.5% 98.6%
Unknown 27,334 0.3% 7,490 0.1% 27.4% 52.3% 65.7%
Source: CY 2008 CCW Medicare and Medicaid data.
B. Study Population Inclusion/Exclusion Criteria
We excluded Medicare-Medicaid enrollees with less than six months of Medicaid and/or Medicare enrollment, representing only 3% of the Medicare-Medicaid enrollee population. Months of enrollment did not vary considerably across the states, ranging from 2% in California to 5% in North Dakota having less than six months of enrollment.
Our second exclusion criterion limited the study population to Medicare-Medicaid enrollees with Medicare Parts A and B. Table B-4 shows that 95% of all Medicare-Medicaid enrollees had both A and B for the entire time they were eligible for Medicare during CY 2008, with a small degree of state variation ranging from 87% in California to 99% in Wyoming. These data

46
suggest that the six months enrollment and Parts A/B exclusion criteria are only responsible for relatively small numbers of enrollee exclusions from the study population.
Table B-4: Percentage of Medicare-Medicaid Enrollees with Medicare Parts A and B by State, CY 2008
State Medicare Coverage Status
Part A Only Part B Only Parts A and B Mixed Coverage Total 0.5% 3.0% 94.8% 1.7%
AK 0.2% 0.2% 98.2% 1.5% AL 0.0% 2.2% 97.1% 0.7% AR 0.3% 0.2% 98.6% 1.0% AZ 1.3% 4.6% 92.2% 1.9% CA 0.1% 10.3% 87.3% 2.3% CO 0.1% 7.1% 91.6% 1.2% CT 1.0% 2.5% 95.0% 1.5% DC 3.3% 4.4% 90.7% 1.7% DE 0.4% 1.9% 96.4% 1.3% FL 0.1% 0.2% 97.7% 2.0% GA 0.3% 4.3% 94.4% 1.1% HI 0.6% 0.4% 96.4% 2.7% IA 0.1% 1.3% 97.8% 0.9% ID 0.2% 0.1% 98.2% 1.5% IL 0.9% 6.9% 90.3% 1.9% IN 0.2% 0.3% 97.5% 1.9% KS 0.3% 1.6% 96.1% 2.1% KY 0.3% 3.4% 95.3% 0.9% LA 0.3% 0.3% 98.4% 1.1% MA 0.6% 0.2% 97.3% 1.9% MD 0.1% 0.1% 98.3% 1.5% ME 0.8% 1.0% 96.4% 1.8% MI 0.3% 0.1% 98.3% 1.4% MN 0.5% 0.3% 97.2% 2.0% MO 1.4% 1.2% 95.5% 1.9% MS 0.4% 0.9% 97.8% 0.9% MT 0.2% 0.1% 98.0% 1.6% NC 0.0% 0.2% 98.6% 1.1% ND 0.5% 2.5% 95.6% 1.5% NE 0.7% 0.6% 97.1% 1.6% NH 3.1% 0.4% 94.8% 1.7% NJ 0.6% 9.3% 89.1% 1.1%
NM 0.5% 6.2% 92.2% 1.1% NV 0.2% 0.5% 96.3% 3.1% NY 1.0% 4.1% 93.1% 1.8% OH 0.9% 0.7% 95.6% 2.8% OK 0.5% 0.3% 97.5% 1.6% OR 0.1% 5.0% 93.1% 1.9% PA 0.6% 0.5% 97.1% 1.8% RI 2.0% 6.0% 90.9% 1.1%

47
State Medicare Coverage Status
Part A Only Part B Only Parts A and B Mixed Coverage SC 0.1% 2.7% 96.0% 1.2% SD 0.3% 0.1% 98.4% 1.2% TN 0.8% 0.7% 97.6% 1.0% TX 0.1% 0.2% 98.5% 1.3% UT 0.1% 7.1% 90.8% 2.0% VA 0.1% 2.5% 95.8% 1.6% VT 0.6% 1.4% 96.7% 1.3% WA 0.4% 0.2% 97.4% 2.0% WI 1.1% 0.1% 97.6% 1.3% WV 0.4% 0.1% 98.3% 1.2% WY 0.1% 0.0% 98.6% 1.2%
Unknown 15.1% 11.3% 65.7% 7.9% Source: CY 2008 CCW Medicare and Medicaid data.
Finally, regarding managed care versus FFS, the percentage of Medicare-Medicaid enrollees participating exclusively in Medicare FFS (see Table B-3) ranges from 38% in Arizona to 99% in Alaska, while the percent enrolled in exclusively FFS Medicaid (see Table B-5) ranges from 2% in Washington to nearly 100% in Maine and Connecticut. States are variable in their policies regarding Medicare-Medicaid enrollees and Medicaid managed care enrollment, resulting in variation in managed care participation by age (see Table B-6). For example, in Iowa, 13% of Medicare-Medicaid enrollees under age 65 were enrolled in Medicaid FFS, compared to 96% among Medicare-Medicaid enrollees ages 65 and older. For Medicare, on the other hand, over 90% of Medicare-Medicaid enrolled Minnesotans under age 65 were enrolled in FFS compared to only 29% of those ages 65 and older.
Table B-5: Percentage of Medicare-Medicaid Enrollees in Medicaid FFS by State, among FFS Medicare-Medicaid Enrollees, CY 2008
State
Medicaid Managed Care Status Full Managed
Care Organization
Full Behavioral Health
Full Fee-for-Service Mixed Coverage No Coverage
Total 7.0% 8.6% 78.9% 5.4% 0.1% AK 0.3% 0.5% 97.8% 0.9% 0.5% AL 8.0% 0.1% 80.5% 11.3% 0.1% AR 0.1% 0.1% 98.8% 0.4% 0.6% AZ 61.0% 0.4% 28.4% 9.6% 0.6% CA 15.6% 0.1% 81.6% 2.7% 0.0% CO 5.3% 49.5% 38.4% 6.8% 0.1% CT 0.0% 0.1% 99.7% 0.2% 0.0% DC 0.9% 0.1% 97.9% 1.1% 0.0% DE 0.6% 0.3% 94.8% 4.2% 0.1% FL 2.8% 0.3% 90.4% 6.5% 0.1% GA 0.1% 0.8% 98.2% 0.8% 0.1% HI 0.4% 0.9% 96.2% 2.4% 0.1% IA 0.1% 38.6% 56.5% 4.6% 0.2% ID 0.2% 1.0% 97.5% 1.2% 0.0%

48
State
Medicaid Managed Care Status Full Managed
Care Organization
Full Behavioral Health
Full Fee-for-Service Mixed Coverage No Coverage
IL 0.2% 0.1% 99.4% 0.3% 0.0% IN 0.4% 0.2% 98.4% 0.9% 0.0% KS 0.5% 40.8% 41.3% 17.4% 0.0% KY 7.4% 0.2% 91.2% 1.2% 0.0% LA 0.1% 0.1% 99.4% 0.4% 0.2% MA 4.2% 0.0% 92.8% 3.0% 0.0% MD 0.8% 0.2% 95.4% 3.6% 0.0% ME 0.0% 0.0% 99.9% 0.1% 0.0% MI 0.6% 77.0% 10.4% 11.9% 0.0% MN 33.7% 0.1% 54.4% 11.8% 0.0% MO 0.2% 0.2% 98.8% 0.7% 0.1% MS 0.0% 0.1% 99.3% 0.5% 0.0% MT 0.2% 0.6% 89.5% 0.9% 8.8% NC 0.1% 3.1% 95.6% 1.3% 0.0% ND 0.9% 0.1% 98.0% 0.9% 0.1% NE 0.1% 41.2% 45.6% 13.1% 0.0% NH 0.1% 0.3% 99.1% 0.4% 0.0% NJ 7.7% 0.2% 89.2% 2.7% 0.2%
NM 0.9% 0.3% 64.6% 34.2% 0.1% NV 0.8% 0.5% 97.2% 1.6% 0.0% NY 3.4% 0.1% 91.6% 4.9% 0.0% OH 0.4% 0.2% 95.7% 3.4% 0.4% OK 0.1% 0.2% 99.2% 0.5% 0.1% OR 33.8% 4.2% 50.8% 11.3% 0.0% PA 0.7% 50.4% 35.9% 13.0% 0.0% RI 0.4% 0.0% 98.4% 1.1% 0.0% SC 0.3% 0.1% 98.7% 0.9% 0.0% SD 0.4% 0.2% 98.7% 0.6% 0.0% TN 21.6% 32.6% 25.1% 20.6% 0.1% TX 13.0% 0.3% 76.5% 10.2% 0.0% UT 0.3% 52.4% 31.4% 15.9% 0.0% VA 0.3% 0.3% 97.4% 2.1% 0.0% VT 0.1% 0.0% 98.9% 0.3% 0.7% WA 0.8% 91.4% 2.1% 5.3% 0.5% WI 12.6% 0.2% 79.5% 7.7% 0.0% WV 0.1% 0.1% 99.3% 0.5% 0.0% WY 0.3% 0.9% 97.2% 1.4% 0.3%
Unknown 16.0% 5.2% 67.3% 11.1% 0.4% Source: CY 2008 CCW Medicare and Medicaid data, all enrollees with at least six months enrollment in Medicare Parts A and B.

49
Table B-6: Percent of Enrollees in FFS Systems (Medicare and Medicaid) by State and Age, CY 2008
State Medicare FFS-Only
Medicaid FFS-Only
65+ Under 65 65+ Under 65 Total 71.2% 84.8% 80.8% 74.5%
AK 98.4% 99.1% 97.0% 98.1% AL 67.5% 75.7% 79.6% 80.6% AR 82.2% 85.5% 97.7% 98.0% AZ 33.1% 45.8% 34.3% 18.2% CA 65.6% 86.0% 83.1% 77.2% CO 55.1% 78.8% 35.5% 42.4% CT 77.5% 89.5% 99.3% 99.4% DC 73.2% 88.6% 98.6% 95.9% DE 86.3% 95.0% 96.7% 91.3% FL 62.7% 74.2% 91.3% 87.6% GA 71.6% 87.0% 97.6% 97.1% HI 72.5% 88.0% 96.6% 91.7% IA 84.8% 94.3% 96.0% 12.9% ID 77.4% 86.4% 97.3% 97.0% IL 77.1% 92.5% 98.8% 98.8% IN 87.9% 94.1% 99.2% 97.4% KS 87.7% 94.4% 55.4% 25.4% KY 81.9% 87.4% 92.9% 88.6% LA 78.7% 89.7% 98.9% 99.0% MA 76.6% 96.2% 84.7% 96.6% MD 82.6% 91.9% 97.9% 91.4% ME 91.1% 96.4% 99.4% 99.7% MI 88.0% 94.6% 11.8% 8.9% MN 28.8% 91.4% 24.7% 90.9% MO 82.9% 90.9% 94.0% 93.9% MS 85.3% 90.8% 99.3% 98.9% MT 90.9% 94.7% 83.5% 76.9% NC 80.0% 89.8% 95.2% 95.8% ND 87.7% 97.1% 97.2% 98.3% NE 89.4% 95.1% 57.4% 31.5% NH 92.1% 93.1% 98.5% 98.8% NJ 75.6% 91.3% 90.5% 81.5%
NM 69.9% 88.2% 56.6% 55.9% NV 69.1% 83.2% 97.6% 95.7% NY 63.4% 81.7% 91.0% 91.5% OH 73.9% 87.2% 96.9% 92.2% OK 85.3% 91.8% 98.9% 98.6% OR 47.2% 60.5% 52.3% 48.4% PA 57.0% 59.9% 51.4% 15.6% RI 50.5% 80.4% 98.8% 97.5% SC 73.3% 85.9% 98.5% 97.7% SD 93.6% 96.0% 98.6% 98.3% TN 73.7% 80.4% 35.1% 14.1%

50
State Medicare FFS-Only
Medicaid FFS-Only
65+ Under 65 65+ Under 65 TX 75.9% 83.1% 77.6% 73.0% UT 62.9% 81.7% 29.6% 32.3% VA 80.4% 88.9% 98.3% 95.8% VT 93.8% 98.3% 97.9% 99.1% WA 80.6% 91.3% 2.1% 2.1% WI 80.2% 88.6% 78.2% 80.5% WV 84.6% 90.9% 99.6% 98.8% WY 95.5% 97.6% 96.7% 96.4%
Unknown 38.5% 64.4% 75.5% 58.2% Source: CY 2008 CCW Medicare and Medicaid data, all enrollees with at least six months enrollment in Medicare Parts A and B.

51
Appendix C: Enrollee Characteristics and Definitions
The MMLEADS Medicare-Medicaid Beneficiary Characteristics files were used to develop the following series of enrollee characteristic variables. The following variables were used to identify our study population.
Total Eligible Months – Both the Medicare and Medicaid Beneficiary characteristics files were used to identify months where a member was eligible for either Medicare or Medicaid. The study population was limited to members with a minimum of six months of eligibility in either program during the year.
Medicare-Medicaid Eligibility Status – The Medicare Beneficiary Characteristic file was used to identify each enrollee’s Medicare-Medicaid eligibility status, indicating whether they had full or limited Medicaid coverage. The study population was limited to the full or partial benefit categories.
Full benefit QMB–only Partial benefit Medicare only With disability Medicaid only
Medicare Coverage Status – The Medicare Beneficiary Characteristic file was used to evaluate a member’s Medicare coverage status in each month. This analysis was used to assign a member’s Medicare coverage status indicating whether they have Part A only, Part B only, or both Part A and Part B. Each enrollee was assigned to one of the following categories:
Part A coverage only during entire period of eligibility Part B coverage only during entire period of eligibility Part A and B coverage during entire period of eligibility Combination of coverage during period of eligibility
Medicare Managed Care System - The Medicare Beneficiary Characteristic file was used to identify enrollees who were enrolled in Medicare Advantage (MA) plans at any point during the year. Enrollees were assigned to one of the following categories and the study population was limited to members that only received services through the FFS system:
Enrollee was enrolled in a Medicare Advantage plan during the year Enrollee only received services through FFS during their entire period of eligibility
Medicaid Managed Care System - The Medicaid Beneficiary Characteristic file was used to identify enrollees who were enrolled in Medicaid full-risk managed care organization (MCO) or behavioral health (BH) plan during the year. Persons enrolled only in primary care case management (PCCM) or managed care for dental, transportation, etc. were not counted as managed care and were not excluded from the study population. Enrollees were assigned to
52
one of the following categories, and the study population was limited to members that only received services through the FFS system:
Enrollee was enrolled in an MCO during their entire period of eligibility Enrollee was enrolled in a BH plan during their entire period of eligibility Enrollee received services through the FFS system during their entire period of
eligibility Enrollee was enrolled in an MCO or BH plan during a portion of their period of
eligibility
Original Reason for Medicare Eligibility – The Medicare Beneficiary Characteristic file was used to identify how an enrollee originally gained his/her Medicare eligibility:
Reaching Age 65 and Survivor’s Insurance Disability insurance benefits End-stage renal disease (ESRD) Disability insurance and ESRD
Current Reason for Medicare Eligibility – The Medicare Beneficiary Characteristic file was used to identify an enrollee’s current reason for Medicare eligibility:
Reaching Age 65 and Survivor’s Insurance Disability insurance benefits ESRD Disability insurance and ESRD
The following variables were used to identify member characteristics that were used to evaluate disease prevalence.
Medicaid Basis for Eligibility - The Medicaid Beneficiary Characteristic file was used to identify each enrollee’s Medicaid Basis for Eligibility status in their last month of eligibility.
Age 65+ Blind/Disabled Child Adult Child of Unemployed Adult Unemployed Adult Foster Care Child Covered under Breast and Cervical Cancer Prevention Act Unknown

53
Medicaid Maintenance of Assistance - The Medicaid Beneficiary Characteristic file was used to identify each enrollee’s Medicaid Maintenance of Assistance status during their last month of eligibility.
Individual was eligible for S-CHIP this month Receiving Cash or Eligible under section 1931 of the Act Medically Needy Poverty Related Other 1115 - Demonstration expansion eligibles Unknown
Institutional Status – The MMLEADS Timeline file, Medicaid Beneficiary Characteristic file, and GVDB Part A claim files were used to identify individuals who resided in a LTC institution during the year. Enrollees were classified by the amount of time they resided in a LTC institution and whether the stay was for consecutive months or not. LTC institutions included: nursing facility, LTC mental hospital for the aged, a long-term inpatient psychiatric facility (in the case of a person under age 21), intermediate care facility for individuals with developmental disabilities, or other LTC institution.
Enrollee resided in a LTC institution for a full year or their entire period of eligibility Enrollee resided in LTC institution for three consecutive months or longer, but not for
their entire period of eligibility Enrollee resided for less than three consecutive months Enrollee resided in a LTC institution for one or two months and was only eligible for one
or two months No institutional use
Home and Community-Based Services (HCBS) Status – The MMLEADS Timeline file and Medicaid Beneficiary Characteristic file were used to identify individuals who received Medicaid HCBS services during the year. Enrollees were classified by the amount of time they received support.
Enrollee received HCBS services for a full year or their entire period of eligibility Enrollee received HCBS services for three consecutive months or longer, but not for their
entire period of eligibility Enrollee received HCBS services for less than three consecutive months No HCBS services received
Age Group – The Medicare Beneficiary Characteristic file was used to classify members into four age categories based upon their age at the end of the year, or their age at death.
Under 40 40-<65

54
65-<85 85+
RTI Race Variable – The Medicare Beneficiary Characteristic file was used to identify an enrollee’s race/ethnicity.
Unknown White Black (or African American) Other Asian Pacific/Islander Hispanic American Indian/Alaskan Native
Sex – The Medicare Beneficiary Characteristic file was used to identify an enrollee’s sex.
Male Female Unknown
State – The Medicaid Beneficiary Characteristic file was used to identify an enrollee’s state of residence.
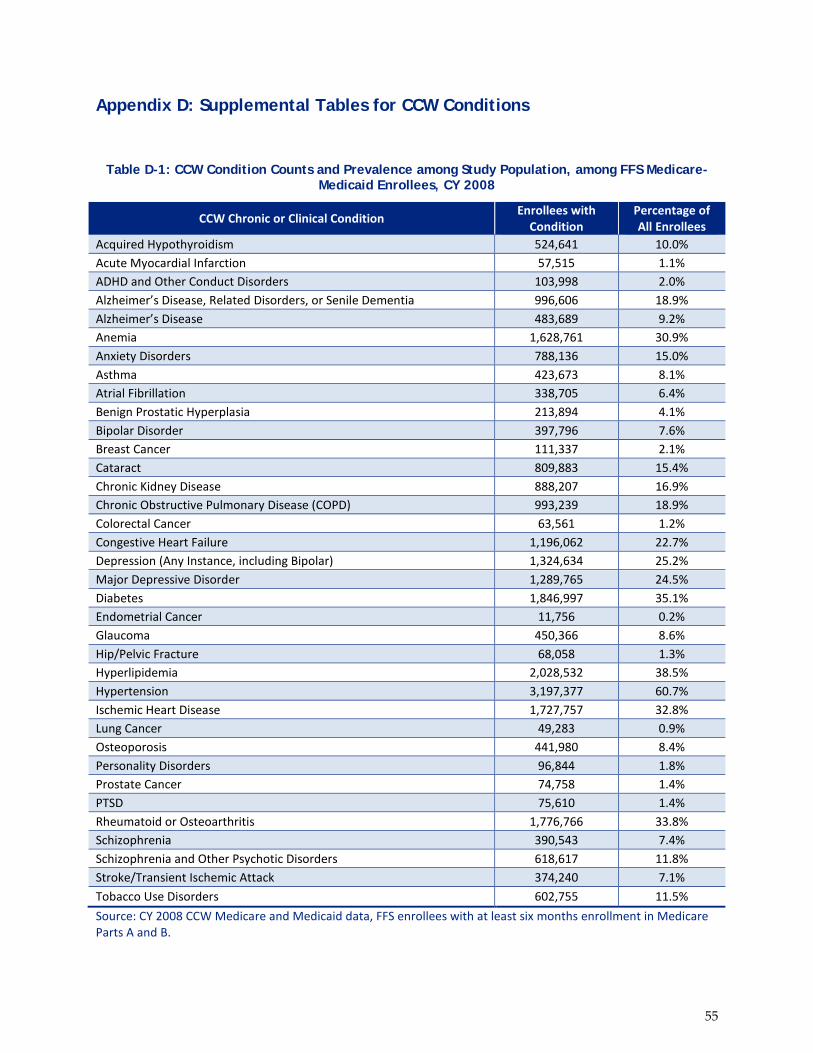
55
Appendix D: Supplemental Tables for CCW Conditions
Table D-1: CCW Condition Counts and Prevalence among Study Population, among FFS Medicare-Medicaid Enrollees, CY 2008
CCW Chronic or Clinical Condition Enrollees with Condition
Percentage of All Enrollees
Acquired Hypothyroidism 524,641 10.0% Acute Myocardial Infarction 57,515 1.1% ADHD and Other Conduct Disorders 103,998 2.0% Alzheimer’s Disease, Related Disorders, or Senile Dementia 996,606 18.9% Alzheimer’s Disease 483,689 9.2% Anemia 1,628,761 30.9% Anxiety Disorders 788,136 15.0% Asthma 423,673 8.1% Atrial Fibrillation 338,705 6.4% Benign Prostatic Hyperplasia 213,894 4.1% Bipolar Disorder 397,796 7.6% Breast Cancer 111,337 2.1% Cataract 809,883 15.4% Chronic Kidney Disease 888,207 16.9% Chronic Obstructive Pulmonary Disease (COPD) 993,239 18.9% Colorectal Cancer 63,561 1.2% Congestive Heart Failure 1,196,062 22.7% Depression (Any Instance, including Bipolar) 1,324,634 25.2% Major Depressive Disorder 1,289,765 24.5% Diabetes 1,846,997 35.1% Endometrial Cancer 11,756 0.2% Glaucoma 450,366 8.6% Hip/Pelvic Fracture 68,058 1.3% Hyperlipidemia 2,028,532 38.5% Hypertension 3,197,377 60.7% Ischemic Heart Disease 1,727,757 32.8% Lung Cancer 49,283 0.9% Osteoporosis 441,980 8.4% Personality Disorders 96,844 1.8% Prostate Cancer 74,758 1.4% PTSD 75,610 1.4% Rheumatoid or Osteoarthritis 1,776,766 33.8% Schizophrenia 390,543 7.4% Schizophrenia and Other Psychotic Disorders 618,617 11.8% Stroke/Transient Ischemic Attack 374,240 7.1% Tobacco Use Disorders 602,755 11.5% Source: CY 2008 CCW Medicare and Medicaid data, FFS enrollees with at least six months enrollment in Medicare Parts A and B.

56
Table D-2: CCW Condition Flag to Categorical Condition Group Crosswalk, CY 2008
Categorical Condition Group CCW Condition Flag CCW Description
Mental Health Condition
DEPR_COMBINED ANXI_COMBINED BIPL_COMBINED DEPSN_COMBINED PSDS_COMBINED PTRA_COMBINED SCHI_COMBINED SCHIOT_COMBINED
Depression (any instance including Bipolar) Anxiety Disorders Bipolar Disorder Major Depressive Disorder Personality Disorders PTSD Schizophrenia Schizophrenia & Other Psychotic Disorders
Anemia ANEMIA_COMBINED Anemia Stroke STRK_COMBINED Stroke Diabetes DIAB_COMBINED Diabetes
Eye Disease CAT_COMBINED GLCM_COMBINED
Cataract Glaucoma
Heart Condition
AMI_COMBINED AFIB_COMBINED CHF_COMBINED HYPLIP_COMBINED HYPTEN_COMBINED IHD_COMBINED
Acute Myocardial Infarction Atrial Fibrillation Heart Failure Hyperlipidemia Hypertension Ischemic heart disease
Injury & Hip/Pelvic Fracture HFRAC_COMBINED Hip/Pelvic Fracture Kidney Disease CKD_COMBINED Chronic Kidney Disease
Lung Disorder ASTHMA_COMBINED COPD_COMBINED
Asthma Chronic Obstructive Pulmonary Disease
Musculoskeletal Disorder OST_COMBINED RAOA_COMBINED
Osteoporosis Rheumatoid/Osteoarthritis
Neoplasm
BRC_COMBINED CRC_COMBINED LNGC_COMBINED PRC_COMBINED ENDC_COMBINED
Breast Cancer Colorectal Cancer Lung Cancer Prostate Cancer Endometrial Cancer
Other Metabolic Disorder HYPTHY_COMBINED Acquired Hypothyroidism Tobacco Use TOBA_COMBINED Tobacco Use Disorders Source: Lewin analysis of CY 2008 CCW Medicare and Medicaid data.

57
Appendix E: National Supplemental Tables and Figures
This appendix provides additional detail about the relative number of comorbid CCGs of different national subgroups of Medicare-Medicaid enrollees. We present the percentage of enrollees who have n or more comorbid conditions by race (Table E-1), Medicaid basis of eligibility (Table E-2), LTC status (Figure E-1), original reason for Medicare eligibility (Figure E-2), and Medicare-Medicaid enrollee type (Figure E-3).
Table E-1: Percentage of Individuals with 1+ to 7+ Categorical Condition Groups, by Race (CCW), CY 2008
Number of
Enrollees 1+ 2+ 3+ 4+ 5+ 6+ 7+
White 3,201,384 91% 77% 60% 42% 26% 14% 6%
African American 1,043,027 89% 76% 59% 41% 25% 13% 5%
Hispanic 676,851 89% 77% 60% 41% 25% 13% 5%
Asian/Pacific Islander 238,138 92% 78% 57% 34% 17% 7% 2%
American Indian/Alaskan Native
52,966 87% 72% 54% 36% 21% 10% 4%
Other 44,733 88% 73% 55% 36% 20% 10% 4% Source: CY 2008 CCW Medicare and Medicaid data, FFS enrollees with at least six months enrollment in Medicare Parts A and B and/or Medicaid.
Table E-2: Percentage of Individuals with 1+ to 7+ Categorical Condition Groups, by Basis of Eligibility Status (CCW), CY 2008
Number of
Enrollees 1+ 2+ 3+ 4+ 5+ 6+ 7+
Aged 2,631,974 94% 85% 69% 50% 31% 17% 7% Blind/Disabled 2,380,523 87% 69% 51% 33% 19% 9% 4% Unknown 214,364 84% 67% 49% 32% 18% 9% 4% Child 36,923 78% 55% 32% 18% 6% 2% 1% Adult 521 83% 59% 38% 21% 10% 4% 1% Unemployed Adult 312 69% 55% 35% 23% 15% 8% 3%
Foster Care Child 146 61% 33% 23% 12% 5% 3% 1%
Breast & Cervical Cancer 62 97% 85% 63% 44% 24% 11% 4%
Source: CY 2008 CCW Medicare and Medicaid data, FFS enrollees with at least six months enrollment in Medicare Parts A and B and/or Medicaid.
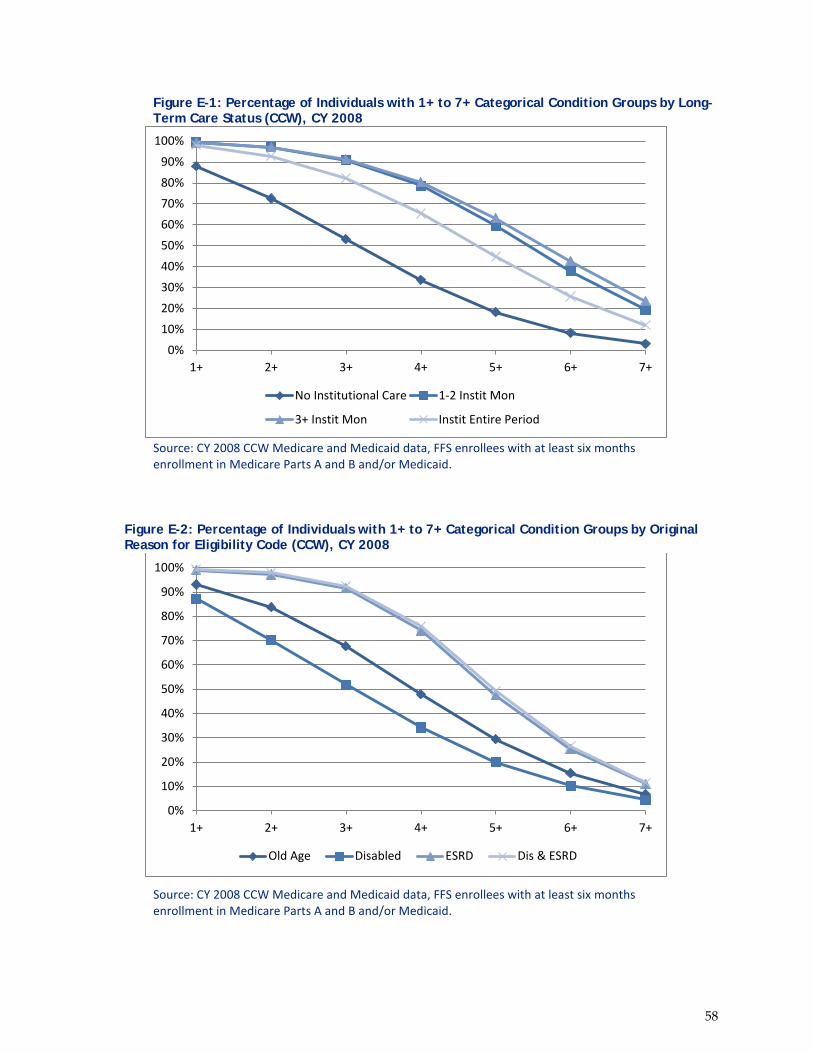
58
Figure E-1: Percentage of Individuals with 1+ to 7+ Categorical Condition Groups by Long-Term Care Status (CCW), CY 2008
Source: CY 2008 CCW Medicare and Medicaid data, FFS enrollees with at least six months enrollment in Medicare Parts A and B and/or Medicaid.
Figure E-2: Percentage of Individuals with 1+ to 7+ Categorical Condition Groups by Original Reason for Eligibility Code (CCW), CY 2008
Source: CY 2008 CCW Medicare and Medicaid data, FFS enrollees with at least six months enrollment in Medicare Parts A and B and/or Medicaid.
0%10%20%30%40%50%60%70%80%90%
100%
1+ 2+ 3+ 4+ 5+ 6+ 7+
No Institutional Care 1-2 Instit Mon
3+ Instit Mon Instit Entire Period
0%
10%
20%
30%
40%
50%
60%
70%
80%
90%
100%
1+ 2+ 3+ 4+ 5+ 6+ 7+
Old Age Disabled ESRD Dis & ESRD
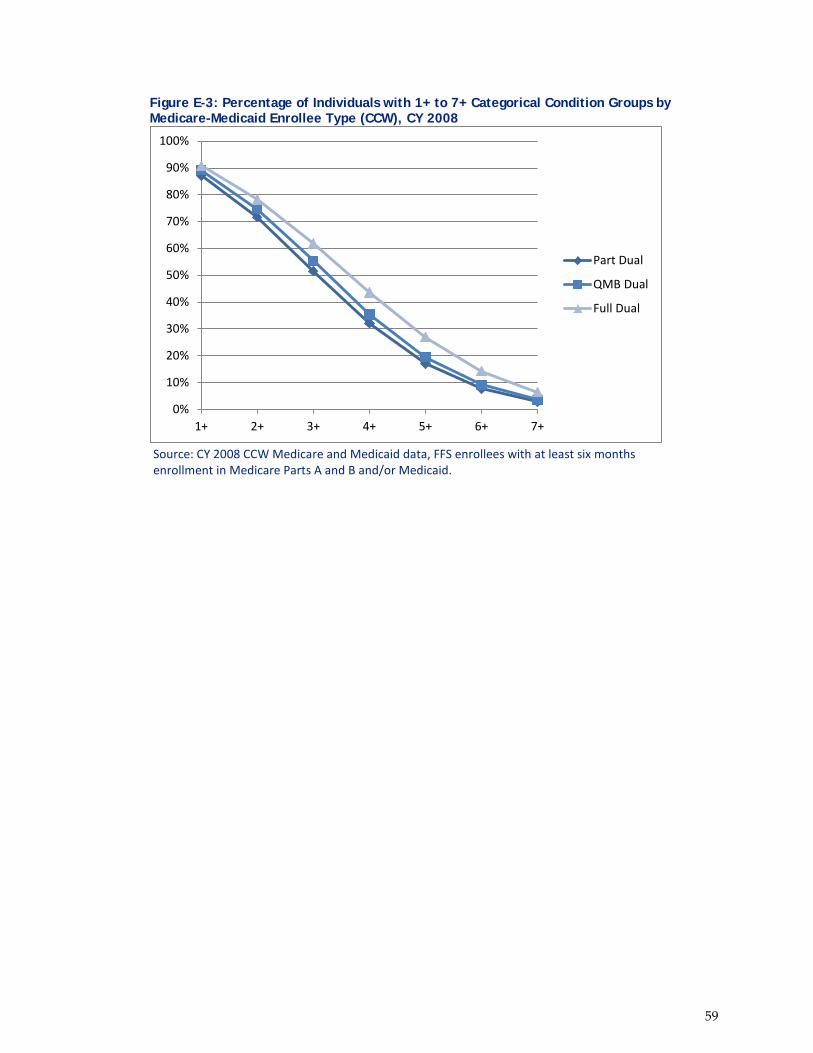
59
Figure E-3: Percentage of Individuals with 1+ to 7+ Categorical Condition Groups by Medicare-Medicaid Enrollee Type (CCW), CY 2008
Source: CY 2008 CCW Medicare and Medicaid data, FFS enrollees with at least six months enrollment in Medicare Parts A and B and/or Medicaid.
0%
10%
20%
30%
40%
50%
60%
70%
80%
90%
100%
1+ 2+ 3+ 4+ 5+ 6+ 7+
Part Dual
QMB Dual
Full Dual
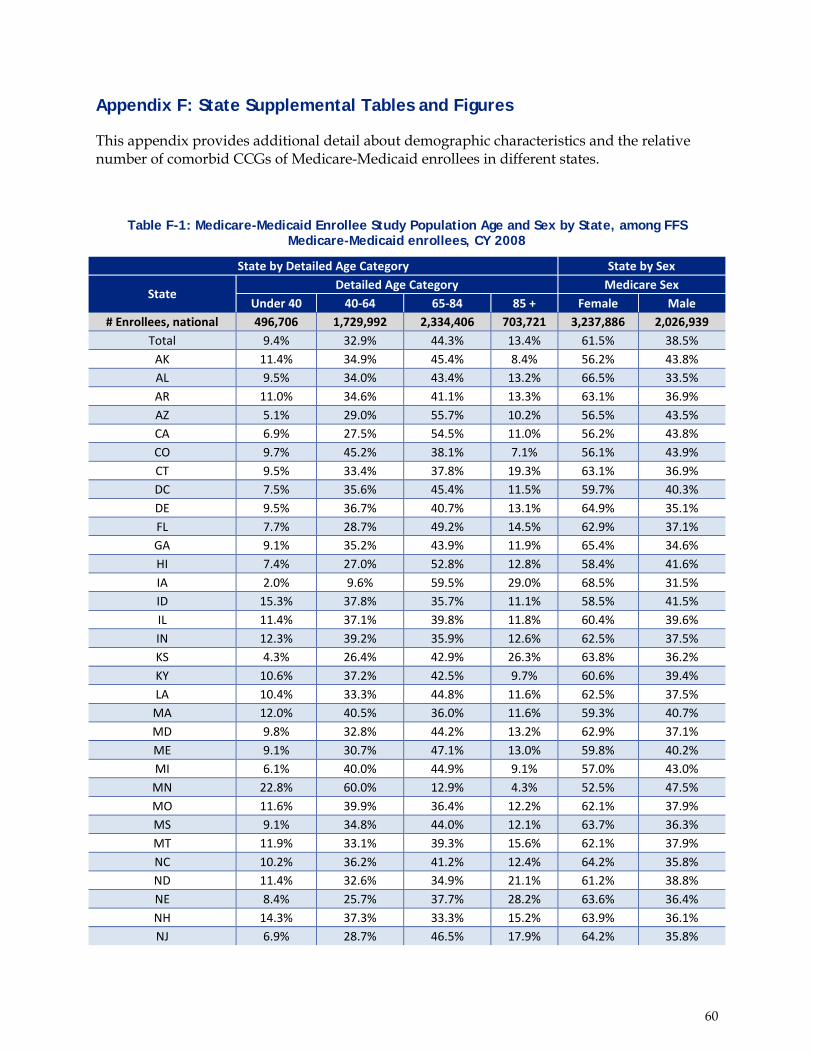
60
Appendix F: State Supplemental Tables and Figures
This appendix provides additional detail about demographic characteristics and the relative number of comorbid CCGs of Medicare-Medicaid enrollees in different states.
Table F-1: Medicare-Medicaid Enrollee Study Population Age and Sex by State, among FFS Medicare-Medicaid enrollees, CY 2008
State by Detailed Age Category State by Sex
State Detailed Age Category Medicare Sex
Under 40 40-64 65-84 85 + Female Male # Enrollees, national 496,706 1,729,992 2,334,406 703,721 3,237,886 2,026,939
Total 9.4% 32.9% 44.3% 13.4% 61.5% 38.5% AK 11.4% 34.9% 45.4% 8.4% 56.2% 43.8% AL 9.5% 34.0% 43.4% 13.2% 66.5% 33.5% AR 11.0% 34.6% 41.1% 13.3% 63.1% 36.9% AZ 5.1% 29.0% 55.7% 10.2% 56.5% 43.5% CA 6.9% 27.5% 54.5% 11.0% 56.2% 43.8% CO 9.7% 45.2% 38.1% 7.1% 56.1% 43.9% CT 9.5% 33.4% 37.8% 19.3% 63.1% 36.9% DC 7.5% 35.6% 45.4% 11.5% 59.7% 40.3% DE 9.5% 36.7% 40.7% 13.1% 64.9% 35.1% FL 7.7% 28.7% 49.2% 14.5% 62.9% 37.1% GA 9.1% 35.2% 43.9% 11.9% 65.4% 34.6% HI 7.4% 27.0% 52.8% 12.8% 58.4% 41.6% IA 2.0% 9.6% 59.5% 29.0% 68.5% 31.5% ID 15.3% 37.8% 35.7% 11.1% 58.5% 41.5% IL 11.4% 37.1% 39.8% 11.8% 60.4% 39.6% IN 12.3% 39.2% 35.9% 12.6% 62.5% 37.5% KS 4.3% 26.4% 42.9% 26.3% 63.8% 36.2% KY 10.6% 37.2% 42.5% 9.7% 60.6% 39.4% LA 10.4% 33.3% 44.8% 11.6% 62.5% 37.5% MA 12.0% 40.5% 36.0% 11.6% 59.3% 40.7% MD 9.8% 32.8% 44.2% 13.2% 62.9% 37.1% ME 9.1% 30.7% 47.1% 13.0% 59.8% 40.2% MI 6.1% 40.0% 44.9% 9.1% 57.0% 43.0% MN 22.8% 60.0% 12.9% 4.3% 52.5% 47.5% MO 11.6% 39.9% 36.4% 12.2% 62.1% 37.9% MS 9.1% 34.8% 44.0% 12.1% 63.7% 36.3% MT 11.9% 33.1% 39.3% 15.6% 62.1% 37.9% NC 10.2% 36.2% 41.2% 12.4% 64.2% 35.8% ND 11.4% 32.6% 34.9% 21.1% 61.2% 38.8% NE 8.4% 25.7% 37.7% 28.2% 63.6% 36.4% NH 14.3% 37.3% 33.3% 15.2% 63.9% 36.1% NJ 6.9% 28.7% 46.5% 17.9% 64.2% 35.8%

61
State by Detailed Age Category State by Sex
State Detailed Age Category Medicare Sex
Under 40 40-64 65-84 85 + Female Male # Enrollees, national 496,706 1,729,992 2,334,406 703,721 3,237,886 2,026,939
NM 10.7% 32.6% 46.9% 9.7% 57.7% 42.4% NV 10.3% 33.5% 46.8% 9.4% 60.8% 39.2% NY 8.8% 28.1% 46.7% 16.5% 61.8% 38.2% OH 12.4% 38.1% 36.7% 12.9% 62.1% 37.9% OK 10.6% 35.0% 43.3% 11.1% 62.9% 37.2% OR 9.4% 41.0% 40.3% 9.3% 56.6% 43.4% PA 2.6% 18.3% 45.7% 33.5% 68.0% 32.0% RI 13.8% 40.7% 31.8% 13.8% 60.8% 39.2% SC 10.3% 37.7% 39.6% 12.4% 64.1% 35.9% SD 11.1% 29.8% 39.9% 19.3% 62.9% 37.1% TN 3.3% 27.3% 59.7% 9.7% 63.9% 36.2% TX 6.8% 27.1% 52.0% 14.2% 62.7% 37.3% UT 19.7% 42.8% 32.0% 5.4% 57.9% 42.1% VA 10.4% 34.2% 42.8% 12.7% 63.2% 36.8% VT 11.1% 32.3% 41.9% 14.7% 61.0% 39.0% WA 15.5% 35.1% 34.7% 14.7% 55.7% 44.3% WI 13.3% 38.3% 32.2% 16.2% 60.5% 39.5% WV 12.4% 38.3% 40.4% 9.0% 57.8% 42.2% WY 12.4% 34.3% 39.4% 13.9% 62.5% 37.5%
Unknown 18.7% 41.4% 35.3% 4.6% 53.9% 46.1% Source: CY 2008 CCW Medicare and Medicaid data, FFS enrollees with at least six months enrollment in Medicare Parts A and B.
Table F-2: Medicare-Medicaid Enrollee Study Population Race by State, among FFS Medicare-
Medicaid enrollees, CY 2008
State
Research Triangle Institute (RTI) Race Code
White African American Hispanic Asian/Pacific
Islander
American Indian/Alaskan
Native Other Unknown
# Enrollees, national 3,201,384 1,043,027 676,851 238,138 52,966 44,733 7,726
Total 60.8% 19.8% 12.9% 4.5% 1.0% 0.8% 0.1% AK 51.0% 4.3% 3.8% 8.4% 31.1% 1.4% 0.1% AL 63.0% 35.8% 0.6% 0.3% 0.1% 0.2% 0.1% AR 73.6% 23.6% 1.3% 0.6% 0.5% 0.3% 0.1% AZ 45.8% 2.9% 10.5% 0.7% 39.7% 0.4% 0.1% CA 39.2% 10.2% 30.3% 18.1% 0.8% 1.4% 0.1% CO 66.0% 7.5% 23.1% 2.1% 0.7% 0.5% 0.1% CT 70.7% 13.4% 12.7% 1.9% 0.1% 1.0% 0.2% DC 7.0% 85.7% 4.8% 1.7% 0.1% 0.6% 0.1% DE 59.8% 32.9% 4.7% 1.7% 0.1% 0.7% 0.1%

62
State
Research Triangle Institute (RTI) Race Code
White African American Hispanic Asian/Pacific
Islander
American Indian/Alaskan
Native Other Unknown
# Enrollees, national 3,201,384 1,043,027 676,851 238,138 52,966 44,733 7,726
FL 49.4% 18.6% 29.3% 1.8% 0.1% 0.7% 0.1% GA 54.8% 41.6% 1.8% 1.3% 0.1% 0.3% 0.1% HI 21.7% 1.5% 10.3% 58.0% 0.3% 8.1% 0.2% IA 92.6% 3.4% 1.7% 1.5% 0.3% 0.3% 0.2% ID 87.7% 0.5% 7.8% 1.0% 2.2% 0.8% 0.1% IL 59.6% 26.4% 10.2% 3.0% 0.1% 0.7% 0.1% IN 82.0% 14.2% 2.3% 0.8% 0.1% 0.5% 0.1% KS 87.3% 7.2% 3.3% 0.7% 0.9% 0.4% 0.2% KY 91.4% 7.5% 0.5% 0.2% 0.1% 0.3% 0.1% LA 48.6% 47.5% 2.1% 1.2% 0.2% 0.4% 0.1% MA 71.8% 8.7% 12.5% 4.8% 0.2% 1.9% 0.3% MD 49.7% 38.4% 3.8% 7.0% 0.1% 1.0% 0.1% ME 97.4% 0.5% 0.6% 0.4% 0.5% 0.6% 0.1% MI 76.8% 18.4% 2.5% 0.9% 0.7% 0.7% 0.1% MN 82.3% 9.3% 2.1% 2.2% 2.9% 1.0% 0.2% MO 80.6% 16.5% 1.3% 0.8% 0.3% 0.4% 0.1% MS 48.0% 50.5% 0.5% 0.4% 0.3% 0.2% 0.1% MT 85.0% 0.5% 1.9% 0.7% 11.0% 0.7% 0.2% NC 56.9% 38.0% 1.7% 1.3% 1.3% 0.8% 0.1% ND 88.8% 0.6% 1.0% 0.4% 8.6% 0.5% 0.2% NE 91.7% 4.1% 2.2% 0.4% 1.0% 0.4% 0.3% NH 92.7% 3.5% 1.9% 0.8% 0.2% 0.8% 0.1% NJ 54.6% 20.3% 18.9% 5.0% 0.1% 1.0% 0.2% NM 32.9% 2.3% 46.2% 0.4% 17.9% 0.3% 0.0% NV 57.2% 12.9% 18.3% 8.4% 2.1% 1.1% 0.1% NY 58.2% 16.4% 16.1% 6.6% 0.3% 2.1% 0.3% OH 77.0% 19.2% 2.1% 0.9% 0.1% 0.6% 0.2% OK 72.1% 11.1% 3.0% 1.2% 12.1% 0.4% 0.1% OR 87.6% 2.6% 4.8% 2.1% 2.0% 0.8% 0.1% PA 85.1% 11.2% 2.4% 0.7% 0.1% 0.4% 0.2% RI 75.1% 7.4% 13.5% 1.7% 0.4% 1.6% 0.3% SC 52.4% 45.6% 1.0% 0.5% 0.2% 0.3% 0.1% SD 83.0% 0.7% 0.9% 0.5% 14.3% 0.5% 0.1% TN 82.8% 15.4% 0.9% 0.5% 0.1% 0.3% 0.1% TX 40.9% 16.6% 40.8% 1.1% 0.2% 0.2% 0.1% UT 78.3% 1.8% 9.9% 2.9% 6.0% 1.0% 0.2% VA 59.5% 32.9% 2.3% 4.4% 0.1% 0.6% 0.1% VT 97.1% 0.6% 0.7% 0.5% 0.2% 0.8% 0.2% WA 73.6% 7.4% 7.1% 7.5% 2.0% 1.9% 0.6% WI 84.0% 8.5% 3.3% 2.1% 1.6% 0.5% 0.2%

63
State
Research Triangle Institute (RTI) Race Code
White African American Hispanic Asian/Pacific
Islander
American Indian/Alaskan
Native Other Unknown
# Enrollees, national 3,201,384 1,043,027 676,851 238,138 52,966 44,733 7,726
WV 94.8% 4.0% 0.4% 0.3% 0.1% 0.4% 0.1% WY 86.2% 1.2% 7.0% 0.5% 4.4% 0.6% 0.1% Unknown 35.8% 15.5% 33.2% 7.9% 0.6% 3.4% 3.7% Source: CY 2008 CCW Medicare and Medicaid data, FFS enrollees with at least six months enrollment in Medicare Parts A and B.
Table F-3: Medicare-Medicaid Enrollee Study Population Institutional Status by State, among FFS
Medicare-Medicaid Enrollees, CY 2008
Medicare State Code Member Long Term Care Status
No Institutional Care 1-2 Institutional Care Months
3+ Institutional Care Months
Institutional Care Entire Period
# Enrollees, national 4,189,236 173,423 205,813 696,353 Total 79.6% 3.3% 3.9% 13.2%
AK 93.3% 2.1% 1.5% 3.2% AL 83.9% 3.2% 2.5% 10.4% AR 80.5% 3.2% 3.7% 12.6% AZ 91.8% 3.1% 1.7% 3.5% CA 87.9% 2.9% 2.8% 6.5% CO 89.4% 2.7% 1.7% 6.3% CT 69.0% 5.4% 5.3% 20.2% DC 82.9% 3.5% 4.7% 9.0% DE 82.6% 3.1% 3.5% 10.8% FL 79.9% 3.5% 4.3% 12.4% GA 84.3% 2.4% 3.1% 10.2% HI 88.8% 2.0% 1.9% 7.3% IA 57.3% 5.4% 7.1% 30.3% ID 82.6% 3.7% 3.7% 10.0% IL 74.3% 3.3% 4.8% 17.6% IN 72.2% 3.2% 5.2% 19.5% KS 47.4% 1.9% 6.3% 44.3% KY 83.2% 3.2% 3.4% 10.2% LA 78.1% 4.0% 3.8% 14.1% MA 80.8% 4.8% 3.8% 10.6% MD 80.3% 3.6% 4.2% 12.0% ME 88.1% 4.5% 2.9% 4.5% MI 93.6% 2.3% 1.4% 2.7% MN 88.0% 3.6% 2.8% 5.5% MO 77.1% 3.4% 4.5% 14.9% MS 83.3% 3.1% 3.1% 10.5%

64
Medicare State Code Member Long Term Care Status
No Institutional Care 1-2 Institutional Care Months
3+ Institutional Care Months
Institutional Care Entire Period
# Enrollees, national 4,189,236 173,423 205,813 696,353 MT 72.2% 4.2% 5.6% 17.9% NC 84.0% 3.0% 3.4% 9.6% ND 65.9% 3.8% 5.3% 25.1% NE 47.6% 4.6% 8.0% 39.8% NH 74.1% 3.9% 4.9% 17.1% NJ 72.3% 4.2% 4.8% 18.7%
NM 88.9% 2.2% 2.6% 6.3% NV 85.8% 3.1% 3.5% 7.6% NY 77.9% 2.8% 4.5% 14.8% OH 71.4% 3.9% 5.2% 19.4% OK 79.4% 3.4% 4.0% 13.2% OR 89.8% 3.0% 2.0% 5.2% PA 40.9% 3.7% 8.3% 47.1% RI 77.7% 2.8% 4.1% 15.5% SC 83.6% 2.6% 3.3% 10.5% SD 71.2% 4.3% 5.2% 19.3% TN 94.6% 3.2% 0.9% 1.3% TX 76.5% 2.9% 4.0% 16.6% UT 91.5% 2.8% 3.6% 2.1% VA 79.7% 3.4% 4.2% 12.7% VT 85.0% 4.1% 3.5% 7.4% WA 76.8% 2.9% 4.3% 16.0% WI 74.8% 2.8% 4.5% 18.0% WV 84.5% 2.9% 3.1% 9.5% WY 75.1% 3.9% 4.7% 16.2%
Unknown 94.9% 1.6% 1.5% 2.0% Source: CY 2008 CCW Medicare and Medicaid data, FFS enrollees with at least six months enrollment in Medicare Parts A and B.
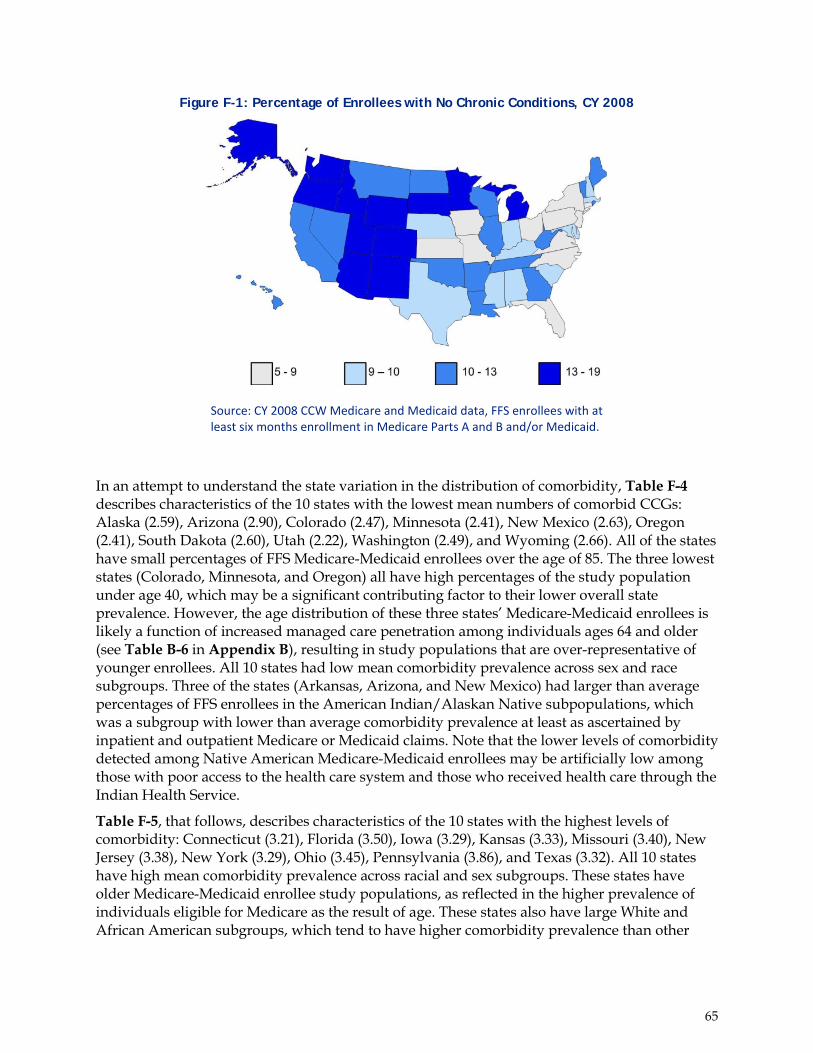
65
Figure F-1: Percentage of Enrollees with No Chronic Conditions, CY 2008
Source: CY 2008 CCW Medicare and Medicaid data, FFS enrollees with at least six months enrollment in Medicare Parts A and B and/or Medicaid.
In an attempt to understand the state variation in the distribution of comorbidity, Table F-4 describes characteristics of the 10 states with the lowest mean numbers of comorbid CCGs: Alaska (2.59), Arizona (2.90), Colorado (2.47), Minnesota (2.41), New Mexico (2.63), Oregon (2.41), South Dakota (2.60), Utah (2.22), Washington (2.49), and Wyoming (2.66). All of the states have small percentages of FFS Medicare-Medicaid enrollees over the age of 85. The three lowest states (Colorado, Minnesota, and Oregon) all have high percentages of the study population under age 40, which may be a significant contributing factor to their lower overall state prevalence. However, the age distribution of these three states’ Medicare-Medicaid enrollees is likely a function of increased managed care penetration among individuals ages 64 and older (see Table B-6 in Appendix B), resulting in study populations that are over-representative of younger enrollees. All 10 states had low mean comorbidity prevalence across sex and race subgroups. Three of the states (Arkansas, Arizona, and New Mexico) had larger than average percentages of FFS enrollees in the American Indian/Alaskan Native subpopulations, which was a subgroup with lower than average comorbidity prevalence at least as ascertained by inpatient and outpatient Medicare or Medicaid claims. Note that the lower levels of comorbidity detected among Native American Medicare-Medicaid enrollees may be artificially low among those with poor access to the health care system and those who received health care through the Indian Health Service.
Table F-5, that follows, describes characteristics of the 10 states with the highest levels of comorbidity: Connecticut (3.21), Florida (3.50), Iowa (3.29), Kansas (3.33), Missouri (3.40), New Jersey (3.38), New York (3.29), Ohio (3.45), Pennsylvania (3.86), and Texas (3.32). All 10 states have high mean comorbidity prevalence across racial and sex subgroups. These states have older Medicare-Medicaid enrollee study populations, as reflected in the higher prevalence of individuals eligible for Medicare as the result of age. These states also have large White and African American subgroups, which tend to have higher comorbidity prevalence than other

66
races. Of these 10 states, 4 have significantly higher Medicaid managed care penetration for enrollees under age 65, resulting in significant differences in the percent of Medicare-Medicaid enrollees under age 65 with Medicaid FFS (13% in Iowa compared to 96% of enrollees over age 64, 25% in Kansas compared to 55% of enrollees over age 64, 81 % in New Jersey compared to 90% for individuals over age 64, and 16% in Pennsylvania compared to 51% for individuals over age 64). In these four states, the study population under-represents Medicare-Medicaid enrollees under age 65 due to disproportionate Medicaid managed care coverage.
While analyzing these patterns may suggest some general trends, it is critical to recognize that not all of these states’ study populations are equally representative of their Medicare-Medicaid enrollee populations (see Appendix B for additional information about state study populations). Significantly, in 7 of the 10 states with the lowest levels of comorbid CCGs, the study population comprises less than half of all Medicare-Medicaid enrollees (Arizona 11%, Colorado 22%, Minnesota 46%, New Mexico 43%, Oregon 35%, Utah 22%, and Washington 2%). Among the 10 states with the highest levels of comorbid CCGs, the study population comprises less than half of all Medicare-Medicaid enrollees in 3 states (Iowa 44%, Kansas 34%, and Pennsylvania 22%).
This section highlights two important reasons for caution when comparing these data between states. First, due to inherent differences between states, they also have different Medicare-Medicaid enrollee compositions (e.g., age, race, etc.). Second, due to our exclusion criteria for this study (e.g., excluding beneficiaries with managed care participation), there is considerable variation in the extent to which states’ total Medicare-Medicaid enrollee populations are comprised by our study population.
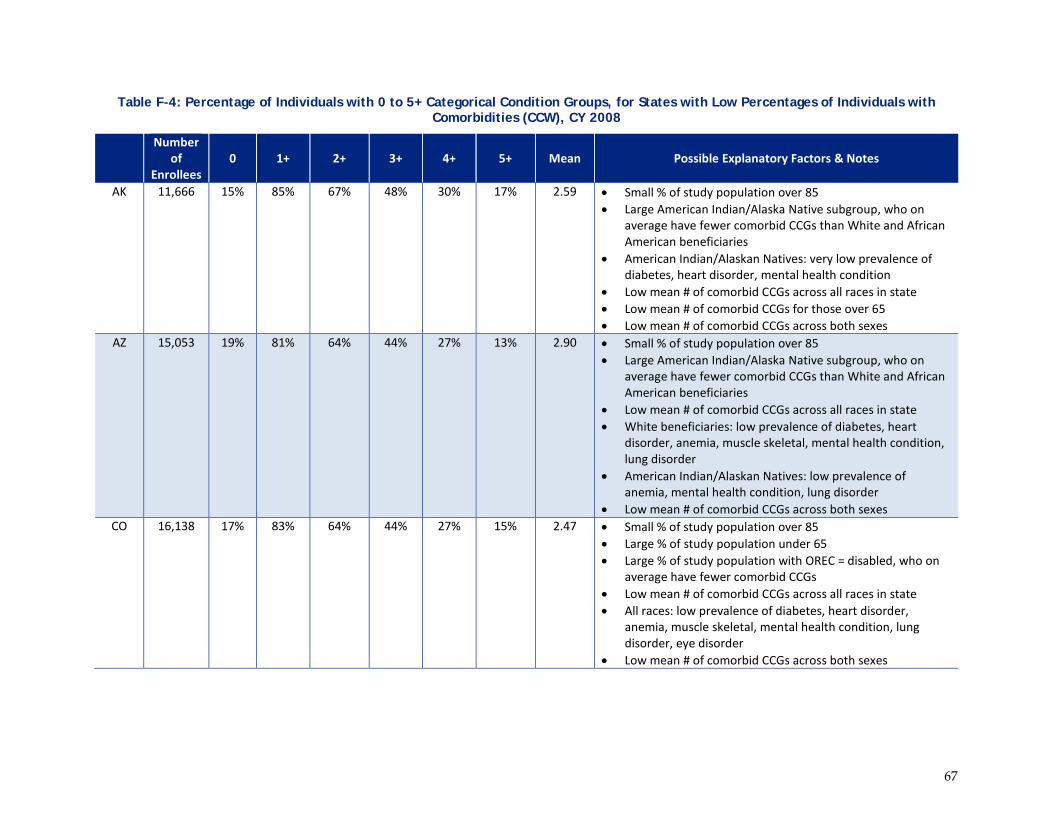
67
Table F-4: Percentage of Individuals with 0 to 5+ Categorical Condition Groups, for States with Low Percentages of Individuals with Comorbidities (CCW), CY 2008
Number
of Enrollees
0 1+ 2+ 3+ 4+ 5+ Mean Possible Explanatory Factors & Notes
AK 11,666 15% 85% 67% 48% 30% 17% 2.59 • Small % of study population over 85 • Large American Indian/Alaska Native subgroup, who on
average have fewer comorbid CCGs than White and African American beneficiaries
• American Indian/Alaskan Natives: very low prevalence of diabetes, heart disorder, mental health condition
• Low mean # of comorbid CCGs across all races in state • Low mean # of comorbid CCGs for those over 65 • Low mean # of comorbid CCGs across both sexes
AZ 15,053 19% 81% 64% 44% 27% 13% 2.90 • Small % of study population over 85 • Large American Indian/Alaska Native subgroup, who on
average have fewer comorbid CCGs than White and African American beneficiaries
• Low mean # of comorbid CCGs across all races in state • White beneficiaries: low prevalence of diabetes, heart
disorder, anemia, muscle skeletal, mental health condition, lung disorder
• American Indian/Alaskan Natives: low prevalence of anemia, mental health condition, lung disorder
• Low mean # of comorbid CCGs across both sexes CO 16,138 17% 83% 64% 44% 27% 15% 2.47 • Small % of study population over 85
• Large % of study population under 65 • Large % of study population with OREC = disabled, who on
average have fewer comorbid CCGs • Low mean # of comorbid CCGs across all races in state • All races: low prevalence of diabetes, heart disorder,
anemia, muscle skeletal, mental health condition, lung disorder, eye disorder
• Low mean # of comorbid CCGs across both sexes

68
Number
of Enrollees
0 1+ 2+ 3+ 4+ 5+ Mean Possible Explanatory Factors & Notes
MN 52,628 14% 86% 63% 42% 25% 14% 2.41 • Large % of study population under 40 • Small % of study population over 85 • Large % of study population with OREC = disabled, who on
average have fewer comorbid CCGs • White beneficiaries in the state, who make up most of the
study population, have a low mean # of comorbid CCGs • White beneficiaries: low prevalence of diabetes, heart
disorder, anemia, muscle skeletal disorder, lung disorder, and eye disorder
• Low mean # of comorbid CCGs across both sexes NM 25,105 15% 85% 68% 49% 31% 7% 2.63 • Small % of study population over 85
• Small % of study population is White beneficiaries, who on average have more comorbid CCGs
• Very large % of study population is Hispanic or American Indian/Alaska Native beneficiaries, who on average have fewer comorbid CCGs than White and African American beneficiaries
• Hispanic beneficiaries: have low prevalence of heart disorder, anemia, mental health condition
• American Indian/Alaskan Natives: low prevalence of anemia, mental health condition, lung disorder
• Somewhat low mean # of comorbid CCGs across all races in state
• Low mean # of comorbid CCGs across both sexes OR 28,311 17% 83% 64% 44% 27% 14% 2.41 • Small % of study population over 85
• Low mean # of comorbid CCGs across all races in state • All races: low prevalence of anemia, diabetes (expect
Hispanic beneficiaries), eye disorder, heart condition, lung disease, muscle skeletal disorder
• Low mean # of comorbid CCGs across both sexes

69
Number
of Enrollees
0 1+ 2+ 3+ 4+ 5+ Mean Possible Explanatory Factors & Notes
SD 16,611 15% 85% 67% 48% 30% 17% 2.60 • Low mean # of comorbid CCGs across all races in state • Most all of study population is White or American
Indian/Alaska Native beneficiaries • White beneficiaries: low prevalence of diabetes, lung
disease • American Indian/Alaskan Natives: low prevalence of lung
disease, muscle skeletal disorder, mental health condition • Low mean # of comorbid CCGs across both sexes
UT 5,998 18% 82% 58% 38% 22% 11% 2.22 • Large % of study population under 40 • Small % of study population over 85 • Large % of study population with OREC = disabled, who on
average have fewer comorbid CCGs • Low mean # of comorbid CCGs across all races in state • All races: low prevalence of anemia, eye disorder, heart
condition, muscle skeletal (except American Indian/Alaskan Native)
• White beneficiaries: low prevalence of diabetes • Low mean # of comorbid CCGs across both sexes
WA 1,776 18% 82% 58% 38% 22% 12% 2.49 • Low mean # of comorbid CCGs across all races in state • All races: low prevalence of anemia (except Hispanic
beneficiaries), diabetes, eye disorder (except Asian/Pacific Islander beneficiaries), heart conditions, , muscle skeletal
• White beneficiaries: low prevalence of lung disease • Low mean # of comorbid CCGs across both sexes
WY 8,153 15% 85% 68% 49% 32% 18% 2.66 • Low mean # of comorbid CCGs across all races in state • All races: low prevalence of anemia, diabetes (except
Asian/Pacific Islander and American Indian/Alaskan Native beneficiaries), eye (except Hispanic beneficiaries), heart condition, muscle skeletal
• Low mean # of comorbid CCGs across both sexes Source: CY 2008 CCW Medicare and Medicaid data, FFS enrollees with at least six months enrollment in Medicare Parts A and B and/or Medicaid.

70
Table F-5: Percentage of Individuals with 0 to 5+ Categorical Condition Groups, for States with High Percentages of Individuals with Comorbidities (CCW), CY 2008
Number
of Enrollees
0 1+ 2+ 3+ 4+ 5+ Mean Explanatory Factors & Notes
CT 75,394 8% 92% 79% 61% 42% 26% 3.21 • Large % of study population over 85 • All races: high prevalence of eye disorder • White beneficiaries: high prevalence of anemia, heart
condition • American Indian/Alaskan Natives: high prevalence of
anemia, heart condition, mental health condition • African American beneficiaries: high prevalence of
diabetes, heart condition • Hispanic beneficiaries: high prevalence of diabetes, heart
condition, lung disease • Asian/Pacific Islander beneficiaries: high prevalence of
heart conditions • High mean # of comorbid CCGs across all races in state • High mean # of comorbid CCGs across both sexes in state
FL 311,262 9% 91% 81% 66% 49% 32% 3.50 • Small % of study population under 40 • Large % of study population with OREC = old age, who on
average have more comorbid CCGs • High mean # of comorbid CCGs across all races in state,
especially for White and Hispanic beneficiaries • White beneficiaries : high prevalence of anemia, diabetes,
heart conditions • Hispanic beneficiaries (mostly over 65): high prevalence of
diabetes, eye disorder, heart condition • High mean # of comorbid CCGs across both sexes
IA 33,947 7% 93% 81% 64% 44% 26% 3.29 • Large % of study population is White beneficiaries over 65, who on average have more comorbid CCGs than other races
• White beneficiaries: high prevalence of anemia, diabetes, eye disorder, heart condition, muscle skeletal
• High mean # of comorbid CCGs for White beneficiaries, compared to White beneficiaries in other states
• Large % of study population with OREC = old age, who on

71
Number
of Enrollees
0 1+ 2+ 3+ 4+ 5+ Mean Explanatory Factors & Notes
average have more comorbid CCGs • Somewhat high mean # of comorbid CCGs across both
sexes KS 19,844 8% 92% 80% 64% 46% 28% 3.33 • Large % of study population is White beneficiaries over 65,
who on average have more comorbid CCGs than other races
• White beneficiaries: high prevalence of anemia, heart condition, muscle skeletal disorder, mental health condition
• Small % of study population under 40 • Large % of study population over 65 • Large % of study population over 85 • Large % of study population with OREC = old age, who on
average have more comorbid CCGs • High mean # of comorbid CCGs across all races in state • High mean # of comorbid CCGs across both sexes
MO 133,161 8% 92% 81% 65% 47% 29% 3.40 • Large % of study population is White or African American beneficiaries, who on average have more comorbid CCGs than other races
• High mean # of comorbid CCGs across all races in state • White beneficiaries: heart condition, lung disease, muscle
skeletal, mental health condition • African American beneficiaries: blood, diabetes, heart
condition, lung disease, muscle skeletal • High mean # of comorbid CCGs across both sexes
NJ 131,945 8% 92% 81% 65% 46% 28% 3.38 • Small % of study population under 40 • Large % of study population over 65 • Large % of study population with OREC = old age, who on
average have more comorbid CCGs • High mean # of comorbid CCGs across all races in state • All races: high prevalence of anemia, diabetes, eye
disorder, heart condition • High mean # of comorbid CCGs across both sexes
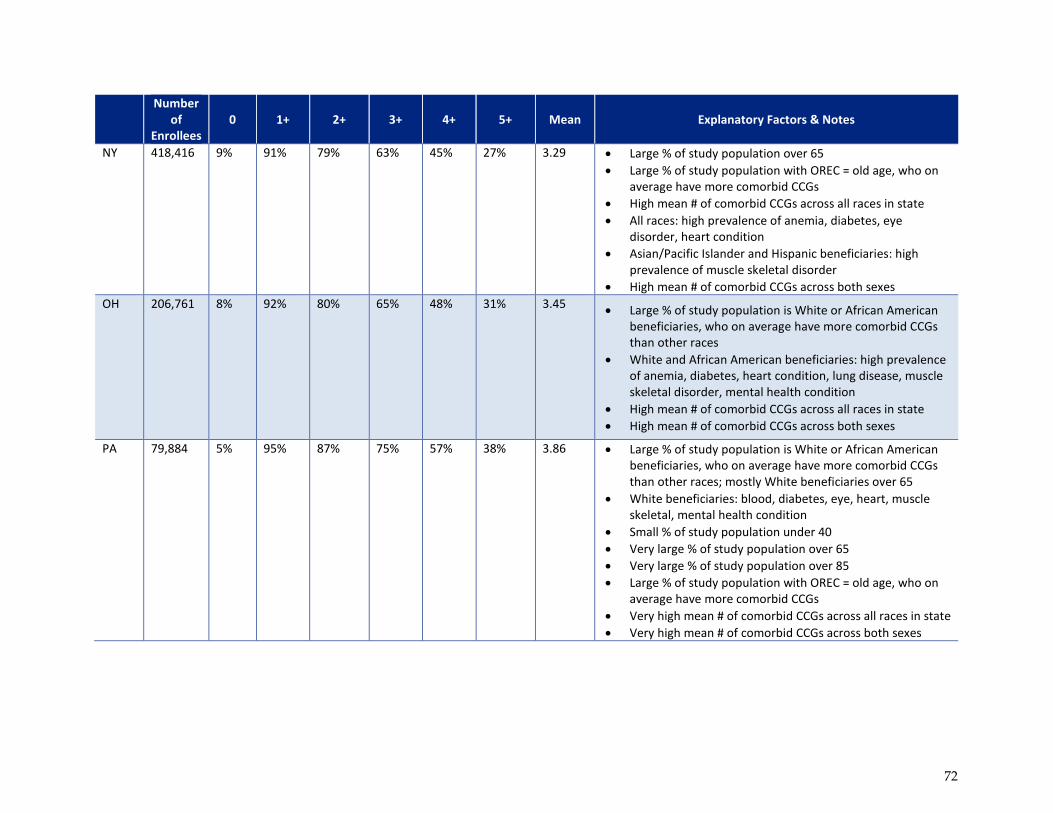
72
Number
of Enrollees
0 1+ 2+ 3+ 4+ 5+ Mean Explanatory Factors & Notes
NY 418,416 9% 91% 79% 63% 45% 27% 3.29 • Large % of study population over 65 • Large % of study population with OREC = old age, who on
average have more comorbid CCGs • High mean # of comorbid CCGs across all races in state • All races: high prevalence of anemia, diabetes, eye
disorder, heart condition • Asian/Pacific Islander and Hispanic beneficiaries: high
prevalence of muscle skeletal disorder • High mean # of comorbid CCGs across both sexes
OH 206,761 8% 92% 80% 65% 48% 31% 3.45 • Large % of study population is White or African American beneficiaries, who on average have more comorbid CCGs than other races
• White and African American beneficiaries: high prevalence of anemia, diabetes, heart condition, lung disease, muscle skeletal disorder, mental health condition
• High mean # of comorbid CCGs across all races in state • High mean # of comorbid CCGs across both sexes
PA 79,884 5% 95% 87% 75% 57% 38% 3.86 • Large % of study population is White or African American beneficiaries, who on average have more comorbid CCGs than other races; mostly White beneficiaries over 65
• White beneficiaries: blood, diabetes, eye, heart, muscle skeletal, mental health condition
• Small % of study population under 40 • Very large % of study population over 65 • Very large % of study population over 85 • Large % of study population with OREC = old age, who on
average have more comorbid CCGs • Very high mean # of comorbid CCGs across all races in state • Very high mean # of comorbid CCGs across both sexes
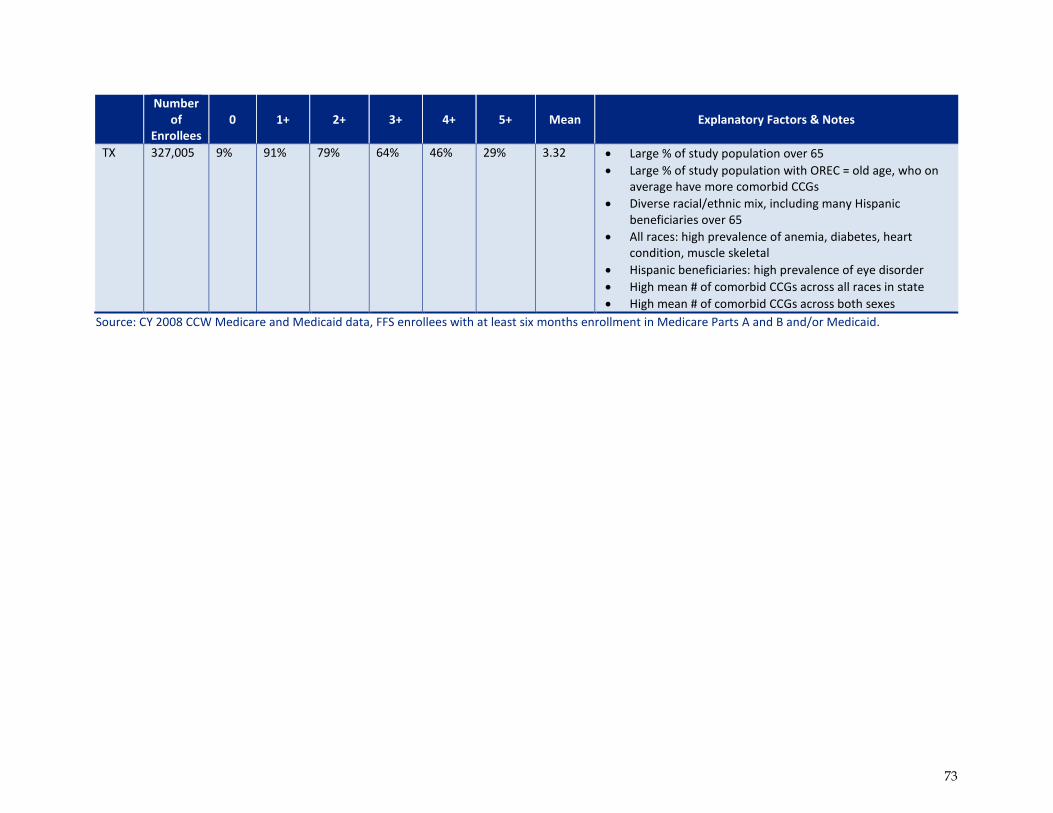
73
Number
of Enrollees
0 1+ 2+ 3+ 4+ 5+ Mean Explanatory Factors & Notes
TX 327,005 9% 91% 79% 64% 46% 29% 3.32 • Large % of study population over 65 • Large % of study population with OREC = old age, who on
average have more comorbid CCGs • Diverse racial/ethnic mix, including many Hispanic
beneficiaries over 65 • All races: high prevalence of anemia, diabetes, heart
condition, muscle skeletal • Hispanic beneficiaries: high prevalence of eye disorder • High mean # of comorbid CCGs across all races in state • High mean # of comorbid CCGs across both sexes
Source: CY 2008 CCW Medicare and Medicaid data, FFS enrollees with at least six months enrollment in Medicare Parts A and B and/or Medicaid.

74
Appendix G: Acronym List
ACA Affordable Care Act
ADHD Attention Deficit Hyperactivity Disorder
ALS Amyotrophic Lateral Sclerosis
BH Behavioral Health
BOE Medicaid Basis of Eligibility
CCG Chronic Condition Groups
CCW Chronic Conditions Warehouse
CKD Chronic Kidney Disease
CMS Centers for Medicare & Medicaid Services
COPD Chronic Obstructive Pulmonary Disease
CY Calendar Year
DME Durable Medical Equipment
ESRD End-Stage Renal Disease
FFS Fee-for-Service
GVDB Geographic Variation Database
HCBS Home and Community-Based Services
HIV/AIDS Human Immunodeficiency Virus/Acquired Immunodeficiency Syndrome
LTC Long-Term Care
MA Medicare Advantage
MCO Managed Care Organizations
MMLEADS Medicare-Medicaid Enrollee Analytic Data Source
OREC Medicare Original Reason for Entitlement Code
PMPM Per Member Per Month
PTSD Post-Traumatic Stress Disorder
QMB Qualified Medicare Beneficiary
RTI Research Triangle Institute
SSDI Social Security Disability Insurance


