Constraints on the interactions between dark matter and baryons from the x-ray quantumcalorimetry experiment
Adrienne L. Erickcek,1,2 Paul J. Steinhardt,2,3 Dan McCammon,4 and Patrick C. McGuire5
1Division of Physics, Mathematics, & Astronomy, California Institute of Technology,Mail Code 103-33, Pasadena, California 91125, USA
2Department of Physics, Princeton University, Princeton, New Jersey 08544, USA3Princeton Center for Theoretical Physics, Princeton University, Princeton, New Jersey 08544, USA
4Department of Physics, University of Wisconsin, Madison, Wisconsin 53706, USA5McDonnell Center for the Space Sciences, Washington University, St. Louis, M0 63130, USA
(Received 4 April 2007; published 30 August 2007)
Although the rocket-based x-ray quantum calorimetry (XQC) experiment was designed for x-rayspectroscopy, the minimal shielding of its calorimeters, its low atmospheric overburden, and its low-threshold detectors make it among the most sensitive instruments for detecting or constraining stronginteractions between dark matter particles and baryons. We use Monte Carlo simulations to obtain theprecise limits the XQC experiment places on spin-independent interactions between dark matter andbaryons, improving upon earlier analytical estimates. We find that the XQC experiment rules out a widerange of nucleon-scattering cross sections centered around 1 b for dark matter particles with massesbetween 0.01 and 105 GeV. Our analysis also provides new constraints on cases where only a fraction ofthe dark matter strongly interacts with baryons.
From Vera Rubin’s discovery that the rotation curves ofgalaxies remain level to radii much greater than predictedby Keplerian dynamics [1] to the Wilkinson MicrowaveAnisotropy Probe (WMAP) measurement of the cosmicmicrowave background (CMB) temperature anisotropypower spectrum [2], observations indicate that the lumi-nous matter we see is only a fraction of the mass in theUniverse. The three-year WMAP CMB anisotropy spec-trum is best fit by a cosmological model with �m �0:241� 0:034 and a baryon density that is less than one-fifth of the total mass density. The cold collisionless darkmatter (CCDM) model has emerged as the predominantparadigm for discussing the missing mass problem. Thedark matter is assumed to consist of nonrelativistic, non-baryonic, weakly interacting particles, often referred to asweakly interacting massive particles (WIMPs).
Although the CCDM model successfully predicts ob-served features of large-scale structure at scales greaterthan one megaparsec [3], there are indications that it mayfail to match observations on smaller scales. Numericalsimulations of CCDM halos [4–12] imply that CCDMhalos have a density profile that increases sharply at smallradii (�� r�1:2 according to Ref. [12]). These predictionsconflict with lensing observations of clusters [13,14] thatindicate the presence of constant-density cores. X-ray ob-servations of clusters have found cores in some clusters,although density cusps have also been observed [15–17].On smaller scales, observations of dwarf and low-surface-brightness galaxies [18–24] indicate that these dark matterhalos have constant-density cores with lower densities thanpredicted by numerical simulations. Observations also in-
dicate that cores are predominant in spiral galaxies as well,including the Milky Way [25–27]. Numerical simulationsof CCDM halos also predict more satellite halos than areobserved in the local group [28,29] and fossil groups [30].
Astrophysical explanations for the discord between thedensity profiles predicted by CCDM simulations and ob-servations have been proposed: for instance, dynamicalfriction may transform density cusps into cores in the innerregions of clusters [31], and the triaxiality of galactic halosmay mask the true nature of their inner density profiles[32]. There are also models of substructure formation thatexplain the observed paucity of satellite halos [33–36].
Another possible explanation for the apparent failure ofthe CCDM model to describe the observed features of darkmatter halos is that dark matter particles scatter strongly offone another. The discrepancies between observations andthe CCDM model are alleviated if one introduces a darkmatter self-interaction that is comparable in strength to theinteraction cross section between neutral baryons [37,38]:
�DD
mdm� 8� 10�25–1� 10�23 cm2 GeV�1; (1)
where �DD is the cross section for scattering between darkmatter particles and mdm is the mass of the dark matterparticle. Numerical simulations have shown that introduc-ing dark matter self-interactions within this range reducesthe central slope of the halo density profile and reduces thecentral densities of halo cores, in addition to destroying theextra substructure [39,40].
The numerical coincidence between this dark matterself-interaction cross section and the known strong-interaction cross section for neutron-neutron or neutron-proton scattering has reinvigorated interest in the possibil-
ity that dark matter interacts with itself and with baryonsthrough the strong nuclear force. We refer to dark matter ofthis type as ‘‘strongly interacting dark matter’’ where‘‘strong’’ refers specifically to the strong nuclear force.Strongly interacting dark matter candidates include thedibaryon [41,42], the Q-ball [43], and O-helium [44].
Surprisingly, the possibility that the dark matter may bestrongly interacting is not ruled out. While there are nu-merous experiments searching for WIMPs, they are largelyinsensitive to dark matter that interacts strongly with bary-ons. The reason is that WIMP searches are typically con-ducted at or below ground level based on the fact thatWIMPs can easily penetrate the atmosphere or the Earth,whereas strongly interacting dark matter is multiply scat-tered and thermalized by the time it reaches ground leveland its thermal kinetic energy is too small to producedetectable collisions with baryons in WIMP detectors.Consequently, there are few experiments capable of detect-ing strongly interacting dark matter directly. Starkmanet al. [45] summarized the constraints on strongly interact-ing dark matter from experiments prior to 1990, and theseconstraints were later refined [38,46–48]. The strength ofdark matter interactions with baryons may also be con-strained by galactic dynamics [45], cosmic rays [45,49],big bang nucleosynthesis (BBN) [49], the CMB [50], andlarge-scale structure [50].
The XQC project launched a rocket-mounted microca-lorimeter array in 1999 [51]. At altitudes above 165 km, theXQC detector collected data for a little less than twominutes. Although its primary purpose was x-ray spectros-copy, the limited amount of shielding in front of thecalorimeters and the low atmospheric overburden makesthe XQC experiment a sensitive detector of strongly inter-acting dark matter.
In this article, we present a new numerical analysis ofthe constraints on spin-independent interactions betweendark matter particles and baryons from the XQC experi-ment using Monte Carlo simulations of dark matter parti-cles interacting with the XQC detector and the atmosphereabove it. Our work is a significant improvement upon theearlier analytic estimates presented by some of us inRefs. [38,48] because it accurately models the dark matterparticle’s interactions with the atmosphere and the XQCinstrument. Our calculation here also supersedes the ana-lytic estimate by Zaharijas and Farrar [52] because theyonly considered a small portion of the XQC data and didnot include multiple scattering events nor the overburdenof the XQC detector. We restrict our analysis to spin-independent interactions because the XQC calorimetersare not highly sensitive to spin-dependent interactions.Only a small fraction of the target nuclei in the calorim-eters have nonzero spin; consequently, the bound on spin-dependent interactions between baryons and dark matterfrom the XQC experiment is about 4 orders of magnitudeweaker than the bound on spin-independent interactions[52].
This article is organized as follows. In Sec. II we sum-marize the specifications of the XQC detector. We thenreview dark matter detection theory in Sec. III. This sectionincludes a discussion of coherent versus incoherent scat-tering and how we account for the loss of coherence in ouranalysis. A complete description of our analysis follows inSec. IV, and our results are presented in Sec. V. Finally, inSec. VI, we summarize our findings and compare theconstraints to strongly interacting dark matter from theXQC experiment to those from other experiments.
II. THE XQC EXPERIMENT
Calorimetry is the use of temperature deviations tomeasure changes in the internal energy of a material. Bydrastically reducing the specific heat of the absorbingmaterial, the use of cryogenics in calorimetry allows theabsorbing object to have a macroscopic volume and still besensitive to minute changes in energy. These detectors aresensitive enough to register the energy deposited by asingle photon or particle and gave birth to the techniqueof ‘‘quantum calorimetry,’’ the thermal measurement ofenergy quanta.
The quantum calorimetry experiment [51] we use toconstrain interactions between dark matter particles andbaryons is the second rocket-born experiment in the XQCProject, a joint undertaking of the University of Wisconsinand the Goddard Space Flight Center [53,54]. It launchedon March 28, 1999 and collected about 100 seconds of dataat altitudes between 165 and 225 km above the Earth’ssurface. The detector consisted of 34 quantum calorimetersoperating at a temperature of 0.06 K; for detailed informa-tion on the XQC detector functions, please refer toRefs. [51,54]. These detectors were separated from theexterior of the rocket by five thin filter panes [51]. Thesmall atmospheric overburden at this altitude and the mini-mal amount of shielding in front of the calorimeters makesthis experiment a promising probe of strongly interactingdark matter.
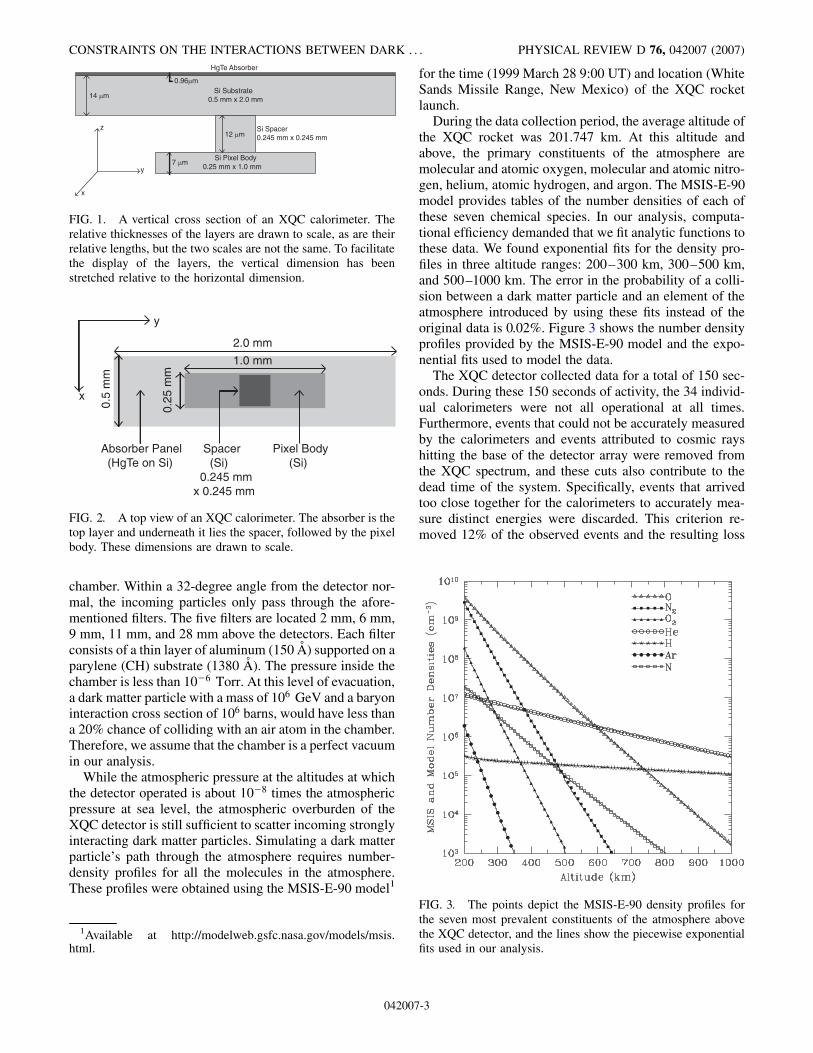
The absorbers in the XQC calorimeters are composed ofa thin film of HgTe (0:96 �m thick) deposited on a silicon(Si) substrate that is 14 �m thick. The absorbers rest onsilicon spacers and silicon pixel bodies. Figures 1 and 2show side and top views of the detectors with the dimen-sions of each layer. Temperature changes in all four com-ponents are measured by the calorimeter’s internalthermometer. The calorimeters report the average tempera-ture over an integration time of 7 ms in order to reduce theeffect of random temperature fluctuations on the measure-ment. Multiple scatterings by a dark matter particle willregister as a single event because the time it takes the darkmatter particle to make its way through the calorimeter issmall compared to the integration time.
The detector array consists of two rows of detectors,with 17 active calorimeters and one inactive calorimeter ineach row, and is located at the bottom of a conical detector
ERICKCEK, STEINHARDT, MCCAMMON, AND MCGUIRE PHYSICAL REVIEW D 76, 042007 (2007)
042007-2
chamber. Within a 32-degree angle from the detector nor-mal, the incoming particles only pass through the afore-mentioned filters. The five filters are located 2 mm, 6 mm,9 mm, 11 mm, and 28 mm above the detectors. Each filterconsists of a thin layer of aluminum (150 A) supported on aparylene (CH) substrate (1380 A). The pressure inside thechamber is less than 10�6 Torr. At this level of evacuation,a dark matter particle with a mass of 106 GeV and a baryoninteraction cross section of 106 barns, would have less thana 20% chance of colliding with an air atom in the chamber.Therefore, we assume that the chamber is a perfect vacuumin our analysis.
While the atmospheric pressure at the altitudes at whichthe detector operated is about 10�8 times the atmosphericpressure at sea level, the atmospheric overburden of theXQC detector is still sufficient to scatter incoming stronglyinteracting dark matter particles. Simulating a dark matterparticle’s path through the atmosphere requires number-density profiles for all the molecules in the atmosphere.These profiles were obtained using the MSIS-E-90 model1
for the time (1999 March 28 9:00 UT) and location (WhiteSands Missile Range, New Mexico) of the XQC rocketlaunch.
During the data collection period, the average altitude ofthe XQC rocket was 201.747 km. At this altitude andabove, the primary constituents of the atmosphere aremolecular and atomic oxygen, molecular and atomic nitro-gen, helium, atomic hydrogen, and argon. The MSIS-E-90model provides tables of the number densities of each ofthese seven chemical species. In our analysis, computa-tional efficiency demanded that we fit analytic functions tothese data. We found exponential fits for the density pro-files in three altitude ranges: 200–300 km, 300–500 km,and 500–1000 km. The error in the probability of a colli-sion between a dark matter particle and an element of theatmosphere introduced by using these fits instead of theoriginal data is 0.02%. Figure 3 shows the number densityprofiles provided by the MSIS-E-90 model and the expo-nential fits used to model the data.
The XQC detector collected data for a total of 150 sec-onds. During these 150 seconds of activity, the 34 individ-ual calorimeters were not all operational at all times.Furthermore, events that could not be accurately measuredby the calorimeters and events attributed to cosmic rayshitting the base of the detector array were removed fromthe XQC spectrum, and these cuts also contribute to thedead time of the system. Specifically, events that arrivedtoo close together for the calorimeters to accurately mea-sure distinct energies were discarded. This criterion re-moved 12% of the observed events and the resulting loss
x
y
2.0 mm
0.5
mm
0.25
mm
1.0 mm
Absorber Panel (HgTe on Si)
Pixel Body (Si)
Spacer (Si) 0.245 mm x 0.245 mm
FIG. 2. A top view of an XQC calorimeter. The absorber is thetop layer and underneath it lies the spacer, followed by the pixelbody. These dimensions are drawn to scale.
FIG. 3. The points depict the MSIS-E-90 density profiles forthe seven most prevalent constituents of the atmosphere abovethe XQC detector, and the lines show the piecewise exponentialfits used in our analysis.
Si Substrate0.5 mm x 2.0 mm14 µm
12 µm
7 µm
z
y
x
HgTe Absorber
0.96µm
Si Pixel Body0.25 mm x 1.0 mm
Si Spacer0.245 mm x 0.245 mm
FIG. 1. A vertical cross section of an XQC calorimeter. Therelative thicknesses of the layers are drawn to scale, as are theirrelative lengths, but the two scales are not the same. To facilitatethe display of the layers, the vertical dimension has beenstretched relative to the horizontal dimension.
1Available at http://modelweb.gsfc.nasa.gov/models/msis.html.
CONSTRAINTS ON THE INTERACTIONS BETWEEN DARK . . . PHYSICAL REVIEW D 76, 042007 (2007)
042007-3
of sensitivity was included in the dead time of the calo-rimeters. When a cosmic ray penetrates the silicon base ofthe detector array, the resulting temperature increase isexpected to register as multiple, nearly simultaneous,low-energy events on nearby calorimeters. To removethese events from the spectrum, we cut out events thatwere part of either a pair of events in adjacent detectorsor a trio of events in any of the detectors that arrived within3 ms of each other and had energies less than 2.5 keV. Thisprocedure was expected to remove more than 97% of theevents that resulted from cosmic rays hitting the base of thearray. Nearly all of the events attributed to heating fromcosmic rays had energies less than 300 eV, and a highfraction of the observed low-energy events were includedin this cut. For example, seventeen of the observed 24events with energies less than 100 eV were removed. Theexpected loss of sensitivity due to events being falselyattributed to cosmic rays was included in the calculateddead time of the calorimeters. Once all the dead time isaccounted for, the 150 seconds of data collection is equiva-lent to 100.7 seconds of observation with all 34 calorim-eters operational.
The XQC calorimeters are capable of detecting energydeposits that exceed 20 eV, but full sensitivity is notreached until the energy surpasses 36 eV, and for approxi-
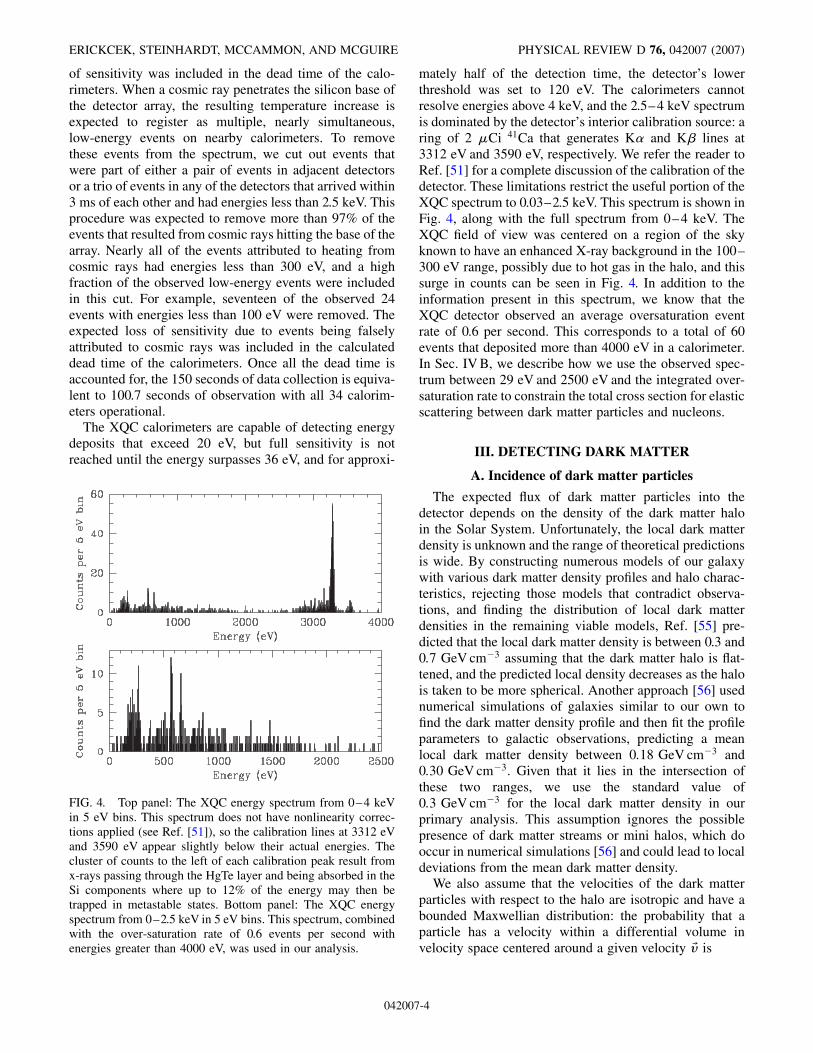
mately half of the detection time, the detector’s lowerthreshold was set to 120 eV. The calorimeters cannotresolve energies above 4 keV, and the 2.5–4 keV spectrumis dominated by the detector’s interior calibration source: aring of 2 �Ci 41Ca that generates K� and K� lines at3312 eV and 3590 eV, respectively. We refer the reader toRef. [51] for a complete discussion of the calibration of thedetector. These limitations restrict the useful portion of theXQC spectrum to 0.03–2.5 keV. This spectrum is shown inFig. 4, along with the full spectrum from 0–4 keV. TheXQC field of view was centered on a region of the skyknown to have an enhanced X-ray background in the 100–300 eV range, possibly due to hot gas in the halo, and thissurge in counts can be seen in Fig. 4. In addition to theinformation present in this spectrum, we know that theXQC detector observed an average oversaturation eventrate of 0.6 per second. This corresponds to a total of 60events that deposited more than 4000 eV in a calorimeter.In Sec. IV B, we describe how we use the observed spec-trum between 29 eV and 2500 eV and the integrated over-saturation rate to constrain the total cross section for elasticscattering between dark matter particles and nucleons.
III. DETECTING DARK MATTER
A. Incidence of dark matter particles
The expected flux of dark matter particles into thedetector depends on the density of the dark matter haloin the Solar System. Unfortunately, the local dark matterdensity is unknown and the range of theoretical predictionsis wide. By constructing numerous models of our galaxywith various dark matter density profiles and halo charac-teristics, rejecting those models that contradict observa-tions, and finding the distribution of local dark matterdensities in the remaining viable models, Ref. [55] pre-dicted that the local dark matter density is between 0.3 and0:7 GeV cm�3 assuming that the dark matter halo is flat-tened, and the predicted local density decreases as the halois taken to be more spherical. Another approach [56] usednumerical simulations of galaxies similar to our own tofind the dark matter density profile and then fit the profileparameters to galactic observations, predicting a meanlocal dark matter density between 0:18 GeV cm�3 and0:30 GeV cm�3. Given that it lies in the intersection ofthese two ranges, we use the standard value of0:3 GeV cm�3 for the local dark matter density in ourprimary analysis. This assumption ignores the possiblepresence of dark matter streams or mini halos, which dooccur in numerical simulations [56] and could lead to localdeviations from the mean dark matter density.
We also assume that the velocities of the dark matterparticles with respect to the halo are isotropic and have abounded Maxwellian distribution: the probability that aparticle has a velocity within a differential volume invelocity space centered around a given velocity ~v is
FIG. 4. Top panel: The XQC energy spectrum from 0–4 keVin 5 eV bins. This spectrum does not have nonlinearity correc-tions applied (see Ref. [51]), so the calibration lines at 3312 eVand 3590 eV appear slightly below their actual energies. Thecluster of counts to the left of each calibration peak result fromx-rays passing through the HgTe layer and being absorbed in theSi components where up to 12% of the energy may then betrapped in metastable states. Bottom panel: The XQC energyspectrum from 0–2.5 keV in 5 eV bins. This spectrum, combinedwith the over-saturation rate of 0.6 events per second withenergies greater than 4000 eV, was used in our analysis.
ERICKCEK, STEINHARDT, MCCAMMON, AND MCGUIRE PHYSICAL REVIEW D 76, 042007 (2007)
042007-4
P� ~v� ��
1k exp
�� v2
v20
�d3 ~v if v � vesc;
0 if v > vesc;(2)
where v0 is the dispersion velocity of the halo, vesc is thegalactic escape velocity at the Sun’s position, and k is anormalization factor [57]:
k � ��v20�
3=2
�erf�vesc
v0
��
�2�����p
�vesc
v0e�v
2esc=v
20
�: (3)
Numerical simulations indicate that dark matter particlevelocities may not have an isotropic Maxwellian distribu-tion [56]. Reference [58] examines how assuming a morecomplicated velocity distribution would alter the flux ofdark matter particles into an Earth-based detector.
Given the flat rotation curve of the spiral disk at theSun’s radius and beyond and assuming a spherical halo, thelocal dispersion speed v0 is the maximum rotational ve-locity of the Galaxy vc [59]. Reported values for the rota-tional speed include 222� 20 km s�1 [60],228� 19 km s�1 [61], 184� 8 km s�1 [62], and 230�30 km s�1 [63]. Recent measurements of the Galaxy’sangular velocity have yielded values of �gal �
28� 2 km s�1 kpc�1 [64] and 32:8� 2 km s�1 kpc�1
[65]. If the Sun is located 8.0 kpc from the galactic center,these angular velocities correspond to tangential velocities224� 16 km s�1 and 262� 16 km s�1, respectively. Weadopt vc � 220� 30 km s�1 as a centrally conservativevalue for the Galaxy’s circular velocity at the Sun’slocation.
The final parameter we need to obtain the dark matter’svelocity distribution is the escape velocity in the Solarvicinity. The largest observed stellar velocity at the Sun’sradius in the Milky Way is 475 km s�1, which establishes alower bound for the local escape velocity [66].Reference [67] used the radial motion of Carney-Lathamstars to determine that the escape velocity is between 450and 650 km s�1 to 90% confidence, and Ref. [68] obtaineda 90% confidence interval of 498 to 608 km s�1 fromobservations of high-velocity stars. A kinematic derivationof the escape velocity [59] gives
v2esc � 2v2
c
�1 ln
�Rgal
R0
��; (4)
where R0 is the distance from the Sun to the center of theGalaxy, and Rgal is the radius of the Galaxy. Observationsof other galaxies suggest that our galaxy extends to about100 kpc [59], and observations of galactic satellites indi-cate that the Galaxy’s flat rotation curve extends to at least110 kpc [63]. The commonly accepted value for the solarradius is R0 � 8:0 kpc [69]. Recent measurements includeR0 � 7:9� 0:3 kpc [70] and R0 � 8:01� 0:44 kpc [71],and a compilation of measurements over the past decade[71] yields an average value of R0 � 7:80� 0:33 kpc. Toestimate the escape velocity, we use 100 kpc as a conser-
vative estimate of the galactic radius and the standard valueR0 � 8:0 kpc. These parameters, combined with vc �220 km s�1, predict an escape velocity of 584 km s�1,which falls near the middle of the ranges proposed inRefs. [67,68].
The isotropic Maxwellian velocity distribution given byEq. (2) specifies the dark matter particles’ motion relativeto the halo. However, we are interested in their motionrelative to the XQC detector: ~vobserved � ~vdm � ~vdetector
where the latter two velocities are measured with respectto the halo. The velocity of the detector with respect to thehalo has three components: the velocity of the Sun relativeto halo, the velocity of the Earth with respect to the Sun,and the velocity of the detector with respect to the Earth.
When discussing these velocities, it is useful to define agalactic Cartesian coordinate system. In galactic coordi-nates, the Sun is located at the origin, and the xy-plane isdefined by the galactic disk. The x-axis points toward thecenter of the Galaxy, and the y-axis points in the directionof the Sun’s tangential velocity as it revolves around thegalactic center. The z-axis points toward the north galacticpole and is antiparallel to the angular momentum of therotating disk. The motion of the Sun through the halo hastwo components. First, there is the Sun’s rotational velocityas it orbits the galactic center: vc in the y direction. Second,there is the motion of the Sun relative to the spiral disk[72]: ~v��10:00�0:36;5:25�0:62;7:17�0:38� kms�1
in galactic Cartesian coordinates. When the Earth’s motionthrough the Solar System during its annual orbit of theSun is expressed in galactic coordinates [57], the resultingvelocity at the time of the XQC experiment (7.3 daysafter the vernal equinox) is ~vEarth � �29:14; 5:330;�3:597� km s�1.
The final consideration is the velocity of the detectorrelative to the Earth. The maximum velocity attained bythe XQC rocket was less than 1:2 km s�1. This velocity isinsignificant compared to the motion of the Sun relative tothe halo. Moreover, the XQC detector collected data whilethe rocket rose and while it fell, and the average velocity ofthe rocket was only 0:104 km s�1. Therefore, we neglectthe motion of the rocket in the calculation of the darkmatter wind. Combining the motion of the Sun and theEarth then gives the total velocity of the XQC detector withrespect to the halo during the experiment in galacticCartesian coordinates: ~vdetector � �39:14� 0:36; 230:5�30; 3:573� 0:38� km s�1. Subtracting the velocity vectorof the detector relative to the halo from the velocity vectorof the dark matter relative to the halo gives the darkmatter’s velocity relative to the detector in galactic coor-dinates. However, we want the dark matter particles’ ve-locities in the coordinate frame defined by the detector,where the z-axis is the field-of-view vector. The XQCfield of view was centered on l � 90�, b � 60� in ga-lactic latitude and longitude [51], so the rotation fromgalactic coordinates to detector coordinates may be de-scribed as a clockwise 30� rotation of the z-axis around the
CONSTRAINTS ON THE INTERACTIONS BETWEEN DARK . . . PHYSICAL REVIEW D 76, 042007 (2007)
042007-5
x-axis, which is taken to be the same in both coordinatesystems.
B. Dark matter interactions
Calorimetry measures the kinetic energy transferredfrom the dark matter to the absorbing material withoutregard for the specific mechanism of the scattering or anyother interactions. Consequently, the dark matter detectionrate for a calorimeter depends only on the mass of the darkmatter particle and the total cross section for elastic scat-tering between the dark matter particle and an atomicnucleus of mass number A, which is proportional to thecross section for dark matter interactions with a singlenucleon (�Dn). The calorimeter measures the recoil energyof the target nucleus (mass mT),
Erec �
�1
2mdmv
2dm
�2mTmdm
�mT mdm�2 �1� cos�CM�; (5)
where mdm and vdm are dark matter particle’s mass andvelocity prior to the collision in the rest frame of the targetnucleus and �CM is the scattering angle in the center-of-mass frame.
If the momentum transferred to the nucleus, q2 �2mTErec, is small enough that the corresponding deBroglie wavelength is larger than the radius R of thenucleus (qR� @), then the scattering is coherent. In co-herent scattering, the scattering amplitudes for each indi-vidual component in the conglomerate body are addedprior to the calculation of the cross section, so the totalcross section is proportional to the square of the massnumber of the target nucleus. Including kinematic factors[45,73], the cross section for coherent scattering off anucleus is given by
�coh�A� � A2
�mred�DM;Nuc�
mred�DM; n�
�2�Dn; (6)
where mred�DM;Nuc� is the reduced mass of the nucleusand the dark matter particle, mred�DM; n� is the reducedmass of a nucleon and the dark matter particle, and A is themass number of the nucleus. Coherent scattering is iso-tropic in the center-of-mass frame of the collision.
Dark matter particles may be massive and fast-movingenough that the scattering is not completely coherent whenthe target nucleus is large [74]. When the scattering isincoherent, the dark matter particle ‘‘sees’’ the internalstructure of the nucleus, and the cross section for scatteringis reduced by a ‘‘form factor,’’ which is a function of themomentum transferred to the nucleus during the collision(q) and the nuclear radius (R):
d�d���coh
4�F2�q; R�: (7)
Since q depends on the recoil energy, which in turn de-pends on the scattering angle, incoherent scattering is notisotropic.
In this discussion of coherence, we have neglected thepossible effects of the dark matter particle’s internal struc-ture by assuming that �Dn is independent of recoil energy.If the dark matter particle is not pointlike then �Dn de-creases as the recoil momentum increases due to a loss ofcoherence within the dark matter particle. Incoherencewithin the dark matter particle has observational conse-quences [75], but these effects depend on the size of thedark matter particle. To avoid restricting ourselves to aparticular dark matter model, we assume that the darkmatter particle is small enough that nucleon scattering isalways coherent; when we discuss incoherence, we arereferring to the effects of the nucleus’s internal structure.
According to the Born approximation, the form factorfor nuclear scattering defined in Eq. (7) is the Fouriertransform of the nuclear ground-state mass density[57,76]. The most common choice for the form factor[74,77] is F2�q; R� � exp ��qRrms�
2=�3@2��, where Rrms
is the root-mean-square radius of the nucleus. For a solidsphere, R2
rms � �3=5�R2, so this form factor is equivalent tothe form factor used in Ref. [52]. This form factor is anaccurate approximation of the Fourier transform of a solidsphere for �qR�=@ & 2, but it grossly underestimates thereduction in � for larger values of q [57]. The maximumspeed of a dark matter particle with respect to the XQCdetector is �800 km s�1 (escape velocity detectorvelocity), and at that speed, the maximum possible valueof qR=@ for a collision with a Hg nucleus (A � 200) isnearly ten for a 100 GeV dark matter particle, and themaximum possible value of qR=@ increases as the mass ofthe dark matter particle increases. Clearly, this approxima-tion is not appropriate for a large portion of the dark matterparameter space probed by the XQC experiment.
Furthermore, a solid sphere is not a very realistic modelof the nucleus. A more accurate model of the nuclear massdensity is ��r� �
Rd3r0�0�r0��1�r� r0�, where �0 is con-
stant inside a radius R20 � R2 � 5s2 and zero beyond that
radius and �1 � exp �r2=�2s2��, where s is a ‘‘skin thick-ness’’ for the nucleus [78]. The resulting form factor is
F�q; R� � 3�
sin�qR=@� � �qR=@� cos�qR=@�
�qR=@�3
�
� exp��
1
2�qs=@�2
�: (8)
We follow Ref. [57] in setting the parameters in Eq. (8):s � 0:9 fm and
R2 � �1:23A1=3 � 0:6�2 0:631�2 � 5s2� fm2; (9)
where A is the mass number of the target nucleus.Despite its simple analytic form, the form factor given
by Eq. (8) is computationally costly to evaluate repeatedly.We use an approximation:
ERICKCEK, STEINHARDT, MCCAMMON, AND MCGUIRE PHYSICAL REVIEW D 76, 042007 (2007)
042007-6
F2 �
8>>><>>>:
exp��
�qR@
�2�
15
�0:9 fmR
�2��
if qR@� 2;
9�0:81��qR=@�4
exp��
�qR@
�2�
0:9 fmR
�2�
if qR@> 2:
(10)
The low-q approximation combines the standard approxi-mation for the solid sphere with the factor accounting forthe skin depth of the nucleus. The high-q approximationwas derived from the asymptotic form of the first sphericalBessel function and normalized so that the total crosssection is as close as possible to the exact result. The errorin the total cross section due to the use of the approxima-tion is less than 1% for nearly all dark matter masses; thesole exception is mdm � 10–100 GeV, and even then theerror is less than 5%. Unless otherwise noted, we use thisapproximation for the form factor throughout this analysis.We also assume that the dark matter particle does notinteract with nuclei in any way other than elastic scattering.
IV. ANALYSIS OF XQC CONSTRAINTS
To obtain an accurate description of the XQC experi-ment’s ability to detect strongly interacting dark matterparticles, we turned to Monte Carlo simulations. TheMonte Carlo code we wrote to analyze the XQC experi-ment simulates a dark matter particle’s journey through theatmosphere to the XQC detector chamber, its path throughthe detector chamber to a calorimeter, and its interactionwith the sensitive components of the calorimeter. Thislatter portion of the code also records how much energythe particle deposits in the calorimeter through scattering.The results of several such simulations for the same set ofdark matter properties may be used to predict the like-lihood that a given dark matter particle will deposit aparticular amount of energy into the calorimeter. Theseprobabilities of various energy deposits predict the recoil-energy spectrum the XQC detector would observe if thedark matter particles have a given mass and nucleon-scattering cross section. This simulated spectrum maythen be compared to the XQC data to find which darkmatter parameters are excluded by the XQC experiment.
A. Generating simulated energy-recoil spectra
The basic subroutine in our Monte Carlo algorithm is thestep procedure. The step procedure begins with a particlewith a certain velocity vector and position in a givenmaterial and moves the particle a certain distance in thematerial, returning its new position and velocity. The stepprocedure also determines whether or not a scattering eventoccurred during the particle’s trek and updates the velocityaccordingly. The number of expected collisions in a step oflength l through a material with target number density n isn� �tot � l, where �tot is the total scattering cross sectionobtained by integrating Eq. (7) over the scattering angle, orequivalently, the recoil momentum q:
�tot ��coh
q2max
Z q2max
0F2�q; R�dq2; (11)
where qmax is the maximum possible recoil momentum.The step length l is chosen so that it is at most a tenth of themean free path through the material, so the number ofexpected collisions is less than one and represents theprobability of a collision. After each step, a random num-ber between zero and one is generated using the‘‘Mersenne Twister’’ (MT) algorithm [79] and if that ran-dom number is less than the probability of a collision, theparticle’s energy and trajectory are updated. First, a recoilmomentum is selected according to the probability distri-bution P�q2� � F2�q; R��coh=�q2
max�tot�, where the exactform factor is used for qR=@> 2 so that the oscillatorynature of the form factor is not lost. The recoil momentumdetermines the recoil energy and the scattering angle in thecenter-of-mass frame through Eq. (5). The scattering isaxisymmetric around the scattering axis, so the azimuthalangle is assigned a random value between 0 and 2�. Thescattering angles are used to update the particle’s trajec-tory, and its speed is decreased in accordance with thekinetic energy transferred to the target nucleus. The stepsubroutine repeats until the particle exits the simulation, orits kinetic energy falls below 0.1 eV, or the energy depos-ited in the calorimeter exceeds the saturation point of4000 eV.
Our simulation treats the atmosphere as a 4:6� 4:6 cmsquare column with periodic boundary conditions, thebottom face of which covers the top of the conical detectorchamber described in Sec. II. This implementation as-sumes that for every particle that exits one side of thecolumn, there is a particle that enters the column fromthe opposite side with the same velocity. The infinite extentof the atmosphere and its translational invariance makesthis assumption reasonable. The atmosphere column ex-tends to an altitude 1000 km; increasing the atmosphereheight beyond 1000 km has a negligible effect on the totalnumber of collisions in the atmosphere. The simulationbegins with a dark matter particle at the top of the atmo-sphere column at a random initial position on the 4:6�4:6 cm square. Its initial velocity with respect to the darkmatter halo is selected according to the isotropicMaxwellian velocity distribution function given byEq. (2), and then the velocity relative to the detector isfound via the procedure described in Sec. III A.
The dark matter particle’s path from the top of theatmosphere to the detector is modeled using the stepprocedure described above. The simulation of the particle’sinteraction with the atmosphere ends if the particle’s alti-tude exceeds 1000 km or if the particle falls below theheight of the XQC rocket. We use the time-averagedaltitude (201.747 km) as the constant altitude of the rocket.We made this simplification because it allows us to ignorethe periodic inactivity of each calorimeter and treat thedetector as 34 calorimeters that are active for 100.7 sec-
CONSTRAINTS ON THE INTERACTIONS BETWEEN DARK . . . PHYSICAL REVIEW D 76, 042007 (2007)
042007-7
onds. When the dark matter particle hits the rocket, its paththrough the five filter layers is also modeled using the stepprocedure, as is its path through the calorimeters. In addi-tion to being smaller than the mean free path, the steplength is chosen so that the particle’s position relative tothe boundaries of the detectors is accurately modeled. Thesimulation ends when the dark matter particle’s random-walk trajectory takes it out of the detector chamber. Asmentioned in Sec. II, the calorimeter detects the sum of allthe recoil energies if the dark matter particle is scatteredmultiple times.
When the dark matter particle is unlikely to experiencemore than one collision in the calorimeter, this simulationis far more detailed than is required to accurately predictthe energy deposited by the dark matter particle. This is thecase for the lightest (mdm � 102 GeV) and weakest-interacting (�Dn � 10�26 cm2) dark matter particles thatthe XQC calorimeters are capable of detecting. Since thelightest dark matter particles are also the most numerous,many Monte Carlo trials are required to sample all thepossible outcomes of a dark matter particle’s encounterwith the detector. The simulation described above is toocomputationally intensive to run that many trials, so weused a faster and simpler simulation to model the inter-actions of these dark matter particles. This simulationassumes that the particle will experience at most onecollision in the atmosphere and at most one collision ineach filter layer and each layer of the calorimeter. Thesimulation ends if the probability of two scattering eventsin either the atmosphere or any of the filter layers exceeds0.1. Instead of tracking the dark matter particle’s paththrough the atmosphere, the total overburden for the atmo-sphere is used to determine the probability that the darkmatter particle scatters in the atmosphere, and the particleonly reaches the detector if its velocity vector points to-ward the detector after the one allowed scattering event.Also, instead of the small step lengths required to accu-rately model the random walk of a strongly interactingparticle, each layer is crossed with a single step. Thesesimplifications reduce the runtime of the simulation by afactor of 100, making it possible to run 1010 trials in lessthan 1 day.
B. Comparing the simulations to the XQC data
In order to compare the probability spectra produced byour Monte Carlo routine to the results of the XQC experi-ment, we must multiply the probabilities by the number ofdark matter particles that are encountered by the initialsurface of the Monte Carlo routine. When the initial ve-locity of the dark matter particle is chosen, the initialvelocity may point toward or away from the detector; inthe latter case, the trial ends immediately. Consequently,the Monte Carlo probability that the particle deposits noenergy in the calorimeter already includes the probabilitythat the dark matter particle does not have a halo trajectory
that takes it into the atmosphere. Therefore, the probabil-ities resulting from the Monte Carlo routine should bemultiplied by the number of particles in the volume sweptout by the initial 4:6� 4:6 cm2 square surface during the100:7f�E� sec of observation time, where f is the fractionof the observing time that the XQC detector was sensitiveto deposits of energy E. For energies between 36 and88 eV, f is 0.5083, and the value of f increases to oneover energies between 88 and 128 eV. The detector wasalso slightly sensitive to lower energies: between 29 and35 eV, f increases from 0.3815 to 0.5083. The normal ofthe initial surface points along the detector’s field of view,and the surface moves with the detector; using the detectorvelocity given in Sec. III A, the number of dark matterparticles encountered by the initial surface is Ndm � f���dm=mdm� � �2:5� 0:3� � 1010 cm3�, where �dm is thelocal dark matter density.
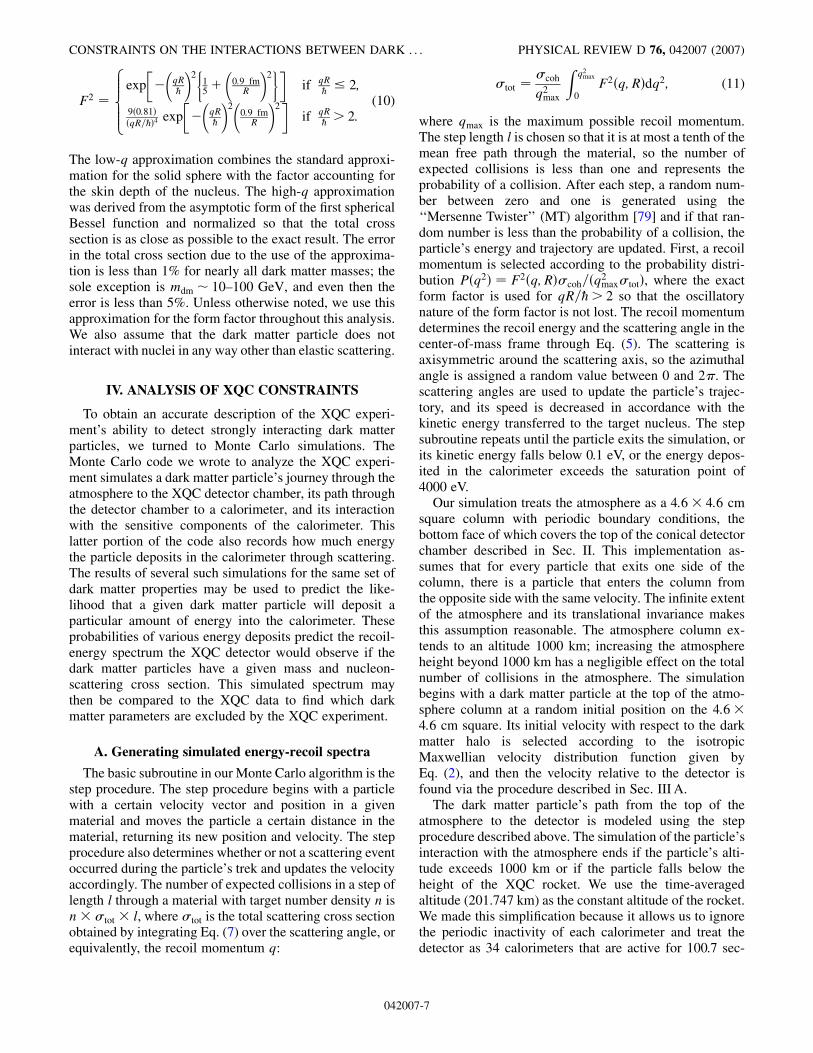
The simulated event spectra produced by ourMonte Carlo routine indicate that particles with massesless than 1 GeV very rarely deposit more than 100 eVinside the XQC calorimeters. Conversely, particles withmasses greater than 100 GeV nearly always deposit morethan 4000 eV when they interact with the XQC calorim-eters, so constraints on �Dn for thesemdm values arise fromthe oversaturation (E � 4000 eV) event rate. Figure 5shows simulated spectra for three mdm values that liebetween these two extremes, along with a histogram that
FIG. 5. Simulated event spectra for dark matter particles withmasses of 1, 10, and 100 GeV and a total nucleon-scatteringcross section of 10�27:3 cm2. In addition to the events depicted inthese spectra, the simulations predict 1300� 160 events withenergies greater than 4000 eV when mdm � 10 GeV and10 000� 1200 such events when mdm � 100 GeV. The histo-gram represents the XQC observations.
ERICKCEK, STEINHARDT, MCCAMMON, AND MCGUIRE PHYSICAL REVIEW D 76, 042007 (2007)
042007-8
depicts the XQC observations. Given an initial velocity of300 km s�1 relative to the XQC detector, a 1-GeV particlecan only deposit up to 66 eV in a single collision with an Sinucleus, so the spectrum for these particles is confined tovery low energies. Meanwhile, a 10-GeV particle and a100-GeV particle with the same initial velocity can depositup to 900 eV and 44 000 eV, respectively, in a singlecollision with an Hg nucleus. In fact, ignoring any loss ofcoherence, all recoil energies between 0 and 44 000 eV areequally likely during a collision between an Hg nucleusand a 100-GeV dark matter particle. That’s why themdm �100 GeV spectrum in Fig. 5 is flat below 2500 eV and whythe simulations predict 10 000 events with energies greaterthan 4000 eV for this value of mdm and �Dn.
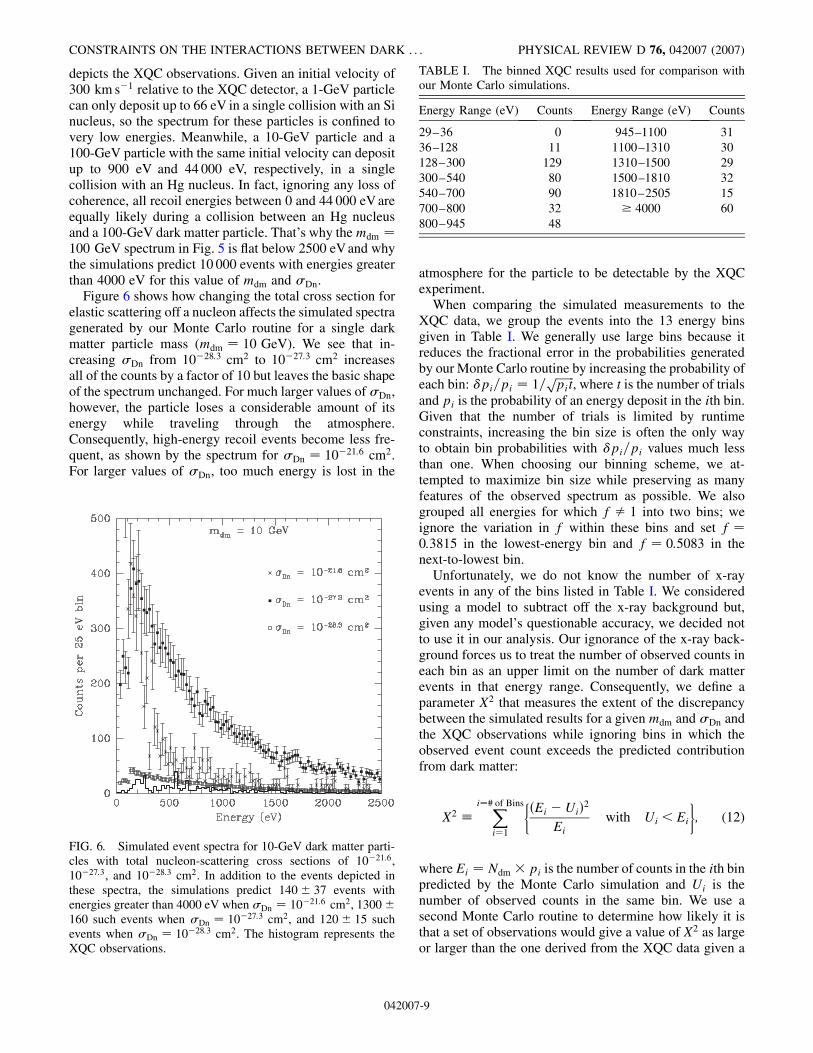
Figure 6 shows how changing the total cross section forelastic scattering off a nucleon affects the simulated spectragenerated by our Monte Carlo routine for a single darkmatter particle mass (mdm � 10 GeV). We see that in-creasing �Dn from 10�28:3 cm2 to 10�27:3 cm2 increasesall of the counts by a factor of 10 but leaves the basic shapeof the spectrum unchanged. For much larger values of �Dn,however, the particle loses a considerable amount of itsenergy while traveling through the atmosphere.Consequently, high-energy recoil events become less fre-quent, as shown by the spectrum for �Dn � 10�21:6 cm2.For larger values of �Dn, too much energy is lost in the
atmosphere for the particle to be detectable by the XQCexperiment.
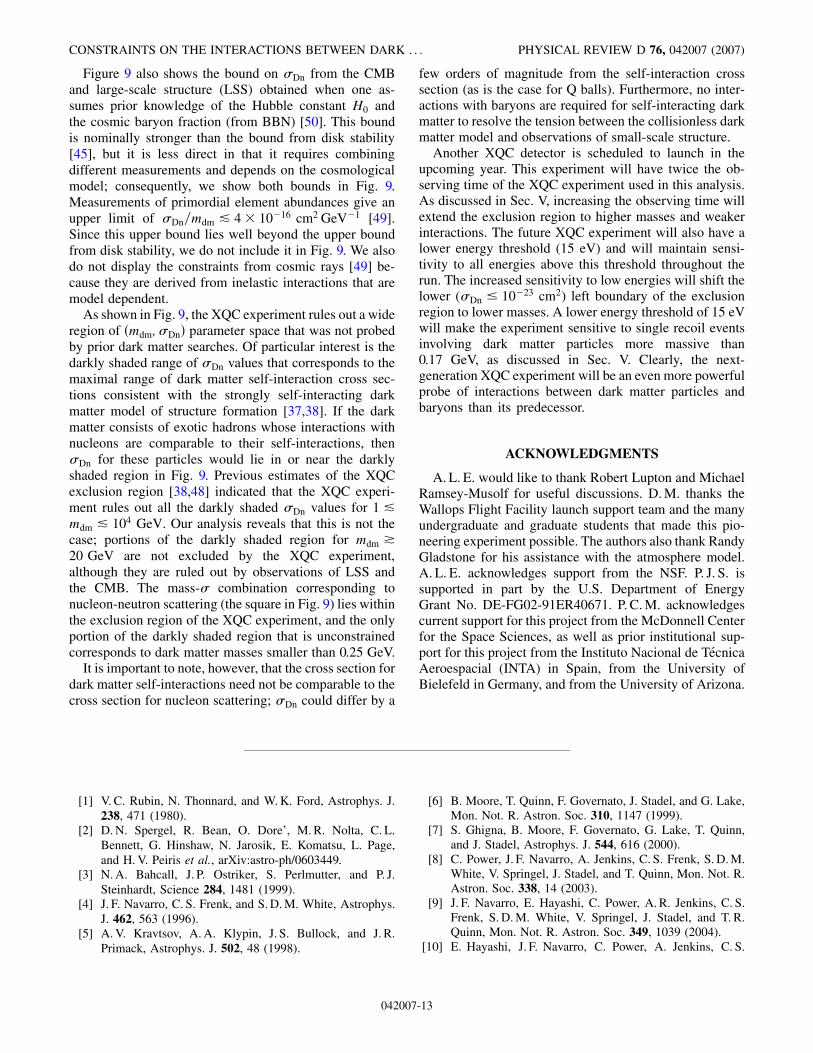
When comparing the simulated measurements to theXQC data, we group the events into the 13 energy binsgiven in Table I. We generally use large bins because itreduces the fractional error in the probabilities generatedby our Monte Carlo routine by increasing the probability ofeach bin: �pi=pi � 1=
�������pitp
, where t is the number of trialsand pi is the probability of an energy deposit in the ith bin.Given that the number of trials is limited by runtimeconstraints, increasing the bin size is often the only wayto obtain bin probabilities with �pi=pi values much lessthan one. When choosing our binning scheme, we at-tempted to maximize bin size while preserving as manyfeatures of the observed spectrum as possible. We alsogrouped all energies for which f � 1 into two bins; weignore the variation in f within these bins and set f �0:3815 in the lowest-energy bin and f � 0:5083 in thenext-to-lowest bin.
Unfortunately, we do not know the number of x-rayevents in any of the bins listed in Table I. We consideredusing a model to subtract off the x-ray background but,given any model’s questionable accuracy, we decided notto use it in our analysis. Our ignorance of the x-ray back-ground forces us to treat the number of observed counts ineach bin as an upper limit on the number of dark matterevents in that energy range. Consequently, we define aparameter X2 that measures the extent of the discrepancybetween the simulated results for a given mdm and �Dn andthe XQC observations while ignoring bins in which theobserved event count exceeds the predicted contributionfrom dark matter:
X2 �Xi�# of Bins
i�1
��Ei �Ui�
2
Eiwith Ui < Ei
�; (12)
where Ei � Ndm � pi is the number of counts in the ith binpredicted by the Monte Carlo simulation and Ui is thenumber of observed counts in the same bin. We use asecond Monte Carlo routine to determine how likely it isthat a set of observations would give a value of X2 as largeor larger than the one derived from the XQC data given a
FIG. 6. Simulated event spectra for 10-GeV dark matter parti-cles with total nucleon-scattering cross sections of 10�21:6,10�27:3, and 10�28:3 cm2. In addition to the events depicted inthese spectra, the simulations predict 140� 37 events withenergies greater than 4000 eV when �Dn � 10�21:6 cm2, 1300�160 such events when �Dn � 10�27:3 cm2, and 120� 15 suchevents when �Dn � 10�28:3 cm2. The histogram represents theXQC observations.
TABLE I. The binned XQC results used for comparison withour Monte Carlo simulations.
CONSTRAINTS ON THE INTERACTIONS BETWEEN DARK . . . PHYSICAL REVIEW D 76, 042007 (2007)
042007-9
mean signal described by the set of Ei derived from thesimulation Monte Carlo.
In the comparison Monte Carlo, a trial begins by gen-erating a new set of Ei by sampling the error distributionsofNdm and pi. The distribution ofNdm values is assumed tobe Gaussian with the mean and standard deviation givenabove. The probability pi is derived from pi � t events inthe simulation Monte Carlo (recall that t is the number oftrials), so a new value for pi is generated by sampling aPoisson distribution with a mean of pi � t and dividing theresulting number by t. Once a new set of Ei has been found,the routine generates a simulated number of observedcounts for each bin according to a Poisson distributionwith a mean of Ei. The value of the X2 parameter for thenew Ei and Ui is computed and compared to the value forthe original Ei and the XQC observations, X2
XQC. Thenumber of trials needed to accurately measure the proba-bility P(X) that X2 � X2
XQC is determined by requiring thatthe variation in the mean value of X2 over ten Monte Carlosimulations does not exceed �100-C�%, where C% is thedesired confidence level and that the range P�X� � �5�the variation in P�X�� does not contain �100� C�=100.
V. RESULTS AND DISCUSSION
The XQC experiment rules out the enclosed region in�mdm; �Dn� parameter space shown in Fig. 7. The over-burden from the atmosphere and the filtering layers assuresthat there will be a limit to how strongly a dark matter
particle can interact with baryons and still reach the XQCcalorimeters; this overburden is responsible for the topedge of the exclusion region. Conversely, if �Dn is toosmall, the dark matter particles will pass through thecalorimeters without interacting. The low-energy thresholdof the XQC calorimeters places a lower bound on theexcluded dark matter particle masses; if mdm is too small,then the recoil energies are undetectable. On the other sideof the mass range, the XQC detector is not sensitive tomdm * 105 GeV because the number density of such mas-sive dark matter particles is too small for the XQC experi-ment to detect.
The exclusion region shown in Fig. 7 has a complicatedshape, but its features are readily explicable. As mdm
increases, the range of excluded �Dn values shifts to lowervalues and then moves up again. The downward shift formdm between 0.1 GeV and 100 GeV is due to the effects ofcoherent nuclear scattering. Since �coh increases with in-creasing mdm for fixed �Dn, a 100-GeV particle interactsmore strongly in the atmosphere and in the detector than a1-GeV particle with the same �Dn. Consequently, both theupper and lower boundaries of the excluded region de-crease with increasing mass for mdm & 100 GeV. Thescattering of dark matter particles with larger masses isincoherent, and the form factor discussed in Sec. III Bcauses �tot to decrease as mass increases for fixed �Dn.Moreover, particles that are more massive than the targetnuclei have straighter trajectories than lighter dark matterparticles due to smaller scattering angles in the detectorrest frame. The loss of coherence also contributes becauseincoherent scattering makes small scattering angles moreprobable. A straight trajectory is shorter than a randomwalk, so the more massive particles interact less in theatmosphere and the detector than the more easily deflectedlighter particles. Because of both of these effects, the upperand lower boundaries of the exclusion region increase withincreasing mdm for mdm * 100 GeV.
The lower left corner of the exclusion region also hastwo interesting features. First, the lower bound on theexcluded value of �Dn decreases sharply as mdm increasesfrom 0.1 GeV to 0.5 GeV. A dark matter particle with themaximum possible velocity with respect to the detector(800 km s�1) must have a mass greater than 0.24 GeV to becapable of depositing 29 eV in the calorimeter in a singlecollision. Lighter particles are only detectable if they scat-ter multiple times inside the calorimeter, and multiplescatters require a higher value of �Dn. Since their analysisdoes not allow multiple collisions, the XQC exclusionregion found in Ref. [52] does not extend to masses lowerthan 0.3 GeV for any value of �Dn. Second, there is a kinkin the lower boundary at mdm � 10 GeV; the constraint on�Dn is not as strong for this mass. The simulated spectraproduced by our Monte Carlo routine for mdm � 10 GeVand�Dn & 10�25 cm2 reveal that the particle is most likelyto deposit between 100 and 600 eV, as exemplified by the
FIG. 7. The region of dark matter parameter space excluded bythe XQC experiment; �Dn is the total cross section for scatteringoff a nucleon and mdm is the mass of the dark matter particle.This exclusion region follows from the assumption that the localdark matter density is 0:3 GeV cm�3 and that all of the darkmatter shares the same value of �Dn.
ERICKCEK, STEINHARDT, MCCAMMON, AND MCGUIRE PHYSICAL REVIEW D 76, 042007 (2007)
042007-10
spectra depicted in Fig. 6. The background in this energyrange is very high, so the XQC constraints are not as strictat these energies.
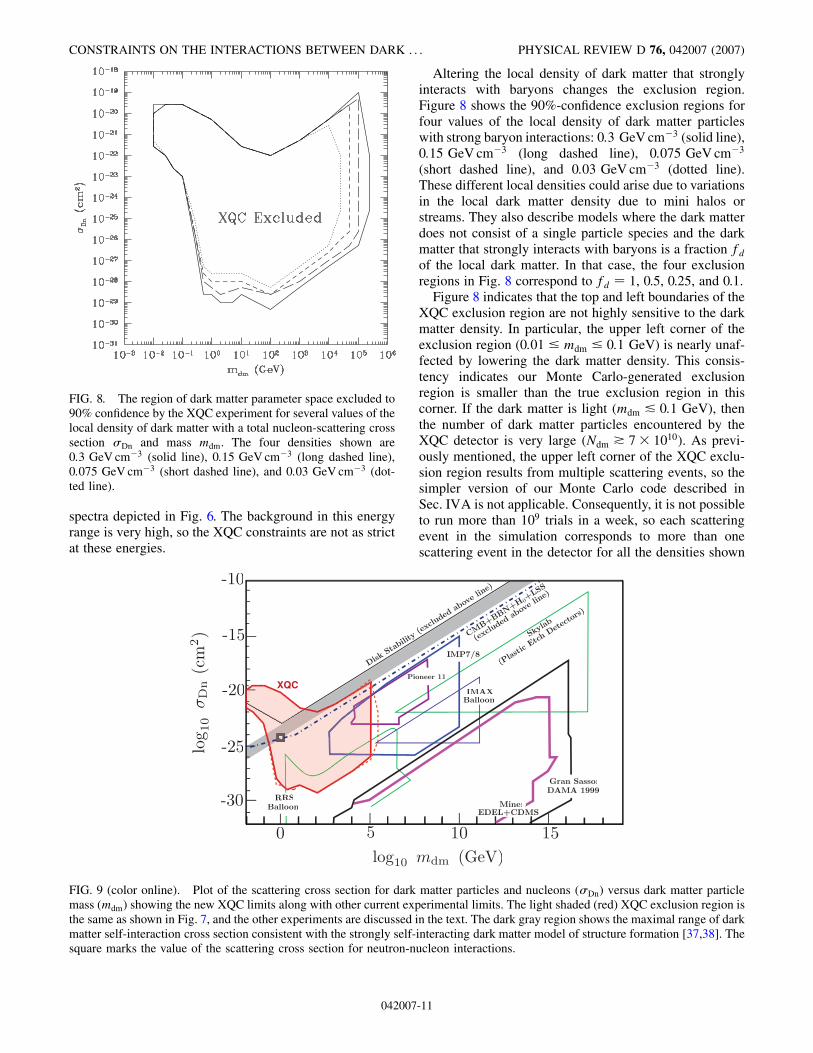
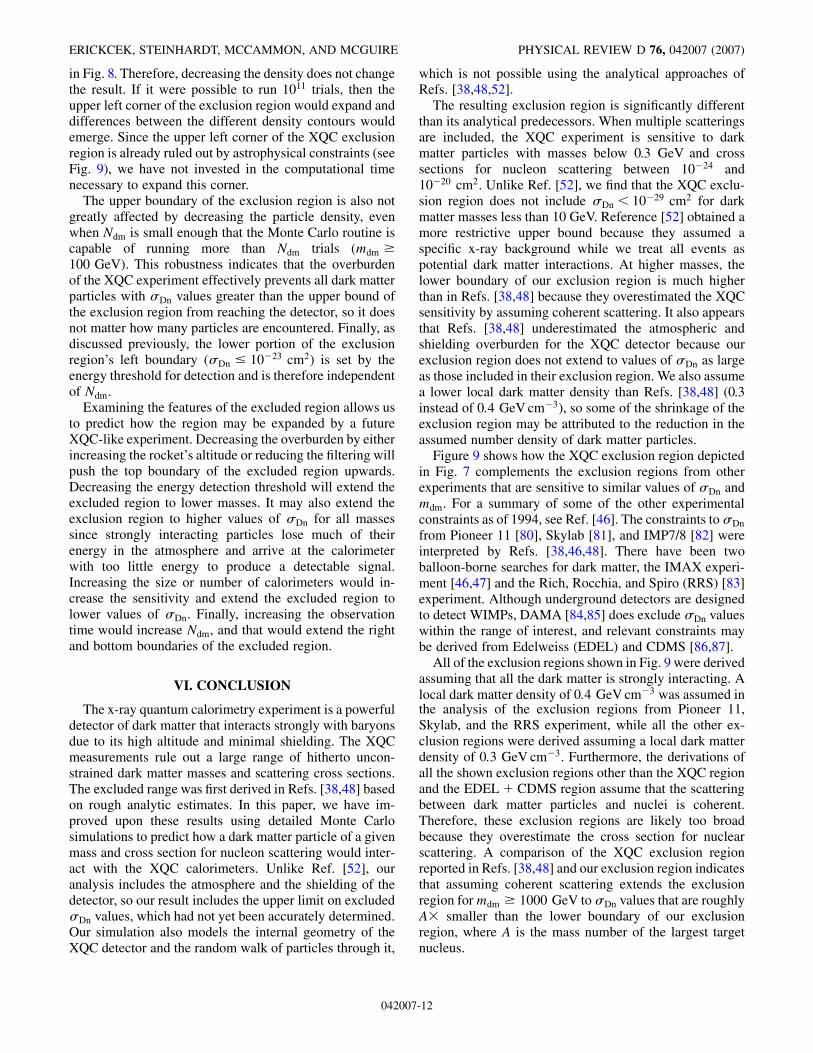
Altering the local density of dark matter that stronglyinteracts with baryons changes the exclusion region.Figure 8 shows the 90%-confidence exclusion regions forfour values of the local density of dark matter particleswith strong baryon interactions: 0:3 GeV cm�3 (solid line),0:15 GeV cm�3 (long dashed line), 0:075 GeV cm�3
(short dashed line), and 0:03 GeV cm�3 (dotted line).These different local densities could arise due to variationsin the local dark matter density due to mini halos orstreams. They also describe models where the dark matterdoes not consist of a single particle species and the darkmatter that strongly interacts with baryons is a fraction fdof the local dark matter. In that case, the four exclusionregions in Fig. 8 correspond to fd � 1, 0.5, 0.25, and 0.1.
Figure 8 indicates that the top and left boundaries of theXQC exclusion region are not highly sensitive to the darkmatter density. In particular, the upper left corner of theexclusion region (0:01 � mdm � 0:1 GeV) is nearly unaf-fected by lowering the dark matter density. This consis-tency indicates our Monte Carlo-generated exclusionregion is smaller than the true exclusion region in thiscorner. If the dark matter is light (mdm & 0:1 GeV), thenthe number of dark matter particles encountered by theXQC detector is very large (Ndm * 7� 1010). As previ-ously mentioned, the upper left corner of the XQC exclu-sion region results from multiple scattering events, so thesimpler version of our Monte Carlo code described inSec. IVA is not applicable. Consequently, it is not possibleto run more than 109 trials in a week, so each scatteringevent in the simulation corresponds to more than onescattering event in the detector for all the densities shown
FIG. 8. The region of dark matter parameter space excluded to90% confidence by the XQC experiment for several values of thelocal density of dark matter with a total nucleon-scattering crosssection �Dn and mass mdm. The four densities shown are0:3 GeV cm�3 (solid line), 0:15 GeV cm�3 (long dashed line),0:075 GeV cm�3 (short dashed line), and 0:03 GeV cm�3 (dot-ted line).
XQC
FIG. 9 (color online). Plot of the scattering cross section for dark matter particles and nucleons (�Dn) versus dark matter particlemass (mdm) showing the new XQC limits along with other current experimental limits. The light shaded (red) XQC exclusion region isthe same as shown in Fig. 7, and the other experiments are discussed in the text. The dark gray region shows the maximal range of darkmatter self-interaction cross section consistent with the strongly self-interacting dark matter model of structure formation [37,38]. Thesquare marks the value of the scattering cross section for neutron-nucleon interactions.
CONSTRAINTS ON THE INTERACTIONS BETWEEN DARK . . . PHYSICAL REVIEW D 76, 042007 (2007)
042007-11
in Fig. 8. Therefore, decreasing the density does not changethe result. If it were possible to run 1011 trials, then theupper left corner of the exclusion region would expand anddifferences between the different density contours wouldemerge. Since the upper left corner of the XQC exclusionregion is already ruled out by astrophysical constraints (seeFig. 9), we have not invested in the computational timenecessary to expand this corner.
The upper boundary of the exclusion region is also notgreatly affected by decreasing the particle density, evenwhen Ndm is small enough that the Monte Carlo routine iscapable of running more than Ndm trials (mdm �100 GeV). This robustness indicates that the overburdenof the XQC experiment effectively prevents all dark matterparticles with �Dn values greater than the upper bound ofthe exclusion region from reaching the detector, so it doesnot matter how many particles are encountered. Finally, asdiscussed previously, the lower portion of the exclusionregion’s left boundary (�Dn � 10�23 cm2) is set by theenergy threshold for detection and is therefore independentof Ndm.
Examining the features of the excluded region allows usto predict how the region may be expanded by a futureXQC-like experiment. Decreasing the overburden by eitherincreasing the rocket’s altitude or reducing the filtering willpush the top boundary of the excluded region upwards.Decreasing the energy detection threshold will extend theexcluded region to lower masses. It may also extend theexclusion region to higher values of �Dn for all massessince strongly interacting particles lose much of theirenergy in the atmosphere and arrive at the calorimeterwith too little energy to produce a detectable signal.Increasing the size or number of calorimeters would in-crease the sensitivity and extend the excluded region tolower values of �Dn. Finally, increasing the observationtime would increase Ndm, and that would extend the rightand bottom boundaries of the excluded region.
VI. CONCLUSION
The x-ray quantum calorimetry experiment is a powerfuldetector of dark matter that interacts strongly with baryonsdue to its high altitude and minimal shielding. The XQCmeasurements rule out a large range of hitherto uncon-strained dark matter masses and scattering cross sections.The excluded range was first derived in Refs. [38,48] basedon rough analytic estimates. In this paper, we have im-proved upon these results using detailed Monte Carlosimulations to predict how a dark matter particle of a givenmass and cross section for nucleon scattering would inter-act with the XQC calorimeters. Unlike Ref. [52], ouranalysis includes the atmosphere and the shielding of thedetector, so our result includes the upper limit on excluded�Dn values, which had not yet been accurately determined.Our simulation also models the internal geometry of theXQC detector and the random walk of particles through it,
which is not possible using the analytical approaches ofRefs. [38,48,52].
The resulting exclusion region is significantly differentthan its analytical predecessors. When multiple scatteringsare included, the XQC experiment is sensitive to darkmatter particles with masses below 0.3 GeV and crosssections for nucleon scattering between 10�24 and10�20 cm2. Unlike Ref. [52], we find that the XQC exclu-sion region does not include �Dn < 10�29 cm2 for darkmatter masses less than 10 GeV. Reference [52] obtained amore restrictive upper bound because they assumed aspecific x-ray background while we treat all events aspotential dark matter interactions. At higher masses, thelower boundary of our exclusion region is much higherthan in Refs. [38,48] because they overestimated the XQCsensitivity by assuming coherent scattering. It also appearsthat Refs. [38,48] underestimated the atmospheric andshielding overburden for the XQC detector because ourexclusion region does not extend to values of �Dn as largeas those included in their exclusion region. We also assumea lower local dark matter density than Refs. [38,48] (0.3instead of 0:4 GeV cm�3), so some of the shrinkage of theexclusion region may be attributed to the reduction in theassumed number density of dark matter particles.
Figure 9 shows how the XQC exclusion region depictedin Fig. 7 complements the exclusion regions from otherexperiments that are sensitive to similar values of �Dn andmdm. For a summary of some of the other experimentalconstraints as of 1994, see Ref. [46]. The constraints to�Dn
from Pioneer 11 [80], Skylab [81], and IMP7/8 [82] wereinterpreted by Refs. [38,46,48]. There have been twoballoon-borne searches for dark matter, the IMAX experi-ment [46,47] and the Rich, Rocchia, and Spiro (RRS) [83]experiment. Although underground detectors are designedto detect WIMPs, DAMA [84,85] does exclude �Dn valueswithin the range of interest, and relevant constraints maybe derived from Edelweiss (EDEL) and CDMS [86,87].
All of the exclusion regions shown in Fig. 9 were derivedassuming that all the dark matter is strongly interacting. Alocal dark matter density of 0:4 GeV cm�3 was assumed inthe analysis of the exclusion regions from Pioneer 11,Skylab, and the RRS experiment, while all the other ex-clusion regions were derived assuming a local dark matterdensity of 0:3 GeV cm�3. Furthermore, the derivations ofall the shown exclusion regions other than the XQC regionand the EDEL CDMS region assume that the scatteringbetween dark matter particles and nuclei is coherent.Therefore, these exclusion regions are likely too broadbecause they overestimate the cross section for nuclearscattering. A comparison of the XQC exclusion regionreported in Refs. [38,48] and our exclusion region indicatesthat assuming coherent scattering extends the exclusionregion formdm � 1000 GeV to�Dn values that are roughlyA� smaller than the lower boundary of our exclusionregion, where A is the mass number of the largest targetnucleus.
ERICKCEK, STEINHARDT, MCCAMMON, AND MCGUIRE PHYSICAL REVIEW D 76, 042007 (2007)
042007-12
Figure 9 also shows the bound on �Dn from the CMBand large-scale structure (LSS) obtained when one as-sumes prior knowledge of the Hubble constant H0 andthe cosmic baryon fraction (from BBN) [50]. This boundis nominally stronger than the bound from disk stability[45], but it is less direct in that it requires combiningdifferent measurements and depends on the cosmologicalmodel; consequently, we show both bounds in Fig. 9.Measurements of primordial element abundances give anupper limit of �Dn=mdm & 4� 10�16 cm2 GeV�1 [49].Since this upper bound lies well beyond the upper boundfrom disk stability, we do not include it in Fig. 9. We alsodo not display the constraints from cosmic rays [49] be-cause they are derived from inelastic interactions that aremodel dependent.
As shown in Fig. 9, the XQC experiment rules out a wideregion of �mdm; �Dn� parameter space that was not probedby prior dark matter searches. Of particular interest is thedarkly shaded range of �Dn values that corresponds to themaximal range of dark matter self-interaction cross sec-tions consistent with the strongly self-interacting darkmatter model of structure formation [37,38]. If the darkmatter consists of exotic hadrons whose interactions withnucleons are comparable to their self-interactions, then�Dn for these particles would lie in or near the darklyshaded region in Fig. 9. Previous estimates of the XQCexclusion region [38,48] indicated that the XQC experi-ment rules out all the darkly shaded �Dn values for 1 &
mdm & 104 GeV. Our analysis reveals that this is not thecase; portions of the darkly shaded region for mdm *
20 GeV are not excluded by the XQC experiment,although they are ruled out by observations of LSS andthe CMB. The mass-� combination corresponding tonucleon-neutron scattering (the square in Fig. 9) lies withinthe exclusion region of the XQC experiment, and the onlyportion of the darkly shaded region that is unconstrainedcorresponds to dark matter masses smaller than 0.25 GeV.
It is important to note, however, that the cross section fordark matter self-interactions need not be comparable to thecross section for nucleon scattering; �Dn could differ by a
few orders of magnitude from the self-interaction crosssection (as is the case for Q balls). Furthermore, no inter-actions with baryons are required for self-interacting darkmatter to resolve the tension between the collisionless darkmatter model and observations of small-scale structure.
Another XQC detector is scheduled to launch in theupcoming year. This experiment will have twice the ob-serving time of the XQC experiment used in this analysis.As discussed in Sec. V, increasing the observing time willextend the exclusion region to higher masses and weakerinteractions. The future XQC experiment will also have alower energy threshold (15 eV) and will maintain sensi-tivity to all energies above this threshold throughout therun. The increased sensitivity to low energies will shift thelower (�Dn � 10�23 cm2) left boundary of the exclusionregion to lower masses. A lower energy threshold of 15 eVwill make the experiment sensitive to single recoil eventsinvolving dark matter particles more massive than0.17 GeV, as discussed in Sec. V. Clearly, the next-generation XQC experiment will be an even more powerfulprobe of interactions between dark matter particles andbaryons than its predecessor.
ACKNOWLEDGMENTS
A. L. E. would like to thank Robert Lupton and MichaelRamsey-Musolf for useful discussions. D. M. thanks theWallops Flight Facility launch support team and the manyundergraduate and graduate students that made this pio-neering experiment possible. The authors also thank RandyGladstone for his assistance with the atmosphere model.A. L. E. acknowledges support from the NSF. P. J. S. issupported in part by the U.S. Department of EnergyGrant No. DE-FG02-91ER40671. P. C. M. acknowledgescurrent support for this project from the McDonnell Centerfor the Space Sciences, as well as prior institutional sup-port for this project from the Instituto Nacional de TecnicaAeroespacial (INTA) in Spain, from the University ofBielefeld in Germany, and from the University of Arizona.
[1] V. C. Rubin, N. Thonnard, and W. K. Ford, Astrophys. J.238, 471 (1980).
[2] D. N. Spergel, R. Bean, O. Dore’, M. R. Nolta, C. L.Bennett, G. Hinshaw, N. Jarosik, E. Komatsu, L. Page,and H. V. Peiris et al., arXiv:astro-ph/0603449.
[3] N. A. Bahcall, J. P. Ostriker, S. Perlmutter, and P. J.Steinhardt, Science 284, 1481 (1999).
[4] J. F. Navarro, C. S. Frenk, and S. D. M. White, Astrophys.J. 462, 563 (1996).
[5] A. V. Kravtsov, A. A. Klypin, J. S. Bullock, and J. R.Primack, Astrophys. J. 502, 48 (1998).
[6] B. Moore, T. Quinn, F. Governato, J. Stadel, and G. Lake,Mon. Not. R. Astron. Soc. 310, 1147 (1999).
[7] S. Ghigna, B. Moore, F. Governato, G. Lake, T. Quinn,and J. Stadel, Astrophys. J. 544, 616 (2000).
[8] C. Power, J. F. Navarro, A. Jenkins, C. S. Frenk, S. D. M.White, V. Springel, J. Stadel, and T. Quinn, Mon. Not. R.Astron. Soc. 338, 14 (2003).
[9] J. F. Navarro, E. Hayashi, C. Power, A. R. Jenkins, C. S.Frenk, S. D. M. White, V. Springel, J. Stadel, and T. R.Quinn, Mon. Not. R. Astron. Soc. 349, 1039 (2004).
[10] E. Hayashi, J. F. Navarro, C. Power, A. Jenkins, C. S.
CONSTRAINTS ON THE INTERACTIONS BETWEEN DARK . . . PHYSICAL REVIEW D 76, 042007 (2007)
042007-13
Frenk, S. D. M. White, V. Springel, J. Stadel, and T. R.Quinn, Mon. Not. R. Astron. Soc. 355, 794 (2004).
[11] J. Diemand, B. Moore, and J. Stadel, Mon. Not. R. Astron.Soc. 353, 624 (2004).
[12] J. Diemand, M. Zemp, B. Moore, J. Stadel, and C. M.Carollo, Mon. Not. R. Astron. Soc. 364, 665 (2005).
[13] J. A. Tyson, G. P. Kochanski, and I. P. dell’Antonio,Astrophys. J. Lett. 498, L107 (1998).
[14] D. J. Sand, T. Treu, G. P. Smith, and R. S. Ellis, Astrophys.J. 604, 88 (2004).
[15] H. Katayama and K. Hayashida, Adv. Space Res. 34, 2519(2004).
[16] E. Pointecouteau, M. Arnaud, and G. W. Pratt, Astron.Astrophys. 435, 1 (2005).
[17] L. M. Voigt and A. C. Fabian, Mon. Not. R. Astron. Soc.368, 518 (2006).
[18] R. A. Flores and J. R. Primack, Astrophys. J. Lett. 427, L1(1994).
[19] B. Moore, Nature 370, 629 (1994).[20] A. Burkert, Astrophys. J. Lett. 447, L25 (1995).[21] W. J. G. de Blok and S. S. McGaugh, Mon. Not. R. Astron.
Soc. 290, 533 (1997).[22] S. S. McGaugh and W. J. G. de Blok, Astrophys. J. 499, 41
(1998).[23] W. J. G. de Blok, S. S. McGaugh, and V. C. Rubin, Astron.
J. 122, 2396 (2001).[24] D. Marchesini, E. D’Onghia, G. Chincarini, C. Firmani, P.
Conconi, E. Molinari, and A. Zacchei, Astrophys. J. 575,801 (2002).
[25] J. J. Binney and N. W. Evans, Mon. Not. R. Astron. Soc.327, L27 (2001).
[26] P. Salucci, Mon. Not. R. Astron. Soc. 320, L1 (2001).[27] J. D. Simon, A. D. Bolatto, A. Leroy, L. Blitz, and E. L.
Gates, Astrophys. J. 621, 757 (2005).[28] B. Moore, S. Ghigna, F. Governato, G. Lake, T. Quinn, J.
Stadel, and P. Tozzi, Astrophys. J. Lett. 524, L19 (1999).[29] A. Klypin, A. V. Kravtsov, O. Valenzuela, and F. Prada,
Astrophys. J. 522, 82 (1999).[30] E. D’Onghia and G. Lake, Astrophys. J. 612, 628 (2004).[31] A. A. El-Zant, Y. Hoffman, J. Primack, F. Combes, and I.
Shlosman, Astrophys. J. Lett. 607, L75 (2004).[32] E. Hayashi and J. F. Navarro, Mon. Not. R. Astron. Soc.
373, 1117 (2006).[33] J. S. Bullock, A. V. Kravtsov, and D. H. Weinberg,
Astrophys. J. 539, 517 (2000).[34] A. J. Benson, C. S. Frenk, C. G. Lacey, C. M. Baugh, and
S. Cole, Mon. Not. R. Astron. Soc.. 333, 177 (2002).[35] A. V. Kravtsov, O. Y. Gnedin, and A. A. Klypin,
Astrophys. J. 609, 482 (2004).[36] B. Moore, J. Diemand, P. Madau, M. Zemp, and J. Stadel,
Mon. Not. R. Astron. Soc. 368, 563 (2006).[37] D. N. Spergel and P. J. Steinhardt, Phys. Rev. Lett. 84,
3760 (2000).[38] B. D. Wandelt, R. Dave, G. R. Farrar, P. C. McGuire, D. N.
Spergel, and P. J. Steinhardt, in Sources and Detection ofDark Matter and Dark Energy in the Universe, edited byD. B. Cline (Spring-Verlag, Berlin, 2001), p. 263.
[39] R. Dave, D. N. Spergel, P. J. Steinhardt, and B. D. Wandelt,Astrophys. J. 547, 574 (2001).
[40] K. Ahn and P. R. Shapiro, Mon. Not. R. Astron. Soc. 363,1092 (2005).
[41] G. R. Farrar, Int. J. Theor. Phys. 42, 1211 (2003).[42] G. R. Farrar and G. Zaharijas, Phys. Rev. Lett. 96, 041302
(2006).[43] A. Kusenko and P. J. Steinhardt, Phys. Rev. Lett. 87,
141301 (2001).[44] M. Y. Khlopov, Pis’ma Zh. Eksp. Teor. Fiz. 83, 3 (2006).[45] G. D. Starkman, A. Gould, R. Esmailzadeh, and S.
Dimopoulos, Phys. Rev. D 41, 3594 (1990).[46] P. C. McGuire, Ph.D. thesis, University of Arizona, 1994.[47] P. C. McGuire, T. Bowen, D. L. Barker, P. G. Halverson,
K. R. Kendall, T. S. Metcalfe, R. S. Norton, A. E. Pifer,L. M. Barbier, and E. R. Christian et al., in Dark Matter,edited by S. S. Holt and C. L. Bennett, AIP Conf. Proc.No. 336 (AIP, New York, 1995), p. 53.
[48] P. C. McGuire and P. J. Steinhardt, in Proceedings of the27th International Cosmic Ray Conference, Hamburg,Germany, 2001 (unpublished), p. 1566.
[49] R. H. Cyburt, B. D. Fields, V. Pavlidou, and B. Wandelt,Phys. Rev. D 65, 123503 (2002).
[50] X. Chen, S. Hannestad, and R. J. Scherrer, Phys. Rev. D65, 123515 (2002).
[51] D. McCammon, R. Almy, E. Apodaca, W. BergmannTiest, W. Cui, S. Deiker, M. Galeazzi, M. Juda, A.Lesser, and T. Mihara et al., Astrophys. J. 576, 188 (2002).
[52] G. Zaharijas and G. R. Farrar, Phys. Rev. D 72, 083502(2005).
[53] D. McCammon, R. Almy, S. Deiker, J. Morgenthaler, R. L.Kelley, F. J. Marshall, S. H. Moseley, C. K. Stahle, andA. E. Szymkowiak, Nucl. Instrum. Methods Phys. Res.,Sect. A 370, 266 (1996).
[54] C. K. Stahle, R. L. Kelley, D. McCammon, S. H. Moseley,and A. E. Szymkowiak, Nucl. Instrum. Methods Phys.Res., Sect. A 370, 173 (1996).
[55] E. I. Gates, G. Gyuk, and M. S. Turner, Astrophys. J. Lett.449, L123 (1995).
[56] B. Moore, C. Calcaneo-Roldan, J. Stadel, T. Quinn, G.Lake, S. Ghigna, and F. Governato, Phys. Rev. D 64,063508 (2001).
[57] J. D. Lewin and P. F. Smith, Astropart. Phys. 6, 87 (1996).[58] A. M. Green, Phys. Rev. D 68, 023004 (2003).[59] A. K. Drukier, K. Freese, and D. N. Spergel, Phys. Rev. D
33, 3495 (1986).[60] F. J. Kerr and D. Lynden-Bell, Mon. Not. R. Astron. Soc.
221, 1023 (1986).[61] J. A. R. Caldwell and I. M. Coulson, Astron. J. 93, 1090
(1987).[62] R. P. Olling and M. R. Merrifield, Mon. Not. R. Astron.
Soc. 297, 943 (1998).[63] C. S. Kochanek, Astrophys. J. 457, 228 (1996).[64] M. J. Reid, A. C. S. Readhead, R. C. Vermeulen, and R. N.
Treuhaft, Astrophys. J. 524, 816 (1999).[65] R. P. Olling and W. Dehnen, Astrophys. J. 599, 275 (2003).[66] K. M. Cudworth, Astron. J. 99, 590 (1990).[67] P. J. T. Leonard and S. Tremaine, Astrophys. J. 353, 486
(1990).[68] M. C. Smith, G. R. Ruchti, A. Helmi, R. F. G. Wyse,
J. P. Fulbright, K. C. Freeman, J. F. Navarro, G. M.Seabroke, M. Steinmetz, and M. Williams et al., Mon.Not. R. Astron. Soc. 379, 755 (2007).
[69] M. J. Reid, Annu. Rev. Astron. Astrophys. 31, 345 (1993).[70] D. H. McNamara, J. B. Madsen, J. Barnes, and B. F.
ERICKCEK, STEINHARDT, MCCAMMON, AND MCGUIRE PHYSICAL REVIEW D 76, 042007 (2007)
042007-14
Ericksen, Publ. Astron. Soc. Pac. 112, 202 (2000).[71] V. S. Avedisova, Astronomy Reports 49, 435 (2005).[72] W. Dehnen and J. J. Binney, Mon. Not. R. Astron. Soc.
298, 387 (1998).[73] M. W. Goodman and E. Witten, Phys. Rev. D 31, 3059
(1985).[74] A. Gould, Astrophys. J. 321, 571 (1987).[75] G. Gelmini, A. Kusenko, and S. Nussinov, Phys. Rev. Lett.
89, 101302 (2002).[76] J. Engel, Phys. Lett. B 264, 114 (1991).[77] D. Z. Freedman, Phys. Rev. D 9, 1389 (1974).[78] R. H. Helm, Phys. Rev. 104, 1466 (1956).[79] M. Matsumoto and T. Nishimura, ACM Trans. Model.
Comput. Simul. 8, 3 (1998).[80] J. A. Simpson, T. S. Bastian, D. L. Chenette, R. B.
McKibben, and K. R. Pyle, J. Geophys. Res. 85, 5731
(1980).[81] E. K. Shirk and P. B. Price, Astrophys. J. 220, 719 (1978).[82] R. A. Mewaldt, A. W. Labrador, C. Lopate, and R. B.
McKibben (private communication).[83] J. Rich, R. Rocchia, and M. Spiro, Phys. Lett. B 194, 173
(1987).[84] C. Bacci, P. Belli, R. Bernabei, C. Dai, L. Ding, W. di
Nicolantonio, E. Gaillard, G. Gerbier, H. Kuang, and A.Incicchitti et al., Astropart. Phys. 2, 13 (1994).
[85] R. Bernabei, P. Belli, R. Cerulli, F. Montecchia, M.Amato, G. Ignesti, A. Incicchitti, D. Prosperi, C. J. Dai,and H. L. He et al., Phys. Rev. Lett. 83, 4918 (1999).
[86] I. F. M. Albuquerque and L. Baudis, Phys. Rev. Lett. 90,221301 (2003).
[87] I. F. M. Albuquerque and L. Baudis, Phys. Rev. Lett. 91,229903(E) (2003).
CONSTRAINTS ON THE INTERACTIONS BETWEEN DARK . . . PHYSICAL REVIEW D 76, 042007 (2007)