The University of the State of New York REGENTS HIGH SCHOOL EXAMINATION PHYSICAL SETTING EARTH SCIENCE Thursday, January 28, 2016 — 9:15 a.m. to 12:15 p.m., only Use your knowledge of Earth science to answer all questions in this examination. Before you begin this examination, you must be provided with the 2011 Edition Reference Tables for Physical Setting/Earth Science. You will need these reference tables to answer some of the questions. You are to answer all questions in all parts of this examination. You may use scrap paper to work out the answers to the questions, but be sure to record your answers on your answer sheet and in your answer booklet. A separate answer sheet for Part A and Part B–1 has been provided to you. Follow the instructions from the proctor for completing the student information on your answer sheet. Record your answers to the Part A and Part B–1 multiple-choice questions on this separate answer sheet. Record your answers for the questions in Part B–2 and Part C in your separate answer booklet. Be sure to fill in the heading on the front of your answer booklet. All answers in your answer booklet should be written in pen, except for graphs and drawings, which should be done in pencil. When you have completed the examination, you must sign the declaration printed on your separate answer sheet, indicating that you had no unlawful knowledge of the questions or answers prior to the examination and that you have neither given nor received assistance in answering any of the questions during the examination. Your answer sheet and answer booklet cannot be accepted if you fail to sign this declaration. DO NOT OPEN THIS EXAMINATION BOOKLET UNTIL THE SIGNAL IS GIVEN. Notice . . . A four-function or scientific calculator and a copy of the 2011 Edition Reference Tables for Physical Setting/Earth Science must be available for you to use while taking this examination. The possession or use of any communications device is strictly prohibited when taking this examination. If you have or use any communications device, no matter how briefly, your examination will be invalidated and no score will be calculated for you. P.S./EARTH SCIENCE P.S./EARTH SCIENCE
Transcript
The University of the State of New York
REGENTS HIGH SCHOOL EXAMINATION
PHYSICAL SETTING
EARTH SCIENCEThursday, January 28, 2016 — 9:15 a.m. to 12:15 p.m., only
Use your knowledge of Earth science to answer all questions in this examination.Before you begin this examination, you must be provided with the 2011 Edition Reference Tables for Physical Setting/Earth Science. You will need thesereference tables to answer some of the questions.
You are to answer all questions in all parts of this examination. You may use scrappaper to work out the answers to the questions, but be sure to record your answerson your answer sheet and in your answer booklet. A separate answer sheet for Part Aand Part B–1 has been provided to you. Follow the instructions from the proctor forcompleting the student information on your answer sheet. Record your answers to thePart A and Part B–1 multiple-choice questions on this separate answer sheet. Recordyour answers for the questions in Part B–2 and Part C in your separate answerbooklet. Be sure to fill in the heading on the front of your answer booklet.
All answers in your answer booklet should be written in pen, except for graphs anddrawings, which should be done in pencil.
When you have completed the examination, you must sign the declaration printedon your separate answer sheet, indicating that you had no unlawful knowledge of thequestions or answers prior to the examination and that you have neither given norreceived assistance in answering any of the questions during the examination. Youranswer sheet and answer booklet cannot be accepted if you fail to sign thisdeclaration.
DO NOT OPEN THIS EXAMINATION BOOKLET UNTIL THE SIGNAL IS GIVEN.
Notice . . .
A four-function or scientific calculator and a copy of the 2011 Edition Reference Tables forPhysical Setting/Earth Science must be available for you to use while taking this examination.
The possession or use of any communications device is strictly prohibited when taking this examination. If you have or use any communications device, no matter how briefly, your examination will be invalidated and no score will be calculated for you.
P.S./EARTH SCIENCEP.S./EARTH SCIENCE
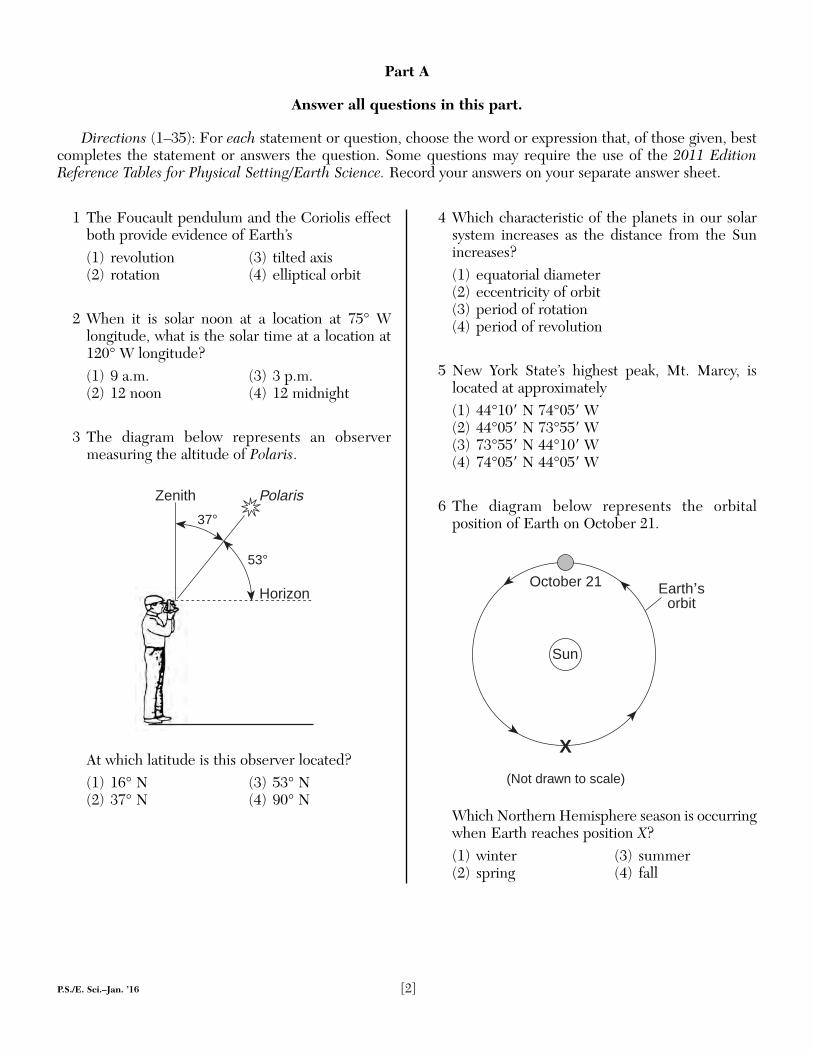
1 The Foucault pendulum and the Coriolis effectboth provide evidence of Earth’s(1) revolution (3) tilted axis(2) rotation (4) elliptical orbit
2 When it is solar noon at a location at 75° W longitude, what is the solar time at a location at120° W longitude?(1) 9 a.m. (3) 3 p.m.(2) 12 noon (4) 12 midnight
3 The diagram below represents an observer measuring the altitude of Polaris.
At which latitude is this observer located?(1) 16° N (3) 53° N(2) 37° N (4) 90° N
4 Which characteristic of the planets in our solarsystem increases as the distance from the Sunincreases?(1) equatorial diameter(2) eccentricity of orbit(3) period of rotation(4) period of revolution
5 New York State’s highest peak, Mt. Marcy, islocated at approximately(1) 44°10� N 74°05� W(2) 44°05� N 73°55� W(3) 73°55� N 44°10� W(4) 74°05� N 44°05� W
6 The diagram below represents the orbital position of Earth on October 21.
Which Northern Hemisphere season is occurringwhen Earth reaches position X?(1) winter (3) summer(2) spring (4) fall
(Not drawn to scale)
Sun
X
October 21 Earth’sorbit
Polaris
Horizon
Zenith
37°
53°
P.S./E. Sci.–Jan. ’16 [2]
Part A
Answer all questions in this part.
Directions (1–35): For each statement or question, choose the word or expression that, of those given, bestcompletes the statement or answers the question. Some questions may require the use of the 2011 EditionReference Tables for Physical Setting/Earth Science. Record your answers on your separate answer sheet.
P.S./E. Sci.–Jan. ’16 [3] [OVER]
7 The diagram below represents eight positions ofthe Moon in its orbit.
Why are high tides on Earth greatest when theMoon is in position A and in position E?(1) The Moon is closer to the Sun.(2) The Moon is closer to Earth.(3) The Moon, the Sun, and Earth are aligned.(4) The Moon is in the same phase at both
locations.
8 The model below represents the apparent pathof the Sun across the sky on March 21 as seen byan observer on Earth.
At which latitude is the observer located?(1) 90° N (3) 23.5° N(2) 42° N (4) 0°
9 According to astronomers, the age of the universeis estimated to be(1) 1.3 billion years (3) 7.9 billion years(2) 4.6 billion years (4) 13.8 billion years
10 Light from distant galaxies most likely shows a(1) red shift, indicating that the universe is
expanding(2) red shift, indicating that the universe is
contracting(3) blue shift, indicating that the universe is
expanding(4) blue shift, indicating that the universe is
contracting
11 Which gas is inferred to have been absent fromEarth’s atmosphere during the Early Archean Era?(1) carbon dioxide (3) oxygen(2) nitrogen (4) water vapor
12 How old is a bone that has 12.5% of the originalamount of radioactive carbon-14 remaining?(1) 5,700 years (3) 17,100 years(2) 11,400 years (4) 22,800 years
13 Which weather instrument is most useful inmeasuring relative humidity?(1) barometer (3) psychrometer(2) anemometer (4) wind vane
14 If the air temperature is 20°C and the relativehumidity is 58%, what is the dewpoint?(1) 5°C (3) 15°C(2) 12°C (4) 38°C
15 Equal areas of which type of Earth surface willabsorb more insolation and radiate more energyback toward space in the same amount of time?(1) light colored and rough(2) dark colored and rough(3) light colored and smooth(4) dark colored and smooth
S N
E
W
Sun’sapparent path
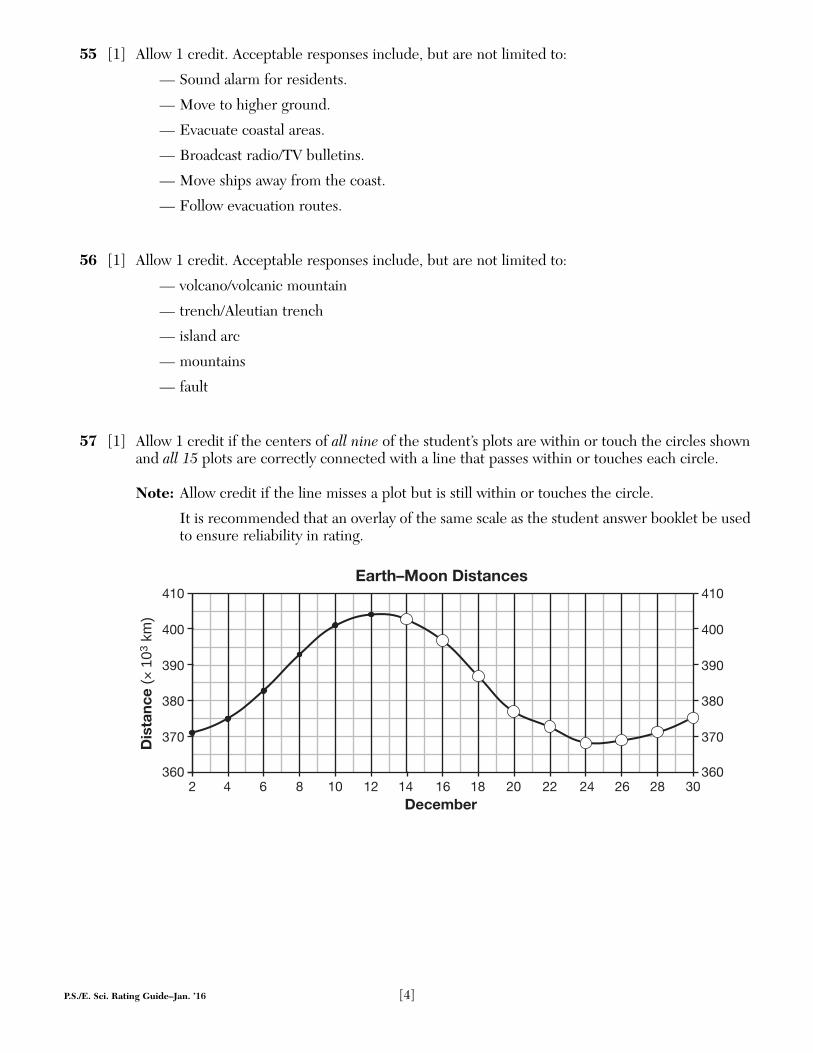
Observer
Horizon
Noon Sun
(Not drawn to scale)
G
H
B
C
D
F
Sun’srays
Earth
NorthPole
E A
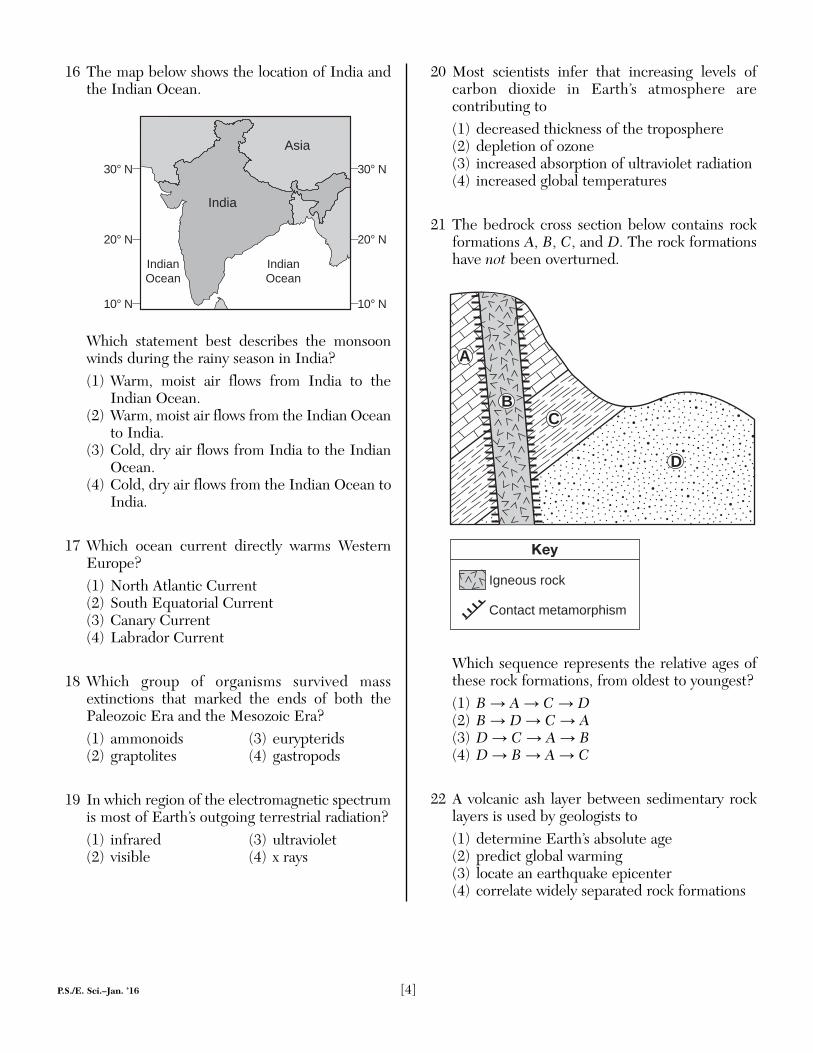
16 The map below shows the location of India andthe Indian Ocean.
Which statement best describes the monsoonwinds during the rainy season in India?(1) Warm, moist air flows from India to the
Indian Ocean.(2) Warm, moist air flows from the Indian Ocean
to India.(3) Cold, dry air flows from India to the Indian
Ocean.(4) Cold, dry air flows from the Indian Ocean to
India.
17 Which ocean current directly warms WesternEurope?(1) North Atlantic Current(2) South Equatorial Current(3) Canary Current(4) Labrador Current
18 Which group of organisms survived mass extinctions that marked the ends of both thePaleozoic Era and the Mesozoic Era?(1) ammonoids (3) eurypterids(2) graptolites (4) gastropods
19 In which region of the electromagnetic spectrumis most of Earth’s outgoing terrestrial radiation?(1) infrared (3) ultraviolet(2) visible (4) x rays
20 Most scientists infer that increasing levels of carbon dioxide in Earth’s atmosphere are contributing to(1) decreased thickness of the troposphere(2) depletion of ozone(3) increased absorption of ultraviolet radiation(4) increased global temperatures
21 The bedrock cross section below contains rockformations A, B, C, and D. The rock formationshave not been overturned.
Which sequence represents the relative ages ofthese rock formations, from oldest to youngest?(1) B → A → C → D(2) B → D → C → A(3) D → C → A → B(4) D → B → A → C
22 A volcanic ash layer between sedimentary rocklayers is used by geologists to(1) determine Earth’s absolute age(2) predict global warming(3) locate an earthquake epicenter(4) correlate widely separated rock formations
A
CB
Igneous rock
Contact metamorphism
Key
D
India
IndianOcean
30° N
20° N
10° N
30° N
20° N
10° N
Asia
IndianOcean
P.S./E. Sci.–Jan. ’16 [4]
24 Examination of the fossil record shows a generaltendency of organisms to become increasinglymore complex through geologic time. This findingsupports the theory that living things haveundergone(1) metamorphism (3) radioactive decay(2) evolution (4) mass extinctions
25 Crustal formation, which may cause the wideningof an ocean, is most likely occurring at theboundary between the(1) African Plate and the Eurasian Plate(2) Pacific Plate and the Philippine Plate(3) Indian-Australian Plate and the Antarctic
Plate(4) South American Plate and the North
American Plate
26 How long after receiving the first P-wave froman earthquake centered 4000 kilometers awaydoes a seismic station receive its first S-wavefrom the same earthquake?(1) 1 minute(2) 5 minutes 35 seconds(3) 7 minutes(4) 12 minutes 40 seconds
27 Which evidence recorded at seismic stations following an earthquake supports the inferencethat Earth’s interior changes from solid rock tomolten iron and nickel at the mantle-coreboundary?(1) P-waves arrive earlier than S-waves.(2) P-waves and S-waves are both recorded at all
stations.(3) Only S-waves are recorded at all stations.(4) Only P-waves are recorded on the opposite
side of Earth.
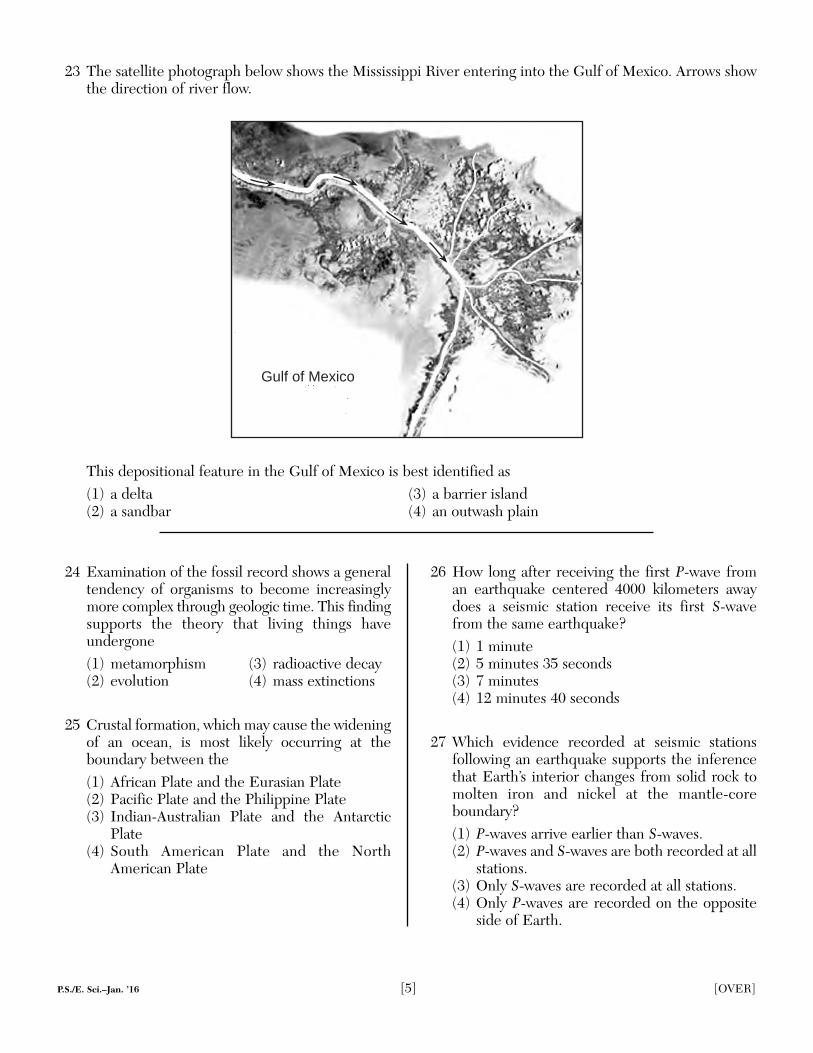
23 The satellite photograph below shows the Mississippi River entering into the Gulf of Mexico. Arrows showthe direction of river flow.
This depositional feature in the Gulf of Mexico is best identified as(1) a delta (3) a barrier island(2) a sandbar (4) an outwash plain
Gulf of Mexico
P.S./E. Sci.–Jan. ’16 [5] [OVER]
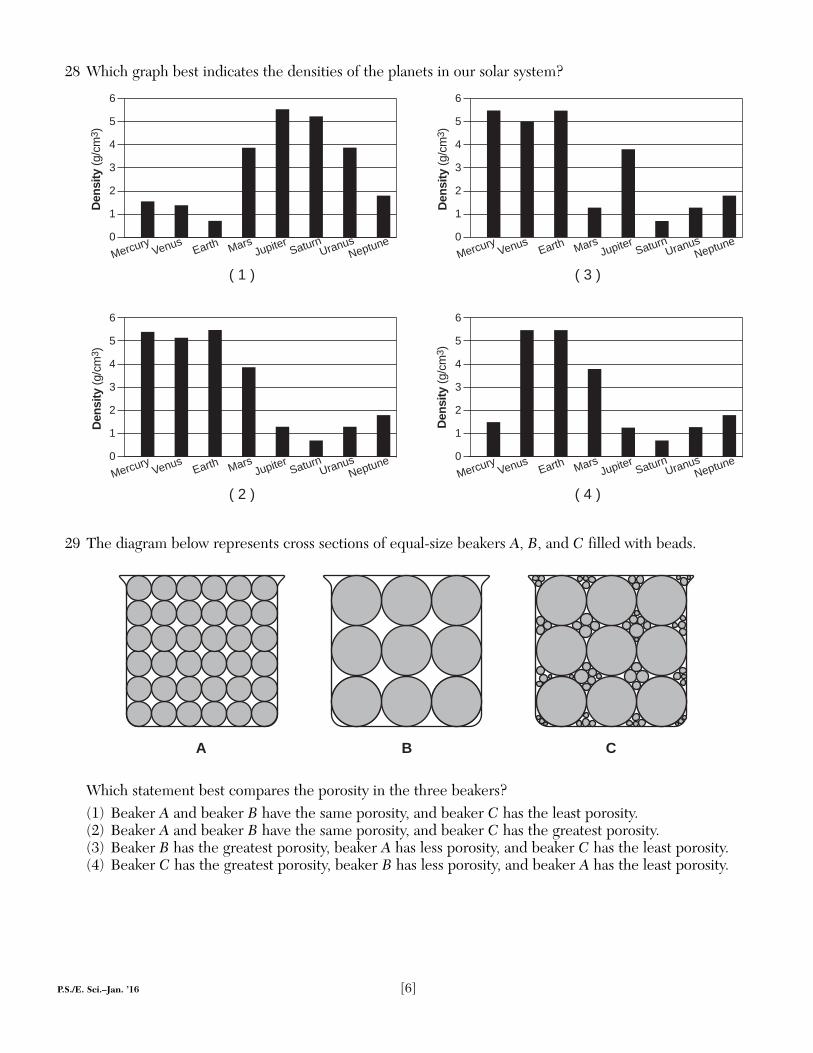
28 Which graph best indicates the densities of the planets in our solar system?
29 The diagram below represents cross sections of equal-size beakers A, B, and C filled with beads.
Which statement best compares the porosity in the three beakers?(1) Beaker A and beaker B have the same porosity, and beaker C has the least porosity.(2) Beaker A and beaker B have the same porosity, and beaker C has the greatest porosity.(3) Beaker B has the greatest porosity, beaker A has less porosity, and beaker C has the least porosity.(4) Beaker C has the greatest porosity, beaker B has less porosity, and beaker A has the least porosity.
A B C
6
5
4
3
2
1
0
MercuryEarthVenus Mars
JupiterSaturn
UranusNeptune
6
5
4
3
2
1
0
MercuryEarthVenus Mars
JupiterSaturn
UranusNeptune
Den
sity
(g/c
m3 )
6
5
4
3
2
1
0
MercuryEarthVenus Mars
JupiterSaturn
UranusNeptune
Den
sity
(g/c
m3 )
6
5
4
3
2
1
0
MercuryEarthVenus Mars
JupiterSaturn
UranusNeptune
( 1 ) ( 3 )
( 2 ) ( 4 )
Den
sity
(g/c
m3 )
Den
sity
(g/c
m3 )
P.S./E. Sci.–Jan. ’16 [6]
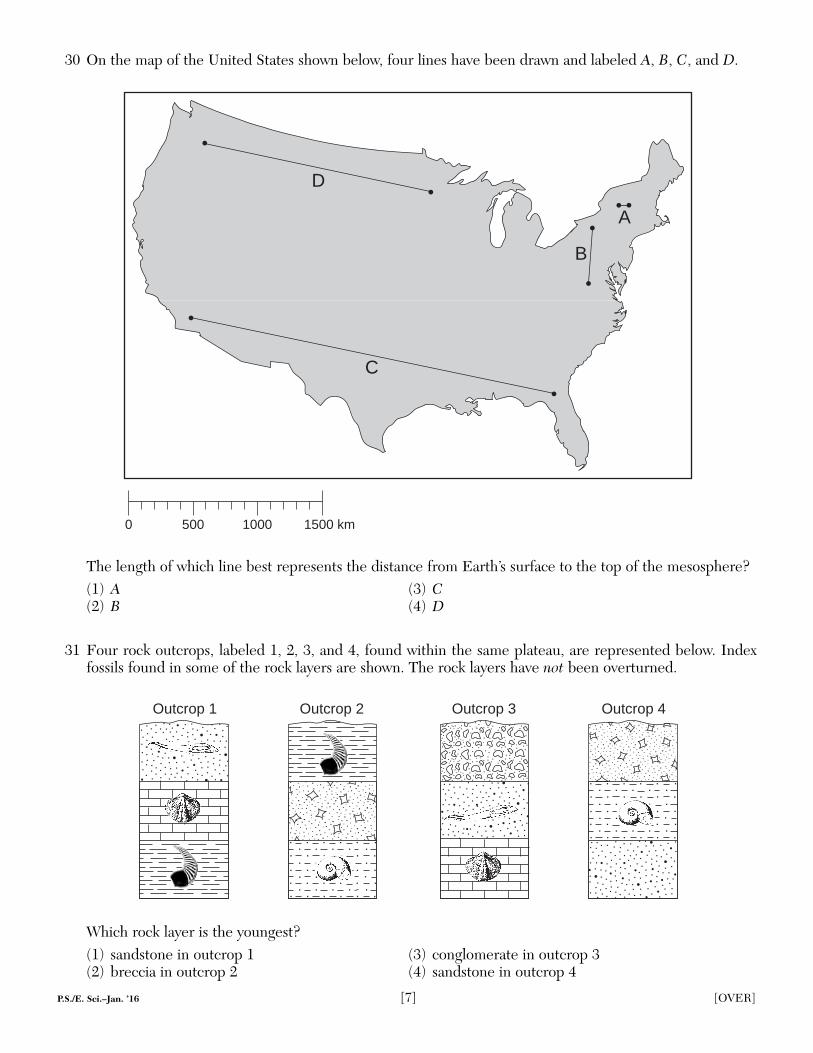
30 On the map of the United States shown below, four lines have been drawn and labeled A, B, C, and D.
The length of which line best represents the distance from Earth’s surface to the top of the mesosphere?(1) A (3) C(2) B (4) D
31 Four rock outcrops, labeled 1, 2, 3, and 4, found within the same plateau, are represented below. Index fossils found in some of the rock layers are shown. The rock layers have not been overturned.
Which rock layer is the youngest?(1) sandstone in outcrop 1 (3) conglomerate in outcrop 3(2) breccia in outcrop 2 (4) sandstone in outcrop 4
Outcrop 4Outcrop 3Outcrop 2Outcrop 1
D
C
B
A
0 500 1000 1500 km
P.S./E. Sci.–Jan. ’16 [7] [OVER]
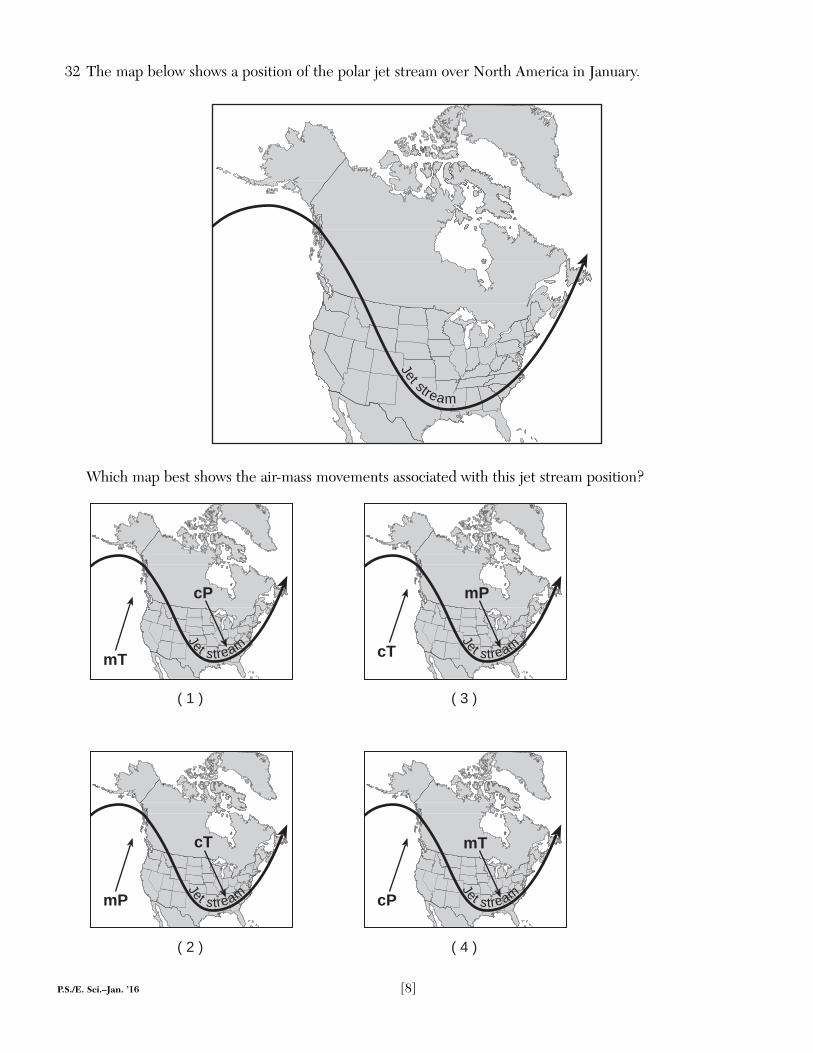
32 The map below shows a position of the polar jet stream over North America in January.
Which map best shows the air-mass movements associated with this jet stream position?
mP
cT
cP
mT
Jet stream
Jet stream
Jet stream
( 1 ) ( 3 )
( 2 ) ( 4 )
Jet stream cT
mP
mT
cP
Jet stream
P.S./E. Sci.–Jan. ’16 [8]
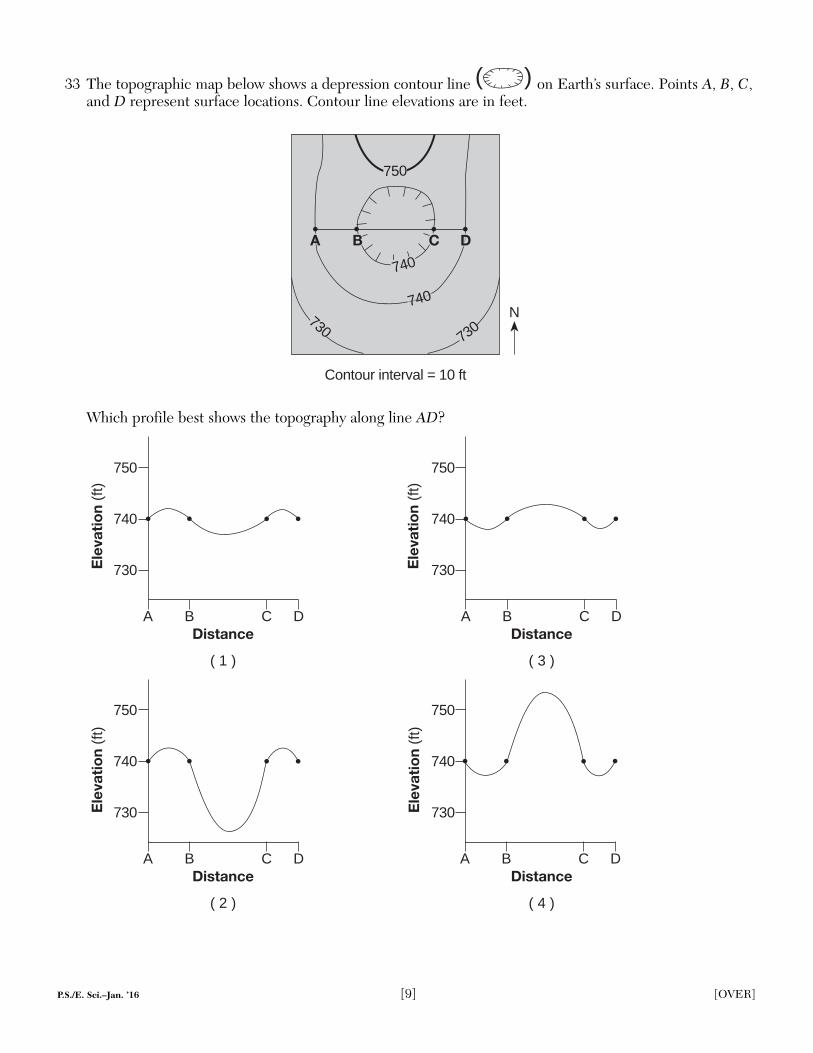
33 The topographic map below shows a depression contour line on Earth’s surface. Points A, B, C, and D represent surface locations. Contour line elevations are in feet.
Which profile best shows the topography along line AD?
A B C DDistance
Ele
vati
on
(ft)
( 1 )
750
740
730
A B C DDistance
Ele
vati
on
(ft)
( 2 )
750
740
730
A B C DDistance
Ele
vati
on
(ft)
( 4 )
750
740
730
A B C DDistance
Ele
vati
on
(ft)
( 3 )
750
740
730
N
740
A B D
740
C
750
730730
Contour interval = 10 ft
( )
P.S./E. Sci.–Jan. ’16 [9] [OVER]
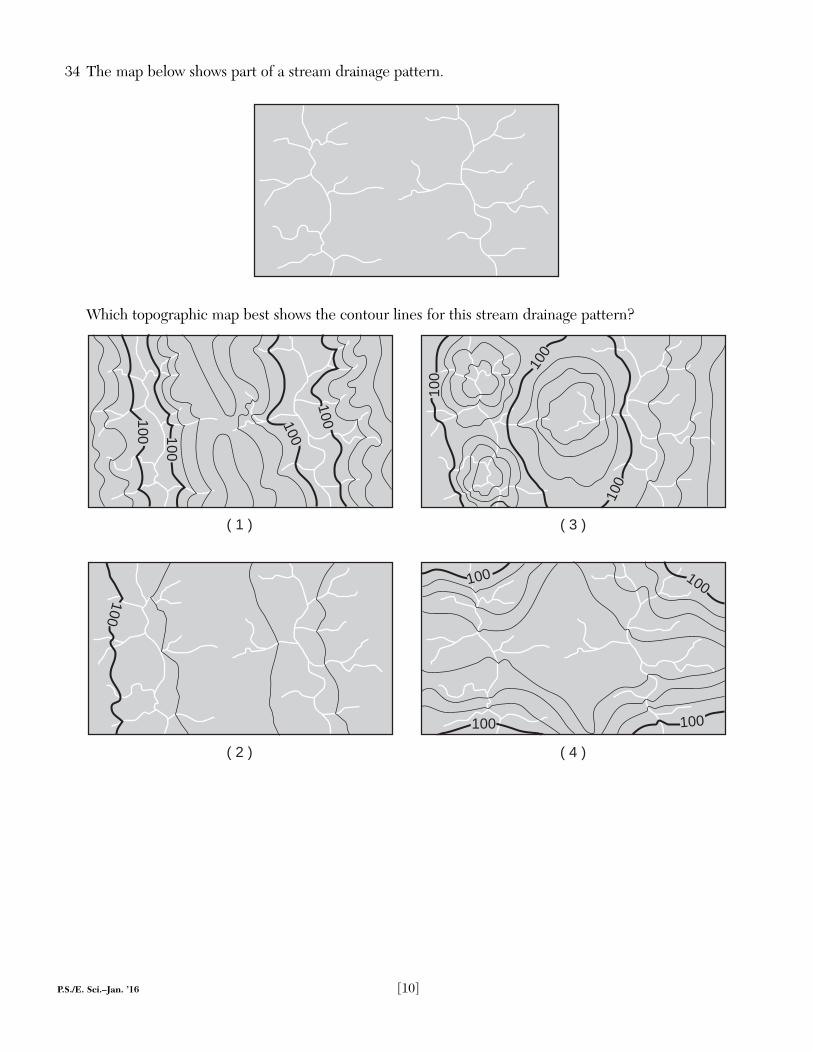
34 The map below shows part of a stream drainage pattern.
Which topographic map best shows the contour lines for this stream drainage pattern?
( 1 )
( 2 )
( 3 )
( 4 )
100 100
100
100
100
100
100 100
100 100
100
100
P.S./E. Sci.–Jan. ’16 [10]
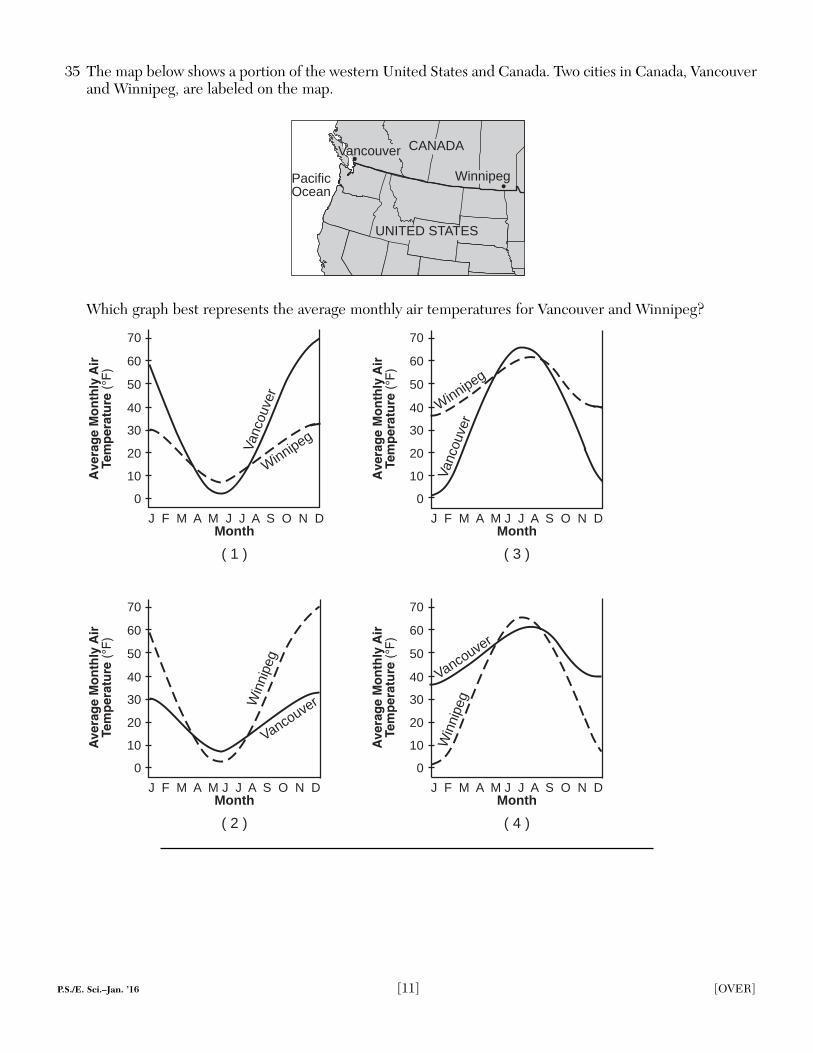
35 The map below shows a portion of the western United States and Canada. Two cities in Canada, Vancouverand Winnipeg, are labeled on the map.
Which graph best represents the average monthly air temperatures for Vancouver and Winnipeg?
J F M A M J J A S O N DMonth
( 1 )
J F M A M J J A S O N DMonth
( 3 )
J F M A M J J A S O N DMonth
( 2 )
J F M A M J J A S O N DMonth
( 4 )
0
10
20
30
40
50
60
70
Vanc
ouve
r
Winnipeg
0
10
20
30
40
50
60
70
Win
nipe
g
Vancouve
r
Vanc
ouve
r
Winnipeg
0
10
20
30
40
50
60
70
Win
nipe
g
Vancouve
r
0
10
20
30
40
50
60
70
CANADA
WinnipegPacificOcean
Vancouver
UNITED STATES
P.S./E. Sci.–Jan. ’16 [11] [OVER]
Base your answers to questions 36 through 40 on the weather maps below and on your knowledge of Earthscience. The weather maps show the eastern United States on two consecutive days. Some isobars are labeledin millibars (mb). Letter X represents a location on Earth’s surface on December 8, 2009.
36 What was the barometric pressure for location X on December 8?(1) 1016 mb (3) 1008 mb(2) 1012 mb (4) 1004 mb
N N
December 8, 2009 at 7:00 a.m.
984
December 9, 2009 at 7:00 a.m.
HIGH
LOW
988
992
1004
1000
1024
1020HIGH
New York
1024
1020
LOWx
996
New York
P.S./E. Sci.–Jan. ’16 [12]
Part B–1
Answer all questions in this part.
Directions (36–50): For each statement or question, choose the word or expression that, of those given, bestcompletes the statement or answers the question. Some questions may require the use of the 2011 EditionReference Tables for Physical Setting/Earth Science. Record your answers on your separate answer sheet.
P.S./E. Sci.–Jan. ’16 [13] [OVER]
37 Which map best shows the general surface wind pattern around the high-pressure system on December 8?
38 In which direction did the high-pressure center move from December 8, 2009, to December 9, 2009?(1) southwest (3) northwest(2) southeast (4) northeast
39 Which type of front was located just south of New York City on December 9?(1) cold (3) stationary(2) warm (4) occluded
40 Which information shown on the weather maps best indicates that wind speeds in New York State weregreater on December 9 than on December 8?(1) The isobars were closer together on December 9.(2) The fronts were closer together on December 9.(3) The air pressure over New York State was lower on December 9.(4) The air pressure over New York State was higher on December 9.
( 4 )( 3 )( 2 )( 1 )
HIGHHIGHHIGH HIGH
LOWx
10201024
LOWx
LOWx
LOWx
1020
1024
10201020
102010241024
1024
1020
1024
1020
1024
1020
1024
P.S./E. Sci.–Jan. ’16 [14]
Base your answers to questions 41 through 43 on the cross-sectional model below and the table on the following page, and on your knowledge of Earth science. The model shows a reddish-orange supergiant star. The layers in the model indicate where new chemical elements are forming from existing elements as temperature and pressure conditions increase with depth within the star. In each layer, atomic nuclei of theexisting chemical element combine to form the new elements shown to the right of the arrow. The table showsthe chemical symbols and names of selected elements in the star.
Fe/Ni
Key
Combinesto form
Core
Reddish-orangesupergiant star
(Not drawn to scale)
H He
He C, O
C Ne, Mg
Ne O, Mg
O Si, S
Si Fe, Ni
Elements in the Star
41 Which process represented in the model is occurring in each layer of this star to produce the new chemical elements?(1) contact metamorphism (3) nuclear fusion(2) internal crystallization (4) radioactive decay
42 What is the approximate surface temperature of this star during this stage of development?(1) 3,200 K (3) 10,500 K(2) 6,000 K (4) 18,000 K
43 The luminosity of this star can best be described as(1) less than the luminosity of the Sun(2) greater than the luminosity of most stars in the main sequence(3) approximately the same luminosity as a white dwarf(4) approximately the same luminosity as Aldebaran
Base your answers to questions 44 through 47 on the reading passage below and on your knowledge of Earthscience.
Roche MoutonéeA roche moutonée is a glacial landscape feature produced as an advancing glacier
slides over a hill of surface bedrock. As the glacier advances up the side of the hill, thesurface bedrock is abraded and smoothed by rock fragments carried within the base ofthe glacial ice, creating a more gentle hillslope. As the glacier advances down the oppo-site side of the hill, chunks of bedrock are broken off and removed by the ice, a processcalled glacial quarrying (plucking), making this side of the hill steeper. The resultinghill resembles a drumlin, except it is often smaller and is composed of solid bedrock.
44 The formation of a roche moutonée by glaciers is best described as an example of(1) chemical weathering (3) sediment deposition(2) physical weathering (4) mass movement
45 Which side-view model best shows the direction of ice movement and the locations of glacial abrasion andglacial quarrying that form a roche moutonée?
�����������
Glacier with embedded rockfragments slides over bedrock
A
Glacier with embedded rockfragments slides over bedrock
( 1 )
( 2 )
Glacier with embedded rockfragments slides over bedrock
( 3 )
Glacier with embedded rockfragments slides over bedrock
( 4 )
Q Q
AQ�����������
�����������
�����������
Key
A = Glacial abrasion Q= Glacial quarrying
A
Q
A
P.S./E. Sci.–Jan. ’16 [16]
46 A drumlin differs from a roche moutonée because a drumlin is(1) formed by glaciers (3) deposited by glacial meltwater(2) dome shaped (4) composed of loose sediments
47 The chunks of bedrock removed by glacial quarrying and transported by the glaciers most likely produce(1) terminal outwash plains (3) V-shaped valleys(2) kettle lake depressions (4) parallel scratches in surface bedrock
P.S./E. Sci.–Jan. ’16 [17] [OVER]
GO ON TO THE NEXT PAGE�
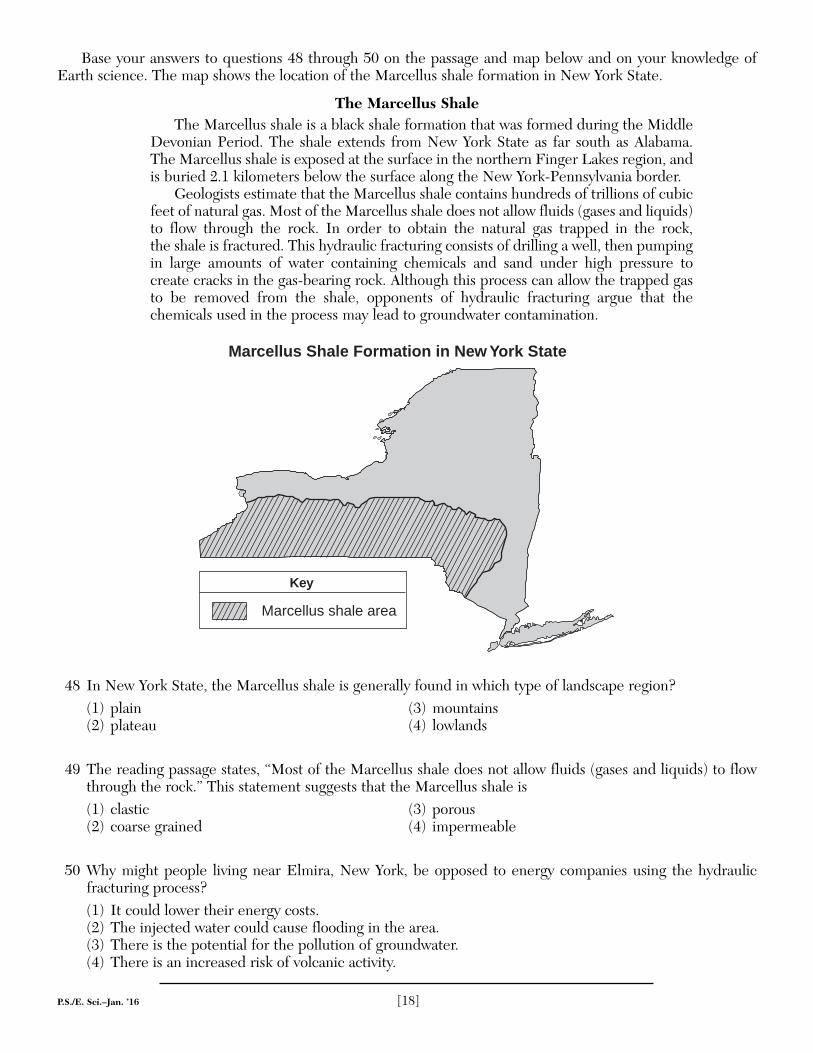
Base your answers to questions 48 through 50 on the passage and map below and on your knowledge ofEarth science. The map shows the location of the Marcellus shale formation in New York State.
The Marcellus ShaleThe Marcellus shale is a black shale formation that was formed during the Middle
Devonian Period. The shale extends from New York State as far south as Alabama. The Marcellus shale is exposed at the surface in the northern Finger Lakes region, andis buried 2.1 kilometers below the surface along the New York-Pennsylvania border.
Geologists estimate that the Marcellus shale contains hundreds of trillions of cubicfeet of natural gas. Most of the Marcellus shale does not allow fluids (gases and liquids)to flow through the rock. In order to obtain the natural gas trapped in the rock, the shale is fractured. This hydraulic fracturing consists of drilling a well, then pumpingin large amounts of water containing chemicals and sand under high pressure to create cracks in the gas-bearing rock. Although this process can allow the trapped gasto be removed from the shale, opponents of hydraulic fracturing argue that the chemicals used in the process may lead to groundwater contamination.
48 In New York State, the Marcellus shale is generally found in which type of landscape region?(1) plain (3) mountains(2) plateau (4) lowlands
49 The reading passage states, “Most of the Marcellus shale does not allow fluids (gases and liquids) to flowthrough the rock.” This statement suggests that the Marcellus shale is(1) clastic (3) porous(2) coarse grained (4) impermeable
50 Why might people living near Elmira, New York, be opposed to energy companies using the hydraulic fracturing process?(1) It could lower their energy costs.(2) The injected water could cause flooding in the area.(3) There is the potential for the pollution of groundwater.(4) There is an increased risk of volcanic activity.
Key
Marcellus shale area
Marcellus Shale Formation in New York State
P.S./E. Sci.–Jan. ’16 [18]
Base your answers to questions 51 and 52 on the cross section below and on your knowledge of Earth science. The unconformity is located at the boundary between Middle Proterozoic rock and Late Cambrian andEarly Ordovician rock.
51 Identify one geologic process that occurred in this region that produced the unconformity in this outcrop. [1]
52 Identify by name the oldest New York State index fossil that could be found in the Early Ordovicianbedrock. [1]
Late Cambrian andEarly Ordovician rock
Middle Proterozoic rock
Unconformity
P.S./E. Sci.–Jan. ’16 [19] [OVER]
Part B–2
Answer all questions in this part.
Directions (51–65): Record your answers in the spaces provided in your answer booklet. Some questionsmay require the use of the 2011 Edition Reference Tables for Physical Setting/Earth Science.
Base your answers to questions 53 through 56 on the passage and the map below and on your knowledge ofEarth science. The map indicates the epicenter (*) of a major earthquake that occurred at 38° N 142° E. Thismap also shows some smaller plates believed to be part of the major tectonic plates shown in the Earth ScienceReference Tables. Letter A represents a location on a plate boundary.
Devastating TsunamiOn March 11, 2011, one of the largest earthquakes ever recorded (magnitude 9.0)
produced a 7-meter-high tsunami that devastated Japan’s eastern coast. Thousands of people died and billions of dollars in damage occurred. Several hours after the earthquake, the tsunami reached the Hawaiian Islands and parts of North America’swest coast.
53 Identify by name the two tectonic plates labeled on the map above that are located directly on each side ofthe earthquake epicenter. [1]
54 On the cross section of the tectonic plate boundary in your answer booklet, draw one arrow in each circleto indicate the general direction of plate motion near the earthquake epicenter. [1]
55 Describe one immediate action that was most likely taken in the Hawaiian Islands to prevent the loss of lifeas the tsunami approached. [1]
56 Identify one geologic feature that was most likely produced by plate interaction at point A. [1]
�� � �� �������
��������� �������
��� � ������
����������� ����
�� �������
��������
�� � �� �����
��� ������
�!"�����
��������
����������
#
�
Key
Smaller plateboundaries
Japa
nese
Islan
ds
A
P.S./E. Sci.–Jan. ’16 [20]
P.S./E. Sci.–Jan. ’16 [21] [OVER]
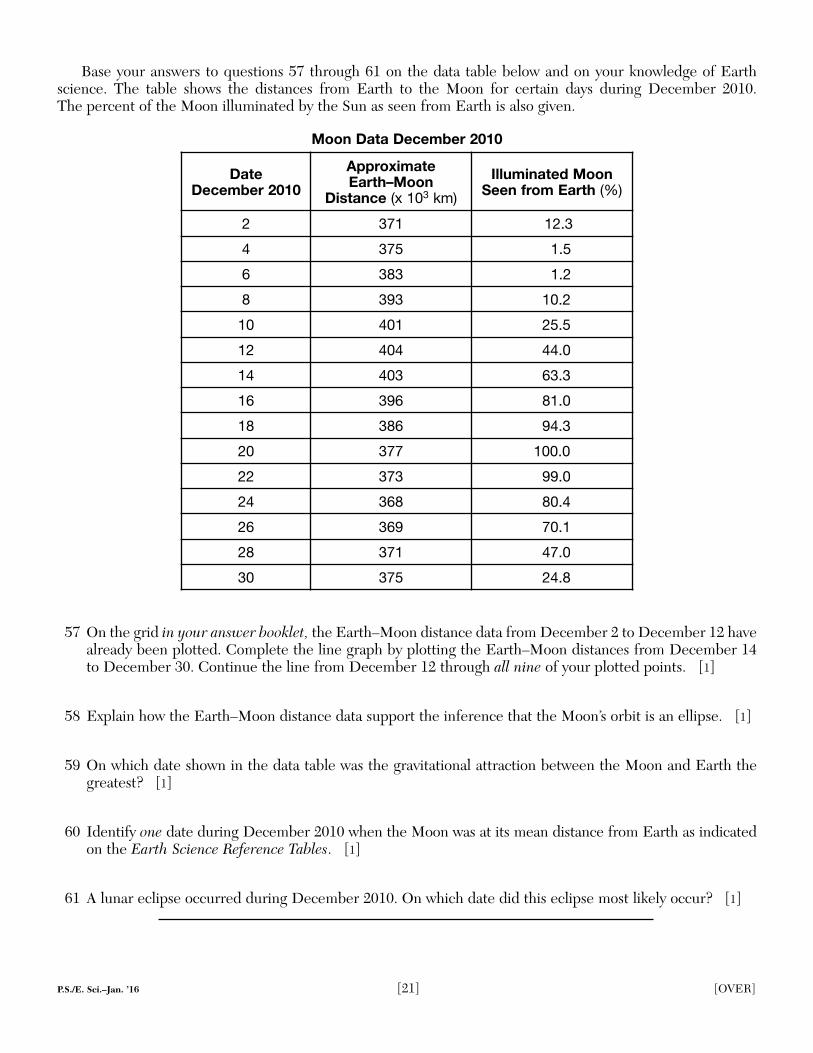
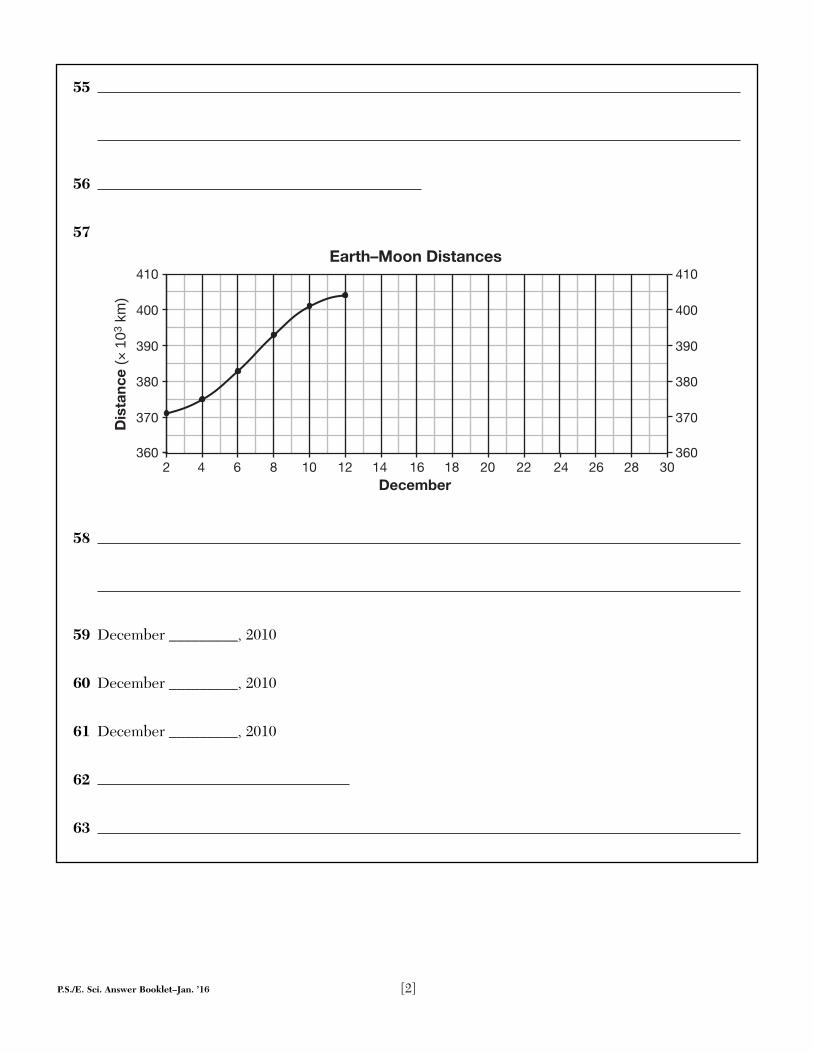
Base your answers to questions 57 through 61 on the data table below and on your knowledge of Earth science. The table shows the distances from Earth to the Moon for certain days during December 2010. The percent of the Moon illuminated by the Sun as seen from Earth is also given.
Moon Data December 2010
57 On the grid in your answer booklet, the Earth–Moon distance data from December 2 to December 12 havealready been plotted. Complete the line graph by plotting the Earth–Moon distances from December 14to December 30. Continue the line from December 12 through all nine of your plotted points. [1]
58 Explain how the Earth–Moon distance data support the inference that the Moon’s orbit is an ellipse. [1]
59 On which date shown in the data table was the gravitational attraction between the Moon and Earth thegreatest? [1]
60 Identify one date during December 2010 when the Moon was at its mean distance from Earth as indicatedon the Earth Science Reference Tables. [1]
61 A lunar eclipse occurred during December 2010. On which date did this eclipse most likely occur? [1]
DateDecember 2010
ApproximateEarth–Moon
Distance (x 103 km)
Illuminated MoonSeen from Earth (%)
2 371 12.3
4 375 1.5
6 383 1.2
8 393 10.2
10 401 25.5
12 404 44.0
14 403 63.3
16 396 81.0
18 386 94.3
20 377 100.0
22 373 99.0
24 368 80.4
26 369 70.1
28 371 47.0
30 375 24.8
P.S./E. Sci.–Jan. ’16 [22]
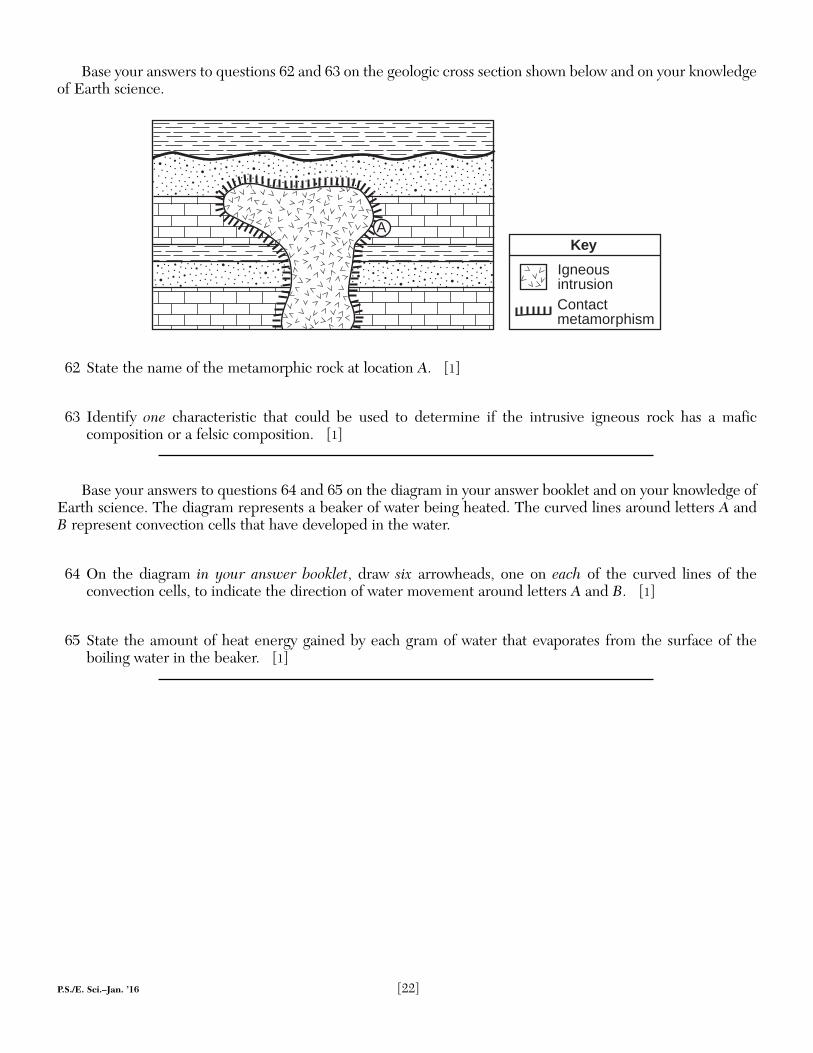
Base your answers to questions 62 and 63 on the geologic cross section shown below and on your knowledgeof Earth science.
62 State the name of the metamorphic rock at location A. [1]
63 Identify one characteristic that could be used to determine if the intrusive igneous rock has a mafic composition or a felsic composition. [1]
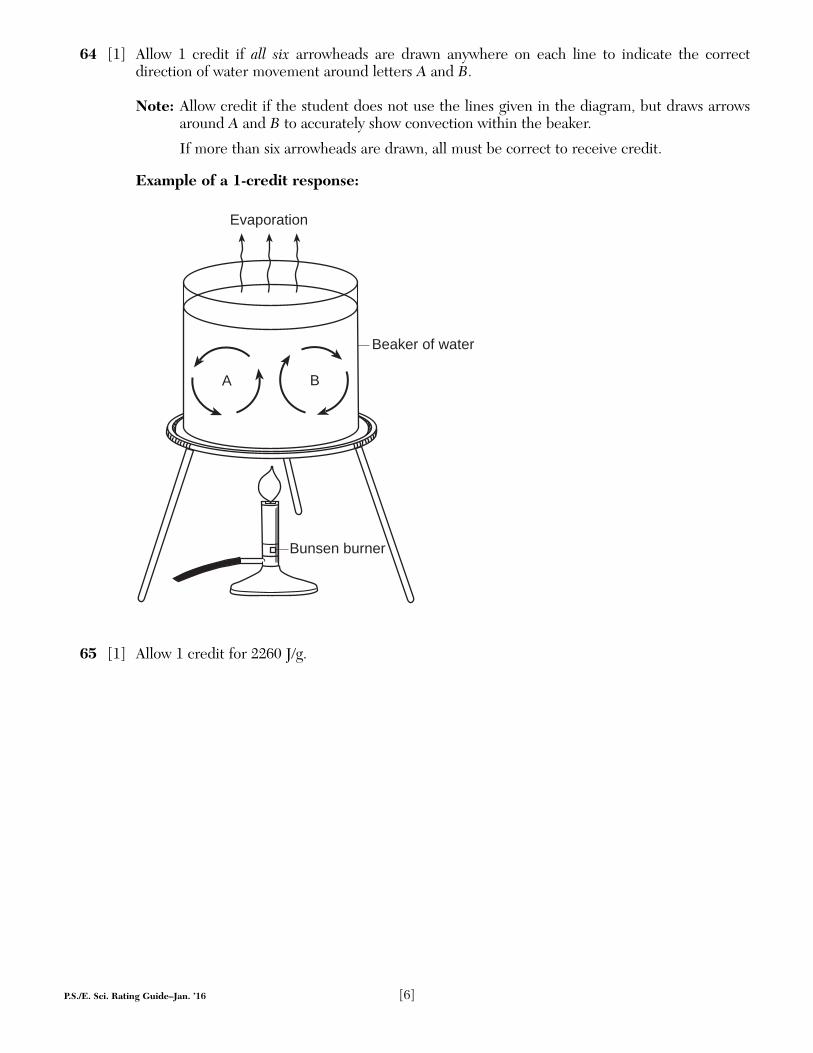
Base your answers to questions 64 and 65 on the diagram in your answer booklet and on your knowledge ofEarth science. The diagram represents a beaker of water being heated. The curved lines around letters A andB represent convection cells that have developed in the water.
64 On the diagram in your answer booklet, draw six arrowheads, one on each of the curved lines of the convection cells, to indicate the direction of water movement around letters A and B. [1]
65 State the amount of heat energy gained by each gram of water that evaporates from the surface of the boiling water in the beaker. [1]
AKey
IgneousintrusionContactmetamorphism
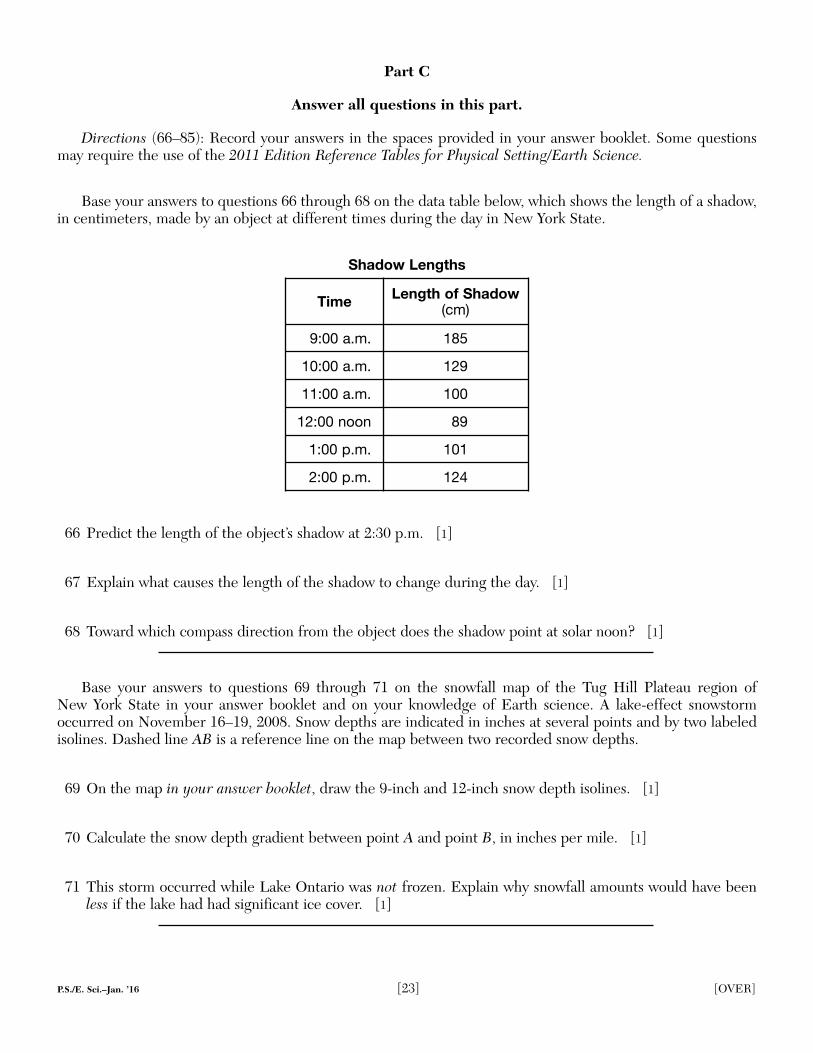
Base your answers to questions 66 through 68 on the data table below, which shows the length of a shadow,in centimeters, made by an object at different times during the day in New York State.
Shadow Lengths
66 Predict the length of the object’s shadow at 2:30 p.m. [1]
67 Explain what causes the length of the shadow to change during the day. [1]
68 Toward which compass direction from the object does the shadow point at solar noon? [1]
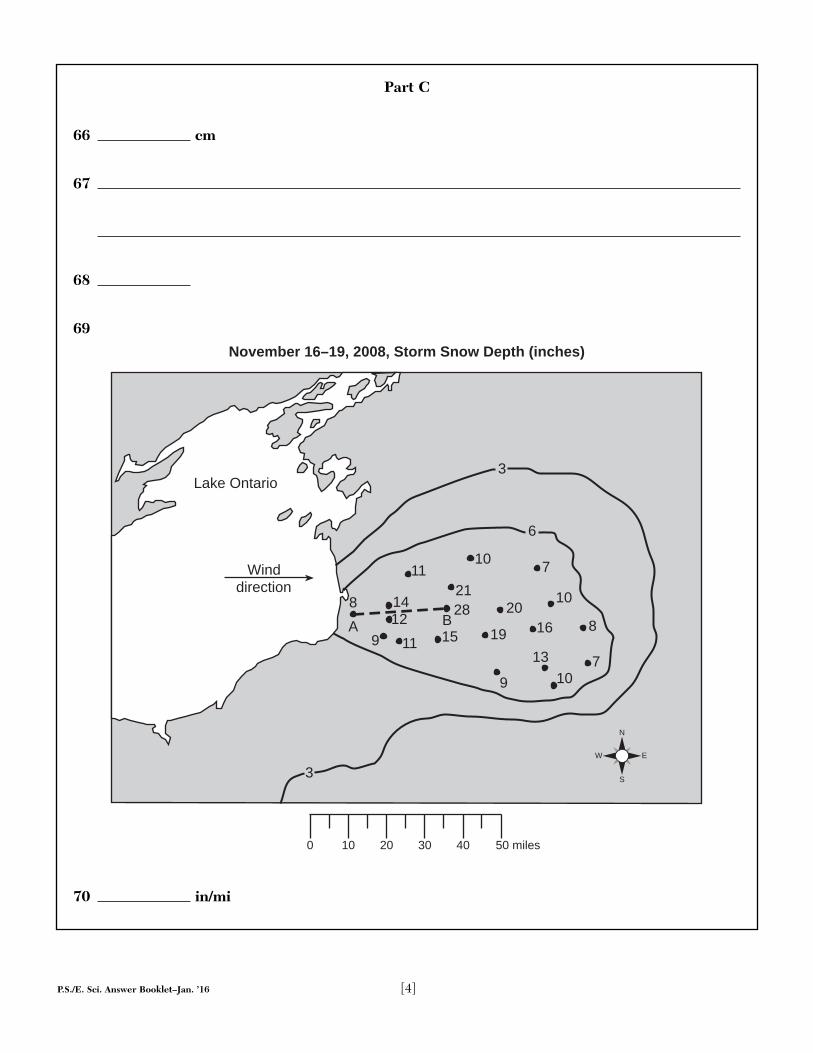
Base your answers to questions 69 through 71 on the snowfall map of the Tug Hill Plateau region of New York State in your answer booklet and on your knowledge of Earth science. A lake-effect snowstormoccurred on November 16–19, 2008. Snow depths are indicated in inches at several points and by two labeledisolines. Dashed line AB is a reference line on the map between two recorded snow depths.
69 On the map in your answer booklet, draw the 9-inch and 12-inch snow depth isolines. [1]
70 Calculate the snow depth gradient between point A and point B, in inches per mile. [1]
71 This storm occurred while Lake Ontario was not frozen. Explain why snowfall amounts would have beenless if the lake had had significant ice cover. [1]
Time Length of Shadow(cm)
9:00 a.m. 185
10:00 a.m. 129
11:00 a.m. 100
12:00 noon 89
1:00 p.m. 101
2:00 p.m. 124
P.S./E. Sci.–Jan. ’16 [23] [OVER]
Part C
Answer all questions in this part.
Directions (66–85): Record your answers in the spaces provided in your answer booklet. Some questionsmay require the use of the 2011 Edition Reference Tables for Physical Setting/Earth Science.
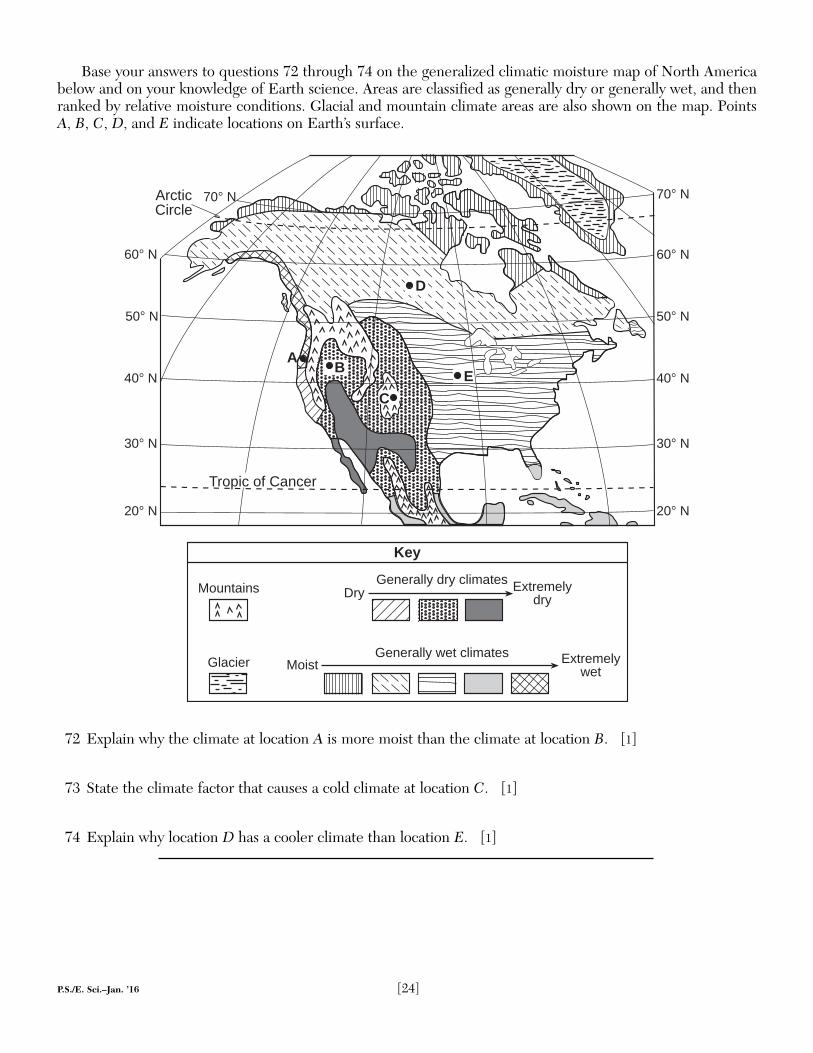
Base your answers to questions 72 through 74 on the generalized climatic moisture map of North Americabelow and on your knowledge of Earth science. Areas are classified as generally dry or generally wet, and thenranked by relative moisture conditions. Glacial and mountain climate areas are also shown on the map. PointsA, B, C, D, and E indicate locations on Earth’s surface.
72 Explain why the climate at location A is more moist than the climate at location B. [1]
73 State the climate factor that causes a cold climate at location C. [1]
74 Explain why location D has a cooler climate than location E. [1]
20& N
60& N
50& N
30& N
20& N
60& N
50& N
40& N
30& N
A
D
ArcticCircle
70& N70& N
40& N
Mountains
Glacier
Key
Generally dry climates ExtremelydryDry
Generally wet climates ExtremelywetMoist
EB
C
Tropic of Cancer
P.S./E. Sci.–Jan. ’16 [24]
P.S./E. Sci.–Jan. ’16 [25] [OVER]
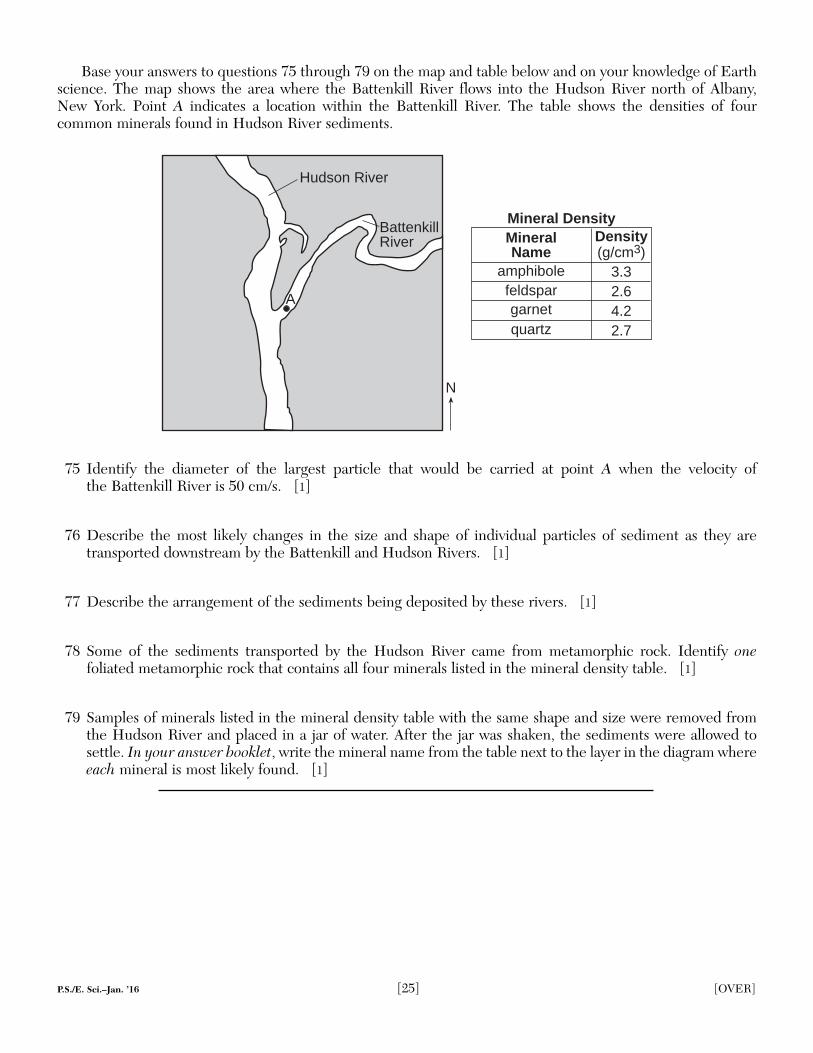
Base your answers to questions 75 through 79 on the map and table below and on your knowledge of Earthscience. The map shows the area where the Battenkill River flows into the Hudson River north of Albany, New York. Point A indicates a location within the Battenkill River. The table shows the densities of four common minerals found in Hudson River sediments.
75 Identify the diameter of the largest particle that would be carried at point A when the velocity of the Battenkill River is 50 cm/s. [1]
76 Describe the most likely changes in the size and shape of individual particles of sediment as they are transported downstream by the Battenkill and Hudson Rivers. [1]
77 Describe the arrangement of the sediments being deposited by these rivers. [1]
78 Some of the sediments transported by the Hudson River came from metamorphic rock. Identify onefoliated metamorphic rock that contains all four minerals listed in the mineral density table. [1]
79 Samples of minerals listed in the mineral density table with the same shape and size were removed fromthe Hudson River and placed in a jar of water. After the jar was shaken, the sediments were allowed to settle. In your answer booklet, write the mineral name from the table next to the layer in the diagram whereeach mineral is most likely found. [1]
BattenkillRiver
A
N
Hudson River
amphibolefeldspargarnet
MineralName
Density(g/cm3)
3.32.64.22.7quartz
Mineral Density
P.S./E. Sci.–Jan. ’16 [26]
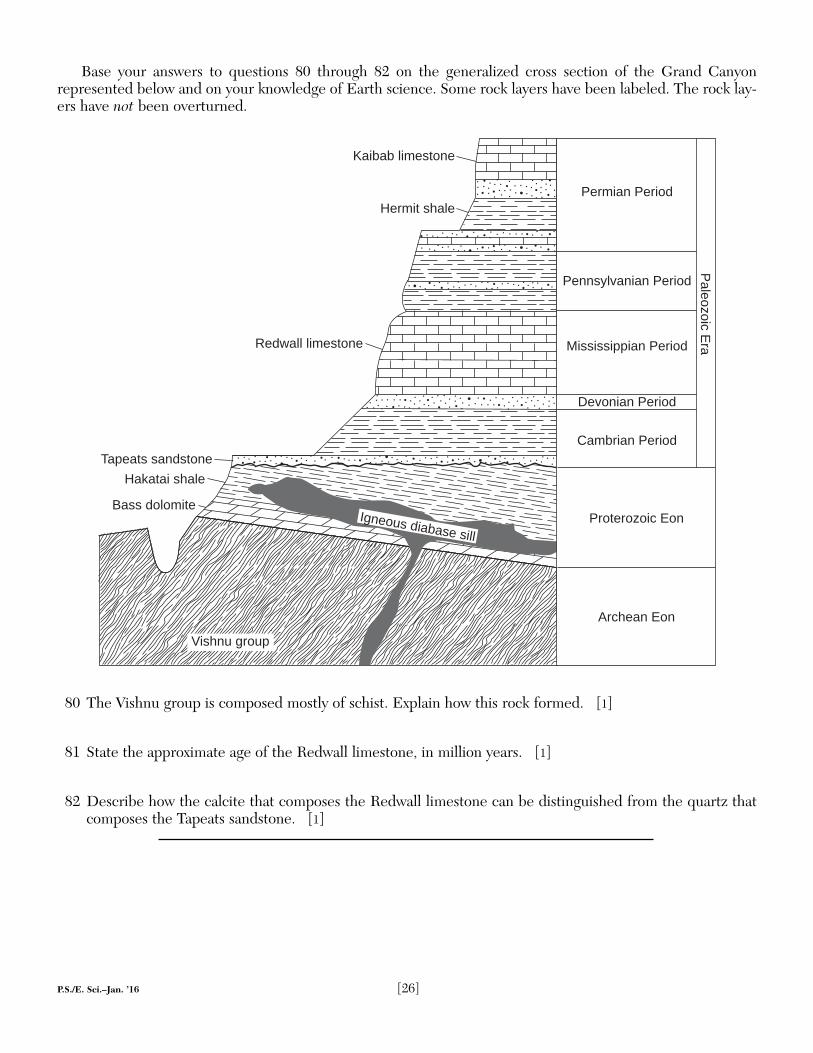
Base your answers to questions 80 through 82 on the generalized cross section of the Grand Canyon represented below and on your knowledge of Earth science. Some rock layers have been labeled. The rock lay-ers have not been overturned.
80 The Vishnu group is composed mostly of schist. Explain how this rock formed. [1]
81 State the approximate age of the Redwall limestone, in million years. [1]
82 Describe how the calcite that composes the Redwall limestone can be distinguished from the quartz thatcomposes the Tapeats sandstone. [1]
Vishnu group
Igneous diabase sill
Tapeats sandstone
Hakatai shale
Bass dolomite
Redwall limestone
Kaibab limestone
Hermit shalePermian Period
Pennsylvanian Period
Mississippian Period
Devonian Period
Cambrian Period
Proterozoic Eon
Paleozoic E
ra
Archean Eon
P.S./E. Sci.–Jan. ’16 [27]
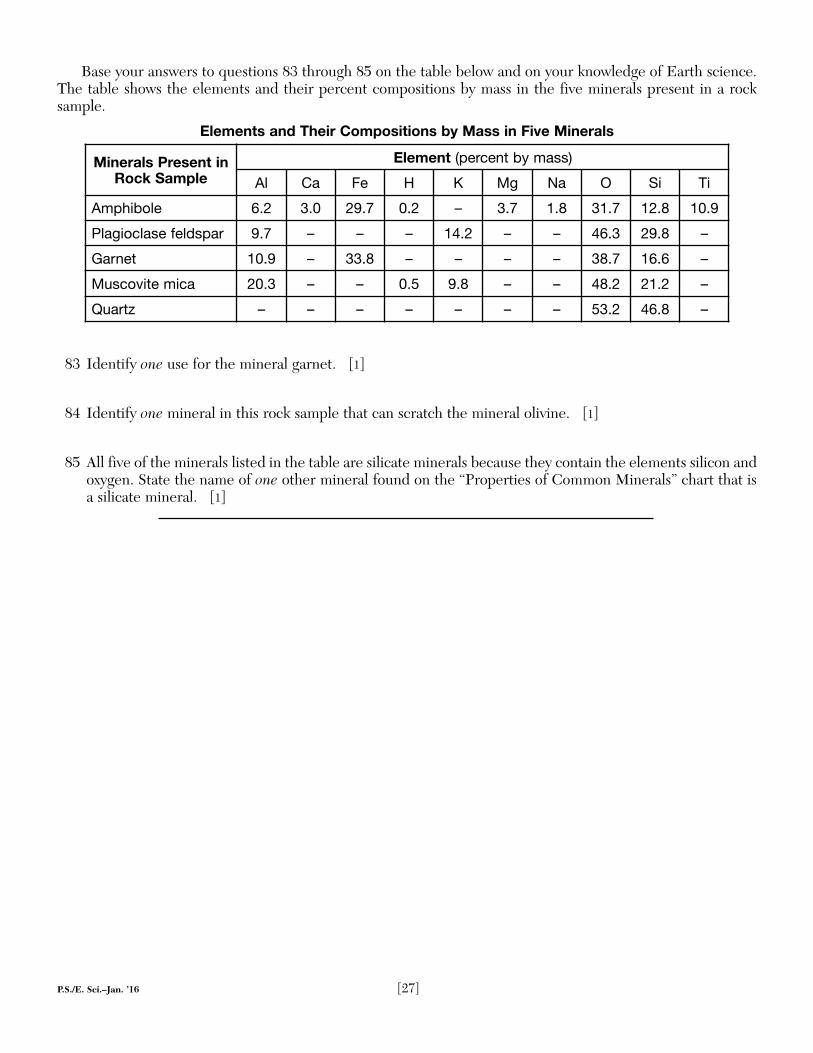
Base your answers to questions 83 through 85 on the table below and on your knowledge of Earth science.The table shows the elements and their percent compositions by mass in the five minerals present in a rock sample.
Elements and Their Compositions by Mass in Five Minerals
83 Identify one use for the mineral garnet. [1]
84 Identify one mineral in this rock sample that can scratch the mineral olivine. [1]
85 All five of the minerals listed in the table are silicate minerals because they contain the elements silicon andoxygen. State the name of one other mineral found on the “Properties of Common Minerals” chart that isa silicate mineral. [1]
Record your answers for Part B–2 and Part C in this booklet.
� Male
51
52
53 __________________________________ Plate and __________________________________ Plate
54
Earthquakeepicenter
Ocean
Japaneseislands
*
(Not drawn to scale)
Part B–2
P.S./E. Sci. Answer Booklet–Jan. ’16 [2]
55
56
57
58
59 December _________, 2010
60 December _________, 2010
61 December _________, 2010
62
63
360
370
380
390
400
410
2 4 6 8 10 12 14 16 18 20 22 24 26 28 30
Dis
tanc
e (×
103
km
)
December
Earth–Moon Distances
360
370
380
390
400
410
P.S./E. Sci. Answer Booklet–Jan. ’16 [3] [OVER]
64
65 J/g
Beaker of water
A B
Evaporation
Bunsen burner
P.S./E. Sci. Answer Booklet–Jan. ’16 [4]
66 cm
67
68
69
70 in/mi
November 16–19, 2008, Storm Snow Depth (inches)
3
3
14
1513
28 2021
19
7
10
8
7
6
16
10
9 11
9 10
N
S
W E
Winddirection
Lake Ontario
B128
0 50 miles10 20 30 40
A
11
Part C
P.S./E. Sci. Answer Booklet–Jan. ’16 [5] [OVER]
71
72
73
74 Location D:
75 cm
76 Changes in size:
Changes in shape:
77
78
79
80
81 my
82
83
84
85
ABCD
A :
Layers
Water
B :
C :
D :
P.S./E. Sci. Answer Booklet–Jan. ’16 [6]
P.S./EARTH SCIENCEP.S./EARTH SCIENCE
Printed on Recycled Paper
Directions to the Teacher:Refer to the directions on page 2 before rating student papers.
Updated information regarding the rating of this examination may be posted on the New YorkState Education Department’s web site during the rating period. Check this web site at:http://www.p12.nysed.gov/assessment/ and select the link “Scoring Information” for any recentlyposted information regarding this examination. This site should be checked before the ratingprocess for this examination begins and several times throughout the Regents Examination period.
FOR TEACHERS ONLYThe University of the State of New York
REGENTS HIGH SCHOOL EXAMINATION
PHYSICAL SETTING/EARTH SCIENCE
Thursday, January 28, 2016 — 9:15 a.m. to 12:15 p.m., only
SCORING KEY AND RATING GUIDE
Part A and Part B–1Allow 1 credit for each correct response.
Follow the procedures below for scoring student answer papers for the Regents Examination in PhysicalSetting/Earth Science. Additional information about scoring is provided in the publication InformationBooklet for Scoring Regents Examinations in the Sciences.
Do not attempt to correct the student’s work by making insertions or changes of any kind. If the student’s responses for the multiple-choice questions are being hand scored prior to beingscanned, the scorer must be careful not to make any marks on the answer sheet except to recordthe scores in the designated score boxes. Marks elsewhere on the answer sheet will interfere withthe accuracy of the scanning.
Allow 1 credit for each correct response.
At least two science teachers must participate in the scoring of the Part B–2 and Part C open-ended questions on a student’s paper. Each of these teachers should be responsible for scoring a selected number ofthe open-ended questions on each answer paper. No one teacher is to score more than approximately one-halfof the open-ended questions on a student’s answer paper. Teachers may not score their own students’ answerpapers.
Students’ responses must be scored strictly according to the Scoring Key and Rating Guide. For open-ended questions, credit may be allowed for responses other than those given in the rating guide ifthe response is a scientifically accurate answer to the question and demonstrates adequate knowledge as indicated by the examples in the rating guide. On the student’s separate answer sheet, for each question, recordthe number of credits earned and the teacher’s assigned rater/scorer letter.
Fractional credit is not allowed. Only whole-number credit may be given for a response. If the studentgives more than one answer to a question, only the first answer should be rated. Units need not be given whenthe wording of the questions allows such omissions.
For hand scoring, raters should enter the scores earned in the appropriate boxes printed on the separateanswer sheet. Next, the rater should add these scores and enter the total in the space provided. The student’sscore for the Earth Science Performance Test should be recorded in the space provided. Then the student’sraw scores on the written test and the performance test should be converted to a scale score by using the conversion chart that will be posted on the Department’s web site at: http://www.p12.nysed.gov/assessment/on Thursday, January 28, 2016. The student’s scale score should be entered in the box labeled “Scale Score”on the student’s answer sheet. The scale score is the student’s final examination score.
Schools are not permitted to rescore any of the open-ended questions on this exam after eachquestion has been rated once, regardless of the final exam score. Schools are required to ensurethat the raw scores have been added correctly and that the resulting scale score has been determined accurately.
Because scale scores corresponding to raw scores in the conversion chart may change from one administration to another, it is crucial that, for each administration, the conversion chart provided for thatadministration be used to determine the student’s final score.
51 [1] Allow 1 credit. Acceptable responses include, but are not limited to:
— uplift/emergence
— erosion
— submergence/subsidence
— weathering
— deposition
— burial
52 [1] Allow 1 credit for Tetragraptus.
53 [1] Allow 1 credit for Pacific Plate and Okhotsk Plate.
54 [1] Allow 1 credit for two correctly drawn arrows, one in each circle, that indicate a converging plateboundary. Student-drawn arrows must be oriented within a range of plus or minus 45° (the regionbetween the dotted lines) of the two arrows as shown below.
Note: Allow credit even if arrows are not inside the circles.
Example of a 1-credit response:
Earthquakeepicenter
Ocean
Japaneseislands
*
(Not drawn to scale)
P.S./E. Sci. Rating Guide–Jan. ’16 [3]
Part B–2
Allow a maximum of 15 credits for this part.
55 [1] Allow 1 credit. Acceptable responses include, but are not limited to:
— Sound alarm for residents.
— Move to higher ground.
— Evacuate coastal areas.
— Broadcast radio/TV bulletins.
— Move ships away from the coast.
— Follow evacuation routes.
56 [1] Allow 1 credit. Acceptable responses include, but are not limited to:
— volcano/volcanic mountain
— trench/Aleutian trench
— island arc
— mountains
— fault
57 [1] Allow 1 credit if the centers of all nine of the student’s plots are within or touch the circles shownand all 15 plots are correctly connected with a line that passes within or touches each circle.
Note: Allow credit if the line misses a plot but is still within or touches the circle.
It is recommended that an overlay of the same scale as the student answer booklet be usedto ensure reliability in rating.
360
370
380
390
400
410
2 4 6 8 10 12 14 16 18 20 22 24 26 28 30
Dis
tanc
e (×
103
km
)
December
Earth–Moon Distances
360
370
380
390
400
410
P.S./E. Sci. Rating Guide–Jan. ’16 [4]
58 [1] Allow 1 credit. Acceptable responses include, but are not limited to:
— The Earth-Moon distance varies in a regular pattern.
— The Earth-Moon distance is not constant.
— A circular orbit would have the same distance throughout the month.
— The Earth-Moon graph increases, then decreases.
59 [1] Allow 1 credit for December 24, 2010.
60 [1] Allow 1 credit for December 18, 2010, or December 6, 2010, or December 7, 2010.
61 [1] Allow 1 credit for December 20, 2010 or December 21, 2010.
62 [1] Allow 1 credit for marble or hornfels.
63 [1] Allow 1 credit. Acceptable responses include, but are not limited to:
— color/light color/dark color
— density/low density/high density
— mineral composition
— rich in Al, Si, or rich in Fe, Mg
— presence/absence of quartz/potassium feldspar/pyroxene/olivine
Note: Do not allow credit for “composition” alone because it is stated in the question.
P.S./E. Sci. Rating Guide–Jan. ’16 [5]
64 [1] Allow 1 credit if all six arrowheads are drawn anywhere on each line to indicate the correct direction of water movement around letters A and B.
Note: Allow credit if the student does not use the lines given in the diagram, but draws arrowsaround A and B to accurately show convection within the beaker.
If more than six arrowheads are drawn, all must be correct to receive credit.
Example of a 1-credit response:
65 [1] Allow 1 credit for 2260 J/g.
Beaker of water
A B
Evaporation
Bunsen burner
P.S./E. Sci. Rating Guide–Jan. ’16 [6]
66 [1] Allow 1 credit for any value from 130 cm to 160 cm.
67 [1] Allow 1 credit. Acceptable responses include, but are not limited to:
— The altitude of the Sun in the sky changes.
— Earth rotates.
— the Sun’s position in the sky
— the apparent motion of the Sun
68 [1] Allow 1 credit for north or N.
69 [1] Allow 1 credit for correctly drawn 9-inch and 12-inch snow depth isolines. If additional isolineshave been drawn, all isolines must be correct to receive credit.
Example of a 1-credit response:
November 16–19, 2008, Storm Snow Depth (inches)
3
3
14
1513
28 2021
19
7
10
8
7
6
16
10
9 11
9 10
N
S
W E
Winddirection
Lake Ontario
B128
0 50 miles10 20 30 40
A
11
P.S./E. Sci. Rating Guide–Jan. ’16 [7]
Part C
Allow a maximum of 20 credits for this part.
70 [1] Allow 1 credit for any response from 0.75 in/mi to 0.85 in/mi.
Note: Do not allow credit for 20___25 because this does not show a complete calculation.
71 [1] Allow 1 credit. Acceptable responses include, but are not limited to:
— Not as much moisture would have evaporated from Lake Ontario, so the snowfall depthswould not have been as great.
— Less water vapor would have been picked up from the lake surface.
— An unfrozen lake surface allows for more evaporation.
72 [1] Allow 1 credit. Acceptable responses include, but are not limited to:
— Location A is on the windward side of mountains.
— Location A receives prevailing winds off the ocean.
— Location A is closer to the ocean.
— Location B is on the leeward side of a mountain range.
— Adiabatic warming occurs in descending air at location B after losing most of its moistureon the windward side of a mountain/orographic effect.
— The prevailing southwest winds bring moist air to location A.
73 [1] Allow 1 credit. Acceptable responses include, but are not limited to:
— elevation
— high altitude
— mountains
74 [1] Allow 1 credit. Acceptable responses include, but are not limited to:
— higher latitude
— farther north of the equator
— lower angle of insolation
— Location E is closer to the equator.
Note: Do not allow credit for “latitude” alone because it is not specific enough.
75 [1] Allow 1 credit for any value from 0.8 cm to 1.1 cm.
P.S./E. Sci. Rating Guide–Jan. ’16 [8]
76 [1] Allow 1 credit if both responses are acceptable. Acceptable responses include, but are not limitedto:
Changes in size:
— smaller
— decreases
Changes in shape:
— They become more rounded.
— rounder
— less angular
Note: Do not allow credit for “smoother” alone because this denotes a texture, not a shape.
77 [1] Allow 1 credit. Acceptable responses include, but are not limited to:
— Sediments deposited by a river are arranged in layers/stratified layers.
— River deposits are sorted.
— sorted by size, shape, and density
78 [1] Allow 1 credit. Acceptable responses include, but are not limited to:
— gneiss
— schist
— phyllite
79 [1] Allow 1 credit for the minerals listed in the order shown below.
A: feldspar
B: quartz
C: amphibole
D: garnet
80 [1] Allow 1 credit. Acceptable responses include, but are not limited to:
— Heat and pressure metamorphosed early rocks.
— Regional metamorphism distorted these rocks.
— heat and pressure
— metamorphism
Note: Do not allow credit for “contact metamorphism” because schist forms from regional metamorphism.
P.S./E. Sci. Rating Guide–Jan. ’16 [9]
81 [1] Allow 1 credit for any value from 318 my to 359 my.
82 [1] Allow 1 credit. Acceptable responses include, but are not limited to:
— Calcite bubbles with acid.
— Calcite shows cleavage.
— Quartz is harder than calcite.
— Calcite is composed of calcium (Ca), oxygen (O), and carbon (C), and quartz is composedof silicon (Si) and oxygen (O).
83 [1] Allow 1 credit. Acceptable responses include, but are not limited to:
— jewelry
— abrasives
— gemstone
84 [1] Allow 1 credit for garnet or quartz.
85 [1] Allow 1 credit for one mineral listed below.
— talc
— biotite mica/biotite
— pyroxene
— potassium feldspar/orthoclase
— olivine
P.S./E. Sci. Rating Guide–Jan. ’16 [10]
P.S./E. Sci. Rating Guide–Jan. ’16 [11]
The Chart for Determining the Final Examination Score for the January 2016Regents Examination in Physical Setting/Earth Science will be posted on theDepartment’s web site at: http://www.p12.nysed.gov/assessment/ on Thursday,January 28, 2016. Conversion charts provided for previous administrations ofthe Regents Examination in Physical Setting/Earth Science must NOT be usedto determine students’ final scores for this administration.
Regents Examination in Physical Setting/Earth Science
January 2016
Chart for Converting Total Test Raw Scores toFinal Examination Scores (Scale Scores)
Online Submission of Teacher Evaluations of the Test to the Department
Suggestions and feedback from teachers provide an important contribution to the test development process. The Department provides an online evaluation form for State assessments. It contains spaces for teachers to respond to several specific questions and tomake suggestions. Instructions for completing the evaluation form are as follows:
1. Go to http://www.forms2.nysed.gov/emsc/osa/exameval/reexameval.cfm.
2. Select the test title.
3. Complete the required demographic fields.
4. Complete each evaluation question and provide comments in the space provided.
5. Click the SUBMIT button at the bottom of the page to submit the completed form.
P.S./E. Sci. Rating Guide–Jan. ’16 [12]
Map to Core Curriculum
January 2016 Physical Setting/Earth Science Question Numbers
Key Ideas/Performance Indicators Part A Part B Part C Standard 1
Math Key Idea 1 2, 12 57 70 Math Key Idea 2 28 36, 42, 43, 58, 60 66
The State Education Department / The University of the State of New York
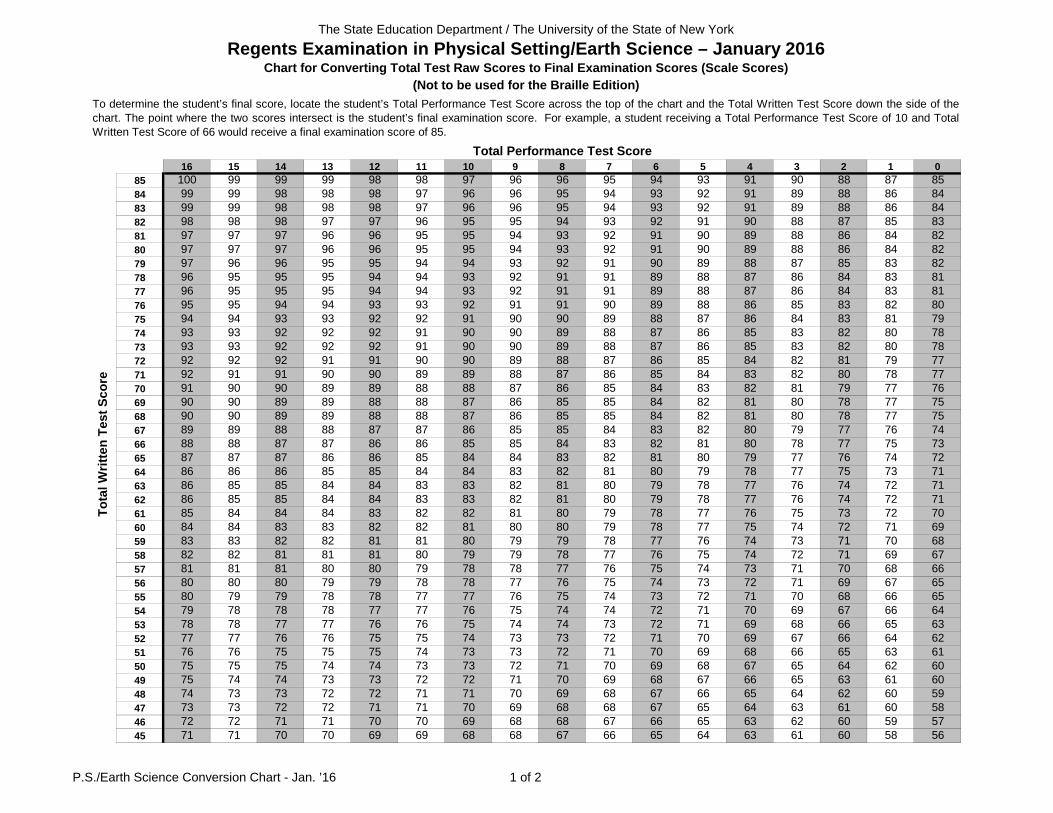
Regents Examination in Physical Setting/Earth Science – January 2016Chart for Converting Total Test Raw Scores to Final Examination Scores (Scale Scores)
(Not to be used for the Braille Edition)
Total Performance Test Score
To determine the student’s final score, locate the student’s Total Performance Test Score across the top of the chart and the Total Written Test Score down the side of thechart. The point where the two scores intersect is the student’s final examination score. For example, a student receiving a Total Performance Test Score of 10 and TotalWritten Test Score of 66 would receive a final examination score of 85.
Tota
l Writ
ten
Test
Sco
re
P.S./Earth Science Conversion Chart - Jan. ’16 2 of 2


![PHYSICAL SETTING EARTH SCIENCE - JMAPjmap.org/IJMAP/EarthScience/0815ExamES.pdfP.S./E. Sci.–Aug. ’15 [2] Part A Answer all questions in this part. Directions (1–35): For eachstatement](https://static.documents.pub/doc/80x56/5f050a487e708231d410f5e0/physical-setting-earth-science-pse-sciaaug-a15-2-part-a-answer-all.jpg)


