PHYSICAL WELLBEING OF THE YOUNG CHILD IN INDIA: Challenges, Prospects and Way Forward Ramachandran, V., 2018. From the Womb to Primary School: Challenges, Policies and Prospects for the Young Child in India. Technical Background Paper for the Report, 2020, Mobile Creches, New Delhi. Ramani Venkatesan August 2018 This technical background paper was specially commissioned by Mobile Creches to contribute towards the State of the Young Child in India Report
Transcript
PHYSICAL WELLBEING OF THE YOUNG CHILD IN INDIA:
Challenges, Prospects and Way Forward
Ramachandran, V., 2018. From the Womb to Primary School: Challenges, Policies and Prospects for the Young Child in India. Technical Background
Paper for the Report, 2020, Mobile Creches, New Delhi.
Ramani Venkatesan
August 2018
This technical background paper was specially commissioned by Mobile Creches to contribute towards the State of the Young Child in India Report
ACRONYMS
AERC Applied Economics Research Centre ANC Antenatal Care ANM Auxiliary Nurse Midwife AWC Anganwadi Centre AWH Anganwadi Helper AWW Anganwadi Worker BRAC Building Resources Across Communities CBO Community Based Organisation CDPO Child Development Project Officer GDP Gross Domestic Product GIS Geographic Information System GPRS General Packet Radio Service FOCUS Focus On Children Under Six ICDS Integrated Child Development Services IFPRI International Food Policy Research Institute IMR Infant Mortality Rate IUGR Intra Uterine Growth Retardation JPHN Junior Public Health Nurse LBW Low Birth Weight MPR Monthly Progress Report NFHS-3 National Family Health Survey (3rd Round) NFHS-4 National Family Health Survey (4th Round) NGO Non-Governmental Organisation NHM National Health Mission NNM National Nutrition Mission PDS Public Distribution System PHC Primary Health Centre POCUS Progress Of Children Under Six RSOC Rapid Survey On Children SAM Severe Acute Malnutrition SC Scheduled Caste SD Standard Deviation SDG Sustainable Development Goals SGA Small for Gestational Age SNP Supplementary Nutrition Programme ST Scheduled Tribe THR Take Home Rations TT Tetanus Toxoid U5 Under Five Years of Age U5MR Under Five Mortality Rate U6 Under Six Years of Age UNICEF United Nations Children’s Fund VHSND Village Health Sanitation and Nutrition Day WHA World Health Assembly WHO World Health Organisation
1 | 49
Overview
“Many of the things we need can wait. The child cannot. Right now is the time his bones are being formed, his blood is being made and his senses are being developed. To him we cannot answer “Tomorrow”, his name is today."
(Gabriela Mistral) “History will judge us by the difference we make in the everyday lives of children.”
(Nelson Mandela)
Child malnutrition, especially in the age group below five, represents one of the biggest, yet most invisible, public health problems in most countries in Africa and Southern Asia. This phenomenon affects both mortality and morbidity levels in U5 children, with its cascading effects having an impact on the individual through her life cycle and those of succeeding generations. Apart from the individual, the effects of child malnutrition are also felt at an economy-wide level. Poor nutrition and health outcomes in early childhood leave their mark on economic productivity and growth, with a significant part of the population unable to contribute to the economy to the fullest of their potential.
The existence of chronic child malnutrition is an unfortunate, but notable,
feature of many countries in Sub-Saharan Africa and Southern Asia, which together account for the bulk of stunted and wasted children in the world as well as the majority of maternal and child mortality cases. Malnutrition accounts for about 45 percent of deaths in U5 children (for the purposes of this paper, while all statistics deal with U5 children, the policies adopted in India, especially under the ICDS, cover the U6 child). With its large populations, the countries of South Asia are major contributors to the international burden of child malnutrition and mortality. The Asian Enigma1 highlighted over two decades ago, still persists, with all the South Asian countries (barring Sri Lanka) figuring in the list of the bottom thirty countries in terms of U5 child stunting rates.
This paper, which focuses on the largest South Asian country, India, analyses
the debilitating effects of malnutrition and poor health on mothers, the resulting impacts on children, especially in the first two years of life, when a large part of physical and mental development takes place in the child and the implications of this for the economy and society in which these children are the future citizens. The methodologies for measuring the nutrition status of the child from the time of birth till s/he is five years old are explained. How these anthropometric measures have moved over time, especially in the present millennium, are examined, both in terms of how India fares globally and how its states fare in relation to one another. In 1 Ramalingaswami Vulimiri, Urban Jonnson, Jon Rohde, 1996
2 | 49
tparticular, the variations in nutrition status between children from the low performing states (Uttar Pradesh, Bihar, Rajasthan, Madhya Pradesh and Jharkhand) and those from the states with better child nutrition indicators (Tamil Nadu, Kerala, Himachal Pradesh, Maharashtra and Tripura) calls for an assessment of the policies the latter set of states have followed to improve the status of child nutrition. Responsive and efficient governance, both at state and local levels, and involvement of local communities in improving the nutrition status of their children have both contributed to this heartening development and the right lessons need to be drawn from the initiatives and practices that the successful states have adopted. Efforts by India’s neighbours, Sri Lanka, Bangladesh and Nepal, have also shown encouraging results over the past fifteen years, so much so that these three countries are now performing better than India in certain child growth indices.
That governments need to display the political and administrative will to
devise and implement policies to improve child nutrition has been a refrain of innumerable studies and documents over the years. In that context, it is heartening to note the special attention being given by the Government of India and various state governments to the vexing problem of child malnutrition over the past decade or so. Health and nutrition surveys carried out in recent years by the Government of India (RSOC and NFHS-4) have provided sorely needed data right down to district level to enable a fix on the exact geographical locations of the problem. More significantly, the long-awaited setting up of the NNM and the initiatives taken by the NITI Aayog to foster inter-departmental coordination among ministries of the Government of India charged with the implementation of nutrition-specific and nutrition-sensitive programmes and policies as also to catalyse action by state governments in selected districts in the country with the highest incidence of child malnutrition and mortality, have led to much needed attention being focused on this immense human problem.
At the same time, much needs to be done if reversion to a “business as usual”
approach is not to occur. Central to any approach to tackling child malnutrition has to be a recognition of its inter-generational nature: the seeds of future malnutrition lie in today’s girls and young mothers. Policies and programmes must tackle the major issues of poor nutrition status of adolescent girls and mothers, especially anaemia and low body weights and heights, linked to their subordinate status in families and in society. The focus on the “first thousand days of life” must promote close convergence between the ICDS and health sectors, especially at the sub-district levels. Safe pregnancies and deliveries, effective new-born care, full immunisation and good infant and young child feeding practices are a sine qua non for improving child nutrition. Along with this, state policies to reduce open defecation, provide safe drinking water and improve income earning opportunities will go a long way in promoting the healthy development of children.
3 | 49
Given the ambitious targets that the NNM has set districts, caution needs to be exercised in pushing programmes at the district and sub-district levels. At each stage, it is necessary to monitor performance through independent third-party evaluations and through periodic surveys on the lines of the NFHS. Reducing malnutrition is a marathon rather than a short sprint exercise and mid-course corrections will be essential to achieve the desired objectives. Experience indicates that, after the initial enthusiasm, there is a tendency to fall back into a routine programme mode without insisting on accountability and monitoring measurable outcomes. The challenge in India is greater, given the differing political complexions of governments in different states and the differing governance cultures in different regions of the country. But there is no doubt that India stands at a cusp today: what is done to reduce child malnutrition in the coming few years will shape the health trajectory of India’s future population and determine its economic potential and social development. This paper is dedicated to the glorious vision of an almost malnutrition-free India.
4 | 49
Section I: Child malnutrition: Causes, Manifestations and Impacts
The conceptual framework on the causes of child malnutrition was developed in 1990 as part of the UNICEF Nutrition Strategy and refined by other researchers. As Smith and Haddad state in their 2000 IFPRI study2:
“The framework is comprehensive, incorporating both biological and socioeconomic causes, and encompasses causes at both micro and macro levels. It breaks the determinants of child nutritional status into three levels of causality: immediate determinants (the most proximate level), underlying determinants, and basic determinants (the deepest level).” The immediate determinants are individual related and depend on the dietary intake (of proteins, calories, fat and micronutrients) and health status. Inadequate dietary intake renders a child more susceptible to disease, which, in turn, depresses appetite and drains the energy resources of the child.
The immediate determinants are, in turn, influenced by three underlying determinants operating at the household level: food security, adequate care for mothers and children and a proper health environment, including access to health services. Access to food is contingent on access to means of production, income-earning livelihood and/or transfers in cash or kind (as in provision of social security or humanitarian relief). Nurture and care refers to the time, attention and support given to meet the physical, mental and social needs of the child and other members of the family, especially the mother. These are critically influenced by the caregiver’s control over resources, her status in the household and her knowledge and beliefs.
Safe water, sanitation, health care and environmental safety, including
shelter, are the main components of a healthy environment. All three underlying determinants are crucially affected by poverty, which denies a community, family and/or person the basic right to a life of dignity. At the root of malnutrition (and poverty) are the basic determinants – the resources at the command of a country or a community and the political, economic, social, cultural and technological factors that determine the effective exploitation of these resources to meet the basic needs of the population.
Malnutrition, therefore, needs to be approached from a life-cycle
perspective. The vicious cycle starts with an underweight expectant mother, often burdened with pregnancy in her teens, inadequate spacing between successive issues, excessive work and lack of appropriate nutrition and health care. A low birth weight baby who is exposed to poor health, hygiene and nutrition practices develops into an underweight and stunted adolescent. The new cycle of early
2 Smith Lisa C., Haddad Lawrence. 2000
5 | 49
marriage and pregnancy condemns yet another generation to this vicious cycle of malnutrition.
Poor nutrition outcomes in a population often begin in utero. The mother’s
height (a consequence of her poor nutritional status during childhood), her nutritional status in the pre-pregnancy phase, coupled with micronutrient deficiencies and inadequate weight gain during pregnancy, all contribute to IUGR. A commonly used proxy measure for IUGR is SGA, defined as a child born with a weight below the tenth percentile for the gestational age. This measure is more specific than LBW since it includes children born early or born small. The literature recognises two types of SGA infants, those who are ‘proportionally small’ (stunted) and those who are ‘disproportionately thin’ (wasted). Both LBW and SGA infants are at considerable risk in respect of their future health and development.
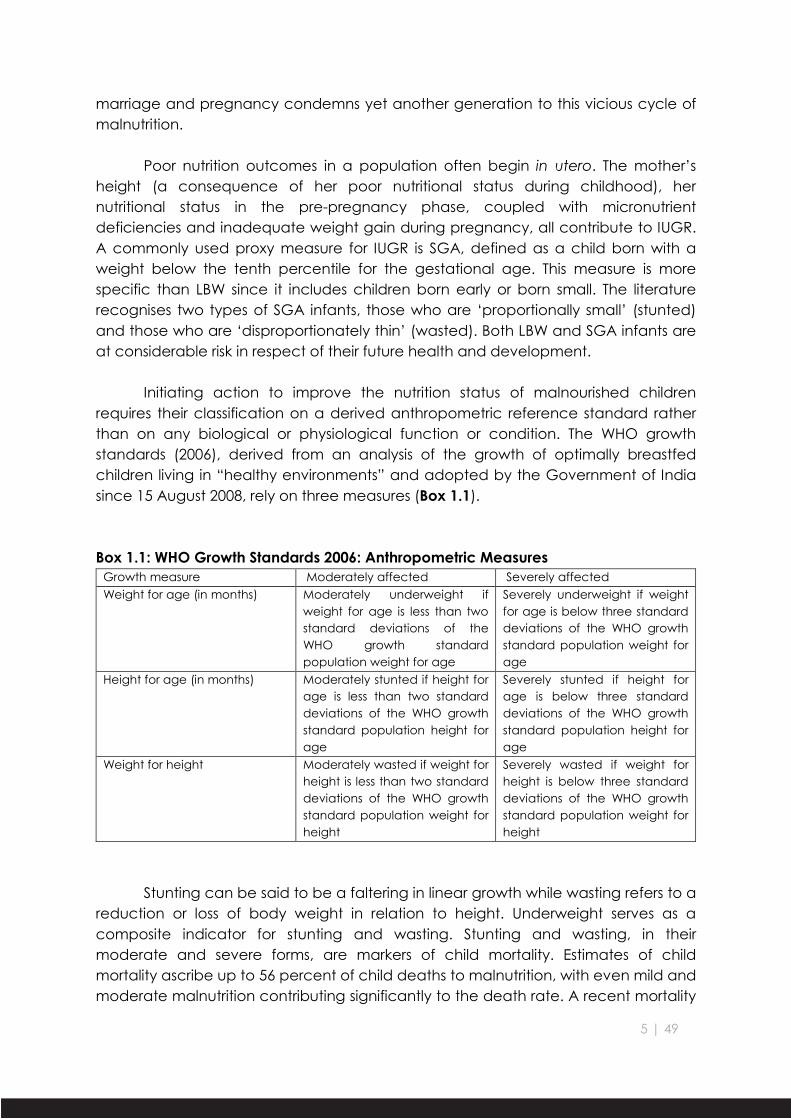
Initiating action to improve the nutrition status of malnourished children
requires their classification on a derived anthropometric reference standard rather than on any biological or physiological function or condition. The WHO growth standards (2006), derived from an analysis of the growth of optimally breastfed children living in “healthy environments” and adopted by the Government of India since 15 August 2008, rely on three measures (Box 1.1).
Box 1.1: WHO Growth Standards 2006: Anthropometric Measures Growth measure Moderately affected Severely affected Weight for age (in months) Moderately underweight if
weight for age is less than two standard deviations of the WHO growth standard population weight for age
Severely underweight if weight for age is below three standard deviations of the WHO growth standard population weight for age
Height for age (in months) Moderately stunted if height for age is less than two standard deviations of the WHO growth standard population height for age
Severely stunted if height for age is below three standard deviations of the WHO growth standard population height for age
Weight for height Moderately wasted if weight for height is less than two standard deviations of the WHO growth standard population weight for height
Severely wasted if weight for height is below three standard deviations of the WHO growth standard population weight for height
Stunting can be said to be a faltering in linear growth while wasting refers to a
reduction or loss of body weight in relation to height. Underweight serves as a composite indicator for stunting and wasting. Stunting and wasting, in their moderate and severe forms, are markers of child mortality. Estimates of child mortality ascribe up to 56 percent of child deaths to malnutrition, with even mild and moderate malnutrition contributing significantly to the death rate. A recent mortality
6 | 49
analysis3, using a pooled analysis of 10 prospective studies from Asia, Africa and Latin America of over 53,000 children, estimated that severely wasted and moderately wasted children were 11.6 and 3.4 times respectively more likely to die than children between the median and one standard deviation below the WHO growth standard. Severely and moderately stunted children were 5.5 and 2.3 times respectively more likely to die than children between the median and one standard deviation below the WHO growth standard.
The reduction of child malnutrition, therefore, has both a vital human element
as well as the benefits of decreased costs to the family and the economy, of reduced morbidity and mortality, combined with the productivity gains from a better nourished population. Higher infant mortality rates are associated with SGA and LBW. Poor nutrition in pre-school children in addition to the effects of LBW is a significant contributor to child mortality. SGA/LBW children, where born in hospitals, often spend more time in such hospitals and are at greater risk for subsequent hospitalization as well as using outpatient facilities more than children with normal birthweights. Immunity in children is severely compromised by protein-energy and micronutrient deficiencies, leading to greater incidence of diarrheal and pneumonia episodes. Poor sanitation and the absence of deworming routines for young children lead to enteric diseases, further weakening the capacity to absorb nutrition. Increased morbidity increases healthcare costs for neonates and infants, apart from the cost of lost employment for their caregivers.
There is considerable literature on the links between nutrition and productivity.
Severe malnutrition in early childhood and micronutrient deficiencies, particularly of iodine and iron, lead to impaired cognitive development. Lower adult height, at least partly due to nutritional deficits during childhood, has been associated with reduced earnings as an adult. While it is difficult to empirically relate income generation to low energy levels in workers because of undernutrition, micronutrient deficiencies can have an impact on productivity. Vitamin A deficiency can result in blindness with obvious productivity implications. Anemia prevalence is also shown to be associated with reduced productivity levels. The implications of poor childhood nutrition for impaired cognitive development, reduced or incomplete schooling and consequent reduced access to employment opportunities affects both the individual (in terms of poor earning capacity) and society (in terms of low per capita productivity leading to poor economic growth).
The role of early childhood undernutrition in the incidence of non-
communicable diseases later in life presents certain difficulties in estimation. Studies that track LBW infants into their adult years4 do indicate a link between chronic disease and early malnutrition and point to the increased likelihood of coronary 3 Olofin, I., C.M. McDonald, M. Ezzati, S. Flaxman, R.E. Black, W.W. Fawzi, L.E. Caulfield, G. Danaei and N.I.M.S.a.c. pooling (2013) 4 Barker, D J P (1998)
7 | 49
heart disease, non-insulin dependent diabetes, high blood pressure, obstructive lung disease, high blood cholesterol and renal damage. Of course, given the longer time frame of the occurrence (and the costs associated with it), the impact of early childhood undernutrition may be somewhat smaller in terms of impact on net future benefits. There is also the issue of the different types of diseases that could arise because of child malnutrition, including LBW, and the difficulties in assigning costs to these diseases. Assumptions made regarding the costs associated with lower productivity and increased medical care and the probability of experiencing these chronic diseases enable an assessment of the costs associated with malnutrition. Cross-generational effects of LBW (and child malnutrition) impact children born to women who are themselves malnourished. The economic costs of coping with the healthcare of the malnourished child arise even before the impact of malnutrition is felt on the earlier generation in terms of the reduced earnings arising from lower productivity of older adults and costs of attending to chronic illnesses.
Assessing the economic consequences of fetal and child malnutrition is an exercise fraught with daunting challenges. Economic estimations include only market-based activities and do not consider non-market losses, even though these have an impact on productivity. Assumptions have to be made about the degree to which particular macro- and micro-nutrient deficiencies are present in men and women and their average levels of participation in market economic activity and heavy labour. Conservative estimates of the costs of malnutrition5 (based on lost productivity) could exceed 2 to 3 percent of GDP in South Asian countries. Calculations for adult productivity from Administrative Staff College (1998) and AERC (1998) studies show that stunting accounts for 1.4 percent, iodine deficiency for 0.3 percent and iron deficiency for 1.25 percent of loss in GDP in India, making a total of almost 3 percent GDP lost. The losses including childhood cognitive impairment associated with iron deficiency account for almost 1 percent of GDP in India, when cognitive and manual work are both factored in. At an estimated GDP of 13 million crores for 2017-18, this loss would translate to about 4 lakh crores annually.
5 Horton, Susan (1999)
8 | 49
Section II: What the numbers tell: India, its states and the world
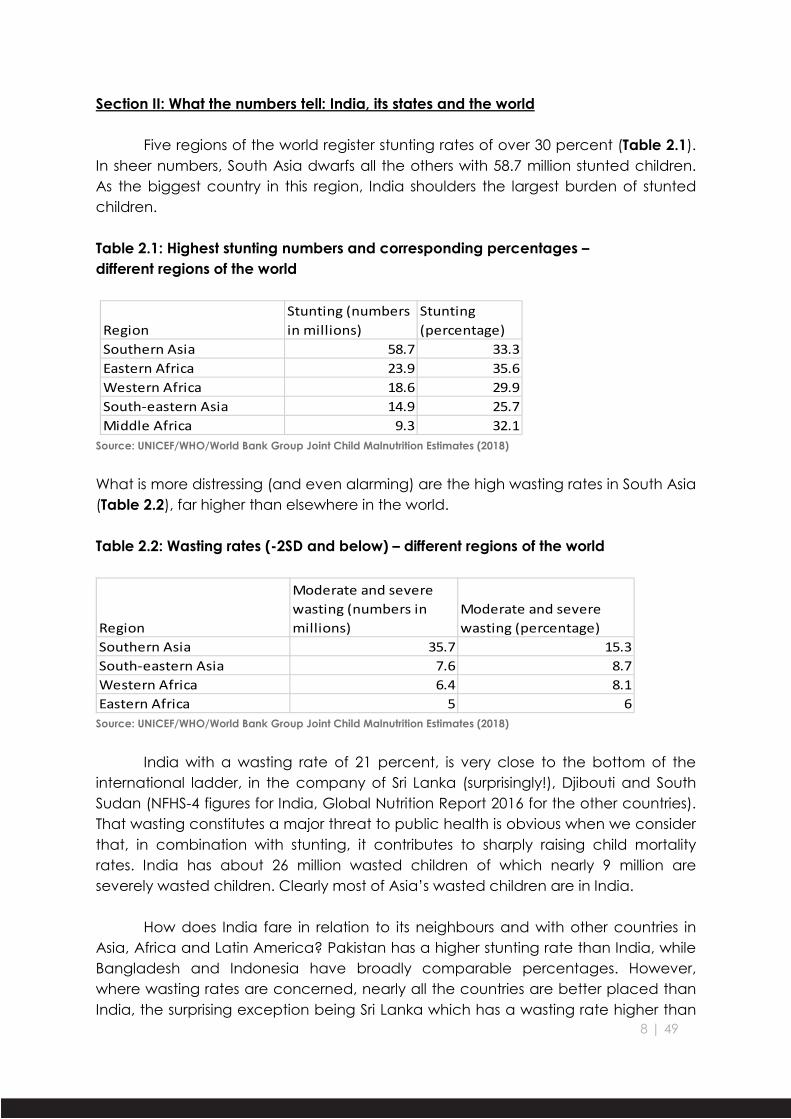
Five regions of the world register stunting rates of over 30 percent (Table 2.1). In sheer numbers, South Asia dwarfs all the others with 58.7 million stunted children. As the biggest country in this region, India shoulders the largest burden of stunted children. Table 2.1: Highest stunting numbers and corresponding percentages – different regions of the world
RegionStunting (numbers in millions)
Stunting (percentage)
Southern Asia 58.7 33.3Eastern Africa 23.9 35.6Western Africa 18.6 29.9South-eastern Asia 14.9 25.7Middle Africa 9.3 32.1
Source: UNICEF/WHO/World Bank Group Joint Child Malnutrition Estimates (2018)
What is more distressing (and even alarming) are the high wasting rates in South Asia (Table 2.2), far higher than elsewhere in the world. Table 2.2: Wasting rates (-2SD and below) – different regions of the world
Region
Moderate and severe wasting (numbers in millions)
Moderate and severe wasting (percentage)
Southern Asia 35.7 15.3South-eastern Asia 7.6 8.7Western Africa 6.4 8.1Eastern Africa 5 6
Source: UNICEF/WHO/World Bank Group Joint Child Malnutrition Estimates (2018)
India with a wasting rate of 21 percent, is very close to the bottom of the
international ladder, in the company of Sri Lanka (surprisingly!), Djibouti and South Sudan (NFHS-4 figures for India, Global Nutrition Report 2016 for the other countries). That wasting constitutes a major threat to public health is obvious when we consider that, in combination with stunting, it contributes to sharply raising child mortality rates. India has about 26 million wasted children of which nearly 9 million are severely wasted children. Clearly most of Asia’s wasted children are in India.
How does India fare in relation to its neighbours and with other countries in
Asia, Africa and Latin America? Pakistan has a higher stunting rate than India, while Bangladesh and Indonesia have broadly comparable percentages. However, where wasting rates are concerned, nearly all the countries are better placed than India, the surprising exception being Sri Lanka which has a wasting rate higher than
9 | 49
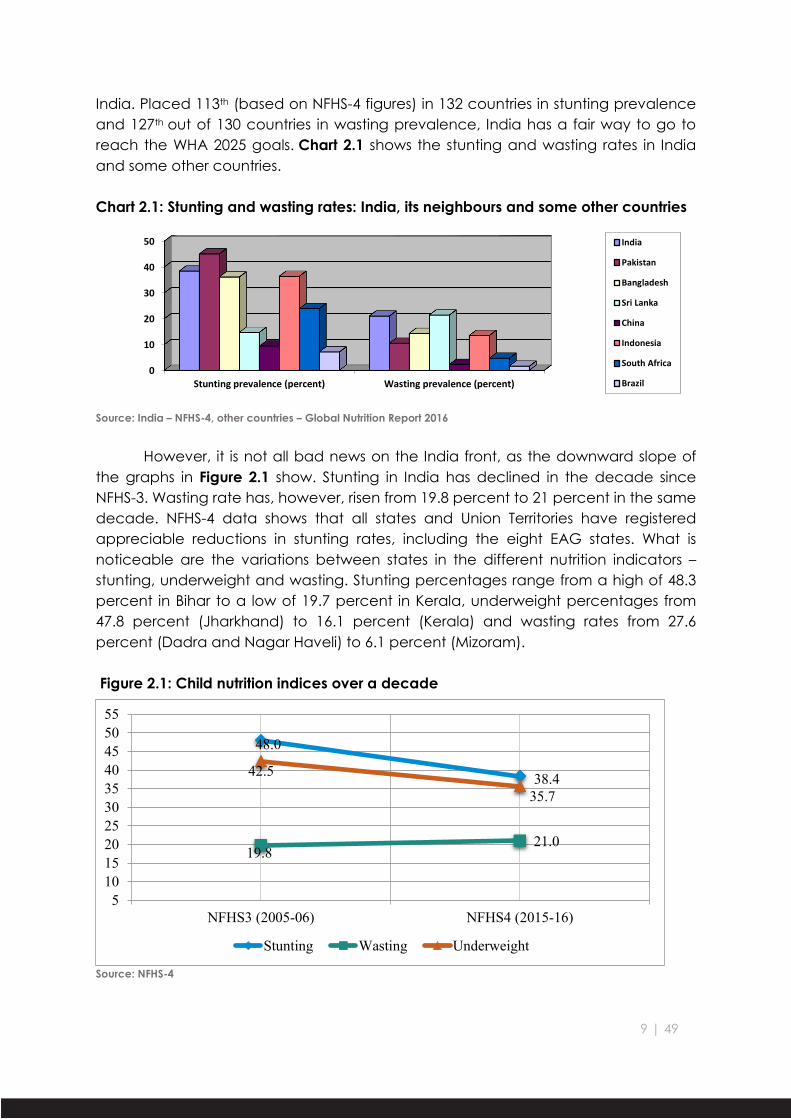
India. Placed 113th (based on NFHS-4 figures) in 132 countries in stunting prevalence and 127th out of 130 countries in wasting prevalence, India has a fair way to go to reach the WHA 2025 goals. Chart 2.1 shows the stunting and wasting rates in India and some other countries.
Chart 2.1: Stunting and wasting rates: India, its neighbours and some other countries
Source: India – NFHS-4, other countries – Global Nutrition Report 2016
However, it is not all bad news on the India front, as the downward slope of
the graphs in Figure 2.1 show. Stunting in India has declined in the decade since NFHS-3. Wasting rate has, however, risen from 19.8 percent to 21 percent in the same decade. NFHS-4 data shows that all states and Union Territories have registered appreciable reductions in stunting rates, including the eight EAG states. What is noticeable are the variations between states in the different nutrition indicators – stunting, underweight and wasting. Stunting percentages range from a high of 48.3 percent in Bihar to a low of 19.7 percent in Kerala, underweight percentages from 47.8 percent (Jharkhand) to 16.1 percent (Kerala) and wasting rates from 27.6 percent (Dadra and Nagar Haveli) to 6.1 percent (Mizoram).
Figure 2.2: Stunting rate variations between states
Source: NFHS-4
Figure 2.3: Wasting rate variations between states
Source: NFHS-4
The interesting contrast comes when the stunting and wasting rates in
different states are compared (Figures 2.2 and 2.3). States with high stunting rates often display lower wasting rates; unexpectedly, states faring well in stunting rates show very high wasting rates, including fairly high severe wasting rates. Figures 2.3
11 | 49
highlights the wasting position in different states. While conventional wisdom would expect states like Madhya Pradesh, Jharkhand and Chhattisgarh to have high wasting rates, it comes as a rude surprise to see states like Karnataka, Gujarat and Maharashtra figuring in the list of high wasting states.
While there are no specific studies as yet which analyse why states with
relatively lower stunting rates should show a higher incidence of wasting (both moderate and severe) than states with high stunting rates, one possible reason could be that since wasting is based on weight in relation to length/height, states/districts which registered slower declines in stunting rates relative to underweight rates in the NFHS-4 (as compared to NFHS-3) would show lesser wasting rates as compared to states where stunting rates have fallen significantly in relation to underweight rates. A comparison of some of these states, as shown in Table 2.3, is instructive in this regard. States like Bihar and Madhya Pradesh showed significant decline in wasting rates over the decade because of a sharp decline in underweight rates relative to the decline in stunting rates.
Table 2.3: U5 child nutrition status and mortality rate (2005-06 to 2015-16)
The same is observed in the case of states like Himachal Pradesh and Tripura as well. However, Maharashtra and Karnataka have registered major increases in wasting rates in the same period even though their under-5 child mortality rates are far lower than Bihar and Madhya Pradesh. This seems to indicate that while the reach and quality of health services may be far better in Maharashtra and Karnataka, there is need to look into the causes for the very slow decline in underweight rates in these states.
Child nutrition and health indicators also vary across three other strata –
gender, social background and rural-urban residence. While there is some difference in U5MR as between males and females, 51.5 versus 47.8 deaths per 1000 live births, it is significant that U5MR in rural areas at 55.8 far outstrips the urban rate of 34.4, a pointer to the lower standards of health care in rural India. Again, the
12 | 49
incidence of child mortality is far higher for socially disadvantaged groups like the Scheduled Castes and Scheduled Tribes as compared to the general population. Table 2.4 shows a similar trend as far as these variables are concerned in respect of nutrition indicators for U5 children. There is little variation in the stunting, wasting and underweight rates (less than -2SD) amongst males and females, but substantial differences emerge in the stunting and wasting rates for the SC/ST population as compared to the general population and between rural and urban rates. In what we may possibly term as “the Indian Enigma”, wasting rates are more or less constant across gender, social groups and the rural-urban divide.
Table 2.4: Variations in U5 child nutrition status – gender, social group, rural-urban
Variations in nutrition indicators are equally pronounced when one looks at variations between districts of a particular state and even between urban and rural differentials in a state. Odisha has a stunting rate of 34.1 percent. However, in this state, two districts, Cuttack and Puri, have stunting rates of 15.3 percent and 16.1 percent respectively. In Karnataka, Mandya district has a stunting rate of 18.6 percent as compared to Koppal district with a stunting percentage of 55.8 percent. Barddhaman district in West Bengal shows a stunting prevalence in urban areas of 19.3 percent as opposed to 42.7 percent in rural areas.
Table 2.5: Growth patterns of the Indian child: 6-59 months
Background characteristic Percentage below -2SD
Age in months Height/length for age Weight for height Weight for age
<6 20.1 31.9 26.7
6-8 20.2 28 26.7
9-11 25.9 27.3 31
12-17 38.2 23.7 32.8
18-23 46.9 20.4 37.3
24-35 42.7 19.1 37.6
36-47 43.2 17.8 38.2
48-59 40 17.7 39.1 Source: NFHS-4 India Report
13 | 49
Table 2.5 reveals a peaking of -2SD stunting at 46.9 percent at 18-23 months and of -2SD wasting at 28 percent at 6-8 months. This has important implications for policy interventions, especially in terms of the failures in complementary feeding strategies and practices, both at the government and community/family levels.
The last, and probably the most important instance of variation between
different areas, relates to the variations between ICDS projects within a district. While NFHS-4 data at the sub-district level is not available, the ICDS MPRs of two states, Maharashtra and Karnataka, reveal that there are huge differences in underweight rates of under-5 children within a district. Nashik district has two ICDS projects, Harsul and Tryambakeshwar, located in the western tribal hilly regions of the district, with underweight rates of 25.08 percent and 21.02 percent respectively (Maharashtra ICDS MPR March 2017). In contrast, Sinnar and Niphad ICDS projects, in the prosperous irrigated eastern regions of the district, have underweight percentages of 4.31 percent and 4.92 percent respectively. Gulbarga (Rural) and Chincholi ICDS projects in Gulbarga district of Karnataka have underweight rates of 9.90 percent and 11.47 percent respectively while two other ICDS projects in the district, Chitapur and Sedam, have underweight rates of 46.66 percent and 47.53 percent respectively (Karnataka ICDS MPR October 2016). These figures have significant implications for the directions that public policy needs to take, focusing on a much smaller sub-district area (lesser than even a block) as opposed to a district-level approach.
It is evident that the health and nutrition status of the mother has major
implications for the health and nutrition status of her offspring. NFHS-4 data on women in the 15-49 age group reveals that 11.1 percent were less than 145 centimetres in height and 22.9 percent had a BMI below 18.5. 50.3 percent of pregnant women in the 15-49 age group were anaemic (haemoglobin levels less than 11.0 grams per decilitre). The NFHS-4 data on ANC is equally disquieting. Only 51.2 percent mothers had four ANC visits and full ANC coverage (at least four ANC visits, at least one tetanus toxoid injection and iron folic acid tablets or syrup taken for one hundred or more days) was at an abysmal 21 percent, although the percentage of institutional delivery now touches almost 80 percent. The NFHS-4 figure for India of children receiving a health check within two days of birth is a paltry 24.3 percent. Full immunisation of children in the 12-23 month age group has gone up from 43.5 percent in NFHS-3 to 62 percent in NFHS-4, still a far cry from the goal of universal immunisation. Early and exclusive breastfeeding rates are at 41.6 percent and 54.9 percent and only 9.6 percent of children between 6 and 23 months receive an adequate diet. What the figures clearly reveal is the need to stress interventions in the critical “first thousand days” of life, from conception till the child reaches two years of age.
14 | 49
SDGs, NNM and the focus on numbers
At the 65th World Health Assembly (WHA) in 2012, a comprehensive
implementation plan on maternal, infant and young child nutrition was adopted, which specified six global nutrition targets to be reached by all countries by 2025:
(i) A 40 percent reduction in the number of under-5 children who are
stunted; (ii) A 50 percent reduction in anaemia in women of reproductive age; (iii) A 30 percent reduction in the number of LBW children; (iv) No increase in childhood overweight; (v) Increase the rate of exclusive breastfeeding in the first six months up to at
least 50 percent; (vi) Reduce and maintain childhood wasting to less than 5 percent.
The SDGs in relation to maternal and child nutrition, adopted by UN member-
nations in 2015, has, apart from setting goals in a number of nutrition-sensitive sectors, specified certain goals that directly impact on maternal and child health and nutrition:
(i) achieving, by 2025, the WHA targets on under-5 stunting and wasting; (ii) bringing the maternal mortality rate (MMR) to less than 70 per 100,000 live
births; (iii) reducing the neonatal mortality rate (NNMR) to at least 12 per 1000 live
births; (iv) reducing the mortality rate of children under 5 years of age (U5MR) to at
least 25 per 1000 live births; and (v) achieving the elimination of open defecation.
In the case of India, based on NFHS-4 figures, the targets to be reached by 2025
would involve: (i) reduction of U5 child stunting rate from 38.4 percent to 23 percent; (ii) reduction in anemia (moderate and severe) in 15-49 age group women
from 13.4 percent to 6.7 percent; (iii) going even by 2006 figures, a reduction in LBW babies from 28 percent to
19.6 percent; (iv) maintaining and, as possible, increasing the rate of exclusive
breastfeeding in the first six months from the present 55 percent; (v) reducing childhood wasting from 21 percent to less than 5 percent.
15 | 49
Not surprisingly, the NNM has set itself ambitious targets to achieve the SDGs. The specific goals in respect of time-bound improvements in the nutrition status of under-6 children and pregnant women/lactating mothers, over a three-year period beginning 2017-18, have been detailed as below: Table 2.6: National Nutrition Mission: Programme Targets S.
No. Objective Target
1 Prevent and reduce stunting in children (0-6 years) By 6% (@ 2% p.a.) 2 Prevent and reduce undernutrition (underweight prevalence) in
children (0-6 years) By 6% (@ 2% p.a.)
3 Reduce the prevalence of anaemia among young children (6-59 months)
By 9% (@ 3% p.a.)
4 Reduce the prevalence of anaemia among women and adolescent girls in the age group of 15-49 years
By 9% (@ 3% p.a.)
5 Reduce Low Birth Weight (LBW) By 6% (@ 2% p.a.) Source: Ministry of Women and Child Development, Government of India. National Nutrition Mission: Administrative Guidelines
16 | 49
Section III: What has been, and is being, done for the child
In part fulfilment of the obligations cast on it by Article 39(f) of the Constitution of India, the Government of India has, following the adoption of the National Policy for Children (1974), set up, in 1975, the ICDS, one of the largest programmes in the world tasked with providing comprehensive services to meet the health, nutrition and development needs of children under 6, pregnant and lactating mothers and adolescent girls. Box 3.1 lists the salient features of the ICDS.
Box 3.1: Basic ICDS Services
Source: Focus on Children Under Six (FOCUS) (Abridged Report), 2006 (as slightly adapted)
Box 3.2 illustrates how nutrition-specific interventions and programmes are distinguished from nutrition-sensitive ones. While nutrition-specific interventions in India largely come through the ICDS and through convergent action between the nutrition and health sectors, nutrition-sensitive interventions require coordination with other sectors of the economy, including agriculture, food distribution systems, health, sanitation and livelihood programmes.
The ICDS programme seeks to provide a package of “integrated services” focused on children under six. The main services are as follows: A. Nutrition 1. Supplementary Nutrition (SNP): The nutrition component varies from state to state but usually consists of a hot meal cooked at the AWC, based on a mix of pulses, cereals, oil, vegetable, sugar, iodised salt, etc. THR are provided for children under the age of three years and for pregnant/nursing mothers. 2. Growth Monitoring and Promotion: Children under three are weighed once a month, to keep a check on their health and nutrition status. Growth charts are kept to detect growth faltering. 3. Nutrition and Health Education (NHE): The aim of NHE is to help women aged 15-45 years to look after their own health and nutrition needs, as well as those of their children and families. NHE is imparted through counselling sessions. It covers issues such as infant feeding, family planning, sanitation, utilization of health services, etc. B. Health 4. Immunization: Children under six are immunized against polio, DPT (diphtheria, pertussis, tetanus), measles, and tuberculosis, while pregnant women are immunized against tetanus. This is a joint responsibility of ICDS and the Health Department. The main role of the AWW is to assist health staff (such as the ANM) to maintain records, motivate the parents, and organize immunization sessions. 5. Health Services: A range of health services are supposed to be provided through the AWW including health checkups of children under six, ANC of expectant mothers, postnatal care of nursing mothers, recording of weight, management of undernutrition, and treatment of minor ailments. 6. Referral Services: This service attempts to link sick or undernourished children, those with disabilities and other children requiring medical attention with the public health care system. Cases like these are referred by the AWW to the medical officers of the PHCs. C. Pre-School Education 7. Pre-School Education (PSE): The aim of PSE is to provide a learning environment to children aged 3-6 years, and early care and stimulation for children under the age of three. PSE is imparted through the medium of “play” to promote the social, emotional, cognitive, physical and aesthetic development of the child as well as to prepare him or her for primary schooling.
17 | 49
Box 3.2: Nutrition-sensitive and Nutrition-specific Programmes -- the distinction
Source: 2013 Lancet Series: Maternal and Child Nutrition 3: Ruel, et al
I. Nutrition-specific 1) Universalisation of ICDS: At the start of the fifth decade of its existence, thanks to repeated directions of the Supreme Court of India, the reach of the ICDS extended (as of December 2015) to 13.42 lakh AWCs covering about 84 million of the 164.5 million under-6 children in India6. The entire range of ICDS services at the anganwadi level (for somewhere between 25 and 100 children) are provided by one AWW assisted by one AWH. The AWW works under the supervision of the Anganwadi Supervisor (or Mukhya Sevika), with the CDPO as the controlling officer at the Panchayat Samiti (block) level. The AWW plays a dual role – as a service delivery provider and as a counselor to the mother, in particular, and the women in the village, in general.
However, merely making an administrative allocation of an AWC to a particular habitation is no guarantee that services will be provided to children, mothers and girls. ICDS staff attitudes, especially at the supervisory levels, towards the community and family and the feeling that the poor are themselves responsible for their children’s malnutrition7 sometimes militate against an empathetic approach to tackling the problem. An even more critical issue is the vacancies in posts at all levels. As of 30 September 2015, over 8 percent of AWW posts and nearly 36 percent of supervisor posts were vacant, as per information given by the government to the Lok Sabha. The report on Progress of Children Under Six: Revisiting ICDS in the 6 NITI AAYOG, Programme Evaluation Organisation (June 2015): A Quick Evaluation Study of Anganwadis Under ICDS 7 Garg, Samir, Economic & Political Weekly, August 26, 2006: Chhattisgarh – Grassroot Mobilisation for Children’s Nutrition Rights
Definition of nutrition-specific and nutrition-sensitive interventions and programmes Nutrition-specific interventions and programmes
Interventions or programmes that address the immediate determinants of fetal and child nutrition and development – adequate food and nutrient intake, feeding, caregiving and parenting practices and low burden of infectious diseases
Examples: adolescent, preconception and maternal health and nutrition; maternal dietary or micronutrient supplementation; promotion of optimum breastfeeding; complementary feeding and responsive feeding practices and stimulation; dietary supplementation; diversification and micronutrient supplementation or fortification for children; treatment of severe acute malnutrition; disease prevention and management; nutrition in emergencies Nutrition-sensitive interventions and programmes
Interventions or programmes that address the underlying determinants of fetal and child nutrition and development – food security; adequate caregiving resources at the maternal, household and community levels; and access to health services and a safe and hygienic environment – and incorporate specific nutrition goals and actions
Nutrition-sensitive programmes can serve as delivery platforms for nutrition-specific interventions, potentially increasing their scale, coverage and effectiveness
Examples: agriculture and food security; social safety nets; early child development; maternal mental health; women’s empowerment; child protection; schooling; water, sanitation and hygiene; health and family planning services
18 | 49
FOCUS Districts (POCUS Report, September 2016) has confirmed a similar situation in respect of vacancies at supervisory levels in the ICDS. Data for 2014 accessed from the website of the Ministry of Women & Child Development shows 31 percent of vacancies in CDPO posts and 30 percent of supervisor posts remaining unfilled.
Notwithstanding ground realities, things have substantially improved in the
decade between the FOCUS and POCUS reports (2006 and 2016), which have analysed the performance of ICDS in three ‘active’ FOCUS states – Himachal Pradesh, Maharashtra and Tamil Nadu – and three ‘dormant’ FOCUS states – Chhattisgarh, Rajasthan and Uttar Pradesh. Children and women availing of SNP, pre-school attendance at AWCs, immunization and weighing of children have all registered substantial increases during the decade.
% children aged 6-35 months availing SNP 24 49 NA 54 NA 37 % children aged 36-71 months availing SNP 28 44 NA 49 NA 31 % currently pregnant women availing SNP 21 41 21 44 15 30 % currently lactating mothers availing SNP 17 42 17 47 12 29 % children aged 3-6 years attending pre-
school at AWC 23 38 24 45 18 22
% children immunised at AWC 20 49 21 60 14 26 % children weighed at least once in the
last 3 months preceding survey 4 64 4 63 3 67
Sources: Ministry of Women and Child Development & UNICEF (2015), Rapid Survey on Children (RSoC) 2013-14; National Report, New Delhi: Ministry of Women and Child Development; Ministry of Health and Family Welfare (2005), National Family Health Survey-3
Source: Progress of Children Under Six: Revisiting ICDS in the FOCUS Districts (2016)
In-service training of AWWs has registered an improvement over the years. However, there are still areas where AWWs feel they need greater exposure – child care practices, growth monitoring, immunisation, hygiene and sanitation and counselling on feeding. At the same time, physical infrastructure has shown improvement, with many more AWCs having their own buildings, kitchens and toilet facilities and many states providing the AWCs with gas stoves and other kitchen equipment to cook wholesome meals.
2) Supplementary nutrition programme (SNP): The experience with regard to SNP has been mixed across states. Cooked meals for children in the 3-6 age group are popular in states like Tamil Nadu, Telangana, Andhra Pradesh and Karnataka. The POCUS Report has observed that Tamil Nadu and Maharashtra are two states where there is variety in the hot meal served. While regularity of food supply, its perceived quantity and quality has improved across all FOCUS states, the issue of THR is still controversial in many states. The Supreme Court of India, in its order of 7 October 2004, directed that “The contractors shall not be used for supply of nutrition in Anganwadis and preferably ICDS funds shall be spent by making use of village
19 | 49
communities, self-help groups and Mahila Mandals for buying of grains and preparation of meals.” However, loopholes have been exploited by different state governments to award THR contracts to private contractors. A heartening contrast to the prevailing practice in many states is provided by Chhattisgarh where, in line with the Supreme Court orders, contractors were replaced by women’s self-help groups for providing the ready to eat supplementary food. An interesting observation is that when the THR is of poor quality, no one eats it; when the THR quality improves, the family shares it, reducing the amount available to the under-3 child it is meant for. 3) Growth monitoring: Excessive attention being given to the SNP has meant lesser focus on other services provided under the ICDS. One of the more neglected aspects has been that of growth monitoring as a systematic activity. Children are to be weighed once a month and their weights are to be recorded on growth charts by the AWW. Severely underweight children are to receive double rations and be referred to the nearest medical facility for attending to their malnourished status. In practice, monthly weighing is often not carried out systematically and the results are not entered in the growth chart provided to the AWW for tracking the growth path of the child. The POCUS Report indicates that 80 percent of mothers in ‘active’ FOCUS states and 63 percent of mothers in ‘dormant’ FOCUS states reported that their child was weighed every month or so. Even if this statistic is taken at face value, how this data (if recorded) is used is more important. The POCUS Report mentions that AWWs in some of the states are not able to plot weights on the chart. It is not surprising then that only 42 percent mothers in ‘active’ states and a staggeringly low 9 percent in the ‘dormant’ states had any sort of discussion on the growth status of their child at the time of the last weighing. Nor were there supervisory checks on the weights recorded; barely 30 percent of the CDPOs checked the growth charts, that too mainly in the states of Maharashtra and Tamil Nadu. 4) Referral services for treating severe acute malnutrition: With the adoption of the WHO Growth Standards, recording the height/length of the child is an additional anthropometric measure which, in conjunction with the weight of the child, enables the identification of children suffering from severe acute malnutrition (SAM), also known as severe wasting. An alternative measure, the mid upper arm circumference (MUAC) can also be used to assess SAM. The AWW is expected to refer all severely underweight children, with weights below three standard deviations of the normal growth standard, to the nearest medical facility for assessment and further treatment. These children are then to be treated under the WHO protocol and followed up on discharge from the medical facility to ensure there is no relapse in their nutrition status. The first such steps to tackle malnutrition in severely underweight children were taken under the Bal Shakti Yojana in Madhya Pradesh 2005. Taking a leaf from the Madhya Pradesh scheme, the Rajmata Jijau Mission (the Maharashtra State Nutrition Mission) implemented the programme for improving the nutrition
20 | 49
status of severely underweight children from 2008 onwards through its Child Development Centres and Village Child Development Centres8, the latter using the WHO Growth Standards. A study of the facility-based management of severe acute malnutrition in Madhya Pradesh9 has attributed the limited success (marked by poor cure rates and high rates of non-response from treated children) of the efforts to the high prevalence of chronic malnutrition (stunting), particularly in nutrition rehabilitation centres located in peripheral areas. The study has also found that, especially in populations served by peripheral NRCs, the criteria used for SAM admission lead to little weight gain in the two or three weeks of hospital stay, reducing credibility of the programme in the minds of parents/caregivers. In areas (such as southern Madhya Pradesh) where poverty is high, chronic malnutrition would be accompanied by a high incidence of severe acute malnutrition. Failure to address the fundamental issues causing the former would see recurrence of the latter, putting strains on the resources of the government to handle SAM. It has also been observed in Madhya Pradesh and other states that SAM treatment is often seen as a one-off treatment of a “disease”, without recognition of the recurring nature of this phenomenon in children. 5) Maternal entitlements: Given the critical role that the mother’s health and physical condition plays in fetal growth and the nutritional status of the child, attempts at maternity support have been made since 1987, starting with the Dr. Muthulakshmi Reddy Childbirth Assistance Scheme in Tamil Nadu. With some other states introducing similar schemes in the following years, the Central Government stepped in with the National Maternity Benefit Scheme (NMBS) in 1995-96, offering a one-time payment of Rs. 500 eight to twelve weeks prior to delivery. The NMBS was subsumed into the Janani Suraksha Yojana in 2005, which made payment to the mother contingent on institutional delivery. The version of the Dr. Muthulakshmi Maternity Assistance Scheme introduced by the Tamil Nadu Government in 2006 provided Rs. 6000 in two instalments and could be said to be the inspiration for the provision of maternity benefit of not less than Rs. 6000 to the pregnant woman and lactating mother in the National Food Security Act (NFSA), 2013. The Act also entitles the pregnant woman/lactating mother to free meals during pregnancy and for six months after childbirth through the local AWC. However, the Pradhan Mantri Matru Vandana Yojana implemented from 1 January 2017 has diluted the provisions of the NFSA and provides only Rs. 5000 to the mother, that too only for one living child. Tamil Nadu, Andhra Pradesh and Telangana have been providing hot cooked meals to pregnant women and lactating mothers, joined now by Karnataka, which launched the Mathru Poorna maternal nutrition scheme from 2 October 2017.
8 https://vramani.files.wordpress.com/2018/04/the-maharashtra-nutrition-mission-story_2005-101.pdf: V. Ramani – The Maharashtra State Nutrition Mission: Learning By Doing, pp. 25-36 9 Dasgupta Rajib, Shalini Ahuja and Veda Yumnam. Indian Pediatrics 2014;51;95-99: Can Nutrition Rehabilitation Centers Address Severe Malnutrition in India?
21 | 49
II. Nutrition-sensitive 1) Food security: Broadbasing the access of the population to food entitlements, the NFSA has provided for guaranteed allocation of five kilograms of foodgrains per person to priority households and thirty five kilograms of foodgrains to households covered under the Antyodaya Anna Yojana. States like Chhattisgarh have significantly improved the access of the population to foodgrains through measures which include the running of fair price shops by local bodies and community based organisations, decentralised procurement, providing interest-free working capital to fair price shops, digitisation of the supply chain and enhancing transparency through community monitoring. Leakages in the public distribution system are sought to be checked through linking Aadhaar cards to ration cards. This has led to problems in states like Jharkhand where glitches in Aadhaar linkages have deprived families of access to foodgrains. Kotwal and Ramaswami10 have referred to the role of exclusion errors and authentication failures in denying the poor access to food. Alternative processes like the (unfortunately aborted) Madhya Pradesh initiative to carry out Aadhaar authentication only once a year and providing barcoded coupons which can be encashed at fair price shops would check exclusion errors and overcome the limitations of technology. 2) Sanitation: Recent studies bring out the relationship between poor hygiene practices, especially the widespread prevalence of open defecation, and the high incidence of stunting in children11 Even without diarrheal episodes, enteric or intestinal infection is likely to have a greater impact on child height than on mortality. India’s high rates of open defecation and high population density contribute jointly to high stunting rates, given that an overwhelming majority of countries with high rates of open defecation also show high stunting rates. The widespread nature of open defecation in India is not because of relative material or educational deprivation but because of norms and beliefs governing purity and pollution, which seriously inhibit the adoption of affordable latrines, which need to be emptied manually. The Swachh Bharat campaign to make India ODF will be successful only if entrenched prejudices and behavioural patterns can be changed: mere toilet construction will in itself not reduce open defecation rates. 3) Women’s empowerment: The Asian Enigma12 has ascribed the major reason for the exceptionally high rates of child malnutrition in South Asia as being “rooted deep in the soil of inequality between men and women.” The traditionally inferior status of women in Indian society reflects on the nutrition status of children, through early marriage and childbearing, inadequate spacing between children and the poor nutrition status of women in the childbearing age group, affecting the quality
10Kotwal Ashok, Bharat Ramaswami, Indian Express, 13 February 2018: Aadhaar that doesn’t exclude 11 Spears, D (2013): “How much International Variation in Child Height Can Sanitation Explain?”, Princeton Research Program in Development Studies Working Paper 12 Ramalingaswami, et al, ibid
22 | 49
of child care, especially in infancy. A recent study13 has studied the lower-ranked status of women married to younger male members in a joint household and concluded that lower-ranking mothers have less body mass than higher-ranking mothers, their children have lower birth weights and are more likely to die in the first month of life. Similar conclusions are drawn by the NFHS-4 in respect of women’s empowerment. Only 31 percent of currently married women are employed, as compared to 98 percent in men. 63 percent of currently married women participate in family decisions (own healthcare, major household purchases, visits to own family members or relatives). While women are experiencing greater freedom at present as compared to a decade ago, social attitudes still militate against greater opportunities for women. School dropout rates are higher for girls than boys. 28 percent of women in the 18-29 age group marry before the age of 18, with rates exceeding 31 percent in nine states. The Mission approach to tackling child malnutrition The National Nutrition Strategy14 enunciated by the NITI Aayog had, in 2017, proposed the activation of the National Nutrition Mission (NNM), a concept that has now borne fruit fifteen years after it was first constituted in 2003. The NNM has been launched by the Prime Minister in Jhunjhunu, Rajasthan on 8 March 2018. The NNM is to be funded jointly by the Government of India and multilateral development banks. Its overarching goal is to bring down stunting rates in India from the NFHS-4 level of 38.4 percent to 25 percent in a five-year span by 2022. The NNM would be implemented in three phases in all districts in the country: 315 in 2017-18, 235 in 2018-19 and the remaining districts in 2019-20. Its activities would cover: (i) Use of technology to monitor service delivery and growth of children on a real-time basis through the Common Application Software (CAS) system; (ii) Growth monitoring of all children (both height and weight) through the software application; (iii) Regular monitoring of all sectoral programmes and providing knowledge management through Resource Centres and Project Monitoring Units at the central and state levels; (iv) Mobilising public support for improving nutrition, including nutrition behaviour change; (v) Enhancing performance capacities of frontline functionaries; (vi) Fostering innovations under convergent nutrition action programmes; (vii) Supporting community-based management of SAM.
13 Coffey Diane, Reetika Khera, Dean Spears (2016) 14 NITI Aayog (2017): Nourishing India, National Nutrition Strategy, Government of India
23 | 49
The NNM would work on promoting convergence with various programmes in other sectors at district and state/Union Territory level, including the National Health Mission, Swachh Bharat Mission, Public Distribution System, Mahatma Gandhi National Rural Employment Guarantee Scheme, etc. An Executive Committee under the Chairpersonship of the Secretary, Ministry of Women & Child Development would oversee the coordination between departments in nutrition-related activities and programmes. A National Council on India’s Nutritional Challenges under the Chairpersonship of the Deputy Chairman, NITI Aayog, would provide policy directions, coordinate between Ministries and review nutrition-related programmes on a quarterly basis.
24 | 49
Section IV: The weak links in the chain
SNP The SNP is the largest component in the ICDS budget, with the union government
sharing the costs 50:50 with the states. As outlined earlier, the SNP for children in the 3-6 years group is supposed to comprise a hot cooked meal. While the content and quality of this meal varies across states, implementation has been good in the southern states of Tamil Nadu, Karnataka, Telangana and Andhra Pradesh and in Maharashtra. The difficulty arises in the case of the THR, which is to be given to mothers and under-3 children. Although SC directions clearly mandate supplies through self-help groups, its orders have been repeatedly flouted by a number of state governments, which have tendered out the work to private contractors. The 2012 reports of the Commissioners of the Supreme Court on the SNP highlighted the irregularities in contracting out THR supplies under the ICDS in the states of Gujarat, Karnataka, Maharashtra, Meghalaya and Uttar Pradesh. In the case of Maharashtra, it was established that the Mahila Mandals permitted under the Supreme Court orders to supply nutrition were in effect front organisations for private companies. Uttar Pradesh is a prime example of a state where THR supplies in the form of panjiri (daliya) are infrequently supplied and not always of the requisite quality, as documented in a recent study.15 A new strategy to provide THR is needed to check leakages and provision of substandard rations. This could include a combination of employing women SHGs, where they are active, to provide THR and, in areas where SHGs are not functional, using cash transfers as a means to enable families to access additional food supplies.
Health and nutrition in the first years of life Despite all the steps taken by governments at the central and state levels to
address the critical issues in the first thousand days of life, areas of concern still remain to be addressed. ANC has improved, but there are large inter-state variations. The quality of ANC interventions still leaves much to be desired. Even where ANC coverage rates are high, the issue of systematic follow up by medical staff, leading to satisfactory outcomes for the health of the mother and the new born, still remain. Weight gain in mothers during pregnancy is not satisfactory, leading to a high percentage of LBW babies. 38 percent of children still do not receive the full immunisation package. Financial assistance under the JSY received for institutional delivery covers only 36.4 percent of all mothers, with out of pocket expenditure per delivery in a public health facility amounting to almost 3200. Early and exclusive breastfeeding cover barely half the U3 child population and the percentage of 6-8 month children receiving complementary feeds has actually come down by 10 percent in the period between NFHS-3 and NFHS-4. Less than 10 percent of children in the 6-23 month age group receive an adequate diet,
15 Leveraging Agriculture for Nutrition in South Asia (LANSA), Research Brief, Issue 06, June 2017 – Implementation of the ICDS in Chhattisgarh and Uttar Pradesh (India): a systemic study
25 | 49
covering breastmilk/milk and food from four food groups. Not surprisingly, this reflects in the doubling of stunting rates between the first and second year after birth, with deleterious consequences for the child’s physical, mental and cognitive development.
Absence of a focused approach It has taken more than ten years after the adoption of the WHO growth
standards for the Government of India to recognise the importance of tackling chronic malnutrition in the form of stunting. There has often been too much preoccupation with specific programmes that are the then current favourites with the international nutrition community and international organisations. SAM treatment was seen, wrongly as it turns out, as a comprehensive solution to tackling malnutrition, with state governments advertising their efforts in checking SAM. While this is undoubtedly important, it has led to inadequate policy focus on tackling the determinants of chronic malnutrition. There has been no clear strategy on IYCF and certainly no thoroughgoing implementation efforts at the ground level.
A point of concern is the widespread preference (in government circles) for
limited campaigns to tackle malnutrition. One would hope that the NNM would steer away from preoccupation with immediate results and focus on measures that can be sustained over time. One often sees, in media reports, congratulatory noises about children’s weights having been measured. In fact, Uttar Pradesh carried out such a one-off exercise in September 2015. The problem is that neither are the results of such exercises placed in the public domain (to enable nutrition analysts to comment on the implications) nor do these exercises form the basis for meaningful policy initiatives. There is also the issue of changing emphasis on nutrition indicators over time, with the underweight measure being supplanted by stunting and wasting measures. Unless detailed training on the implications of each of these measures is given to field-level functionaries at the block level and below and real-time data on an ongoing basis is made available to them, they will not be able to assess the impact of their services nor will their immediate supervisory levels be able to advise them on the corrective measures required to be taken.
Poor (almost non-existent) use of data Informed and intelligent use of real-time data forms the fulcrum for informed
policy making and implementation. Unfortunately, it has been the experience that the voluminous data generated monthly by the ICDS and health sectors has not been used to plan budgets, devise policies and deploy manpower. The Mother and Child Tracking System (MCTS) launched in 2011 by the Ministry of Health and Family Welfare, Government of India has never used the information to empower field health workers to deliver services more effectively to women and children. The ICDS MPRs are sent monthly by states to the Ministry of Women & Child Development, Government of India. Not only is this data not in the public domain, no state uses this data (or improves on its accuracy) to reach children in need of interventions.
26 | 49
Lack of an urban focus The ICDS is rather poorly run in most urban centres for a variety of reasons. For
one, there is no local government that takes responsibility for the health and nutrition of women and children in urban areas. Unlike Zilla Parishads and Gram Panchayats, where there is considerable awareness of these issues, the urban corporator/councillor is quite unconcerned. The Health departments in major urban bodies are more concerned with tertiary health care. ICDS in urban areas is dealt with by the ICDS Director/Commissioner at the state level, with almost no contact with the local government machinery. Space constraints often rule out locating anganwadis, especially in slum areas. Apart from the SNP, very few of the other services under the ICDS are provided to mothers and children. Given the rapid rate at which urban India is growing and the proliferation of unauthorised settlements, a clear policy is needed to address undernutrition in women and children in urban areas, especially in rapidly urbanising states/areas with a huge inflow of migrant population like Maharashtra, Gujarat, Tamil Nadu, Karnataka, West Bengal and the Delhi NCR.
Sanitation – toilet use rather than just toilet construction The improvement in stunting rates in Bangladesh and Nepal has, in part, been
ascribed to their success in reducing open defecation. While Indian states have registered reductions in stunting rates between 2005 and 2015, the reductions would probably have been greater if open defecation rates could have gone down substantially, especially in the poorer states. A major reason for this, as pointed out by Diane Coffey and Dean Spears, is the purity-pollution focus of families and communities, particularly in rural areas. This militates against the adoption of low-cost pit latrines, which require periodic cleaning, as against costlier flush latrines. This leads to continued open defecation even when toilets are being constructed at a brisk pace, given the reluctance to use toilets. While the efforts of the government to make India ODF are commendable, measuring toilet use rather than toilet construction would be more meaningful. The current euphoria on the rapid pace of toilet construction needs to be tempered by a careful analysis on the extent to which the constructed toilets are actually used for the intended purpose.
Women’s status – still a long way to go NFHS-4 data shows that there has been some improvement in gender equality in
the decade preceding its publication. A greater percentage of women are now involved in household decision-making, spousal violence has come down somewhat and more women are now operating their personal bank accounts. However, the social milieu still works against an environment conducive to safe child bearing and child rearing for women. The “son” preference in large sections of Indian society introduces an element of discrimination against the girl child right from birth. She has lesser access to nutrition and health care than her male siblings, drops out of formal education to a much greater extent and is married at an early age. The NFHS-4 data on the status of women is disquieting: it shows that, particularly in the states
27 | 49
with poor child nutrition indicators, women suffer from multiple disadvantages. With the available evidence showing clearly that lower educational attainments in women adversely affect utilisation of nutrition and health services and impact the quality of care giving for the child, it is obvious that stunting and underweight rates of U5 children will be much higher in families where women are at a social, economic and educational disadvantage.
Inadequate access to gainful livelihood In a country where the majority of the population still makes a living out of
agriculture, the lack of secure land tenure rights, loss of land because of acquisition for development and infrastructure purposes and unremunerative agricultural operations have contributed to significant migration, either seasonal or permanent, by rural populations. This phenomenon has been particularly pronounced for ST populations, which have increasingly lost access to livelihood from forest produce and have suffered from land alienation. Legislations to rectify this situation have been ineffectual, with poor implementation of even the path-breaking Forest Rights Act of 2006. Absence of an efficient land records system that shows clear ownership bedevils both rural and urban landowners. Without clear titles, access to credit for production purposes is affected. The secondary and tertiary sectors have not been able to take the load of the primary sector excess working population, in the absence of employment opportunities. Migratory populations are not only handicapped by inadequate incomes, they are also often denied social sector benefits, like access to public nutrition and health care, when they move to other areas in search of work.
Outcomes, not outputs/inputs For too many years, governments have been preoccupied with the inputs (funds,
manpower, etc.) invested in programmes or, at best, with outputs, like the number of children and mothers receiving SNP, number of children enrolled in schools, number of toilets constructed, etc. The NNM represents probably the first effort at measuring outcomes in terms of maternal and child nutrition indicators. This again is a task easier said than done. Past experiences of outcome measurements have not been very encouraging, given that the implementation machinery will always be inclined to show that its efforts have been successful. A skilful use of IT, coupled with regular monitoring of the figures reported and enforcing accountability on the reporting systems, will be essential for getting an accurate picture of the impact on the targeted populations of the implemented programmes. It is encouraging to note that steps have already been initiated for NFHS-5, within a couple of years of release of the NFHS-4 data. Independent third-party evaluation studies at random locations would also improve access to data and improve accountability.
Harnessing civil society/private sector energies State efforts have rarely been supplemented or supported in a systematic
manner by those of civil society organisations/individuals and the private sector. A major reason for this has been the traditional suspicion with which the three sectors –
28 | 49
governments, civil society organisations and the private sector – have viewed one another. Civil society has an important role to play in advocacy efforts to draw attention to nutritional deprivations and catalyse action on this front, ensuring accountability for actions, generating context-specific knowledge about key undernutrition drivers and remedial measures needed and providing delivery platforms to ensure the widest reach of nutrition programmes, especially to the disadvantaged and underserved. Suspicions about the role of the private sector in promoting particular foods for commercial interest reasons do persist: however, the private sector has an important role to play in the provision of nutritious foods, health care and sanitary services.
Budgetary issues All good intentions can be translated into action and into gratifying results if there
is enough financial provision for crucial programmes. This is one area where worries have cropped up in recent years, which need to be addressed in the war against child malnutrition. Direct nutrition interventions are financed largely through centrally sponsored schemes (CSS) in the social sector, financed jointly by the central and state governments, with state governments being responsible for implementation. Assessing the contributions of different sectors to nutrition is difficult in the absence of disaggregated data which specify the components relevant to nutrition. The situation has been radically altered with the increase in the share of untied funds transferred from the centre to the states increasing from 32 percent to 42 percent, based on the recommendations of the Fourteenth Finance Commission and the rationalisation of the existing 66 CSS into 28 umbrella schemes. In the ICDS, while the SNP sharing formula between the centre and states continues at 50:50, staff costs (for supervisory staff) are now shared between them on a 25:75 ratio.
This has implications for the adequate funding of the ICDS and related nutrition-specific programmes, given that nutrition has never figured high on many state government budget priorities. An analysis16 of the budget outlay in 2015-16 on SNP (Figure 5.1) shows that, barring Chhattisgarh, the other three states – Uttar Pradesh, Bihar and Odisha – provided far less budgets as compared to what was required by the government’s own norms.
16 Centre for Budget and Governance Accountability (CBGA) - UNICEF India (2017). Budget Outlays for Nutrition-Specific Interventions: Insights from Bihar, Chhattisgarh, Odisha and Uttar Pradesh, Working Paper 1
29 | 49
Figure 4.1: Difference in the Budget Outlay for SNP and funds required as per the Scheme Norms
Source: CBGA-UNICEF India Working Paper 1 (2017)
There is also the crucial issue of whether budget allocations translate into delivery
of quality services and what extent of the mother-child population benefits from the services. The shortcomings in the SNP have been brought out in Section III. Data on how many mothers and children actually avail of ICDS and health services cannot be termed reliable in the absence of any social audit and lack of oversight from local governments and civil society. The very lack of effective coordination between the ICDS and health sectors and the lack of reliable data affects even as crucial a programme as SAM treatment.
Political and bureaucratic will, convergence Recent experiences in different states of India and in neighbouring countries
have shown that commitment to reducing child undernutrition emanating from the top layers of government and percolating down to the lowest levels have a salutary effect on child nutrition outcomes. Odisha and Maharashtra have shown encouraging outcomes because of the publicly stated commitments of the respective governments and its follow-up in specific actions. Kerala and Karnataka have also implemented initiatives (detailed in Section V) to improve child nutrition and health outcomes. Even in Bangladesh and Nepal, the emphasis on reducing open defecation, while not driven specifically by a nutrition-related goal, has had favourable spin-offs in reducing child stunting rates. Active and enthusiastic state intervention has the effect of galvanising civil society actors, apart from leading to a greater convergence of activities that promote favourable child nutrition outcomes through the convergence of activities and programmes of diverse departments of the government relating especially to nutrition-sensitive programmes.
30 | 49
Section V: What has worked in India and nearby
Three initiatives from the states of Maharashtra, Karnataka and Kerala, where top level political-bureaucratic commitment and involvement of the ICDS staff (as well as, in some cases, the health staff) brought about a transformation in the environment and led to gratifying outcomes, some of which are still ongoing, are highlighted in this Section. Initiatives in the state of Odisha and the experience of India’s neighbours, Bangladesh and Nepal, are also brought out to indicate the factors that critically contribute to improving child nutrition outcomes.
Maharashtra: The Rajmata Jijau Mother-Child Health and Nutrition Mission
The Mission was the offshoot of a successful effort from 2002 onwards in the eight districts of Aurangabad Division of Maharashtra (the “Marathwada initiative”) to reduce child malnutrition. With media reports of child deaths consequent on child malnutrition in the tribal areas of the state, the bureaucratic and political decision-makers of the state decided to set up a State Nutrition Mission, the first of its kind in the country, with technical and financial support from UNICEF. Operating from April 2005 from the city of Aurangabad, the Mission extended the scope of its activities in three phases, starting with the five tribal districts with the most acute manifestation of child malnutrition, in the first year, adding ten other districts with significant tribal populations in the second year and covering the entire state at the end of the third year. The Mission aimed at truly universalising the ICDS by ensuring that every child was registered with the AWC. Growth monitoring of the child (only weights being taken till 2009) was given prominence to ensure that severely underweight children and those whose growth was faltering were identified and given medical attention, apart from concentrating on their nutrition. Anganwadi workers were imparted training in IYCF regimens. Capacity building of the supervisory and field staff of the ICDS and health departments was given the highest priority. Morale of the ICDS field and supervisory staff was sought to be built up by attending to the various operational issues that hampered their functioning, including laying stress on the filling of vacancies, meeting minor infrastructural requirements of the anganwadis and appreciating efforts made to reduce child malnutrition. Community interaction by the anganwadi workers was strongly emphasised, with community growth monitoring meetings being held to involve caregivers in understanding the growth patterns of their children (Figures 5.1 and 5.2).
The Mission launched a state-wide six-monthly campaign from 2007 onwards,
with close convergence between the ICDS and the health department, for Vitamin A supplementation and deworming of children, with a significant improvement in the percentage of children given Vitamin A supplementation. This convergence was further promoted when Child Development Centres (CDCs) (the Maharashtra version of the NRCs) were started in 2008 to tackle severe malnutrition cases. After the adoption of the new WHO Growth Standards by the Government of India in August 2008, the Mission took up the training of ICDS and health staff in the application of these new norms.
31 | 49
Figure 5.1: The Community Growth Chart
Source: Ramani, V. (2011). The Maharashtra State Nutrition Mission: Learning By Doing
Figure 5.2: Seeing is believing
Source: Ramani, V. (2011). The Maharashtra State Nutrition Mission: Learning By Doing
Maharashtra was the first state to use the WHO Growth Standards for identifying SAM children who were then treated either as in-patients in CDCs or covered under SAM protocols in Village Child Development Centres (VCDCs), run in AWCs. Not only was convergence in programme management between the ICDS and health department achieved, funds from two departments (Health and Tribal Development) were utilised to cover both tribal and non-tribal areas. The independent third-party Comprehensive Nutrition Survey of Maharashtra (CNSM), carried out in 2012, documented the significant improvement in child
32 | 49
nutrition indices in Maharashtra between NFHS-3 (2005-06) and CNSM (2012). While under-2 child stunting reduced from 39 percent to 23.3 percent in this period, wasting decreased from 19.9 percent to 16.3 percent and underweight from 29.6 percent to 22.6 percent. While the activities of the Mission may have contributed to only a portion of these encouraging results, it is obvious that the attention given to child nutrition in the state was instrumental in creating an environment where the state, probably for the first time, made reduction of child malnutrition its major priority and galvanised the government machinery to systematically deliver effective services to mothers and children. Karnataka: Mathrupoorna – When good economics and politics go hand in hand
Karnataka is a state, like most others, with significant regional economic and social disparities. These are manifested clearly in the inter-district variations in child nutrition status in the state. As many as nine districts, all located in the northern parts of the state, are part of the NNM, with three of them, Koppal, Yadgir and Gulbarga, having child stunting rates of over 50 percent. Even in terms of the state as a whole, Karnataka is characterised by stunting and underweight percentages in the mid-30s and very high rates of wasting and severe wasting (26.1 percent and 10.5 percent respectively). Given that the roots of child malnutrition lie in poor foetal growth, the Government of Karnataka went in for a comprehensive maternal nutrition programme. Christened as Mathrupoorna, this programme was initiated in February 2017 on a pilot basis in four backward talukas of Karnataka in different geographical regions of the state. Drawing on the lessons from the pilots and encouraged by the positive response of the beneficiaries and improvements in the short-term in key indicators, the government launched the programme throughout the state from 2 October 2017. Since maternal weight gain is one of the primary determinants of satisfactory child nutrition status outcomes, it was decided to supply a full, cooked midday meal for pregnant women/lactating mothers that bridged the gap between what they should eat and what they ate. The provision of a meal would improve early registration of pregnancies and the provision of full ANC services. Apart from improving energy-protein-nutrient intake (the daily meal provides about 1350 calories, over 40 grams of protein and nearly 600 milligrams of calcium), mothers would get the necessary psycho-social support of their peers. Calcium and iron supplementation are part of the programme, as also milk and egg provision. Where the SNP provides only 9.50 per mother per day, the Karnataka government spends 21 per mother. With over 8 lakh women already enrolled in this programme (expected to reach 12 lakh women finally) in 65911 AWCs, the state government will incur an annual expenditure of 600 crores, including its share of the official SNP component.
Karnataka has also taken a number of proactive measures to improve ICDS
outreach in the state and improve the quality of nutrition to under-6 children. All children in AWCs receive two eggs twice a week, with five days a week egg supply to severely underweight children throughout the state and to moderate underweight children in five northern districts of the state. Under the Ksheera Bhagya
33 | 49
milk supply scheme, over one crore children (6-59 months) receive whole milk five days a week. AWWs are now paid 8000 a month and AWHs 4000 a month, among the highest in the country, a step aimed at giving a sense of dignity to these frontline workers and motivating them to deliver highest quality of services to mothers and children. AWWs/AWHs are also eligible for medical reimbursement, to take paid leave and to participate in a contributory pension scheme. All AWCs in the state have been geotagged to enable monitoring from higher levels to improve service delivery. Efforts on a pilot scale have been initiated to track the nutrition status of every under-5 child through the use of online software to enable health and nutrition services to reach the child in a timely manner.
In a scenario in the country where vested political and economic interests have often hijacked well-meaning social sector schemes, it is heartening to see the emergence of a scheme like Mathrupoorna. As Tamil Nadu’s experience has shown, such schemes have a positive political spin-off. It is to the credit of Karnataka’s political executive and civil service that they have devised and implemented schemes that will contribute to improving the health and nutrition status of women and children in the years to come. Box 5.1: Odisha: Noteworthy progress in child nutrition
Kerala: Determination to change matters
Attappady development block, in the Palakkad district of Kerala, has a tribal population of nearly 50 percent residing in the hilly areas of the Western Ghats. Media reports in the middle of 2013 painted a disturbing picture of the large number of infant deaths in Attappady block in a short period. While socio-economic factors like the alienation of tribals from their land and reduced access to forest produce and lack of gainful employment contributed significantly to enhanced maternal and child malnutrition rates, a team of medical experts commissioned by UNICEF found, in May 2013, that weaknesses in the local health care systems in delivering
Odisha has shown very encouraging trends in U5 child nutrition and health indicators in the decade 2005-2015. While IMR and U5MR have declined from 65 and 91 respectively to 40 and 49 between NFHS-3 and NFHS-4, U5 children stunting percentages in the same period have reduced from 45 to 34.1. Nutrition-specific interventions and programmes and, to some extent, nutrition-sensitive interventions and programmes have contributed to this improved state of affairs. These include Ami Bhi Paribu (We too can), a positive deviance based programme, the screening and referral of severely malnourished U5 children for special health and nutrition attention and the large-scale engagement of women’s self-help groups for the SNP. High-level support, both political and bureaucratic, to programmes and policies and a fairly stable political environment have allowed for a vision-led approach, building up planning and implementation capabilities and providing adequate funds. Antenatal coverage has gone up appreciably, with 62 percent mothers having at least four antenatal care visits (NFHS-4) as compared to 37 percent a decade earlier. Full immunisation of children has also risen from 52 percent in NFHS-3 to almost 79 percent in NFHS-4. Improvements in road connectivity and drinking water availability as well as greater state commitment to gender issues have also been relevant factors: the latter include the state-wide scale up of the Mamata programme for conditional cash transfers for pregnant and lactating women, the phenomenal increase in institutional births (from 36 percent to 85 percent in the decade ending 2015) and state efforts to promote education of girls (especially from the scheduled tribes) and ensuring women’s rights to property. Most importantly, the improvements in service delivery and infrastructure have contributed to behavioural change and demand for services, with public confidence in state capacities going up.
34 | 49
proper antenatal and postnatal care to women and attending to neonates and infants were also responsible for the high rates of infant and child mortality. Experts from the NIN, who visited the area in the same period, reported that, as compared to an IMR of 14 deaths per 1000 live births in Kerala, the IMR in Attappady worked out to 66. Very high rates of stunting, underweight and wasting were also observed in children attending the health camps at the Tribal Specialty Hospital in Kottathara in Palakkad district.
The Kerala government swung into action almost immediately after public
attention was drawn to the media reports. A Special Task Force was set up under one of the senior most IAS officers of the state, who also served later as the Chief Secretary of the state, to devise measures for dealing with the problem. The STF commissioned Riddhi Management Services, Kolkata (Riddhi), a GIS solutions provider with extensive experience in the social sector, to develop a software solution for tracking the nutrition status of children. The Jatak system developed by Riddhi was customised for Attappady (details of the Janani-Jatak system are given at Annexure A). Training in use of the software was given to AWWs to enable them to convey monthly information on the weight of each child in the AWC through voice data to the server. Health staff accessed the data on SUW children, whose heights/lengths were measured at the nearest health facility to identify SAM/MAM children. After examination by the Medical Officer, SAM children with medical complications were admitted for a stay of six weeks to the NRCs set up in the block. Other SAM children were attended to at the community level employing CMAM protocols. Intensive efforts were made by the health and ICDS workers, through community outreach and the organisation of VHSNDs, to educate and empower mothers to take care of their children and ensure continued improvement in the nutrition and health status of their children. An Anganwadi Centre Monitoring System, known as “Nireeksha” is used by Supervisors to provide information, through mobile telephony and web-based systems, on the state of infrastructure and the services being delivered. The programme for treatment of SAM children, employing the Jatak software, has been extended to three blocks in Wayanad, Kannur and Idukki districts. Figures 6.3 and 6.4 capture the improvements in infant mortality and child undernutrition over the past four years.
Yet again, the Kerala initiative highlights what can be achieved when the
state sets itself specific objectives and directs its resources (financial and manpower) towards those objectives. That this programme has been going on for over four years is a pointer to the commitment of the government. What is even more noteworthy is its extension to three more blocks in tribal areas of other districts in the state. A change in the political regime in Kerala in 2016 has not diminished this commitment in any way, showing that the goal of reducing child malnutrition and mortality transcends partisan considerations, a model worthy of emulation elsewhere in India.
35 | 49
Figure 5.3: SAM children percentage over four years
Source: Information from the Kerala government
Figure 5.4: Declining trend in infant deaths
Source: Information from the Kerala government Box 5.2: It’s worth watching our neighbours as well
India’s immediate neighbours, Nepal and Bangladesh still keep company with India in stunting percentages, though their performance is marginally better (Global Nutrition Report 2016). What is significant is the noticeable improvement in these countries over the past fifteen years, Nepal from 57.1 percent (2001) to 35.8 percent (2016) and Bangladesh from 50.8 percent (2000) to 36.8 percent (2014). Improvements in income and wealth have been a major driver, apart from increased access of women to education and (in the case of Bangladesh) employment opportunities. Access to health services (particularly during pregnancy) has increased significantly in both countries. A critical factor has been the increased coverage and use of toilets in both countries, a critical determinant in contributing to stunting in U5 children. However, as in India, nutrition-specific interventions and programmes, especially in relation to IYCF practices, will need special attention if the nutritional deficits of U5 children are to be successfully addressed.
36 | 49
Section VI: What needs to be done, by whom, and how
Since there is consensus on the urgent need to reduce child malnutrition and since the Government of India has, probably for the first time, taken the lead in setting the priorities in terms of specific quantitative targets, the areas where action is required and the agencies through which these actions need to be implemented need to be clearly spelt out.
Government of India 1. Providing guidance to efforts at state and local levels The NNM represents an effort at long last by the Government of India to give a conscious direction to programmes aimed at reducing child malnutrition in India. The specification of the expected reduction in child malnutrition indicators in a particular time period is intended to impart a sense of focus to state governments, apart from also ensuring that India makes conscious efforts to come near achieving SDG targets. Coordinating such implementation through the NNM, the Union Ministry of Women & Child Development and the NITI Aayog would bring some urgency to the task and ensure (hopefully!) that there is no relapse to the “business as usual” approach. Such a platform also enables sharing of good practices and experiences among states. The NNM should also act as a clearing house for keeping implementation machinery at the state and local levels abreast of the latest developments in international nutrition practices. At the same time, there should be no attempt to straitjacket the approaches to tackling child malnutrition of different states, recognising the varying administrative capabilities/structures of states and the differing socio-economic conditions in various regions even within states. 2. Administrative and financial support to nutrition initiatives The Food Safety and Standards Authority of India (FSSAI) under the Government of India has set up a Food Fortification Resource Centre (FFRC) tasked with curbing micronutrient deficiencies in commonly consumed food items by educating people about the benefits of fortified foods and promoting commercial manufacture of such foods by small-scale and large-scale producers. Their focus is on fortification of the staple items of consumption – rice, wheat, oil, salt and milk, through the safety net programmes of the ICDS, MDM and PDS. A number of states have already commenced supply of fortified foodstuffs. Augmenting these efforts and promoting behavioural change in consumers to adopt these fortified items will be among the main challenges for the FSSAI in the coming years. The Government of India provides 50 percent financial support to the ICDS SNP. However, independent reports suggest that there are states where neither the THR nor hot cooked meals are being provided to U6 children. There is also the issue of leakages, i.e. whether the amount shown as spent on THR/hot cooked meals actually reaches the intended beneficiaries. An independent mechanism for verifying the efficiency of SNP service delivery needs to be devised to ensure that
37 | 49
precious social sector funds (of the centre and states) are not misappropriated. The Government of India could also consider drawing up a scheme for rewarding better performing states with a greater percentage of fund allocation, even while trying to tackle the inefficiencies in service delivery in the poorer performing states. The Government of India should consider raising its share in the payment to AWWs to
4000 per month (from the existing 1800) and to AWHs to 2500 per month (from the existing 900). For the approximately 13.50 lakh AWCs in the country, this will involve an additional annual financial burden on the Government of India of about
6000 crores. The state governments should be required to contribute at least an equal amount as their share of honorarium per month to qualify for the central assistance, given that barring states in Western and South India, almost no state provides anywhere beyond 5000 per month (Central plus State share) to the AWW. However, the increased cost will more than justify itself in the motivation to AWWs/AWHs to provide better services, especially where the SNP and growth monitoring programmes are concerned. State Governments It is the state governments which are primarily responsible for the implementation of programmes (both nutrition-specific and nutrition-sensitive) that impact the nutrition status of children. What they need to do is detailed in the following paragraphs: 1. The thousand-day window of opportunity
It may not always be administratively possible to reach every adolescent girl and woman, prior to her pregnancy. But the expansion of the ICDS and health services over the years certainly allows for registering every pregnancy, following it through to the stage of delivery and providing aftercare through the government machinery to the mother and child for the next two years. Maternal nutrition programmes during the pregnancy and post-delivery periods yield major favourable spin offs for child nutrition status. Starting such maternal nutrition benefits and ensuring cash transfers to mothers are two areas where state governments need to pay special attention. Convergence of the health and the ICDS machineries, especially from the block to the village levels, is crucial. PHCs need to maintain lists of high-risk mothers (with a history of anemia, previous obstetric complications and high blood pressure), and take action to ensure that healthy babies are delivered.
While some states, notably southern states like Tamil Nadu and Kerala,
provide fairly efficient ANC services, home based neonatal care is relatively low even in these states. Kerala is now seeking to address this deficiency in services by screening all children immediately after birth. Similar initiatives need to be launched in other states as well to check the high rates of neonatal deaths as well as the subsequent health complications, which contribute to child malnutrition. ICDS and health services in nearly all states need to intensify the counselling of mothers/caregivers/families in proper child care, especially in the period of infancy,
38 | 49
covering the areas of early and exclusive breastfeeding, complete immunisation and introduction of complementary feeding at the appropriate time. 2. Tackling acute and chronic malnutrition simultaneously
SAM programmes in different states do not follow any systematic pattern. Identification of anganwadis with a higher preponderance of SAM children and setting up NRCs/CMAM centres in the vicinity of such anganwadis (and geographical areas) is essential. More importantly, follow-up of such SAM children for a period of one year after their discharge from the treatment is crucial, both to prevent relapse (and possible chances of mortality) and to address the likelihood of continued chronic malnutrition (since frequent episodes of weight loss will have their impacts on linear growth as well).
An issue of concern worth flagging here is the decision to entrust the
recording of lengths/heights of children to the AWW. While one understands the rationale of addressing stunting, experience with getting AWWs in some states to record lengths/heights has not been encouraging. A more realistic solution would be to continue the present practice of the AWW recording the weight of the child. Heights of children falling in the <-3SD category can then be taken by the health staff which will be examining all such children for treating them for SAM through NRCs/CMAM. This practice needs to be followed in every state so that systematic identification and treatment of SAM children is possible.
The NFHS-4 has provided evidence that both linear and ponderal (weight-
related) growth patterns in the first five years of life are influenced by nutrition and health interventions. Hence, there is also need to initiate measures relying on behaviour change, food/nutrient supplementation and improved hygiene to tackle stunting (chronic malnutrition). It is here that caregiver/family counselling by ICDS/health frontline workers will be particularly crucial. 3. Identifying problem regions
The NNM has identified 315 districts for coverage in the first year, which has already ended (and, presumably, therefore, these districts will be carried over to 2018-19 as well). Since financial resources are always a problem, it would be more meaningful to identify districts which are faring the worst in respect of stunting, wasting and underweight indices and focus on the worst-affected blocks in selected districts from amongst these districts (which are themselves quite large in number). Nor is it the case that an entire district shares the same statistics. To give an example from Maharashtra state with which the author is familiar, districts like Nashik and Ahmednagar are geographically diverse. While certain blocks (and ICDS projects) are in hilly, underdeveloped tribal areas, there are other blocks which are agriculturally prosperous or have experienced significant industrial development. Focusing on the district as a whole may not only divert scarce financial resources to areas in these districts which are doing reasonably well as regards nutrition indices, it would also reduce the budgets available for far poorer areas, within a district, with
39 | 49
high malnutrition rates. Better outcomes can be achieved if technology is used to identify the specific blocks with the worst child nutrition indicators and work on reducing malnutrition in these blocks. Lessons learnt from implementation in these areas can be used to streamline implementation in other areas in subsequent years. 4. Data in implementation: the role of technology
State governments need to use data on the health and nutrition status of mothers and children as a powerful tool to identify geographical areas as well as specific disadvantaged groups where concerted action is required. Such data should be placed online in the public domain to enable researchers and health/nutrition experts to offer their advice. Annexure-A gives details of the Janani-Jatak software which enables tracking of the health and nutrition status of the mother and U5 child. Its successful use in Kerala has also been detailed in Section 5. Effective service delivery
While the position of staff in place is good at the anganwadi level, there is a significantly high percentage of vacancies at supervisory levels, namely CDPOs (both urban and rural/tribal) and Supervisors/Mukhya Sevikas. With the importance now being given to data management, the shortage of Statistical Assistants in CDPO and district offices is also likely to pose problems. There is also a shortage of health personnel, particularly in remote tribal areas. Innovative personnel policies are required to meet these shortfalls, either through public-private partnerships, contractual appointments and/or making postings in such locations, along with meeting desired service standards, mandatory for future career advancement. Speeding up recruitment processes, including at the Public Service Commission levels, is crucial to achieve the ambitious goals set by the NNM.
Though the AWW is the critical lynchpin in the machinery devised to provide
services to mothers and children, she has often never fully got her due in terms of appreciation and recognition. What is most important is to recognise her problems, solve these at the supervisory level and recognise the good work done by her. Increasing the remuneration payable to her, empowering her with funds to carry out localised activities, including minor purchases and repairs, and ensuring timely transfers of funds to her will enable her to give of her best. While the frequency of visits by supervisory levels to anganwadis to monitor their performance is affected by shortage of staff at these levels, there is also the issue of the limited perception of CDPOs/Supervisors of their important role in reducing child malnutrition. Supervisory staff must be squarely responsible for monitoring the nutritional status of each and every child in their respective areas and initiating remedial measures. This accountability has to move up the bureaucratic pyramid right to the top, to the Secretaries in the Departments of Health and Women & Child Development (and the departmental heads under them, like the Director of Health Services, the Mission Director, NHM and the ICDS Commissioner/Director).
40 | 49
6. Budgeting for nutrition General budgets of state governments should incorporate a specific “child
budget” which focuses on U6 children. Budgets of different departments, particularly those of the Departments of Health and Women & Child Development, should list schemes/programmes that have a direct as well as indirect impact on the health and nutrition status of the U6 child. The budgets should be disaggregated to the ICDS project level to ensure that watch is kept on the allocations to (and expenditures in) in the areas with the highest incidences of child malnutrition and child (and infant) mortality. Allocations should be adequate to meet the needs of the entire mother and child population that is the focus of the programme. Cost norms (e.g. for SNP) should be periodically revised to provide realistic financial support to mothers and children. Mention has been made earlier of the need for the Government of India to augment its share of the monthly honorarium paid to AWWs/AWHs. State governments also need to increase their share of the amount paid to these critical field functionaries if they hope to motivate staff. 7. Delegation of powers to local governments Centralisation of all administrative and financial powers at the level of the ICDS Directorate/Commissionerate has led to major inefficiencies in programme performance. Placing funds on a timely basis with local governments and insisting on timely transfer of funds would enhance performance. This would also incentivise local governments to support novel solutions to implementation problems at the field level, apart from squarely placing the onus of responsibility for outcomes on them. Local governments 1. The urban focus
Attention needs to be focused on India’s urban areas, especially its sprawling urban agglomerations, with their slum areas and areas where the socially disadvantaged are concentrated. With moderate and severe malnutrition levels as significant in some urban ICDS projects as some of the more severely affected rural ICDS projects, greater municipal government involvement is essential if urban child malnutrition is to be successfully tackled. Municipal corporations and larger municipal councils need to take on the responsibility in their areas, while smaller municipal council areas could continue to be looked after by the Zilla Parishads. 2. Local government funding and local initiatives Local governments, both in urban and rural areas, must make a provision in their annual budgets for schemes aimed at improving the nutrition and health status of women and U6 children. Maharashtra state has a provision where a percentage of the revenue received from government is earmarked by rural local bodies for schemes designed to improve the welfare of women and children. Many of these schemes are uncoordinated, often duplicating programmes of other departments. Specific funding for maternal and child health and nutrition would help augment receipts from the Government of India and state governments. This would also
41 | 49
enthuse elected local government officials to play a more active role in promoting schemes that further the objective of enhancing maternal and child health and nutrition. Civil society Academia, nutrition community, concerned citizens, media, corporates There has, unfortunately, been too little dialogue between governments and opinion makers and researchers on jointly evolving ways and means to combat child malnutrition and promoting behavioural change in families and communities. For a start, governments must share online the monthly data generated on the nutrition status of every child. Universities, non-profits and thinktanks should be engaged to analyse the extent and nature of child undernutrition, especially in those districts and blocks identified as particularly vulnerable. Their research inputs should be used to tailor policies and programmes to align with what mothers and children really need. Wherever possible, the assistance of active NGOs should be used to supplement the activities of field-level functionaries, provide crucial technical inputs to them and monitor the health and nutrition status of U6 children. Print and electronic media can be used to report on how well programmes are really working on the ground and the responses of communities and families to programmes aimed at their welfare. It also has to be recognised that the private sector can offer answers in areas where the government needs to scale up nutrition interventions. This is particularly relevant in areas like micronutrient fortification of food grains, flour, edible oils, salt and milk, where considerable research and commercial deployment of fortified foodstuffs has been undertaken by the private sector in various countries. The corporate sector should, while looking for commercial opportunities in areas of nutrition, ensure that the interests of the community are given first priority and that products injurious to the future health and nutrition of the mother and child are not promoted. Corporates can also play a proactive role in improving maternal and child nutrition indicators by working with governments in promoting both nutrition-specific and nutrition-sensitive initiatives instead of merely confining themselves to the mandatory requirements of the CSR Act 2013. The Bhavishya Alliance initiative, operative in Maharashtra as a multisectoral partnership between 2006 and 2011, holds lessons for the possibilities in collaboration between partners with divergent interests in the area of child nutrition17.
17 https://vramani.files.wordpress.com/2018/08/bhavishya-alliance-analysis-and-learnings.pdf: V. Ramani: Bhavishya Alliance – Analysis and Learnings
42 | 49
Section VII: Conclusion – Take-away Lessons
Reducing the scourge of child malnutrition in India requires the active participation of multisectoral actors in society. These range from governments, both central and states, to academic institutions, the private sector, NGOs, CBOs and civil society at large. At the same time, the predominant role of government as the change driver has to be emphasised. A discussion paper floated by McKinsey in June 201818 highlights five important disciplines (the five Cs) which can more than triple the chances of success of government transformations:
(a) Committed leadership; (b) Clear purpose and priorities; (c) Cadence and coordination in delivery; (d) Compelling communication; and (e) Capability for change.
The history of child nutrition trends in India and the efforts made to improve these highlight certain issues which need to form the central focus of ongoing and future efforts:
Change for the better has been encouraging but there is still a considerable way to go:
U5 child nutrition indicators have registered improvement in successive NFHS but the overall picture is still somewhat sobering, especially when compared with other countries and when one considers that the figures mask great inequalities amongst different regions of the country and within states. States in the West (Maharashtra, Goa), South (Kerala, Tamil Nadu), East (Tripura) and North (Himachal Pradesh) have shown significant improvements in U5 child nutrition and U5MR over the years. Even more heartening is the fact that all states, including the traditional problem states like Uttar Pradesh, Bihar and Madhya Pradesh, have shown reductions in stunting percentages and in IMR and U5MR. States like Odisha and Chhattisgarh have performed well in this millennium. At the same time, it has to be recognised that pockets exist, especially in the northern and central Indian states, where children, especially from disadvantaged groups like the Scheduled Castes and Scheduled Tribes, are still at a significant nutrition disadvantage, which hampers their future lives.
Policy environment challenges to improving outcomes:
Governments, both at the centre and in the states, have generally placed undue emphasis on the SNP, without devising meaningful strategies to change caregiver behaviours and without systematically monitoring the growth of children to identify the geographical areas most in need of guided interventions
18 McKinsey Center for Government (June 2018), Delivering for Citizens, Discussion Paper
43 | 49
to address child malnutrition. Not surprisingly, many questionable practices have been adopted by state governments in the SNP, especially in THR procurement, despite clear Supreme Court directions. Without a clear approach to tackling child malnutrition, state governments have hardly ever sought to bring about the convergence of the activities of different sectoral departments, especially the health department and the ICDS, in effectively meeting the challenge. It is hoped that the NNM will bring about a change in prevailing attitudes: only the actions of state governments in the coming months and years will indicate whether this approach has been internalised.
Empowering those at the frontiers of action: Nutrition policy in India has often followed a “top-down” rather than a “bottoms up” approach. Policies and programmes have tended to be rigid and have not taken into account regional and even inter-district variations. There has been a trust deficit between policy makers and field workers. It is imperative to recognise that reposing confidence in the AWW, equipping her with the requisite skills and providing her the resources to do her work efficiently will yield rich dividends. The same applies to medical staff at the PHC level and below. There are a number of instances in different states where local staff have come up with innovative solutions and have brought about remarkable transformations in the nutrition status of children in their areas.
Keeping it simple: focus on specific programmes Given resource limitations (in terms of both manpower and money), it makes sense to identify those practical interventions that yield the maximum benefits. Improving the health and nutrition status of the mother during her pregnancy and during the nursing period (through provision of nutrition and healthcare) will contribute greatly to the health and nutrition status of the new-born. Launching a major campaign to drive home the benefits of early and exclusive breastfeeding, backed by initiatives to enable mothers at work to breastfeed their infants and providing childcare facilities at work sites would give the child a healthy start in life. Keeping track of the nutrition and health status of the child, especially in the first two years of life, and providing nutrition and healthcare support on an ongoing basis would help ensure her appropriate physical and mental development. Government programmes should build in these components with adequate funding and institutional support.
Empowering communities and families, especially women: The approach to tackling child malnutrition, by governments, NGOs and well-meaning institutions, should focus on building up the capabilities of the community to manage the health and nutrition needs of their children. Nutrition-sensitive programmes like increasing the proportion of girls completing secondary education and acquiring skills to become independent earners need to be pushed. Social programmes need to emphasise the aspect of gender equity and the responsibility of all family members, especially males, in caregiving
44 | 49
responsibilities to both the mother and the child. Community initiatives to tackle the menace of open defecation should be actively encouraged.
Effective delivery mechanisms Radical transformations in the child nutrition scenario require committed teams in the government, working in close liaison with counterparts from academia, the private sector and NGOs/CBOs. Such teams need to be staffed by individuals of proven dynamism and competence who can work closely with others. They need to enjoy the fullest confidence of the top political and bureaucratic echelons and have easy access to top decision-makers. The traditional department structure will not usually work in an environment where flexibility, quick decision making and coordination with a variety of partners are crucial determinants of success. BRAC and the Grameen Bank in Bangladesh are prominent examples of civil society organisations that worked in tandem with the government to promote development, with one of the offshoots being improved child nutrition indicators.
Moving away from the “business as usual” approach Classic government operations are dominated by budgets, procedures and cumbersome decision-making. Tackling child malnutrition in a very specific time frame requires a willingness to embrace change in traditional methods of government functioning. Innovative approaches need to be visualised and implemented, funds need to be available when needed for specific programmes, staff capabilities need to be developed and refurbished as needed and management of programmes has to be nimble and data-driven.
45 | 49
Annexure-A: Janani-Jatak -- Keeping Close Track of The Mother and Child Riddhi Management Services (Riddhi), a Kolkata-based private company
which provides GIS solutions in various sectors, has worked extensively with the Census Commissioner of India in developing software solutions for the decennial censuses of 2001 and 2011. Riddhi has already developed two tracking systems for monitoring the health and nutrition status of mothers and children in Maharashtra. The first, JANANI, aims to track the status of the mother on a real-time basis from the time of registration of her pregnancy through delivery and till six weeks after successful delivery of the child. The second, JATAK, enables ongoing monthly monitoring of the nutrition status of every child in the block, with supporting health modules designed to tackle MAM and SAM children. JANANI
This mother-child dyad care system combines mobile telephony with a web-
based server programme to assist front-line health workers in delivering timely, quality services to pregnant/nursing mothers and children under two years of age. From the time of reporting of the pregnancy till six weeks after successful delivery, the health of the mother is tracked by health workers, who are also tasked with ensuring the complete immunization of the child. Any emergency illness of the mother in the PNC period and of her children till two years of age would be reported and monitored. JANANI progressively captures the health records of all pregnant mothers through the entire period of pregnancy till the end of six weeks after delivery. This data, fed into the web-based JANANI application through mobile phones, facilitates the identification of high-risk pregnancies and LBW children, as also promoting the goal of universal immunization. JANANI is crucial in tracking the health services provided to the mother and her offspring from conception through foetal life till the child is two years of age. Convergence of all key information centred around the mother-child dyad is the focus of this system. Regular automated analysis of the information along with alarms/alerts and timely exception reporting is aimed at ensuring focused action plans and effective utilisation of health resources. JATAK
The JATAK system is intended for growth monitoring of children on a real-time
basis, through mobile telephony and a server-based programme. The mobile telephone captures voice data, picture and location, with the programme having a GIS-based backbone. This system records and sends alerts about each child suffering from SAM as also about children with faltering growth trends. JATAK supplies the service provider with complete growth details of every under-5 child in their area of operation, in terms of all three anthropometric indicators: weight for age, height for age and weight for height.
46 | 49
HOW JANANI-JATAK WORKS The uniqueness of this system lies in its ability to track mother and child health
and nutrition status on a real-time basis. Data collected through mobile phones is processed immediately for alerting field workers on the interventions required from them. The design incorporates:
(a) Simple user interface with the latest technology; (b) Transfer of real-time data through voice message to a web server using
mobile telephony; (c) An offline-online combination to handle poor internet connectivity.
The mobile application is based on the Android operating system. It uses GPRS technology to communicate with the web server, transferring the voice data along with picture and location information. Where internet connectivity poses a problem, the JANANI-JATAK application is so customised as to allow recording of voice and allied data in a memory card, with automatic data transfer to the web server once internet connectivity becomes available.
The application uses voice files rather than relying on data that is keyed in on
the mobile phone. Experience in several countries has shown that the large volume of data to be entered not only places an inordinate burden on the field worker, it also leads to more mistakes in data entry, with no audit trail available to correct errors. The information on the mother, sent through voice file to the server is entered in a database through transcription and processed at the server end. Once the information of the pregnant woman enters the server, it calculates all the relevant dates based on the last menstrual period date of the woman -- ANC visit dates, TT immunization and expected date of delivery. Periodic alerts (on services to be provided) and alarms (notifying services which have not been provided at the prescribed time) are flashed to the field workers. Post-delivery, ANMs are notified on mobile phone of the due dates for different immunization services to be provided to the child. A unique four-digit ID assigned to each mother and child enable tracking of all services to be provided across the entire time period.
Once the weight and height information, along with the date of birth, for a
child are entered, the JANANI-JATAK system automatically lists all U5 children falling in the severe/moderate underweight, stunting and wasting categories and sends warnings to the concerned supervisory and field officials of the concerned departments.
An innovative (and very useful) feature of the software application is the geo-
referenced base map of the area where the service is to be provided. Geo-tagging of every Anganwadi enables their identification on the map. Gram Panchayat boundaries, hamlets, AWCs and health facilities can be located, enabling planning and analysis by government of the resources to be allocated to different areas. The
47 | 49
GIS backbone enables the location of every mother and child spatially, allowing for services to reach even inaccessible areas.
The SOS module of the JANANI-JATAK system focuses on children needing
emergency medical care. The health worker sends, by mobile phone, information on the child to the server. The concerned Medical Officer is expected to respond promptly with advice on the course of action, with escalation to the District Health Officer in the event that the Medical Officer has not responded.
48 | 49
References Alderman, Harold. 2005. Linkages between Poverty Reduction Strategies and Child Nutrition: An Asian Perspective. Economic and Political Weekly, November 12, 2005 Allen Lindsay H., Stuart R. Gillespie. 2001. What Works? A Review of the Efficacy and Effectiveness of Nutrition Interventions. United Nations Administrative Committee on Coordination, Sub-Committee on Nutrition (ACC/SCN) in collaboration with the Asian Development Bank (ADB) Barker D J P (1998): Mothers, Babies and Health in Later Life, Edinburgh, London, New York, Philadelphia, San Francisco, Sydney, Toronto, Churchill Livingstone, second edition Bergeron Gilles, Tony Castleman. 2012. Program Responses to Acute and Chronic Malnutrition: Divergences and Convergences. 2012 American Society for Nutrition. Adv. Nutr. 3: 242-249, 2012 Centre for Budget and Governance Accountability (CBGA) and UNICEF India. 2017. Budget Outlays for Nutrition-Specific Interventions: Insights from Bihar, Chhattisgarh, Odisha and Uttar Pradesh, Working Paper 1. Centre for Equity Studies, New Delhi. 2016. Progress of Children Under Six: Revisiting ICDS in the FOCUS Districts Chambers Robert, Gregor Von Medeazza. 2013. Sanitation and Stunting in India: Undernutrition’s Blind Spot. Economic and Political Weekly, June 22, 2013 (Vol. XLVIII No. 25) Citizens’ Initiative for the Rights of Children Under Six 2006. 2006. Focus On Children Under Six, Abridged Report. December 2006 Coffey Diane, Angus Deaton, Jean Drèze, Dean Spears, Alessandro Tarozzi. 2013. Stunting among Children: Facts and Implications. Economic and Political Weekly, August 24, 2013 (Vol. XLVIII No. 34) Coffey Diane, Reetika Khera, Dean Spears 2016. Intergenerational effects of women’s status: Evidence from child height in joint Indian households. research institute for compassionate economics (rice), December 19, 2016. http://riceinstitute.org/research/womens-status-and-childrens-height-in-india-evidence-from-joint-rural-households/ Cunningham Kenda, Derek Headey, Akriti Singh, Chandni Karmacharya, Pooja Pandey Rana. 2017. Maternal and Child Nutrition in Nepal: Examining drivers of progress from the mid-1990s to 2010s. Global Food Security 13 (2017) 30-37 Dasgupta Rajib, Shalini Ahuja and Veda Yumnam. Can Nutrition Rehabilitation Centers Address Severe Malnutrition in India? Indian Pediatrics 2014;51;95-99. https://www.indianpediatrics.net/feb2014/feb-95-99.htm Garg Samir. 2006. Chhattisgarh – Grassroot Mobilisation for Children’s Nutrition Rights. Economic & Political Weekly, August 26, 2006 Gragnolati Michelle, Meera Shekar, Monica Das Gupta, Caryn Bredenkamp, Yi-Kyoung Lee. 2005. India’s Undernourished Children: A Call for Reform and Action. August 2005. The World Bank, Washington D.C. Hoddinott John, Harold Alderman, Jere R. Behrman, Lawrence Haddad, Susan Horton. 2013. The economic rationale for investing in stunting reduction. Maternal and Child Nutrition (2013), 9 (Suppl. 2), pp. 69-82 Horton Susan. 1999. Opportunities for Investments in Nutrition in Low-Income Asia, Asian Development Review, vol. 17 nos. 1,2, pp. 246-273 International Food Policy Research Institute, Washington D.C. 2016. Global Nutrition Report 2016: From Promise to Impact: Ending Malnutrition By 2030. International Institute for Population Sciences (IIPS) and ICF. 2017. National Family Health Survey (NFHS-4), 2015-16: India. Mumbai: IIPS Khara T., & Dolan, C. 2014. Technical Briefing Paper: Associations between Wasting and Stunting, policy, programming and research implications. Emergency Nutrition Network (ENN) June 2014 Kohli Neha, Rasmi Avula, Mara van den Bold, Elisabeth Becker, Nicholas Nisbett, Lawrence Haddad, Purnima Menon. 2017. Reprint of “What it will take to accelerate improvements in nutrition outcomes in Odisha? Learning from the past”. Global Food Security 13 (2017) 38-48 Kotwal Ashok, Bharat Ramaswami. 2018. Aadhaar that doesn’t exclude. Indian Express, 13 February 2018 LANSA (Leveraging Agriculture for Nutrition in South Asia). 2017. Research Brief: Implementation of the ICDS in Chhattisgarh and Uttar Pradesh (India): a systemic study, Issue 06, June 2017 McKinsey Center for Government. 2018. Discussion Paper: Delivering for Citizens – How To Triple the Success Rate of Government Transformations. June 2018. McKinsey & Company Ministry of Women and Child Development, Government of India. 2018. National Nutrition Mission: Administrative Guidelines Nisbett Nicholas, Inka Barnett. 2017. Explaining the reduction in child undernutrition in the Indian state of Maharashtra between 2006 and 2012: An analysis of the policy processes. Food Policy 70 (2017) 27-39. http://creativecommons.org/licenses/by-nc-nd/4.0/ Nisbett Nicholas, Peter Davis, Sivan Yosef, Nazneen Akhtar. 2017. Bangladesh’s story of change in nutrition: Strong improvements in basic and underlying determinants with an unfinished agenda for direct community level support. Global Food Security 13 (2017) 21-29 NITI Aayog. 2015. A Quick Evaluation Study of Anganwadis Under ICDS. Programme Evaluation Organisation. June 2015 NITI Aayog.2017. Nourishing India, National Nutrition Strategy, Government of India Olofin I., C.M. McDonald, M. Ezzati, S. Flaxman, R.E. Black, W.W. Fawzi, L.E. Caulfield, G. Danaei and N.I.M.S.a.c. pooling (2013). “Associations of suboptimal growth with all-cause and cause-specific mortality in children under five years: a pooled analysis of ten prospective studies.” PloS One 8(5): e64636 Ramalingaswami Vulimiri, Urban Jonnson, Jon Rohde.1996. Commentary: The Asian enigma. The Progress of Nations – Nutrition, UNICEF. https://www.unicef.org/pon96/nuenigma.htm Raykar Neha and Purnima Menon. 2016. Global Nutrition Report 2016, Panel 3.3 – State Nutrition Missions in India: Doing Poorly on Target Setting. International Food Policy Research Institute, Washington D.C. Ruel Marie T, Harold Alderman and the Maternal and Child Nutrition Study Group. 2013. Maternal and Child Nutrition 3 – Nutrition-sensitive interventions and programmes: how can they help to accelerate progress in improving maternal and child nutrition? Lancet 2013; 382:536-51, Published Online, June 6, 2013, Ramani, V. The Maharashtra State Nutrition Mission: Learning By Doing. https://vramani.files.wordpress.com/2018/04/the-maharashtra-nutrition-mission-story_2005-101.pdf Ramani, V. Bhavishya Alliance – Analysis and Learnings. https://vramani.files.wordpress.com/2018/08/bhavishya-alliance-analysis-and-learnings.pdf Smith Lisa C., Haddad Lawrence. 2000. Explaining Child Malnutrition in Developing Countries: A Cross-Country Analysis. International Food Policy Research Institute, Washington, D.C. Spears Dean. 2013. How much International Variation in Child Height Can Sanitation Explain? Policy Research Working Paper Series 6351, The World Bank, https://ideas.repec.org/p/wbk/wbrwps/6351.html UNICEF. 2017. The State Of The World’s Children 2017: Children in a Digital World UNICEF/WHO/World Bank Group Joint Child Malnutrition Estimates. 2018. Levels and Trends in Child Malnutrition: Key findings of the 2018 edition