feedstock such as wheat straw) soda lignins supplied by ALM Private Limited. L3-I and
L5-I were isolated from the commercial lignins L3 and L5, respectively. The raw
materials and lignin samples are presented in Table 6.
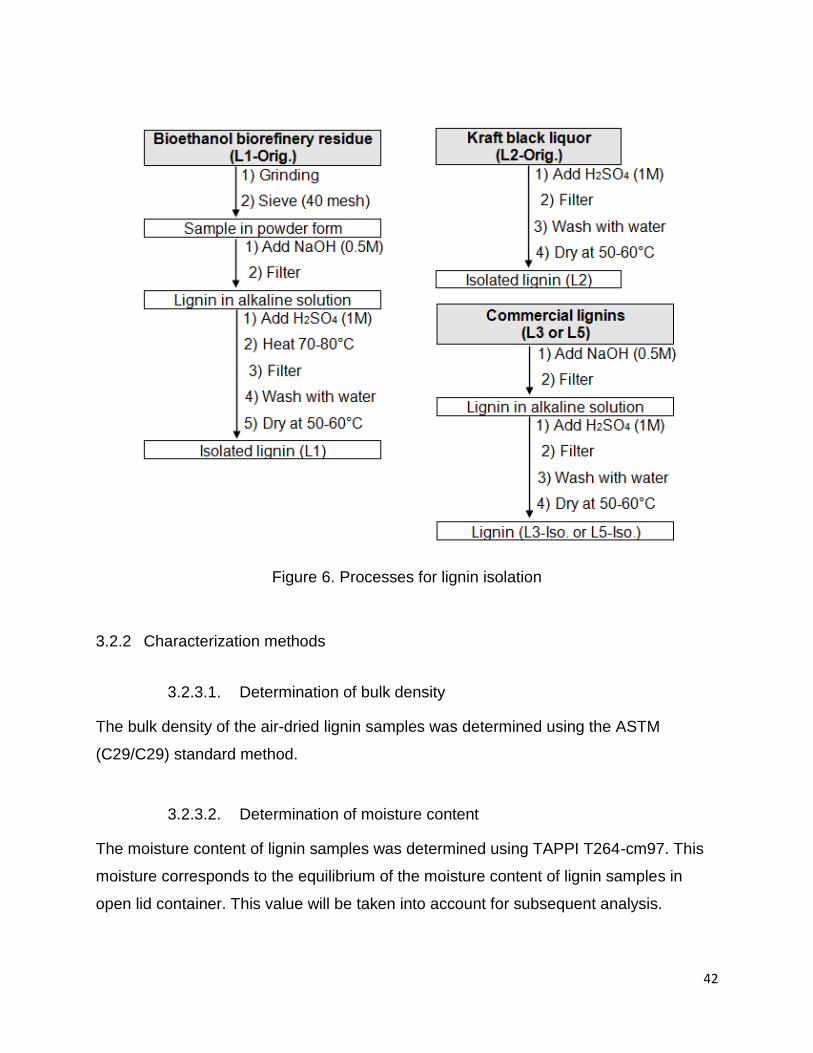
L1 was isolated from the remaining part of a mixture of hardwood and non-wood
species after steam explosion pretreatment, using isolation method described by
Abacherli and Doppenberg 2001. Solid residue from bioethanol biorefinery production
was ground and sieved to pass a 40 mesh size sieve. 20g of the fine powder was stirred
in 100 mL caustic solution (0.5M) for 30 minutes. The solution was filtered with a
Buchner funnel with 1 µm pore filter paper. The filtrate was precipitated by reducing the
pH to 2 by adding H2SO4 (1M) and subsequently heated to 70°C. The resulting
40
precipitate was separated by filtration, washed with water at 50 to 60°C to remove
degraded sugars and unreacted compounds, and then dried at 50°C overnight.
L2 was isolated from black liquor followed the method described by Tejado et al., 2007
(Tejado et al., 2007). The black liquor was produced in a kraft pulp mill in Brazil using
eucalypt species. The initial pH of the black liquor was 12.9. After lowering the pH to
about 2 by adding a solution of H2SO4 (1M), the precipitated lignin was filtered on a
Buchner funnel and washed with water at 50 to 60°C, and then dried at 50°C overnight.
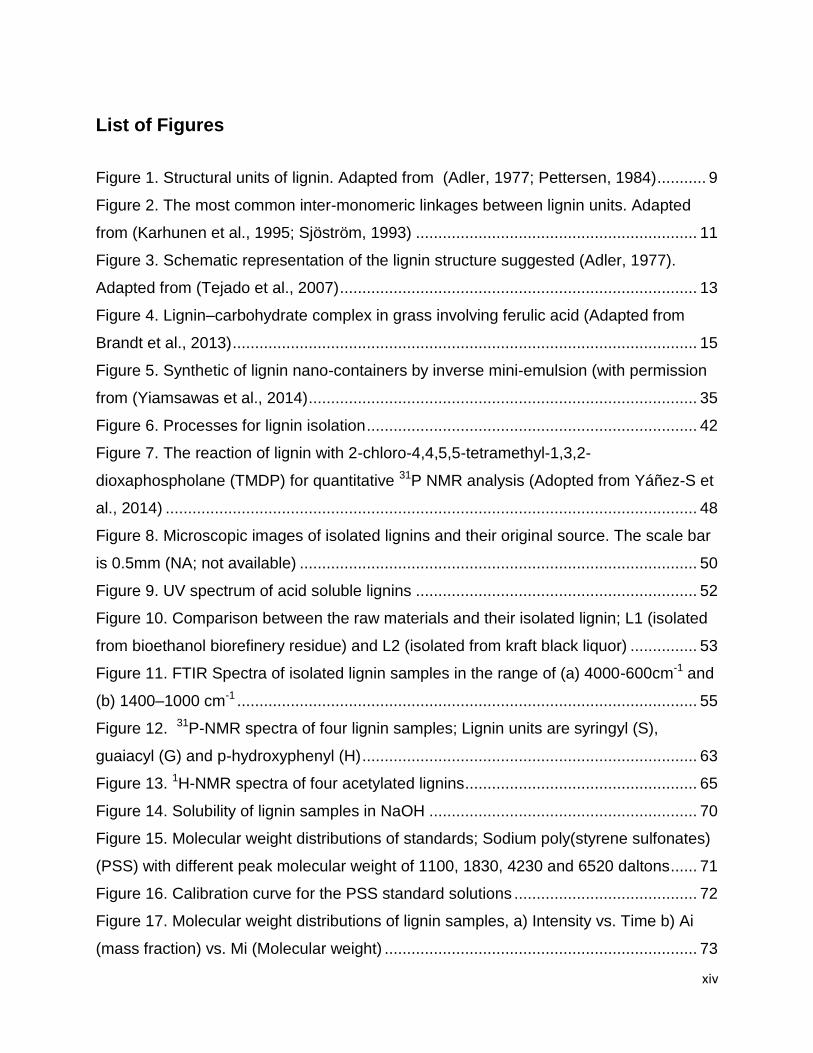
L3-I and L5-I were isolated through acid precipitation from two commercial lignins (L3
and L5) for a comparison with other isolated lignins. The isolation processes is
illustrated in Figure 6.
41
Table 6. Original source of lignin samples
Lignin Lignin isolation
Treatment Raw material Origin
Main Species
Industry Process
L1-Orig As received Bioethanol biorefinery
residue
Hardwood/ Non-wood
Unknown Bio-
Ethanol
Steam Explosion/ Enzymatic Hydrolysis
L2-Orig As received Kraft black
liquor Hardwood Eucalyptus Pulp Kraft
L1 Isolated (Abacherli and Doppenberg, 2001)
Bioethanol biorefinery
residue
Hardwood/Non-wood
Unknown Bio-
Ethanol
Steam Explosion/ Enzymatic Hydrolysis
L2 Isolated (Tejado et al., 2007)
Kraft black liquor Hardwood Eucalyptus Pulp Kraft
L3 As received Commercial lignin
(Indulin AT) Softwood Pine Pulp Kraft
L4 As received Commercial lignin (Protobind 2000)
Non-wood Wheat straw
Pulp Soda
L5 As received Commercial lignin (Protobind 1000)
Non-wood Wheat straw
Pulp Soda
L3-I Isolated (Tejado et al., 2007)
Commercial lignin (Indulin AT)
Softwood Pine Pulp Kraft
L5-I Isolated (Tejado et al., 2007)
Commercial lignin (Protobind 1000)
Non-wood Wheat straw
Pulp Soda
42
Figure 6. Processes for lignin isolation
3.2.2 Characterization methods
3.2.3.1. Determination of bulk density
The bulk density of the air-dried lignin samples was determined using the ASTM
(C29/C29) standard method.
3.2.3.2. Determination of moisture content
The moisture content of lignin samples was determined using TAPPI T264-cm97. This
moisture corresponds to the equilibrium of the moisture content of lignin samples in
open lid container. This value will be taken into account for subsequent analysis.
43
3.2.3.3. Yield of extracted lignin from industrial residue
The yield of extracted lignin was determined as the weight ratio of the oven-dried
isolated lignin to the oven-dried crude lignin:
(1)
3.2.3.4. Ash content
The ash content of the lignin samples was gravimetrically determined in a muffle
furnace at 525 °C (TAPPI T211). About 0.5 g of oven-dried lignin sample was weighed
into tared ceramic dishes and put in a muffle furnace at 525±25 °C for 4 h. The samples
turned white/gray at the end of the heating cycle. Samples were reweighed and the ash
content was determined as follows:
(2)
3.2.3.5. Chemical characterization of lignins
Klason lignin is defined as the solid residual material when a sample is subjected to
hydrolysis treatment with 72% sulfuric acid. Klason lignin was determined according to
TAPPI T222 standard method. Lignin samples were treated with 72% H2SO4 for 1 h in a
water bath (30ºC), then diluted to 4% and autoclaved at 121ºC for 1 h. The hydrolyzed
solution was vacuum filtered on a gooch filtering crucible (medium pore size) and dried
in oven at 105ºC for 3 h. The Klason lignin was calculated as a percentage of the weight
of the dry lignin sample.
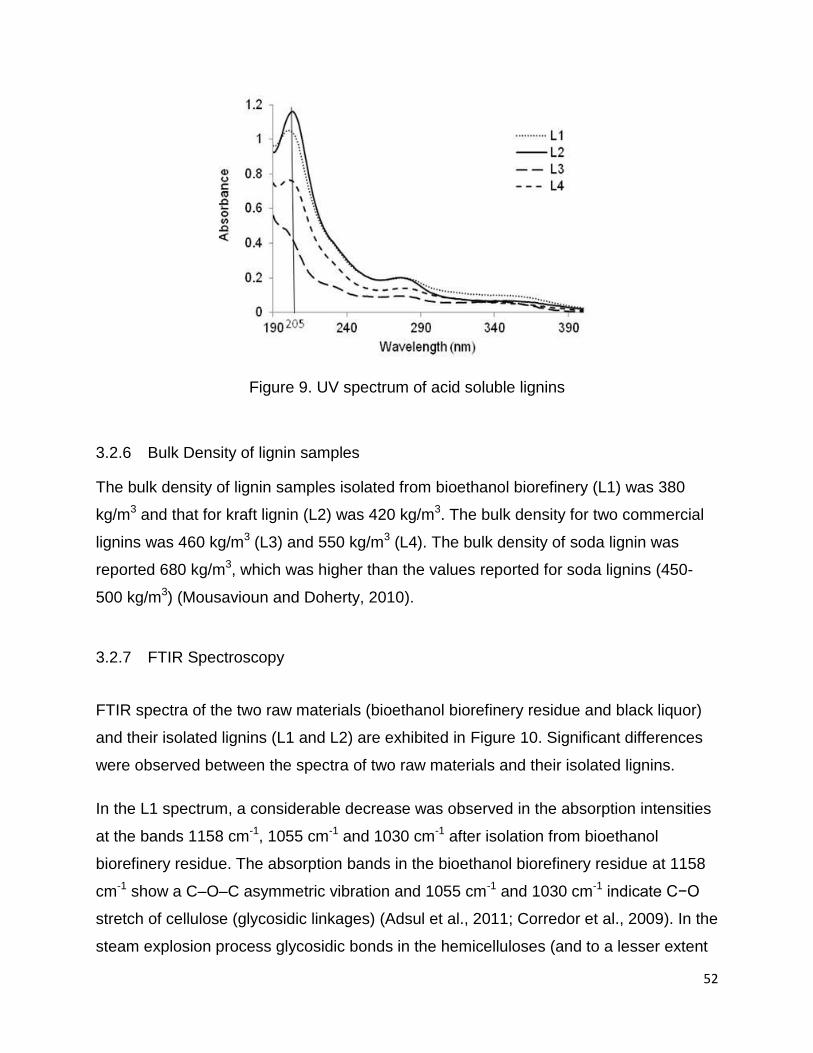
Acid-soluble lignin was measured using UV spectroscopy (Maekawa et al., 1989; Zhu et
al., 2013). The filtrate collected from the Klason lignin procedure, was neutralized with
44
calcium carbonate and filtered through 0.2 µm syringe filters. Acid-soluble lignin was
determined from the absorbance at 205 nm, according to the following equation:
(3)
Where;
d is the dilution ratio (dimensionless)
V is the filtrate volume (L)
Aa is the absolute absorbance of the sample (dimensionless)
a is absorptivity of the lignin (L/g.cm)
W is the oven-dry mass of the sample (g)
L is path length of UV-Vis cell (cm)
The value of “a” was 110 at 205 nm.
3.2.3.6. Elemental analysis
The relative proportions of carbon, hydrogen and nitrogen in the air-dried samples was
determined with a Perkin Elmer Model 2400II CHN analyzer. Calibration was done with
acetanilide before each test. The air-dried sample weight was corrected for moisture.
The total sulfur content of the oven-dried lignin samples were evaluated by the
microwave acid digestion, and inductively coupled plasma atomic emission
spectroscopy (ICP-AES) analysis. The percentage of oxygen was obtained by
subtracting the sum of C, H, N and S contents from 100 percent (including the ash)
(Schorr et al., 2014). However, the nitrogen and sulfur could be included in ash content
as well. We assumed that nitrogen and sulfur are totally bonded to lignin. Svensson
(2008) reported that approximately 70% of the sulfur content in the softwood kraft lignin
45
is organically bound sulfur, while the rest of the sulfur content is inorganic (~ 29%) and
elemental sulfur (~1%) (Svensson, 2008).
or
Empirical formula of lignin samples was obtained from the cumulative analysis of all
elements.
3.2.3.7. Determination of number of carboxyl groups by titration
The carboxyl groups were determined by titration of lignin in ethanol with sodium
hydroxide (Gosselink et al., 2004b). First, sufficient volume of 0.1 M sodium hydroxide
solution was added to 100 ml 95% (v/v) ethanol in water to adjust the pH to 9.0. Then
1.0 g of oven-dried lignin was added to the mixture and stirred for 10-15 min.
Subsequently the mixture was titrated back to pH 9.0 with 0.1 M sodium hydroxide
solution. The number of carboxyl groups (mmol) was calculated per 1.0 g of lignin.
3.2.3.8. Determination of total hydroxyl number by titration
The methodology for determination of hydroxyl content followed the ASTM D-4274-11.
This method was developed for the determination of hydroxyl number of polyester and
polyether polyols. Briefly, the blank and the oven-dried lignin samples were refluxed at
98 °C in 20 mL of an acetylation reagent solution. This solution was prepared by the
mixture of 12.7 mL of acetic anhydride with 100 mL of dry pyridine. After refluxing for 2
h, the flasks were allowed to cool at room temperature. Then the excess of acetic
anhydride was hydrolyzed with 30 mL of distilled water, and subsequently titrated with
sodium hydroxide (0.5M). The total hydroxyl content was calculated from the difference
46
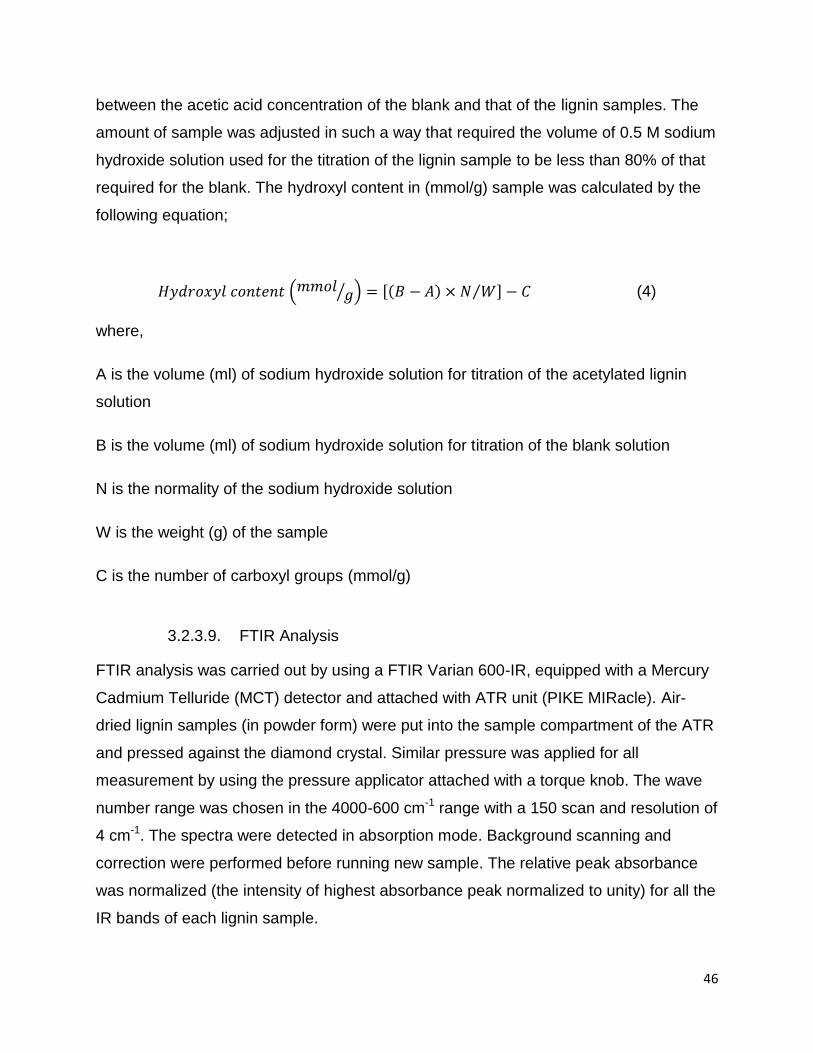
between the acetic acid concentration of the blank and that of the lignin samples. The
amount of sample was adjusted in such a way that required the volume of 0.5 M sodium
hydroxide solution used for the titration of the lignin sample to be less than 80% of that
required for the blank. The hydroxyl content in (mmol/g) sample was calculated by the
following equation;
(4)
where,
A is the volume (ml) of sodium hydroxide solution for titration of the acetylated lignin
solution
B is the volume (ml) of sodium hydroxide solution for titration of the blank solution
N is the normality of the sodium hydroxide solution
W is the weight (g) of the sample
C is the number of carboxyl groups (mmol/g)
3.2.3.9. FTIR Analysis
FTIR analysis was carried out by using a FTIR Varian 600-IR, equipped with a Mercury
Cadmium Telluride (MCT) detector and attached with ATR unit (PIKE MIRacle). Air-
dried lignin samples (in powder form) were put into the sample compartment of the ATR
and pressed against the diamond crystal. Similar pressure was applied for all
measurement by using the pressure applicator attached with a torque knob. The wave
number range was chosen in the 4000-600 cm-1 range with a 150 scan and resolution of
4 cm-1. The spectra were detected in absorption mode. Background scanning and
correction were performed before running new sample. The relative peak absorbance
was normalized (the intensity of highest absorbance peak normalized to unity) for all the
IR bands of each lignin sample.
47
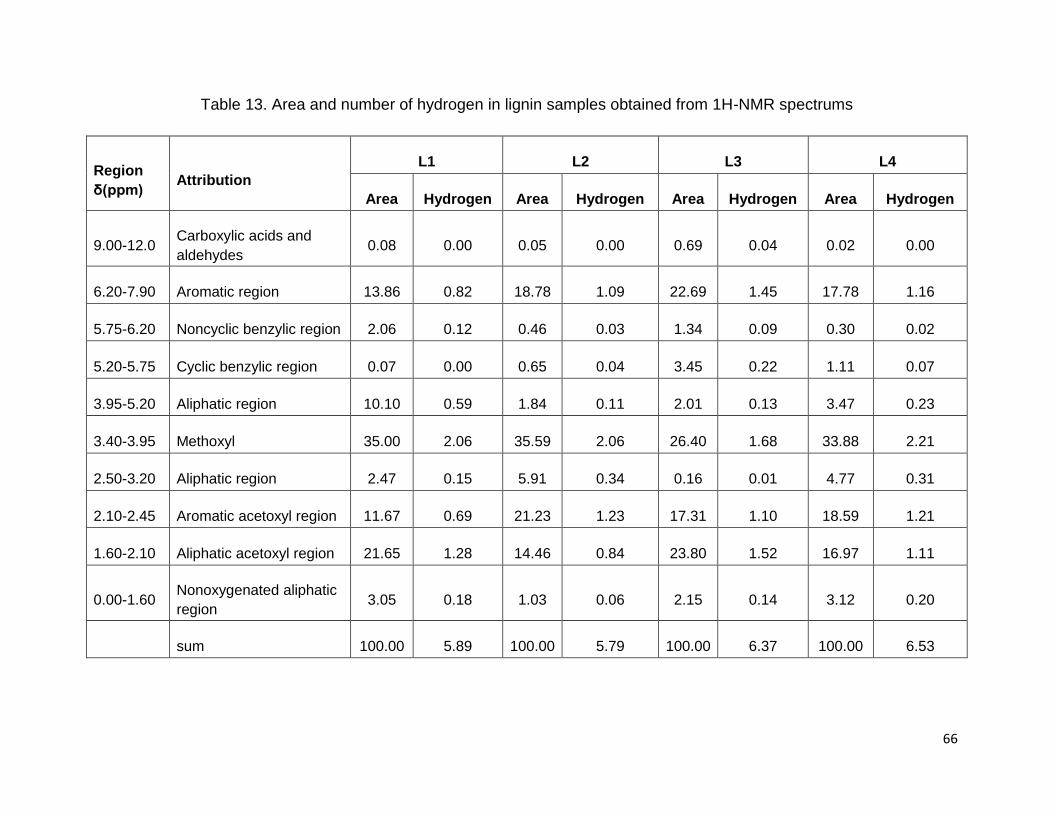
3.2.3.10. 1H-NMR Spectroscopy
The 1H-NMR of acetylated lignins was carried out by a Varian Unity Plus 500 MHz
spectrometer following the method described by (Li and Lundquist, 1994). The
experiment was operated in the quadrature mode. Typical 1H-NMR data points were
recorded by accordance with the acquisition time of 4.0 s, number of scans of 126 and
relaxation time of 1.0 s at room temperature. The lignin was acetylated by a 1:1 pyridine
and acetic anhydride solution at 90°C for 3 h in a sealed flask.
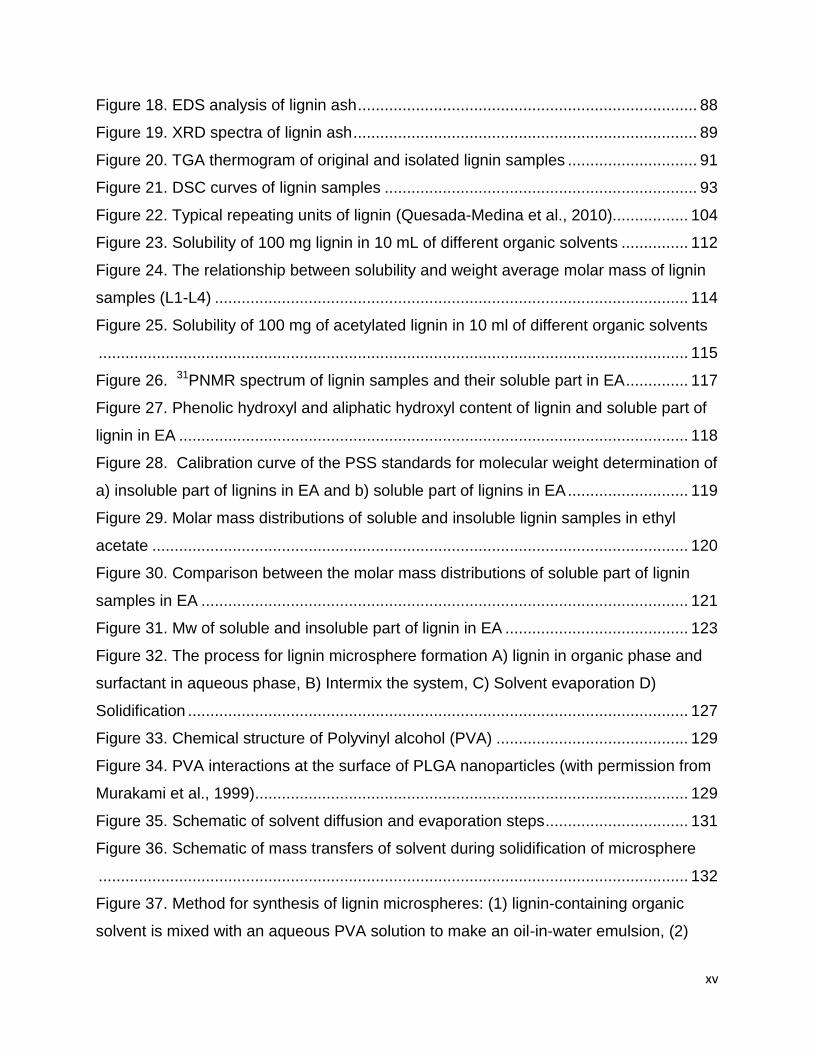
3.2.3.11. 31PNMR Spectroscopy
Total aliphatic hydroxyl, phenolic hydroxyl and carboxyl groups, and G/S/H ratio of lignin
samples were determined by quantitative 31P NMR using published procedures (Cateto
et al., 2008; Granata and Argyropoulos, 1995). A proper solvent solution of pyridine and
CDCl3 (1.6/1, v/v) was prepared for dissolving lignin and other reagents. Phosphitylation
of lignin samples was performed with using 2-chloro-4,4,5,5-tetramethyl-1,3,2-
dioxaphospholane (TMDP) as a phosphitylating reagent (Figure 7) (Yáñez-S et al.,
2014). The internal standard solution (cholesterol, 85 mg /mL) and the relaxation
reagent solution (chromium(III) acetylacetonate, 5.6 mg/mL) were prepared with the
same solvent solution. 40.0 mg of oven-dried lignin was dissolved in 500 µL of the
solvent solution in a sealed vial; this was followed by the addition of 100 µL of the
internal standard and 50 µL of relaxation solution. Then, 100 µL of the phosphitylation
reagent was added, and the vial was shaken to ensure a homogeneous mixture. After
derivatization, the resulting solution was transferred to a 3-mm tube, and the 31P-NMR
spectrum was recorded by a Varian Unity Plus 600 MHz spectrometer.
48
Figure 7. The reaction of lignin with 2-chloro-4,4,5,5-tetramethyl-1,3,2-dioxaphospholane (TMDP) for quantitative 31P NMR analysis (Adopted from Yáñez-S et al., 2014)
3.2.3.12 Solubility of lignin in alkaline solution
A Varian Cary 5000 UV-Vis NIR spectrophotometer (Agilent Technologies, CA, USA)
was employed to determine the solubility of lignin in alkaline solution. 1.0 g oven-dried
lignin sample was dissolved in 30 mL NaOH with a series of concentrations ranging
from 0 mol/L to 0.5 mol/L. The solutions were shaken for overnight, and soluble part
was separated by using a centrifuge at 9000rpm for 15 min. Then, 0.5mL of the
supernatant was collected and diluted to an appropriate concentration to detect with UV
Spectrophotometer.
3.2.3.13 High Performance Size Exclusion Chromatography (HPSEC)
Molecular mass distributions of four lignin samples were analyzed by the method
described by Gonzalez 2000 (González et al., 2000). In this method High Performance
Size Exclusion Chromatography (HPSEC) was performed to determine the molecular
mass distribution of lignin sample in alkaline solution. HPSEC of different lignins was
49
carried out with a DIONEX DX600 chromatograph equipped with an UV detector and a
PSS MCX column (1000 ˚A, 300 × 8 mm). The UV detection was carried out at the
wavelength of 280 nm at room temperature (25 °C). UV detector was adjusted at 280
nm due to the maximum UV absorption of the lignins. This wavelength was used to
estimate for molar concentration of the aromatic rings. The injection was 25 μL. Eluent
(0.1 M NaOH solution) was prepared with deionized water (Millipore water from a
purification system). Sodium poly(styrene sulfonate) which is known to exhibit a similar
behavior with lignin was used for calibration of the column. Sodium poly(styrene
sulfonates) standards (6520, 4230, 1830 and 1100 daltons) were purchased from
Polymer Standard Services - USA Incorporation. Calibration curve was prepared by
adding 10 mg of each polystyrene standard in 10 mL water. Each lignin sample was
prepared by dissolving 10 mg of the dry lignin in 100 mL of 0.1 M sodium hydroxide
solution. The stationary phase of this column is sulfonated styrene-divinylbenzene
copolymer-network which is appropriate for carrying out HPSEC experiments over the
whole 7-13 pH range. The number and weight average molecular weights were
calculated based on the ASTM D5296 –11.
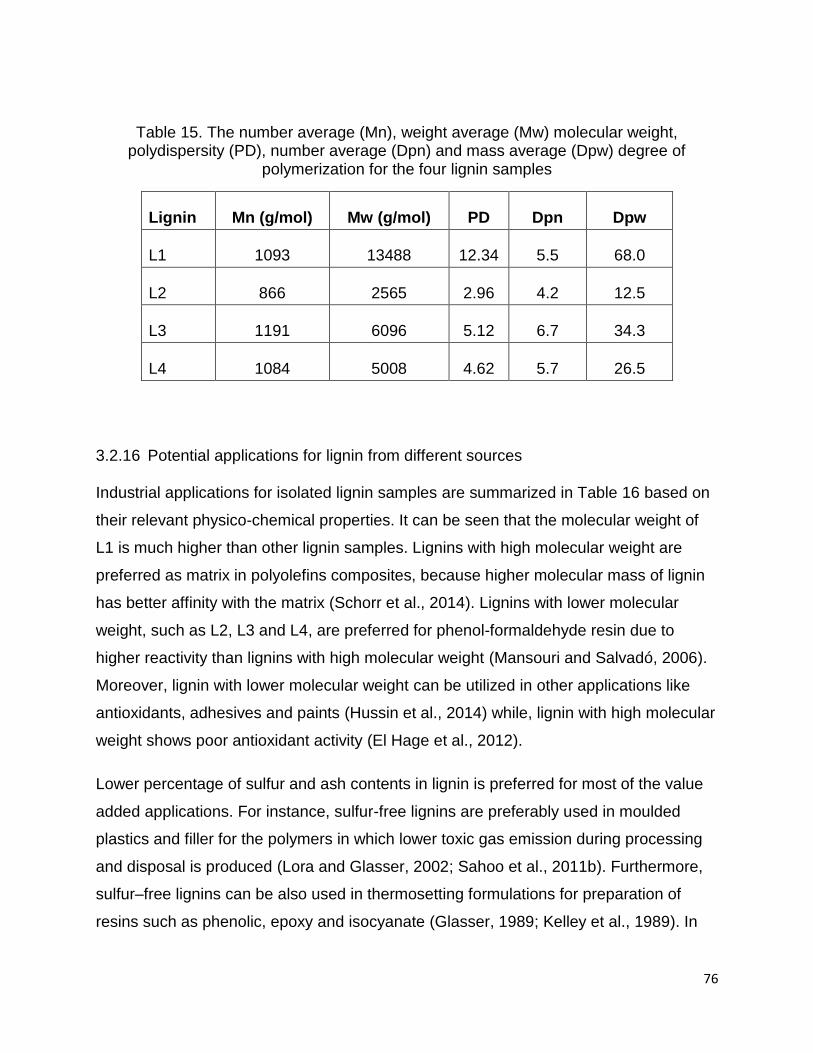
3.2 Results and discussion
3.2.3 The yield percentage of isolated Lignin
The amount of lignin isolated from the bioethanol biorefinery residues was about 38%
on dry weight of lignocellulosic residue and about 27% of black liquor solids. Yield of
lignin from the residues is of course an important consideration, as it will affect the
economics of the recovery process. The percentage of extracted lignin from the black
liquor falls within the expected range of 20 to 40% lignin based on the dry content
(Vishtal and Kraslawski, 2011a).
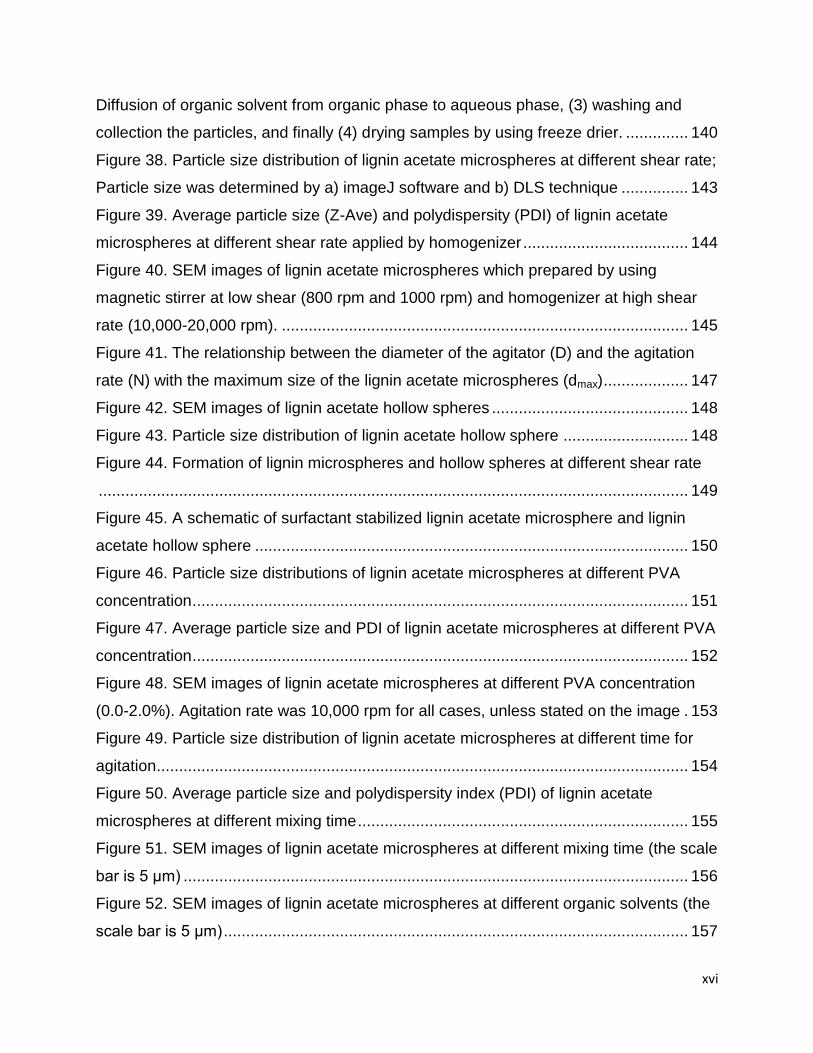
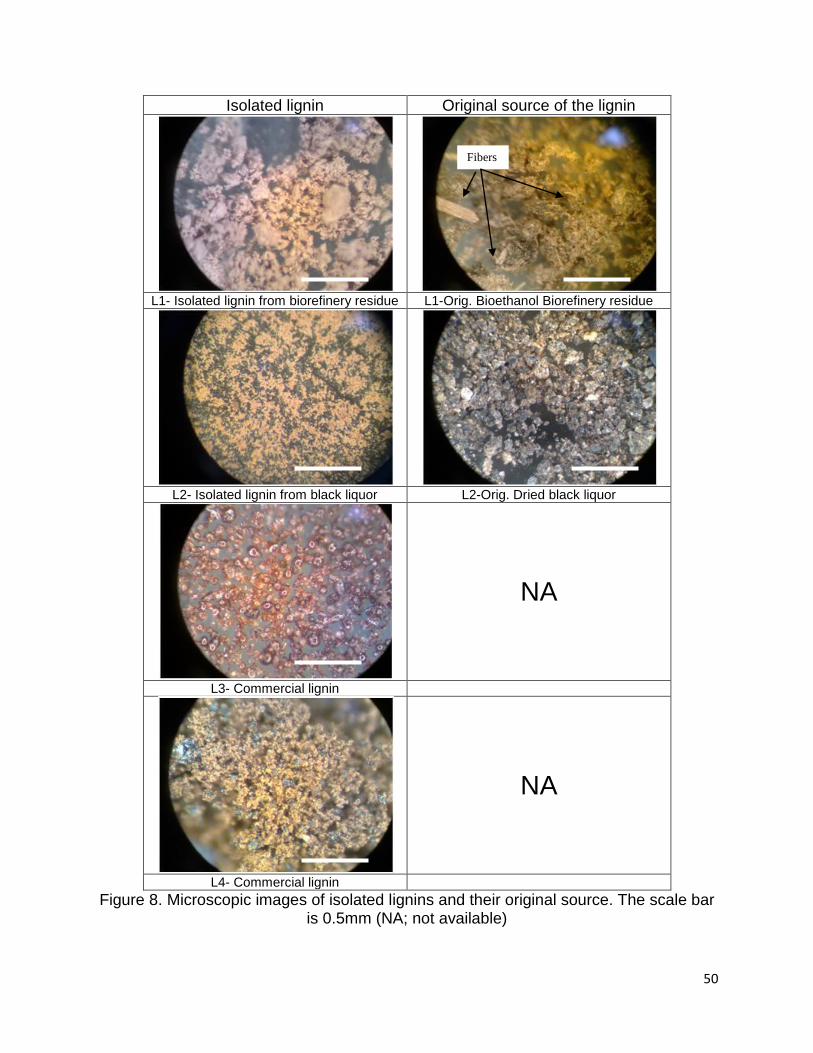
3.2.4 Optical microscopic images of isolated lignins and their origins
The optical microscopic images showed obvious differences between the isolated
lignins and their origins (Figure 8). A comparison between the residues from bioethanol
biorefinery and pulping industry show that the steam explosion process generates more
fibers than kraft process.
50
Isolated lignin Original source of the lignin
L1- Isolated lignin from biorefinery residue L1-Orig. Bioethanol Biorefinery residue
L2- Isolated lignin from black liquor L2-Orig. Dried black liquor
NA
L3- Commercial lignin
NA
L4- Commercial lignin
Figure 8. Microscopic images of isolated lignins and their original source. The scale bar is 0.5mm (NA; not available)
Fibers
51
3.2.5 Analysis of lignin
The composition of the lignin samples can be seen in Table 7. There are some
noticeable differences among the samples, with the industrial lignins (L3 & L4)
possessing higher amounts of Klason (or acid insoluble) lignin and lower amounts of
acid-soluble lignin than the lignins isolated from the industrial residues (L1 & L2). The
percentage of acid-soluble lignin was calculated based on the absorbance at 205nm
and Eq. 3 (Figure 9). Schorr et al. 2014, reported the Klason’s lignin content for Indulin
AT to be 93%, similar to L3 sample.
The amount of inorganics (ash) are quite low (< 2%) for all samples with the exception
of the L3, the commercial softwood kraft lignin which contains more than 4%. A similar
ash content of 3.59% was reported by Schorr et al 2014. L1 has the lowest ash content
of the four samples. Unlike the L2, L3, and L4 derived as residue from chemical pulping
processes, L1 is derived from residue from a bioethanol process. In the bioethanol
process a steam explosion pretreatment followed by enzymatic hydrolysis and
fermentation is employed and hence there is no add of chemicals/salts to the process.
Hence the low ash in L1 may be favorable for certain applications as ash is considered
a contaminant and depending on which elements are present, could cause negative
The bulk density of lignin samples isolated from bioethanol biorefinery (L1) was 380
kg/m3 and that for kraft lignin (L2) was 420 kg/m3. The bulk density for two commercial
lignins was 460 kg/m3 (L3) and 550 kg/m3 (L4). The bulk density of soda lignin was
reported 680 kg/m3, which was higher than the values reported for soda lignins (450-
500 kg/m3) (Mousavioun and Doherty, 2010).
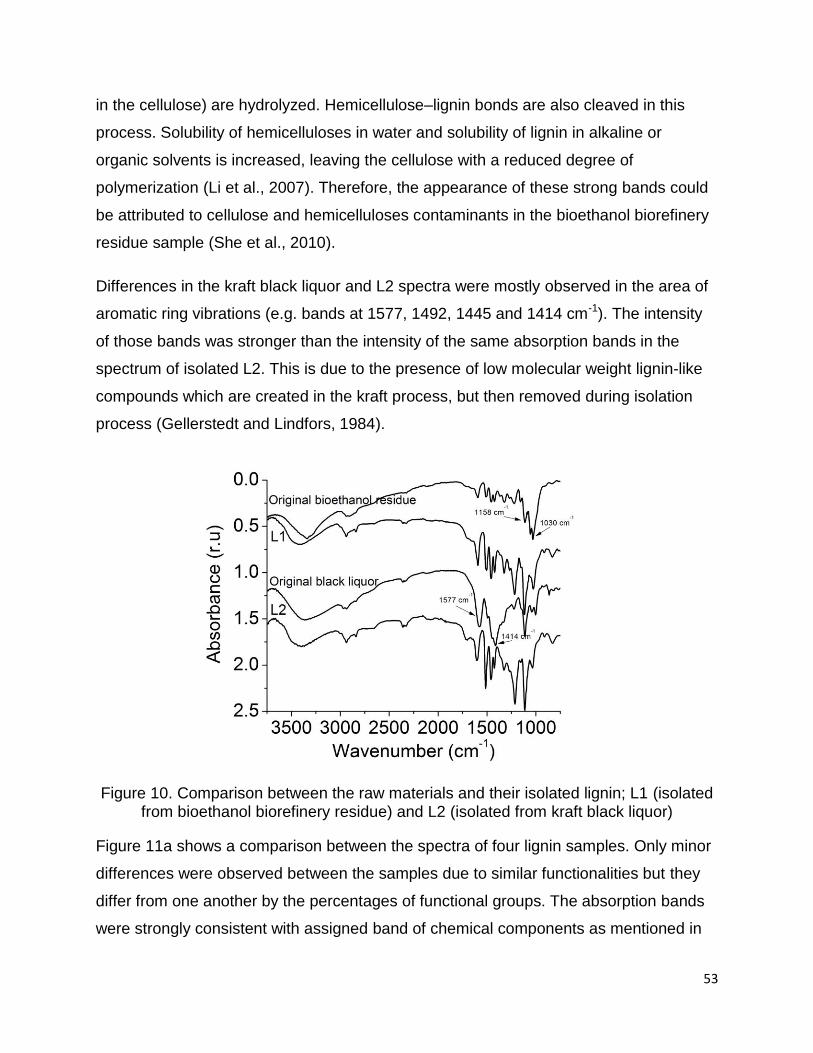
3.2.7 FTIR Spectroscopy
FTIR spectra of the two raw materials (bioethanol biorefinery residue and black liquor)
and their isolated lignins (L1 and L2) are exhibited in Figure 10. Significant differences
were observed between the spectra of two raw materials and their isolated lignins.
In the L1 spectrum, a considerable decrease was observed in the absorption intensities
at the bands 1158 cm-1, 1055 cm-1 and 1030 cm-1 after isolation from bioethanol
biorefinery residue. The absorption bands in the bioethanol biorefinery residue at 1158
cm-1 show a C–O–C asymmetric vibration and 1055 cm-1 and 1030 cm-1 indicate C−O
stretch of cellulose (glycosidic linkages) (Adsul et al., 2011; Corredor et al., 2009). In the
steam explosion process glycosidic bonds in the hemicelluloses (and to a lesser extent
53
in the cellulose) are hydrolyzed. Hemicellulose–lignin bonds are also cleaved in this
process. Solubility of hemicelluloses in water and solubility of lignin in alkaline or
organic solvents is increased, leaving the cellulose with a reduced degree of
polymerization (Li et al., 2007). Therefore, the appearance of these strong bands could
be attributed to cellulose and hemicelluloses contaminants in the bioethanol biorefinery
residue sample (She et al., 2010).
Differences in the kraft black liquor and L2 spectra were mostly observed in the area of
aromatic ring vibrations (e.g. bands at 1577, 1492, 1445 and 1414 cm-1). The intensity
of those bands was stronger than the intensity of the same absorption bands in the
spectrum of isolated L2. This is due to the presence of low molecular weight lignin-like
compounds which are created in the kraft process, but then removed during isolation
process (Gellerstedt and Lindfors, 1984).
Figure 10. Comparison between the raw materials and their isolated lignin; L1 (isolated from bioethanol biorefinery residue) and L2 (isolated from kraft black liquor)
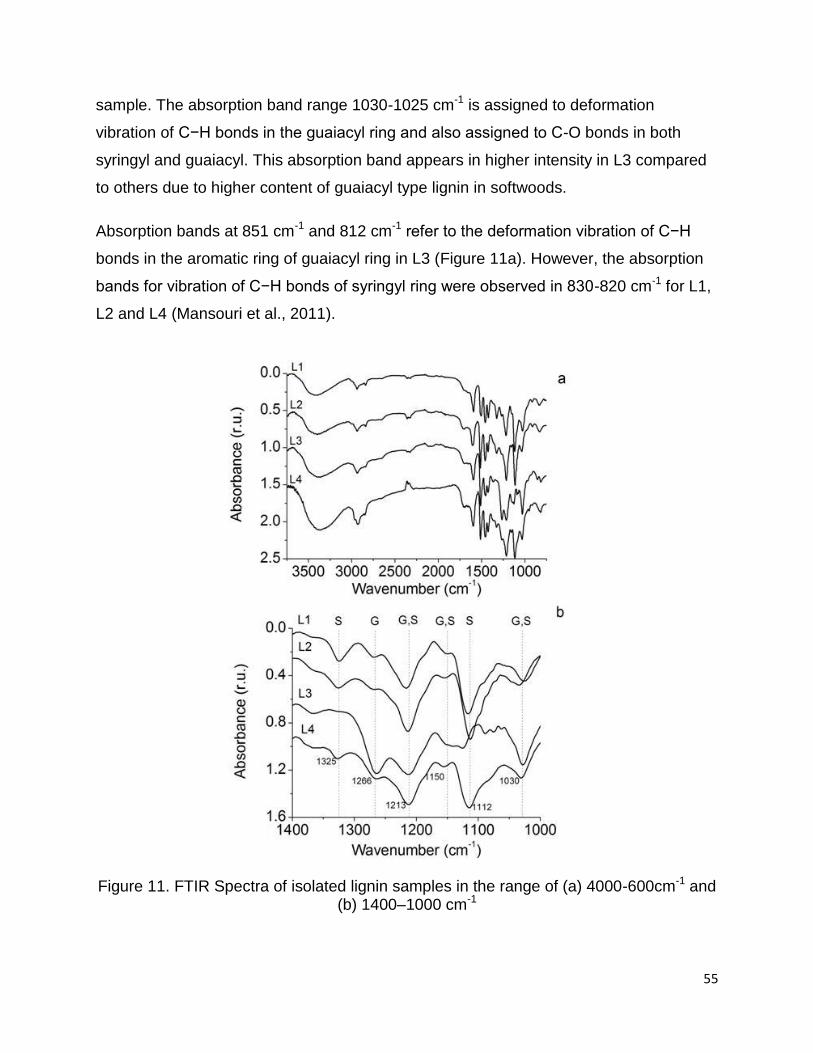
Figure 11a shows a comparison between the spectra of four lignin samples. Only minor
differences were observed between the samples due to similar functionalities but they
differ from one another by the percentages of functional groups. The absorption bands
were strongly consistent with assigned band of chemical components as mentioned in
54
previous literature (Anglès et al., 2003; Derkacheva and Sukhov, 2008; Zhou et al.,
2011). The information regarding corresponding bands is given in Table 8. A wide band
was observed for all isolated lignins in the 3500-3100 cm-1 wavenumber range. This
band typically refers to the presence of hydroxyl groups (alcoholic and phenolic)
involved in hydrogen bonds. The two bands at 2900 cm-1 and 2800 cm-1 correspond to
methyl (−CH3) and methylene (−CH2) groups. The position of the bands at 1705 cm-1
and 1595 cm-1 can be attributed to non-conjugated and conjugated carbonyl groups
which were observed in all lignin spectra. The carboxyl groups in lignin samples are
represented between 1750 and 1550 cm−1 (Gosselink et al., 2004b). Absorption bands
at 1595 cm-1 and 1513 cm-1 were assigned to aromatic skeletal vibration of lignins
(Camargo et al., 2012; Zhou et al., 2011). In the 1460-1420 cm-1 wavenumber range,
two intense bands were observed. These bands corresponded to C−H stretching band
(methyl and methylene) and C−H in-plane deformation with aromatic ring stretching
(Awal and Sain, 2011; She et al., 2010; Zhou et al., 2011).
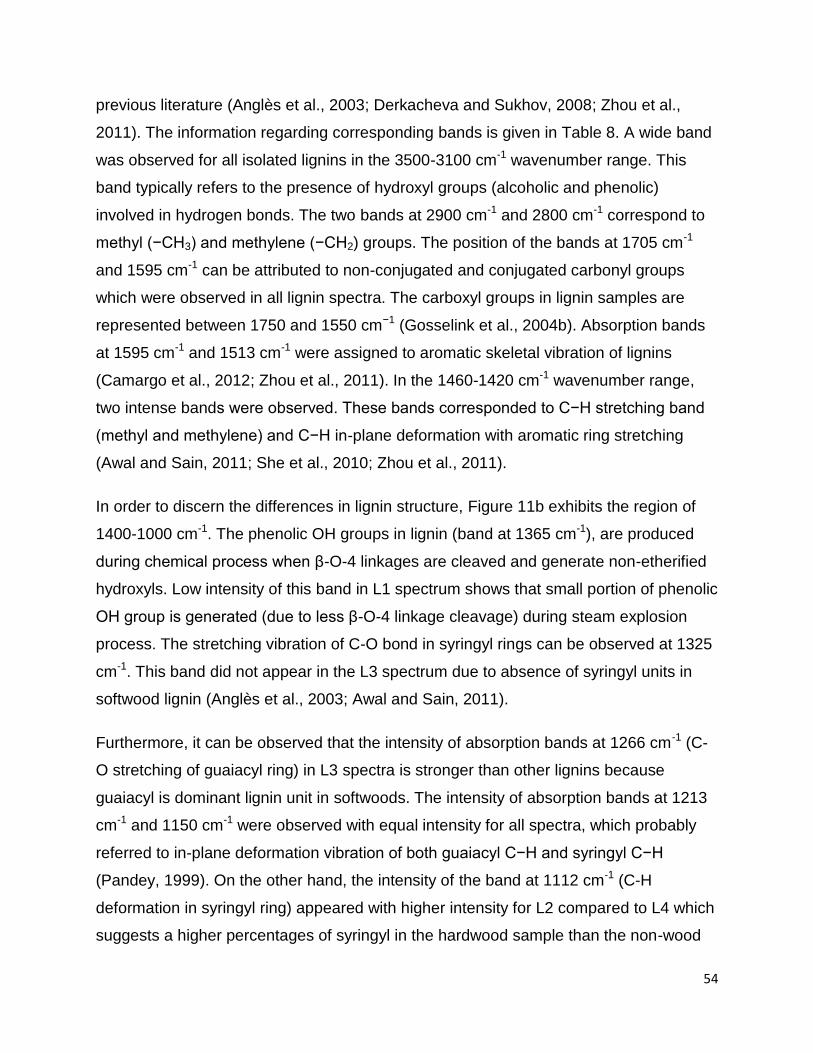
In order to discern the differences in lignin structure, Figure 11b exhibits the region of
1400-1000 cm-1. The phenolic OH groups in lignin (band at 1365 cm-1), are produced
during chemical process when β-O-4 linkages are cleaved and generate non-etherified
hydroxyls. Low intensity of this band in L1 spectrum shows that small portion of phenolic
OH group is generated (due to less β-O-4 linkage cleavage) during steam explosion
process. The stretching vibration of C-O bond in syringyl rings can be observed at 1325
cm-1. This band did not appear in the L3 spectrum due to absence of syringyl units in
softwood lignin (Anglès et al., 2003; Awal and Sain, 2011).
Furthermore, it can be observed that the intensity of absorption bands at 1266 cm-1 (C-
O stretching of guaiacyl ring) in L3 spectra is stronger than other lignins because
guaiacyl is dominant lignin unit in softwoods. The intensity of absorption bands at 1213
cm-1 and 1150 cm-1 were observed with equal intensity for all spectra, which probably
referred to in-plane deformation vibration of both guaiacyl C−H and syringyl C−H
(Pandey, 1999). On the other hand, the intensity of the band at 1112 cm-1 (C-H
deformation in syringyl ring) appeared with higher intensity for L2 compared to L4 which
suggests a higher percentages of syringyl in the hardwood sample than the non-wood
55
sample. The absorption band range 1030-1025 cm-1 is assigned to deformation
vibration of C−H bonds in the guaiacyl ring and also assigned to C-O bonds in both
syringyl and guaiacyl. This absorption band appears in higher intensity in L3 compared
to others due to higher content of guaiacyl type lignin in softwoods.
Absorption bands at 851 cm-1 and 812 cm-1 refer to the deformation vibration of C−H
bonds in the aromatic ring of guaiacyl ring in L3 (Figure 11a). However, the absorption
bands for vibration of C−H bonds of syringyl ring were observed in 830-820 cm-1 for L1,
L2 and L4 (Mansouri et al., 2011).
Figure 11. FTIR Spectra of isolated lignin samples in the range of (a) 4000-600cm-1 and (b) 1400–1000 cm-1
56
Table 8. Fourier transform infrared of four lignin samples
57
Based on the discussion above, Table 9 summarized the important differences between
the raw materials and the isolated lignins. It can be seen a significant difference
between the functional groups of the raw materials. The major chemical compound in
bioethanol biorefinery residue was found to be cellulosic materials, while low molecular
weight lignin-like materials were domain chemical compounds in black liquor. However,
isolated lignins from both raw materials and commercial lignins showed minor
differences in their chemical structure mostly due to absence of syringyl units.
Table 9. Summary of important bands
Sample Band positions (cm-1) Indicating
Bioethanol biorefinery
residue
1030, 1055, 1158 Glycosidic bonds
Black liquor 1414, 1445, 1492, 1577 Low molecular weight lignin-
like compounds
L1 1326, 1268, 1112 Syringyl, Guaiacyl
L2 1326, 1268, 1112 Syringyl, Guaiacyl
L3 1266 Guaiacyl
L4 1325, 1266, 1112 Syringyl, Guaiacyl
3.2.8 Elemental composition of lignin
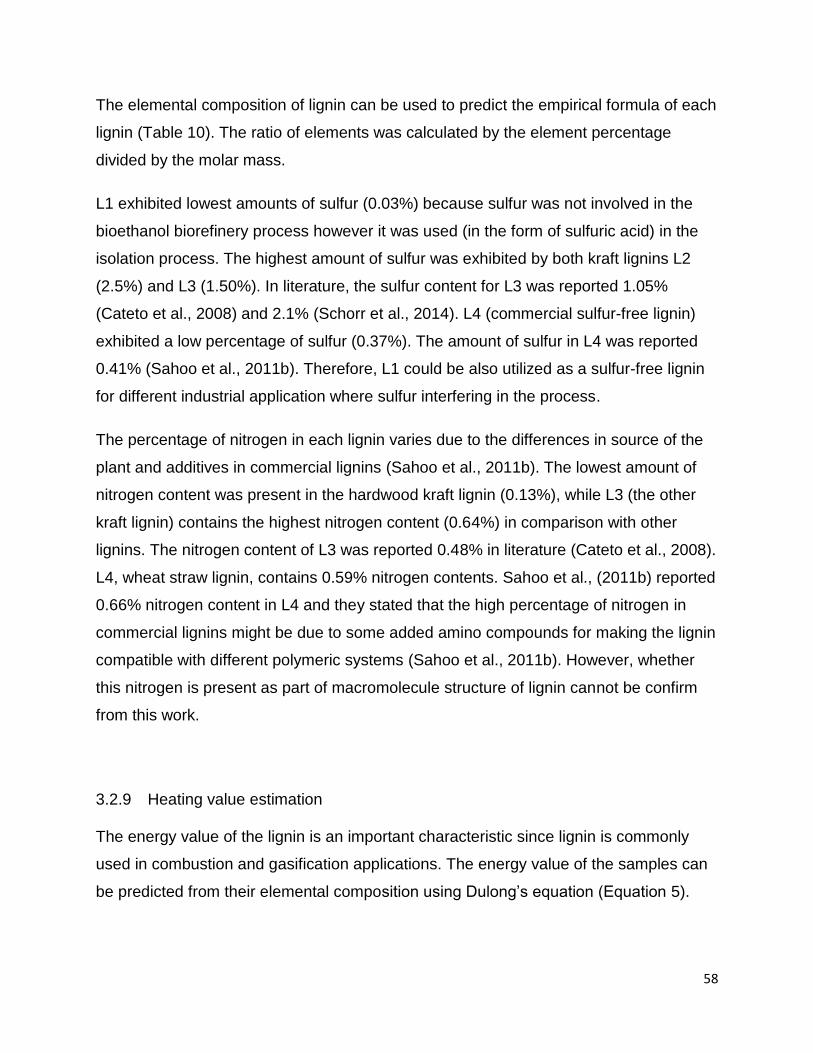
The elemental compositions of the four lignin samples can be found in Table 10. Lignin
L2 (hardwood lignin) has lowest carbon and highest oxygen content, while lignin L3
(softwood lignin) has highest carbon and lowest oxygen content. This could be related
to the number of syringyl groups and consequently to the methoxyl content in lignin
molecules (Schorr et al., 2014). Lignins with higher number of methoxyl groups contain
lower percentage by weight of carbon and higher percentage by weight of oxygen.
58
The elemental composition of lignin can be used to predict the empirical formula of each
lignin (Table 10). The ratio of elements was calculated by the element percentage
divided by the molar mass.
L1 exhibited lowest amounts of sulfur (0.03%) because sulfur was not involved in the
bioethanol biorefinery process however it was used (in the form of sulfuric acid) in the
isolation process. The highest amount of sulfur was exhibited by both kraft lignins L2
(2.5%) and L3 (1.50%). In literature, the sulfur content for L3 was reported 1.05%
(Cateto et al., 2008) and 2.1% (Schorr et al., 2014). L4 (commercial sulfur-free lignin)
exhibited a low percentage of sulfur (0.37%). The amount of sulfur in L4 was reported
0.41% (Sahoo et al., 2011b). Therefore, L1 could be also utilized as a sulfur-free lignin
for different industrial application where sulfur interfering in the process.
The percentage of nitrogen in each lignin varies due to the differences in source of the
plant and additives in commercial lignins (Sahoo et al., 2011b). The lowest amount of
nitrogen content was present in the hardwood kraft lignin (0.13%), while L3 (the other
kraft lignin) contains the highest nitrogen content (0.64%) in comparison with other
lignins. The nitrogen content of L3 was reported 0.48% in literature (Cateto et al., 2008).
Table 11 shows the total hydroxyl and carboxyl content which were determined by 31P-
NMR spectroscopy and titration methods. Cateto, et al., (2008) reported that the values
of the total hydroxyl content of four different technical lignins determined by titration and
31PNMR were in good agreement (Cateto et al., 2008). The 31P-NMR spectroscopy
technique was found to be a very powerful tool for characterization of phenolic hydroxyl
(p-hydroxyphenyl, guaiacyl, and syringyl structures), aliphatic hydroxyl and carboxylic
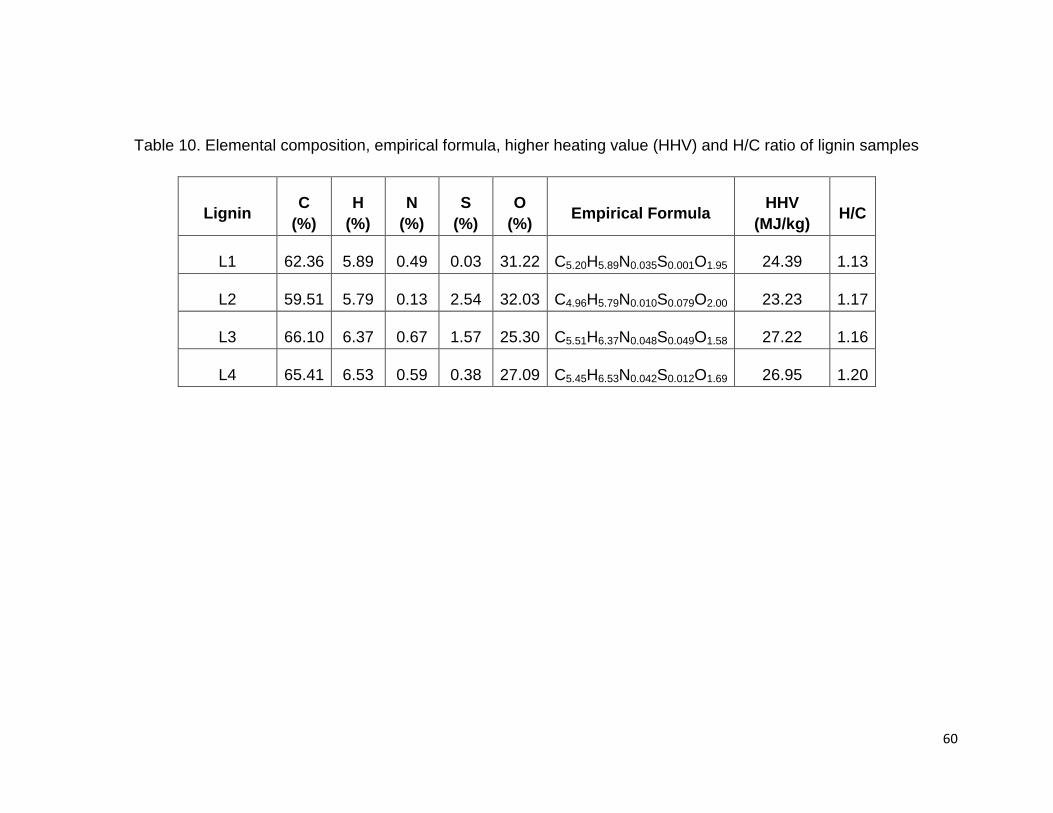
acid groups present in the lignin samples (Cateto et al., 2008). In 31P-NMR spectrum
(Figure 12), the signals in the range of 149.2-146.0, 144.3-137.2 and 135.6-133.7 ppm
are associated with aliphatic, phenolic and carboxylic acid units, respectively (Monteil-
Rivera et al., 2013; Zhang et al., 2013a).
Carboxyl content of L2 was highest (0.90 mmol/g by titration and 0.82 mmol/g by 31P-
NMR) compared to the other lignin samples. Oxidation reactions that may occur during
the pulping process cause the lignin structure to acquire carboxyl groups. A study
showed that low dosage of oxidant can increase the content of carboxyl in alkali lignin,
and high dosage of oxidant may cleave the C-C bond in side chain of phenylpropane
unit and further be oxidized into carboxyl (Zhao and Ouyang, 2012). Therefore, carboxyl
content can be an estimation of the degradation degree of lignin macromolecule. It can
be suggested that L2 is the most degraded from its original form of the four lignins
tested in this study.
Both titration and 31P-NMR results showed that L1 contains the lowest and L2 the
highest hydroxyl content in comparison with other lignin samples. The total hydroxyl
content of the commercial L3 lignin was in close agreement with values found in the
literature which was 7.32 mmol/g by titration and 6.85 mmol/g by 31P-NMR (Cateto et
al., 2008). Number of hydroxyl groups is one of the most characteristic functions in
lignin which shows the reactivity in lignin macromolecular chemistry (Cateto et al.,
2008). Lignin as a polymer with a fair amount of hydroxyl (phenolic and aliphatic) and
carboxyl groups, has the potential to replace polyols in polyurethane production (Pan
and Saddler, 2013).
62
31P-NMR results also revealed a significant difference between the number of aromatic
hydroxyl groups, while a similar number of aliphatic hydroxyl for lignin samples (Table
11). The differences in the number of phenolic hydroxyl related to the severity of the
extraction method. In the kraft and soda processes, β-O-4 and α-O-4 linkages are
cleaved and produce non-etherified phenolic hydroxyl groups in lignin. In steam
explosion separation, less chemicals are utilized during the process and as a result the
lignin undergoes less bond cleavage. In result, L1 shows less phenolic OH group in
comparison with kraft and soda lignins.
Table 11. Data obtained for the total hydroxyl and carboxyl content with titration and 31P-NMR, and total phenolic and aliphatic hydroxyl contents with 31P-NMR (unit mmol/g)
Titration 31P-NMR
Lignin Total
OH
Total
COOH
Phenolic
OH
Aliphatic
OH
Total
OH
Total
COOH
L1 4.02 0.37 1.51 2.22 3.73 0.54
L2 6.50 0.90 6.91 2.35 9.26 0.82
L3 6.32 0.57 4.00 2.59 6.59 0.20
L4 4.25 0.55 2.28 2.47 4.73 0.22
63
Figure 12. 31P-NMR spectra of four lignin samples; Lignin units are syringyl (S), guaiacyl (G) and p-hydroxyphenyl (H)
3.2.11 Determination of G/H/S ratio by 31PNMR
The 31PNMR analysis of lignin samples was carried out to determine the ratio of lignin
units of four lignin samples. Table 12 represents the molar ratio of each
phenylpropanoid type (G, S and H) in four lignin samples. The ratio of each unit was
measured by calculating the area under each band and internal standard. The signals at
143.1-142.4 ppm, 140.0-138.8 ppm, and 138.2-137.2 ppm are attributed to syringyl,
guaiacyl and p-phenylpropane units, respectively.
The percentage of phenylpropanoid units in lignin structure is different based on the
plants type (softwoods, hardwoods and non-woods) (Telmo and Lousada, 2011). The
ratio of phenylpropanoid units in L1 and L4 lignins varies, containing all three
precursors. In general, the content of p-hydroxyphenyl in annual crops (L1 and L4) is
higher than softwoods and hardwoods. L2 (hardwood lignin) is primarily comprised
64
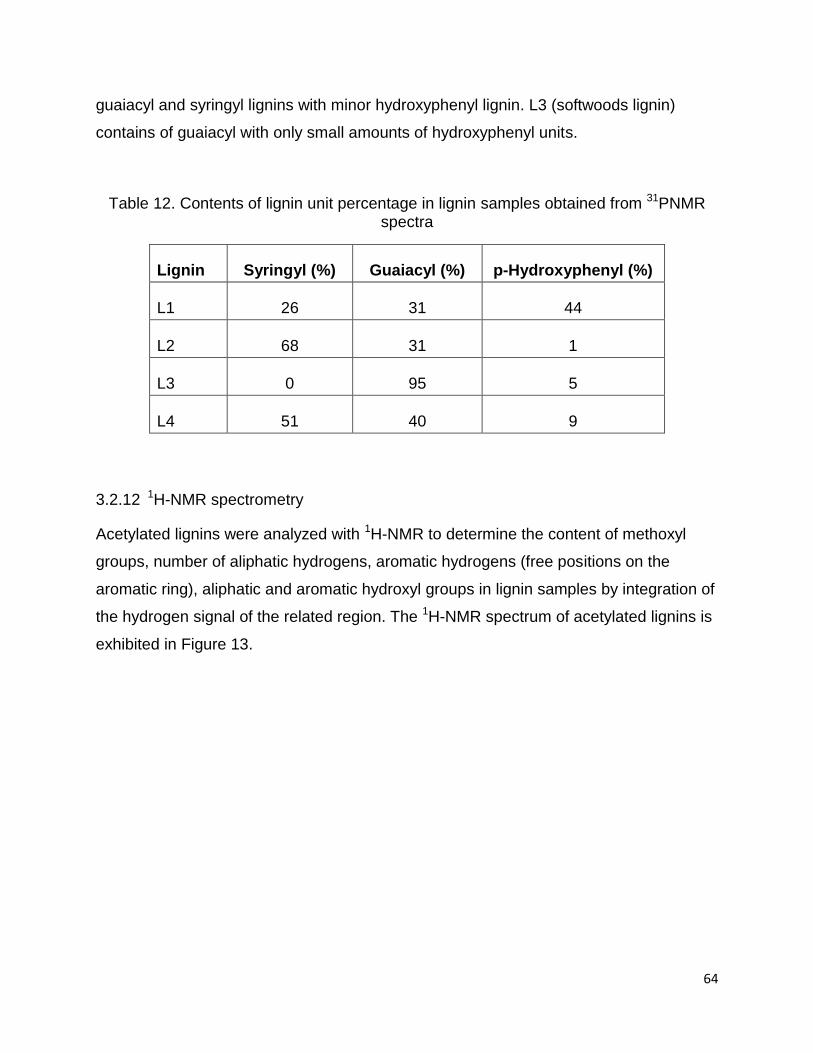
guaiacyl and syringyl lignins with minor hydroxyphenyl lignin. L3 (softwoods lignin)
contains of guaiacyl with only small amounts of hydroxyphenyl units.
Table 12. Contents of lignin unit percentage in lignin samples obtained from 31PNMR spectra
From C9-formula, the double bonds equivalent (DBE) was also found for each lignin
sample. The degree of unsaturation was estimated according to the following equation
(Robert et al., 1984);
CaHbOcSd :
(6)
DBE-values revealed the number of double bonds, the presence of the aromatic ring
together with the degree of inter-unit linkages in the phenylpropanoid lignin units. The
calculated DBE in Table 14 shows that isolated lignin from bioethanol biorefinery
residue (L1) contains more unsaturated bonds than the kraft and soda lignin samples.
The lower DBE of lignin can be attributed to the cleavage of β-aryl ether bonds and to
the formation of free phenolic hydroxyl groups (Mansouri and Salvadó, 2006; Robert et
al., 1984). The DBE value for milled wood lignin from spruce was reported to be 5.36 by
Mansouri et al. (2006). Cracking reactions may occur during pulping treatment of kraft
and soda which causes double bonds in the lignin structure (Anglès et al., 2003).
69
Table 14. C9-formula, expanded C9-formula, double bond equivalent (DBE) and molecular weight for lignin samples
Lignin C9-formula Extended C9-formula DBE Mw
L1 C9H7.64N0.061S0.002O2.52 (OCH3)1.37
5.50 198.4
L2 C9H7.85N0.017S0.144O2.77(OCH3)1.45
5.35 205.0
L3 C9H8.53N0.078S0.080O1.85(OCH3)1.02
5.23 177.8
L4 C9H8.25N0.070S0.019O1.82(OCH3)1.41
5.17 189.0
70
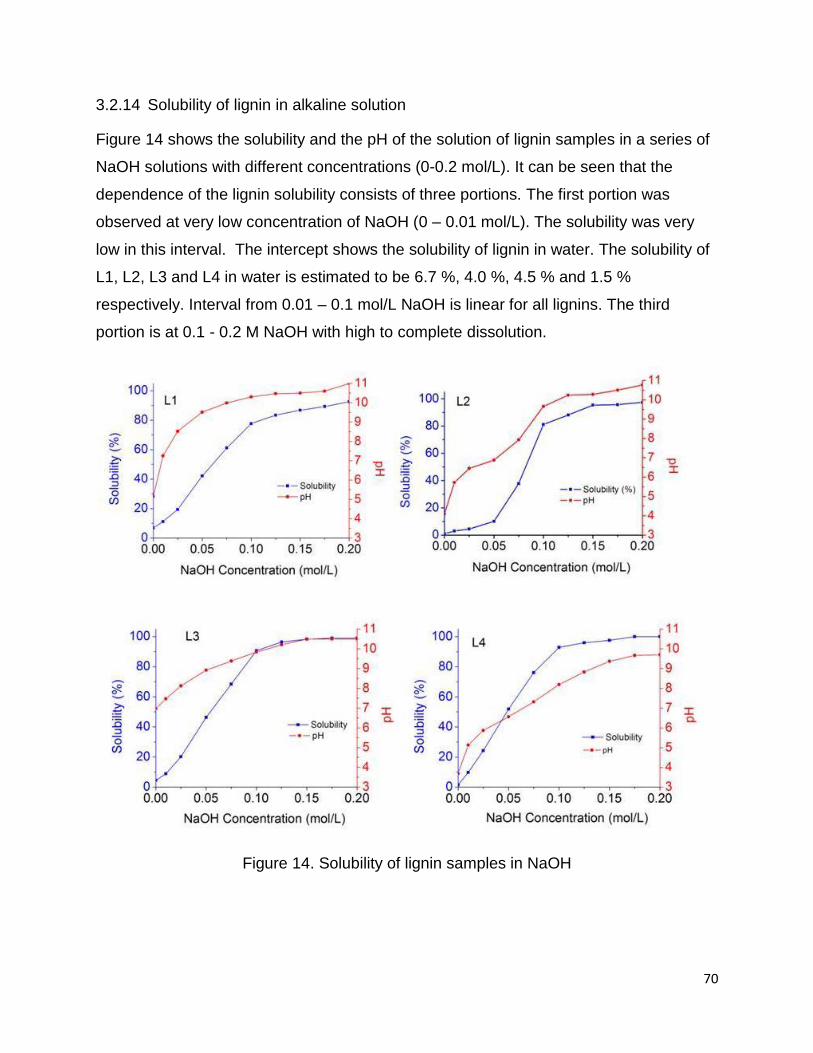
3.2.14 Solubility of lignin in alkaline solution
Figure 14 shows the solubility and the pH of the solution of lignin samples in a series of
NaOH solutions with different concentrations (0-0.2 mol/L). It can be seen that the
dependence of the lignin solubility consists of three portions. The first portion was
observed at very low concentration of NaOH (0 – 0.01 mol/L). The solubility was very
low in this interval. The intercept shows the solubility of lignin in water. The solubility of
L1, L2, L3 and L4 in water is estimated to be 6.7 %, 4.0 %, 4.5 % and 1.5 %
respectively. Interval from 0.01 – 0.1 mol/L NaOH is linear for all lignins. The third
portion is at 0.1 - 0.2 M NaOH with high to complete dissolution.
Figure 14. Solubility of lignin samples in NaOH
71
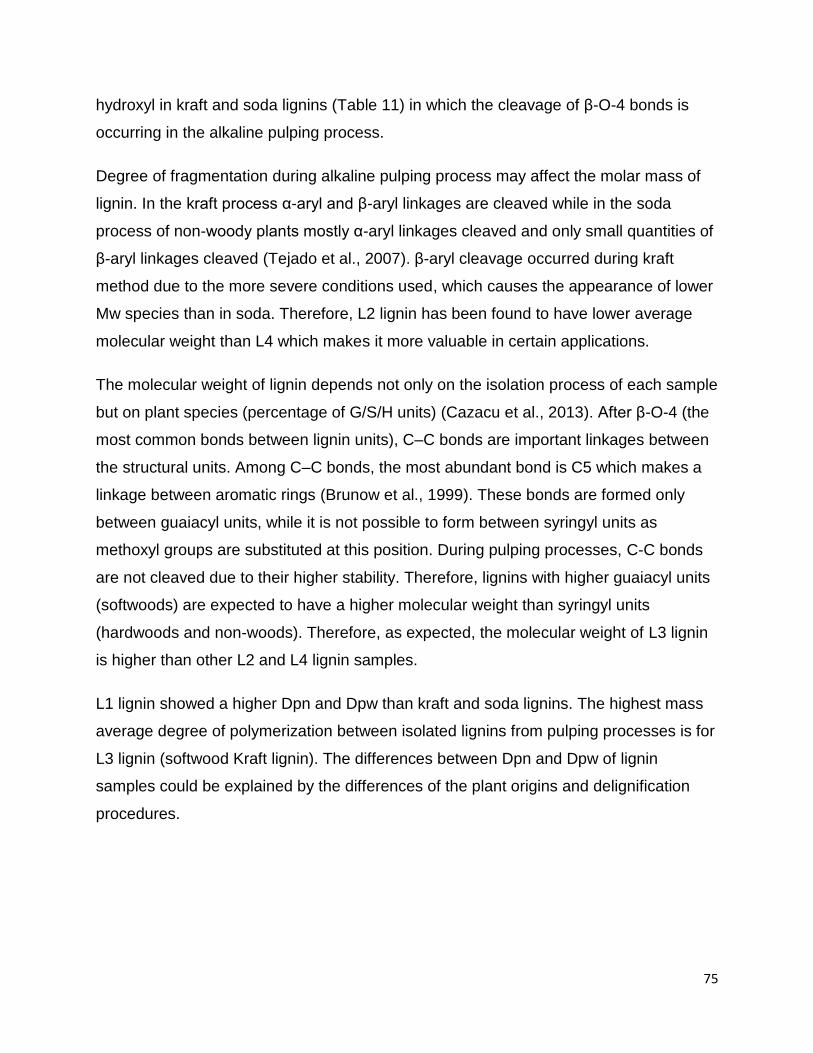
3.2.15 Determination of Molecular Mass Distribution (MMD) of lignin
Molecular masses of the lignin samples were analyzed by alkaline aqueous phase High
Performance Size Exclusion Chromatography (HPSEC). One of the advantages of
using alkaline eluent is the good solubility of lignin in alkaline solution (Bo et al., 2003).
The UV detector was adjusted at 280 nm due to the maximum UV absorption of lignin.
This wavelength was used to estimate the molar concentration of the aromatic rings.
Poly(styrene sulfonate) sodium (PSS) which is known to exhibit a similar behavior to
lignin was used for calibration of the column (González et al., 2000).
Figure 15 shows the molecular weight distributions of sodium polystyrene sulfonates
standards (6520, 4230, 1830 and 1100 daltons).
Figure 15. Molecular weight distributions of standards; Sodium poly(styrene sulfonates) (PSS) with different peak molecular weight of 1100, 1830, 4230 and 6520 daltons
72
The calibration curve of the standards was obtained for determination of lignin
molecular weight (Figure 16).
Figure 16. Calibration curve for the PSS standard solutions
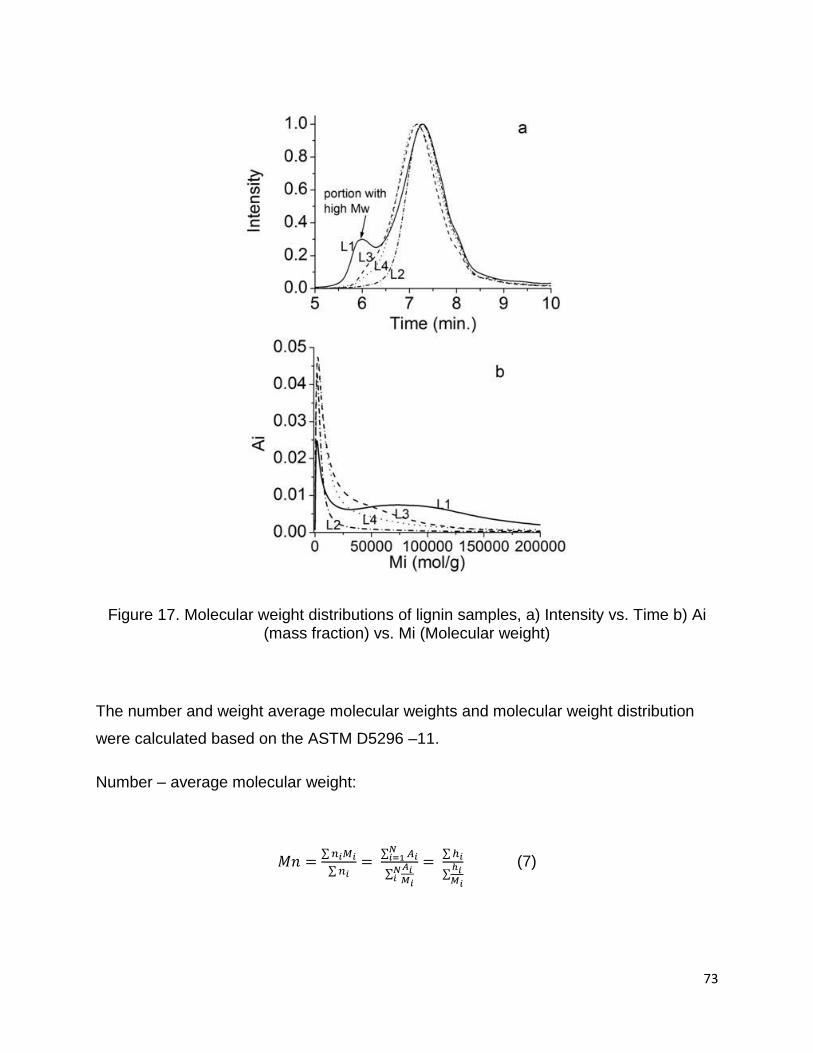
Figure 17a and Figure 17b exhibit the chromatographs of HPSEC and molecular weight
distribution of four lignin samples. All chromatographs show that the molecular weight
distributions of lignins have a normal curve, while L1 lignin has a bimodal curve, which
shows that there are two lignin weight fractions. The fraction with higher molecular
weight was appeared out of the column range.
73
Figure 17. Molecular weight distributions of lignin samples, a) Intensity vs. Time b) Ai (mass fraction) vs. Mi (Molecular weight)
The number and weight average molecular weights and molecular weight distribution
were calculated based on the ASTM D5296 –11.
Number – average molecular weight:
(7)
74
Weight – average molecular weight:
(8)
Polydispersity
(9)
where
ni is the number of molecules of molecular weight Mi
Mi is the molecular weight
Ai is the slice area at each interval of molecular weight Mi
hi is the peak height at each interval of molecular weight Mi
(14.0 (cal/cm3)1/2) (Wang et al., 2011), and hydrolyzed almond shell lignin (14.6
(cal/cm3)1/2) (Quesada-Medina et al., 2010).
106
Table 21. Calculated Δei and Δvi for each lignin based on the number of the functional group and the ratio of G/S/H (*Δvi is the correction factor for divergence in the v value (Ni and Hu, 1995)).
The solubility parameter of lignin acetate was calculated in a similar way as calculated
for lignin by replacing acetate groups with total hydroxyl groups in each unit (Table 22).
We assumed that the all hydroxyl groups were substituted with acetyl groups. The
solubility parameter for ACL1, ACL2, ACL3 and ACL4 was obtained 10.97, 11.32, 11.03
and 11.04 (cal/cm3)1/2, respectively. The calculated solubility parameter of lignin acetate
is lower than its original lignin, because the cohesive energy for hydroxyl group is 26.7
(cal/cm3)1/2, while for acetyl group is 10.5 (cal/cm3)1/2. Therefore, the difference between
solubility parameters between lignin and lignin acetate depends on the number of
hydroxyl groups in lignin molecule.
108
Table 22. Calculated Δei and Δvi for each lignin acetate based on the number of the functional group and the ratio of G/S/H (*Δvi is the correction factor for divergence in the v value)
Based on the Hildebrand theory, lignin (or lignin acetate) shows maximum solubility
when the δ-value of the solvent is close to its own. Conversely, the solubility of the lignin
(or lignin acetate) in the solvent is lower when the difference between the two δ-values
shows greater value. Therefore, based on the solubility parameters of organic solvents
the degree of lignin (or lignin acetate) solubility as predicted by the solubility parameter
theory, should agree with the experimental results.
The δ-value from Hildebrand theory and δh-value from Hansen theory of each solvent
was listed in Table 23 (Burke, 1984). The solubility of lignin and lignin acetate will be
discussed based on the Hildebrand theory in the following section. Hydrogen-bonding
parameter in Hansen theory would be useful in some explanation. The δh-value of
organic solvents such as ethanol or methanol is much higher than other organic
solvents due to hydrogen bonding. It is important to know that lignin with higher hydroxyl
content may dissolve in such solvents with higher δh-value.
Table 23. δ–value (from Hildebrand theory) and δh-value (from Hansen theory) of organic solvents and water (Hansen, 2000; Hildebrand and Scott, 1950)
No. Solvent δ δh
1 Diethyl Ether 7.6 2.2
2 Ethyl Acetate (EA) 9.1 3.5
3 Chloroform 9.2 2.8
4 Tetrahydrofuran (THF) 9.5 3.9
5 Acetone (ACE) 9.8 3.4
6 Dichloromethane (DCM) 9.9 3.5
7 Dioxane 10.0 4.4
8 Pyridine 10.6 2.9
9 Dimethyl sulfoxide (DMSO) 12.9 5.0
10 Ethanol 12.9 9.5
11 Methanol 14.3 10.9
12 Water 23.5 20.6
110
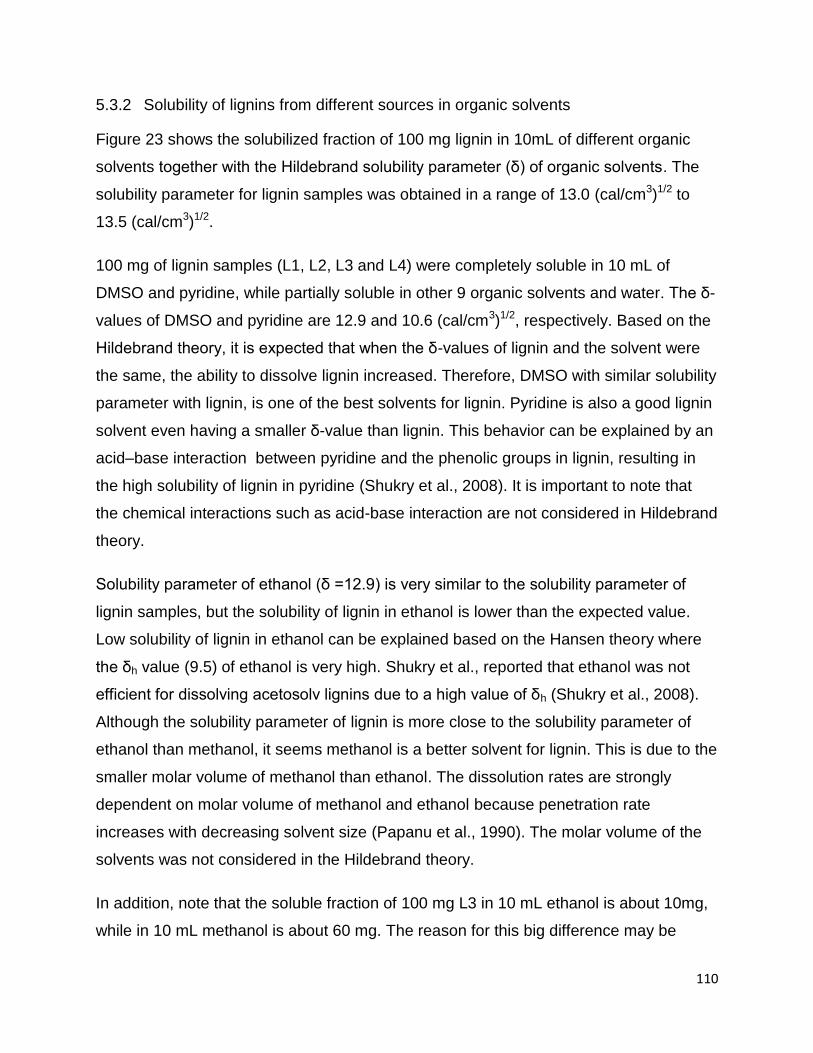
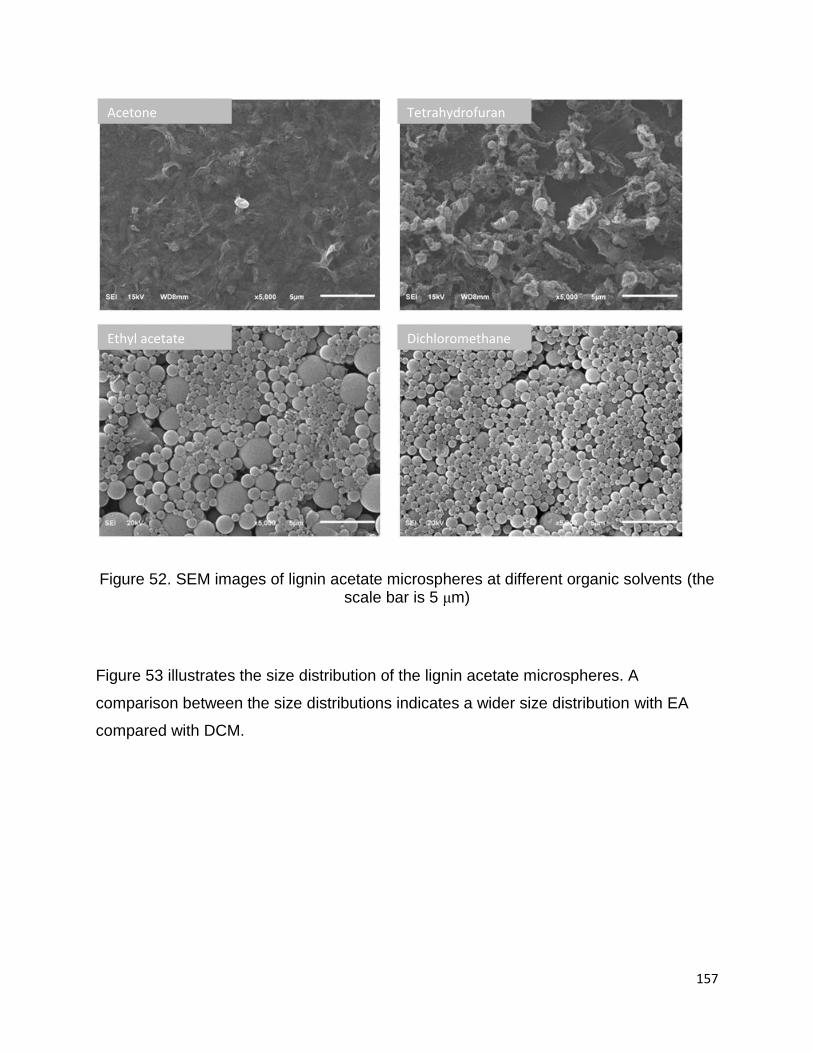
5.3.2 Solubility of lignins from different sources in organic solvents
Figure 23 shows the solubilized fraction of 100 mg lignin in 10mL of different organic
solvents together with the Hildebrand solubility parameter (δ) of organic solvents. The
solubility parameter for lignin samples was obtained in a range of 13.0 (cal/cm3)1/2 to
13.5 (cal/cm3)1/2.
100 mg of lignin samples (L1, L2, L3 and L4) were completely soluble in 10 mL of
DMSO and pyridine, while partially soluble in other 9 organic solvents and water. The δ-
values of DMSO and pyridine are 12.9 and 10.6 (cal/cm3)1/2, respectively. Based on the
Hildebrand theory, it is expected that when the δ-values of lignin and the solvent were
the same, the ability to dissolve lignin increased. Therefore, DMSO with similar solubility
parameter with lignin, is one of the best solvents for lignin. Pyridine is also a good lignin
solvent even having a smaller δ-value than lignin. This behavior can be explained by an
acid–base interaction between pyridine and the phenolic groups in lignin, resulting in
the high solubility of lignin in pyridine (Shukry et al., 2008). It is important to note that
the chemical interactions such as acid-base interaction are not considered in Hildebrand
theory.
Solubility parameter of ethanol (δ =12.9) is very similar to the solubility parameter of
lignin samples, but the solubility of lignin in ethanol is lower than the expected value.
Low solubility of lignin in ethanol can be explained based on the Hansen theory where
the δh value (9.5) of ethanol is very high. Shukry et al., reported that ethanol was not
efficient for dissolving acetosolv lignins due to a high value of δh (Shukry et al., 2008).
Although the solubility parameter of lignin is more close to the solubility parameter of
ethanol than methanol, it seems methanol is a better solvent for lignin. This is due to the
smaller molar volume of methanol than ethanol. The dissolution rates are strongly
dependent on molar volume of methanol and ethanol because penetration rate
increases with decreasing solvent size (Papanu et al., 1990). The molar volume of the
solvents was not considered in the Hildebrand theory.
In addition, note that the soluble fraction of 100 mg L3 in 10 mL ethanol is about 10mg,
while in 10 mL methanol is about 60 mg. The reason for this big difference may be
111
explained by a number of aliphatic hydroxyl groups in L3. The results from 31PNMR
analysis and expanded C9-formula showed that the number of aliphatic hydroxyl groups
in L3 is more than the other lignin samples (see Table 11 and Table 14). Higher
number of hydroxyl group increases the hydrogen bonding that can increase the
solubility of lignin in hydroxylated solvents. Horvath stated that the solubility of lignin is
greater with hydroxylated solvents, e.g., methanol and ethanol than nonpolar solvents
like diethyl ether (Horvath, 2005). In addition, based on the Hansen theory, the solubility
of L3 in methanol is more than ethanol because the δh value for methanol is greater
than for ethanol.
As it was expected, solubility of all lignin samples was very low in water due to big
differences in solubility parameters of lignin and water. However, a direct correlation
was observed between the number of OH groups in C9 formula and the solubility of
lignins in water. The solubility of lignin in water increases by increasing the number of
OH groups in C9-formula.
Dioxane, DCM and acetone have similar δ-value which is about 10 (cal/cm3)1/2. It was
reported that kraft lignin (commercial L3) exhibits maximum solubility in solvents having
a Hildebrand’s solubility parameter 10.0 – 11.0 (cal/cm3)1/2 (Rahman et al., 2013), while
our results showed that L3 was moderately soluble in dioxane and slightly soluble in
DCM and acetone. The reason for higher solubility of lignin in dioxane might be due to
formation of hydrogen bonding between lignin and solvent (δh-value of dioxane is
greater than acetone and DCM). In addition, L3 with high number of aliphatic hydroxyl
groups showed more solubility in dioxane than other organic solvents.
The solubility parameter of THF, chloroform and EA is in the order of 9.5>9.2>9.1. THF
exhibit better solvent than chloroform and EA for lignins due to its closer solubility
parameter to the solubility parameters of lignins. However, the results showed that the
solubility of lignin in EA is higher than the expected value based on the Hildebrand
theory.
Rahman and co-workers (Rahman et al., 2013) reported that 10 mg L3 (commercial
lignin) is completely soluble in 1 mL DMSO, while it is partially soluble in THF and
112
chloroform. We have also found that 100mg L3 is almost soluble in 10 mL DMSO (96
mg/10 mL), but it is slightly soluble in THF (8 mg/10 mL) and it is almost not soluble in
chloroform. Cybulska et al., (2012) reported the solubility of different type of organosolv
lignins (i.e. prairie cordgrass, switchgrass and corn stover lignins) in organic solvents.
They found the highest solubility of lignins in methanol and dioxane and non-
significantly soluble in ethyl acetate (Cybulska et al., 2012).
Solubility of lignin in diethyl ether is very low due to significant difference between δ-
value of all lignins and the solvent, and also due to very low δh-value of the solvent.
Figure 23. Solubility of 100 mg lignin in 10 mL of different organic solvents
113
5.3.3 The effect of lignin molecular weight on the solubility
There are several aspects in polymer dissolution, one of which is the polymer molecular
weight that affect its dissolution. Figure 24 shows the relationship between the solubility
of four lignin samples and organic solvents. It was found that the solubility of lignins with
uniform size distribution was increased with decreasing molecular mass of the lignin.
Solubility of L1 in organic solvents was higher than the expected values due to its
biomodal molar mass distribution.
L2 with lowest molecular weight is dissolved in organic solvents more than other
lignins. It was reported that the lignins with lower molecular weight are more soluble in a
most common organic solvents (Alriols et al., 2009; Horvath, 2005). As expected, the
solubility of L3 was lower than L2 and L4 lignins due to its higher molecular weight than
L2 and L4 lignins.
The effects of molecular weight on the dissolution rates of thin poly(methyl
methacrylate), (PMMA) films showed a non-linear behavior when the log dissolution rate
was plotted against the log Mn (Cooper et al., 1985). Manjkow et al. (Manjkow et al.,
1987) found that dissolution of polymer depends on polymer molecular weight and
polydispersity.
The dissolution of polymer is controlled by chain disentanglement, which is a function of
the molecular weight (Parsonage et al., 1987). Polymers with smaller molecular weights
yield higher degree of disentanglement. As a result, lower molecular weights have a
higher degree of swelling when dissolution occurs.
114
Figure 24. The relationship between solubility and weight average molar mass of lignin samples (L1-L4)
5.3.4 Solubility of acetylated lignins in organic solvents
The solubility of acetylated lignins in organic solvents is demonstrated in Figure 25.
Acetylation of lignin is a technique that is used to increase the solubility of lignin in
organic solvents such as THF and DMSO (Olarte, 2011). Our study showed that 100
mg of all four acetylated lignins are completely soluble in 10 mL of ethyl acetate,
chloroform, THF, dichloromethane, acetone and pyridine (δ-value from 9.1 to 10.6) due
to the similar solubility parameters of acetylated lignins and solvents. Although, the
solubility parameter of DMSO is much greater than acetylated lignins, but it is still a
good solvent for all acetylated lignins. DMSO has very high dipole moment and it is a
good solvent for large lipophilic compounds which have some type of dipole moment in
the structure. DMSO with large dielectric constant is energetically able to interact with
large hydrophobic molecules that contains functional groups possessing a dipole
moment (Borchardt et al., 2005). Therefore, solubility of acetylated lignin in DMSO is
115
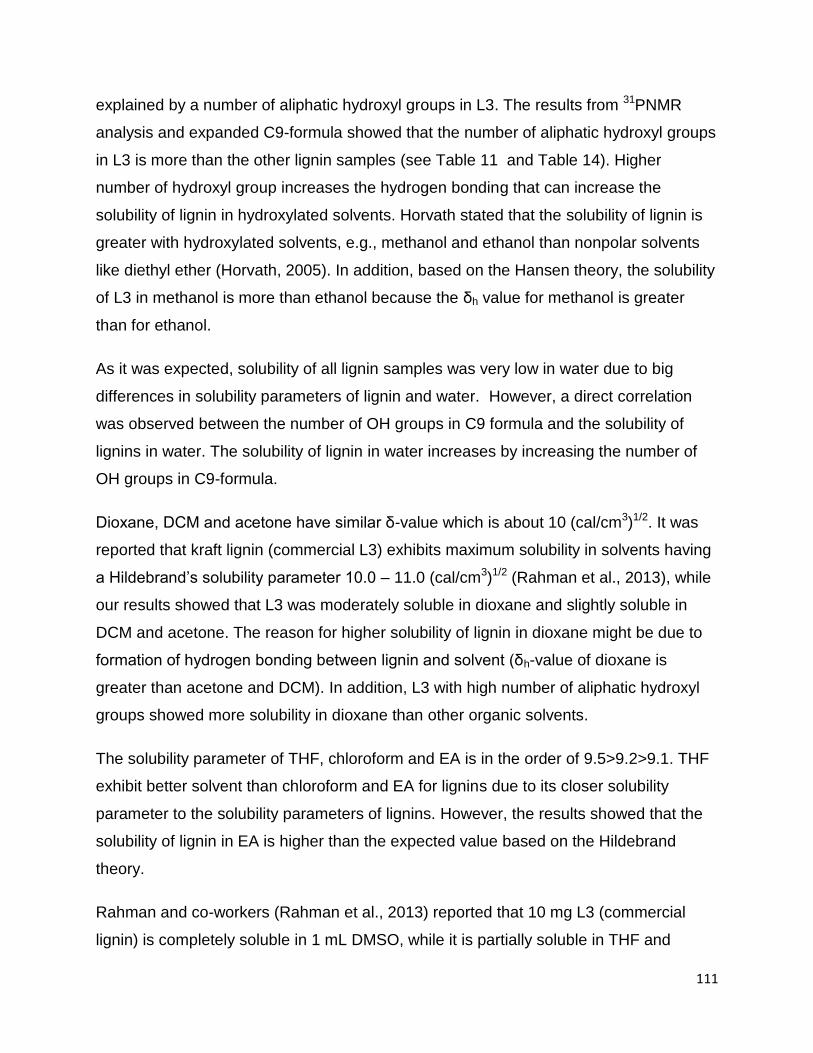
high because the number of dipole carbonyl groups is significantly increased after
acetylation. Dipole moment is the factor that was not considered in Hildebrand theory,
but it was explained by Hansen theory.
The solubility parameter of diethyl ether is much lower than acetylated lignins, therefore,
diethyl ether is considered as a poor solvent for lignin acetate. Very low solubility of
acetylated lignins in methanol, ethanol and water can be explained by the significant
differences between δ-value of the solvent and the acetylated lignins.
Figure 25. Solubility of 100 mg of acetylated lignin in 10 ml of different organic solvents
116
5.3.5 Solubility of lignin in ethyl acetate
For the technique of microspheres fabrication by solvent evaporation, a suitable solvent
should: (i) be able to dissolve the polymer, (ii) have low boiling point and high volatility
(iii) be poorly soluble in water and (iv) have low toxicity (Li et al., 2008).
Dichloromethane (DCM) is the most common solvent for microsphere preparation
because of its low boiling point, high immiscibility in water and high volatility. However,
DCM is considered as carcinogenic according to environmental protection agency
(EPA), and many efforts have been done to find solvents with less toxicity (Li et al.,
2008). In addition, lignin should be modified to lignin acetate in the first step of the
process to become soluble in DCM.
Ethyl acetate (EA) as a less toxic organic solvent has the potential to be substituted with
DCM. But miscibility of EA in water is the limitation (Freytag et al., 2000). Some
methods have been suggested in the literature to overcome this problem caused by the
miscibility of solvent with water (Bahl and Sah, 2000).
Therefore, more details were revealed on the physico-chemical properties of soluble
part of lignin samples in EA. The hydroxyl content and the molar mass distribution of
soluble and insoluble lignin samples in EA were analyzed by using 31PNMR and SEC.
The objective of this study was to determine the relationship between the molar mass
distribution and number of OH groups and the solubility of lignin in ethyl acetate.
5.3.6 Hydroxyl content of soluble part of lignin in ethyl acetate
The aliphatic and phenolic hydroxyl content was determined for the soluble part of lignin
in EA by using 31PNMR (Figure 26). The different hydroxyl groups in lignin samples
were obtained by integration of each spectral region. The signals in the range of 149.2
ppm to 146.0 ppm are associated with aliphatic hydroxyls groups. The phenolic hydroxyl
region is in the range of 144.3 ppm to 137.2 ppm. Signals in the range of 143.1-142.4
ppm (144.3-140.5 ppm for softwood kraft lignin (Monteil-Rivera et al., 2013)), 140.0-
138.8 ppm, 138.2-137.2 ppm and 135.6–133.7 ppm are attributed to syringyl, guaiacyl ,
117
p-hydroxyphenyl phenolic hydroxyls and carboxylic acid units, respectively (Cateto et
al., 2008; Zhang et al., 2013a).
Figure 26. 31PNMR spectrum of lignin samples and their soluble part in EA
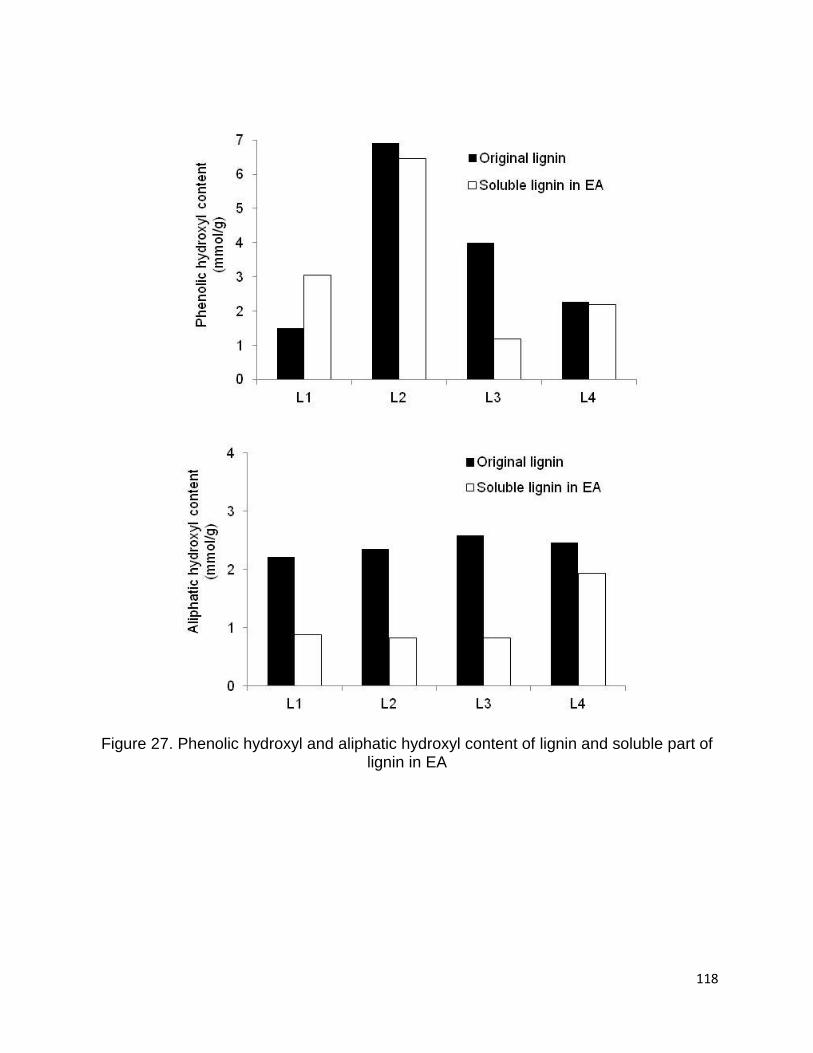
Figure 27 shows the number of phenolic and aliphatic hydroxyl of lignin samples and
the soluble part of lignin samples in EA. It is clear that the aliphatic hydroxyl content was
decreased in soluble part of lignin samples. Therefore, it seems that the part of lignin
macromolecules with less hydroxyl group is more soluble in EA.
118
Figure 27. Phenolic hydroxyl and aliphatic hydroxyl content of lignin and soluble part of lignin in EA
119
5.3.7 Molecular weight of soluble and insoluble part of lignin in ethyl acetate
The calibration curves of the standards were obtained for determination of the molecular
weight of soluble and insoluble part of lignin in EA (Figure 28).
Figure 28. Calibration curve of the PSS standards for molecular weight determination of a) insoluble part of lignins in EA and b) soluble part of lignins in EA
Figure 29 shows the molar mass distribution of each original lignin sample and also
soluble and insoluble part of lignin samples in ethyl acetate. The molar mass distribution
of insoluble part of lignin samples in EA showed higher molar masses while molar mass
distribution of soluble part of lignin in EA was shifted to lower molar mass values. It is
clear that the portion of lignin with lower molar mass was dissolved in ethyl acetate, and
the higher molar mass remained insoluble. It was found that the highest molar mass of
all soluble lignin samples in EA was about 10 KDa. In other words, EA is able to
dissolve lignin macromolecules with the molecular weight less than 10KDa.
120
Figure 29. Molar mass distributions of soluble and insoluble lignin samples in ethyl acetate
It is interesting to compare the molecular weight distribution of soluble part of different
lignins in EA (Figure 30). Although the solubility of each lignin is different in EA (see
Figure 23), it seems that the size distribution for all soluble part of the lignin samples
were the same.
121
Figure 30. Comparison between the molar mass distributions of soluble part of lignin samples in EA
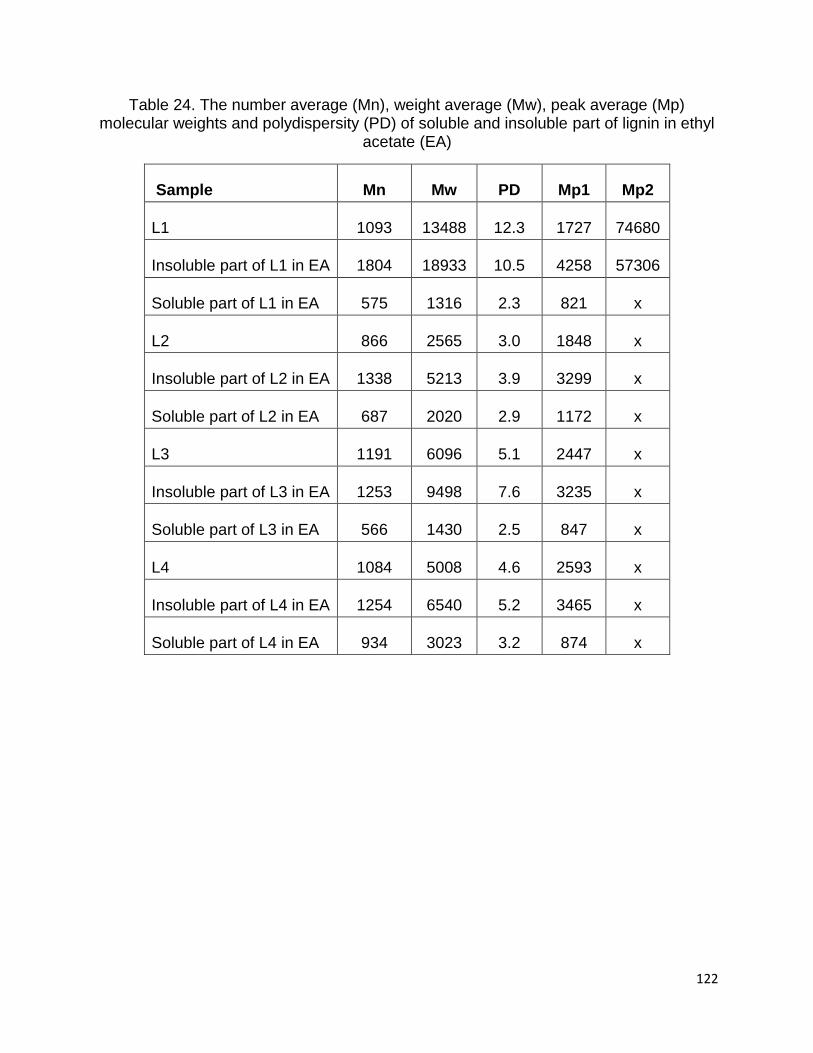
The Mw, Mn, Mp and PD of soluble and insoluble part of lignin samples in EA were
summarized in Table 24. The data showed that Mw, Mn, Mp and DP of soluble part of
all lignin samples in EA were lower than in the original lignin, while the insoluble lignin in
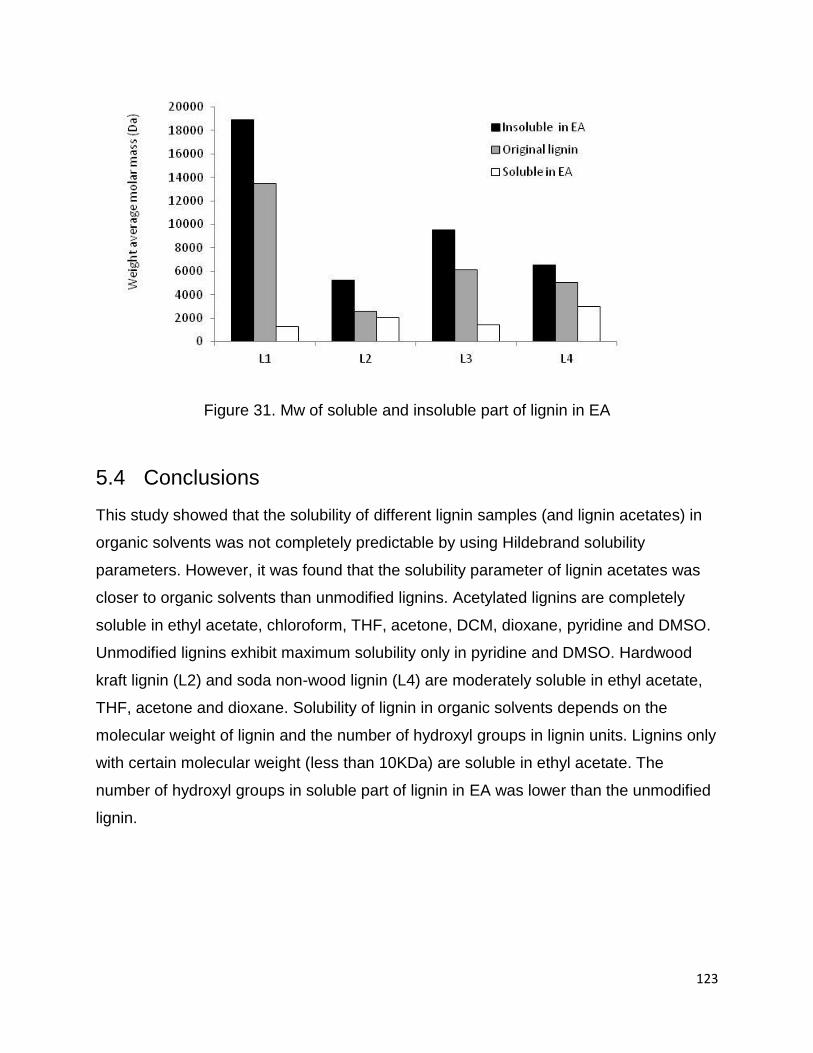
EA showed greater values than original lignin. Figure 31 shows the differences between
the Mw of four lignin samples.
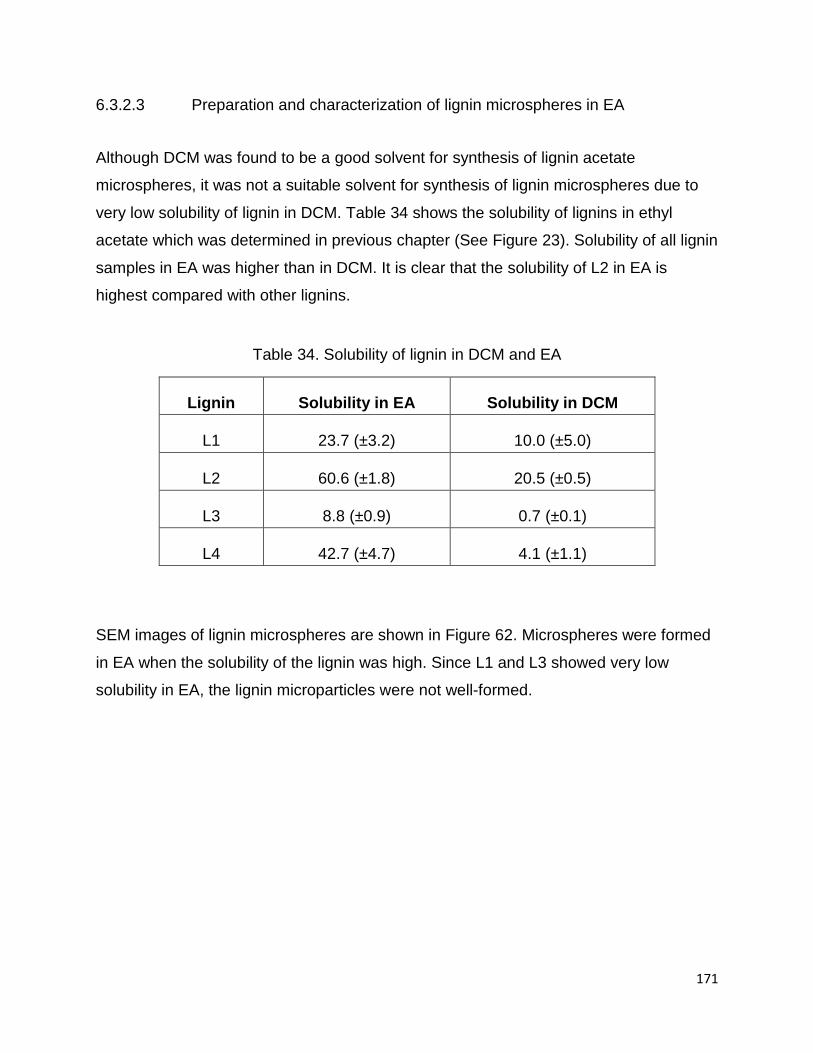
The solubility of four lignin samples in 10 mL EA was found to be 23.7, 60.6, 8.8 and
42.7 mg for L1, L2, L3 and L4, respectively (Figure 23). About 75% of L1 was not
soluble in EA due to very high Mw and bimodal molar mass distribution. It is important
to note that the soluble part of L1 in EA contains the lowest molecular weight among all
four lignin samples. L2 with the solubility of about 60 mg/10mL in EA was the most
soluble lignin in this study.
122
Table 24. The number average (Mn), weight average (Mw), peak average (Mp) molecular weights and polydispersity (PD) of soluble and insoluble part of lignin in ethyl
acetate (EA)
Sample Mn Mw PD Mp1 Mp2
L1 1093 13488 12.3 1727 74680
Insoluble part of L1 in EA 1804 18933 10.5 4258 57306
Soluble part of L1 in EA 575 1316 2.3 821 x
L2 866 2565 3.0 1848 x
Insoluble part of L2 in EA 1338 5213 3.9 3299 x
Soluble part of L2 in EA 687 2020 2.9 1172 x
L3 1191 6096 5.1 2447 x
Insoluble part of L3 in EA 1253 9498 7.6 3235 x
Soluble part of L3 in EA 566 1430 2.5 847 x
L4 1084 5008 4.6 2593 x
Insoluble part of L4 in EA 1254 6540 5.2 3465 x
Soluble part of L4 in EA 934 3023 3.2 874 x
123
Figure 31. Mw of soluble and insoluble part of lignin in EA
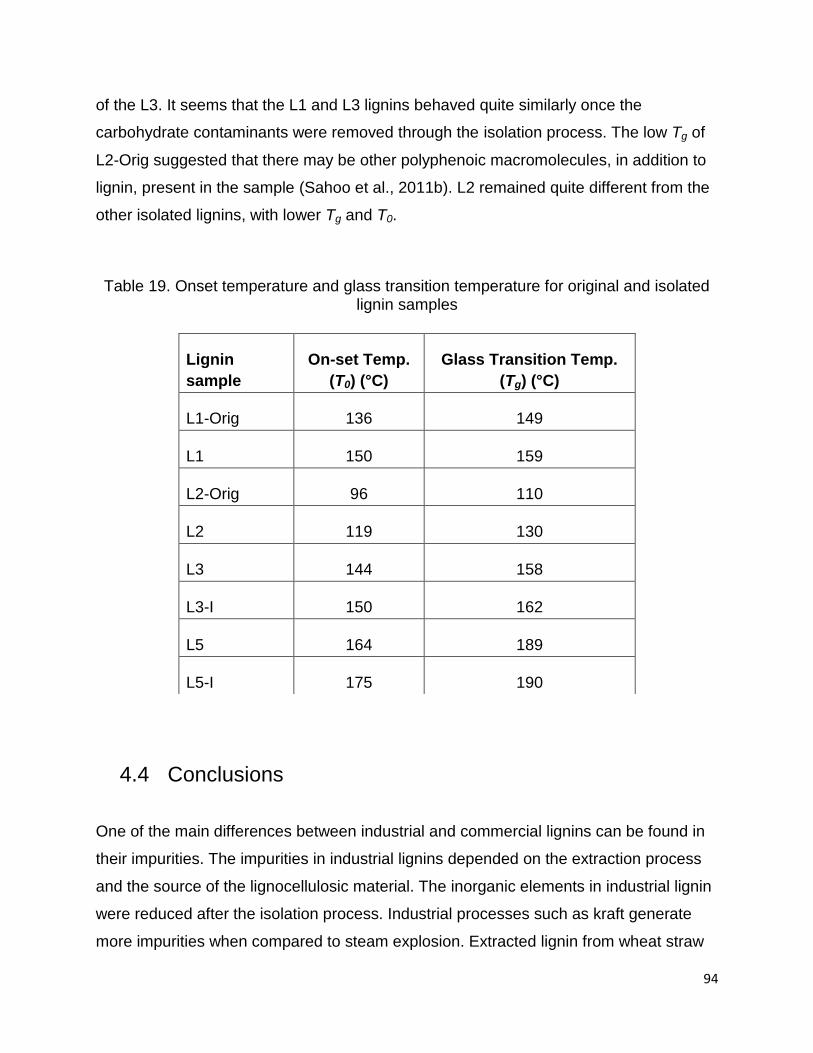
5.4 Conclusions
This study showed that the solubility of different lignin samples (and lignin acetates) in
organic solvents was not completely predictable by using Hildebrand solubility
parameters. However, it was found that the solubility parameter of lignin acetates was
closer to organic solvents than unmodified lignins. Acetylated lignins are completely
soluble in ethyl acetate, chloroform, THF, acetone, DCM, dioxane, pyridine and DMSO.
Unmodified lignins exhibit maximum solubility only in pyridine and DMSO. Hardwood
kraft lignin (L2) and soda non-wood lignin (L4) are moderately soluble in ethyl acetate,
THF, acetone and dioxane. Solubility of lignin in organic solvents depends on the
molecular weight of lignin and the number of hydroxyl groups in lignin units. Lignins only
with certain molecular weight (less than 10KDa) are soluble in ethyl acetate. The
number of hydroxyl groups in soluble part of lignin in EA was lower than the unmodified
lignin.
124
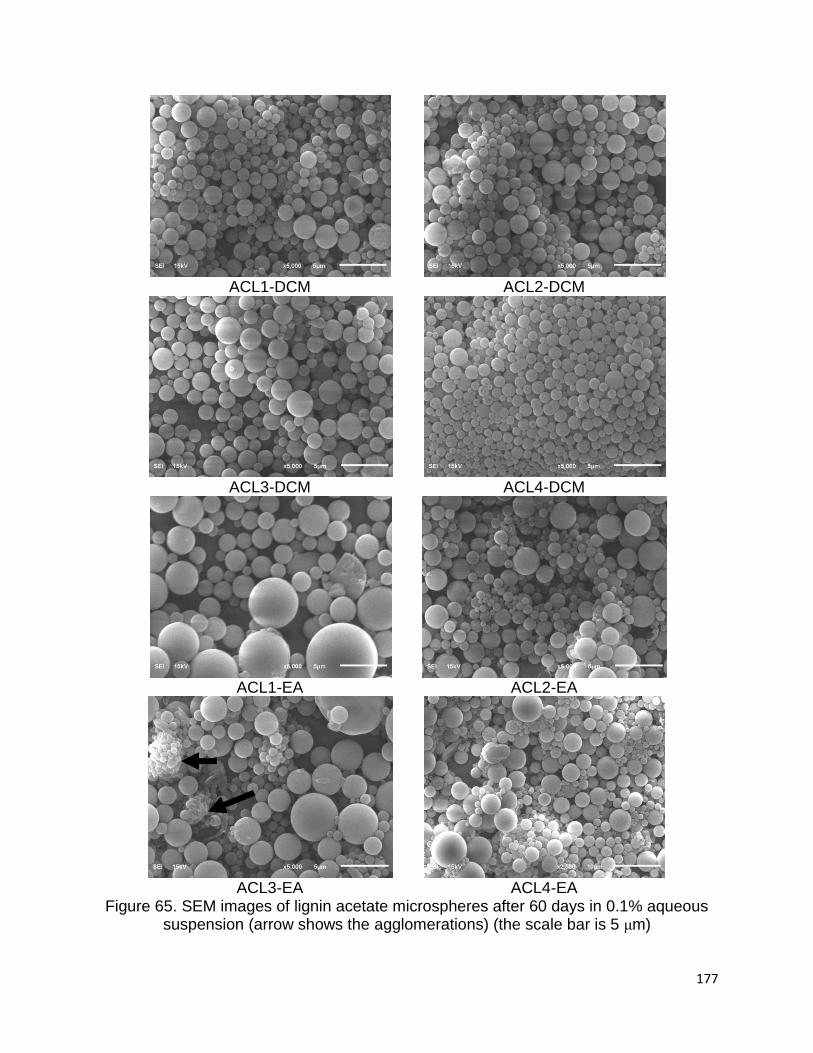
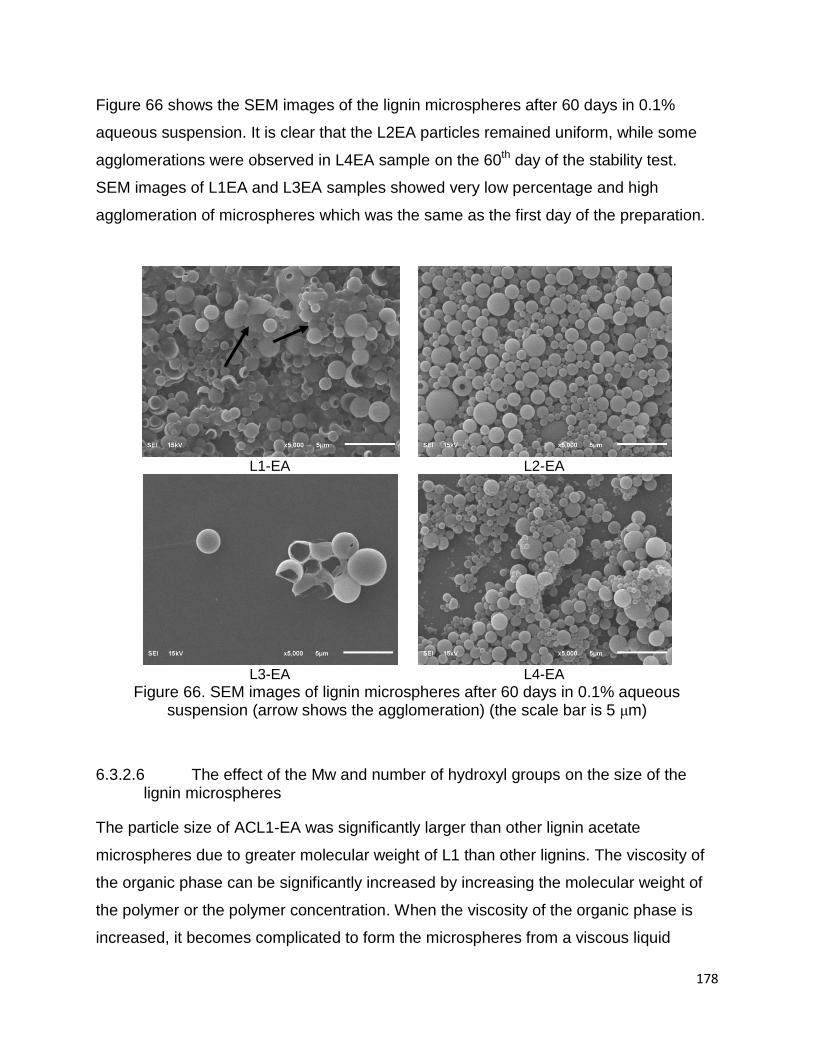
CHAPTER 6 Preparation and characterization of lignin microspheres
First part of this chapter was published with the title “Effect of Preparation Parameters on the Formation of Lignin Acetate Microspheres” in International Journal of Engineering and Innovative Technology, 2015, Volume 4, issue 8,102-113. Authors: Sameni, J., Krigstin, S., Sain, M.,
6.1 Introduction
Lignin is produced in large quantities as a by-product in the pulp industries and
biorefineries (Doherty et al., 2011). Although, there are several methods to isolate lignin,
because of its varying molecular weight, functional groups and unknown molecular
structure it becomes less applicable in many areas (Lora and Glasser, 2002). However,
even with these drawbacks, the interest for developing lignin-based products is growing
as a result of an increase in the demand for advanced sustainable products (Larry
Hughes, 2014; Mousavioun and Doherty, 2010). Preparation of lignin nano- or
microspheres could be useful in many applications such as agricultural actives
controlled release (Asrar and Ding, 2010; Chowdhury, 2014; Fernandez-Perez et al.,
2011), food industry fat mimetics (Stewart et al., 2014), filler in composites (Jiang et al.,
2013) and nano-sized coatings (Popa et al., 2011).
Lignin microspheres can be synthesized through emulsion solvent evaporation
technique; if lignin is completely dissolved in a suitable organic solvent. However, the
solubility of lignin is very low in many organic solvents due to presence of hydrophilic
moiety in the lignin molecule (Shukry et al., 2008). Therefore, two strategies were
proposed for synthesis of lignin microspheres: 1. modifying the lignin to lignin acetate to
improve the solubility of the lignin in organic solvents and 2.using the soluble part of the
lignin in the organic solvent. In both cases, the organic phase contains solubilized lignin,
but with two variables: A. lignin and lignin acetate and B. lignin from different sources.
The difference between these lignins is the molecular weight and number of the
125
hydroxyl groups. Therefore, the effects of the molecular weight and the number of
hydroxyl groups of lignins on the microparticles formation will be discussed in this
section.
Among all organic solvents, dichloromethane and chloroform (chlorinated solvents that
threaten human safety and have environmental concerns) have been widely used as
solvents in the emulsion solvent evaporation technique. In order to reduce the use of
these toxic solvents, many attempts have been made to prepare the polymer
microspheres using a solvent with lower toxicity, such as ethyl acetate, as the
dispersing solvent. The effect of ethyl acetate as a dispersing solvent was studied in the
production of different polymers such as PLGA microspheres (Soppimath and
Aminabhavi, 2002). Ethyl acetate has not been used in producing lignin microspheres
and, hence, in this thesis it was attempted to prepare lignin microspheres by different
lignin samples using ethyl acetate as dispersing solvent.
6.1.1 Methods for synthesis of micro/nanoparticles
Synthetic polymeric micro/nanoparticles such as polystyrene, polyalkyl(meth)acrylates,
polyesters and polyurethanes have been designed for various applications. Also
biodegradable polymers such as poly(lactic acid) (PLA) and poly (lactic-co-glycolic acid)
(PLGA) have been investigated to formulate micro/nanoparticle-based drug carriers
(Freiberg and Zhu, 2004). Vasir et al., (2003) provided an interesting review concerning
bio-adhesive microspheres for controlled drug delivery system (Vasir et al., 2003).
Biodegradable polymers, such as PLA and PLGA are mainly fabricated into
micro/nanoparticles by physical methods, including emulsification (Arshady, 1991),
spray-drying (Baras et al., 2000), precipitation (Young et al., 1999), emulsion solvent
evaporation (Gurny et al. 1996), salting-out procedure (Ibrahim et al., 1992), and
nanoprecipitation procedure (Fessi et al., 1989). All these methods involve dissolving
polymers into solution, disintegrating the solution into droplets, and subsequently
removing the solvent to obtain solid particles. Emulsion solvent evaporation has been
the most commonly used method for preparation of polymer microspheres (Conti et al.,
126
1991). The technique of microencapsulation by emulsion solvent evaporation is widely
applied in pharmaceutical industries to obtain the controlled release of drugs (Li et al.,
2008).
6.1.2 Emulsion solvent evaporation technique
The emulsion solvent evaporation technique involves three major steps: droplet
formation, solvent removal, and drying. Oil droplets (dissolved polymer in an organic
solvent) are formed in the aqueous continuous phase when the organic phase is
intermixed with the aqueous phase (Asrar and Ding, 2010). After the formation of the
emulsion in the first step, the liquid droplets of the organic phase are transformed into
solid spherical nano/microparticles by removing the organic solvent from the emulsion
(Freiberg and Zhu, 2004; Ravi et al., 2008; Silva et al., 2005). Accompanied by the
solvent evaporation, the drops of the dispersed phase become rich in polymer due to
solvent removal and they begin to solidify (Li et al., 2008).
6.1.3 Emulsion solvent evaporation technique for synthesis of lignin microspheres
The lignin-based microparticles can be produced by emulsion solvent evaporation
technique that contains lignin in a volatile organic solvent. It is important to note that the
organic solvent plays a crucial role on the synthesis of lignin microspheres. In the first
step, solubilized lignin in organic solvent is intermixed with an aqueous solution
containing emulsifier to form an emulsion. After the emulsion has been formed, the
organic solvent is removed, thereby producing uniform spherical lignin microparticles.
Figure 32 shows the process for synthesis of lignin microspheres. First the two phases
were placed in the mixer (A), then the system was disturbed to make an emulsified
lignin-containing organic solution with an aqueous surfactant solution to make an oil-in-
water emulsion (B). Emulsion droplets are trapped in the micelles when the agitation is
stopped, and solvent begins to evaporate from the system (C). Lignin microparticles are
formed and stabilized by complete evaporation (Solidification) (D).
127
Figure 32. The process for lignin microsphere formation A) lignin in organic phase and surfactant in aqueous phase, B) Intermix the system, C) Solvent evaporation D)
Solidification
6.1.4 Solvent choice
For synthesis of microspheres through emulsion solvent evaporation technique, the
organic solvent should (i) have low boiling point and high volatility (ii), be able to
dissolve the polymer (iii), be poorly soluble in water and (iv) have low toxicity (Li et al.,
2008; Soppimath and Aminabhavi, 2002). For instance, dichloromethane, chloroform,
THF, acetone and ethyl acetate are classified in this group of solvents because these
solvents have high volatility and capacity to dissolve most polymers and their boiling
point is lower than the normal boiling point of water. Among these organic solvents,
DCM is the most common solvent for synthesis of microsphere due of its low boiling
point, high immiscibility and high volatility. Shorter duration for microspheres fabrication
occurs due to its high evaporation rate. However, DCM is considered as carcinogenic
according to environmental protection agency (EPA), and many efforts have been made
to find solvents with less toxicity (Li et al., 2008).
Ethyl acetate as a less toxic organic solvent and has great potential to be a substitute
for DCM. But miscibility of ethyl acetate in water is the limitation if the dispersed phase
128
is directly introduced into the continuous phase. The polymer is precipitated into fiber-
like agglomerates due to sudden extraction of a large portion of ethyl acetate from the
dispersed phase into the continuous phase (Freytag et al., 2000). Two methods have
been suggested in literatures to overcome this problem caused by the miscibility of
solvent with water. Either the aqueous solution is pre-saturated with solvent (Bahl and
Sah, 2000), or the dispersed phase first is emulsified in a little quantity of aqueous
solution, then the solution is agitated and poured into a large quantity of aqueous
solution (Freytag et al., 2000).
6.1.5 Surfactant choice
There are many types of surfactants that are used for synthesis of polymeric
microparticles; such as sodium dodecyl sulfate (SDS), Tween80, Tween20, sodium
cholate and PVA (Silva et al., 2013). PVA solutions are easily obtained by stirring PVA
into water for few minutes at 90ºC. The toxicity test showed that PVA has negative
effects on animal skins and mucous membrane and the solution containing less than
5% PVA is not of any harm to fish (guppies) (Hallensleben, 2000).
6.1.6 Overview of Polyvinyl Alcohol (PVA)
Polyvinyl Alcohol (PVA) has been used as an emulsifier for preparation of micro and
nano polymeric particles due to its excellent emulsifying and adhesive properties. PVA
is also known for its high tensile strength; it is non-toxic, resistant to oil and grease and
odorless. Besides, PVA has high oxygen and aroma barrier properties which depend on
humidity. It has the melting point of 230°C for the fully hydrolyzed and 180–190°C for
partially hydrolyzed classes (used in food production). It has been reported that PVA
can undergo pyrolysis, during high temperatures and rapidly decompose above 200°C.
The chemical structure of PVA is shown in Figure 33.
According to Nugent (2007), PVA formed a strong interface and demonstrated greater
physical strength than the hydrogel because it is physically cross-linked. Such systems
129
have potential for a variety of localized controlled drug delivery applications, for
example, as coatings for implantable devices. As for the PVA residual in PLGA
nanoparticles, it was found even after three times washing, suggesting a strong surface
adsorption of PVA on the surface of PLGA nanoparticles.
Figure 33. Chemical structure of Polyvinyl alcohol (PVA)
6.1.7 Adhesion of PVA on the surface of particles
Murakami (1999) proposed a model to express the adsorption of PVA molecules on the
surface of PLGA particles, in which the hydroxyl groups of PVA molecules are fixed to
the acetyl groups of PLGA via hydrophobic bonding (Figure 34). The excellent
redispersibility of PLGA nanoparticles indicates that the surface of PLGA nanoparticles
is stabilized by PVA molecules to prevent aggregation. The results showed that the PVA
content and the particle size did not change even when the washing treatment was
repeated six times. This is indicated that the surface of PLGA particles had strongly
adsorbed a PVA layer.
Figure 34. PVA interactions at the surface of PLGA nanoparticles (with permission from
Murakami et al., 1999)
130
6.1.8 Variables
The variables in the emulsion solvent evaporation technique that influence the final
microsphere formation include: (i) nature and solubility of polymer in organic solvent; (ii)
concentration and nature of the stabilizer/surfactant; (v) temperature; (vi)
stirring/agitation speed (shear rate) during emulsification process and; (vii) viscosity and
volume ratio of the dispersed and continuous phase (Jain, 2000). Li et al (2008) was
classified the variables in two main aspects: (1) the physico-chemical properties of
materials, and (2) the preparation parameters that are involved in the process (Li et al.,
2008). However, the focus of this study was on four variables: shear rate, mixing time,
organic solvent and concentration of the surfactant. The goal of this study was to create
a procedure for producing lignin microspheres from different sources with controlled
sizes in spherical shape and narrow size distribution.
6.1.9 Theory of microspheres formation
6.1.9.1 Diffusion and evaporation of solvent
Mathematical models have been proposed for the solvent diffusion/evaporation from an
open vessel system (Li et al., 2008; Li et al., 1995; Wang and Schwendeman, 1999).
The model of diffusion/evaporation helps to understand the process of microspheres
formation. As shown in Figure 35, two main steps are involved in the process of
microspheres formation: solvent diffusion from drops of the dispersed phase to the
continuous phase (F1) and solvent evaporation from continuous phase into the air (F2).
Polymer microspheres begin to solidify by diffusion of the solvent from the drops in the
dispersed phase to the continuous phase. The solidification step is completed by the
total solvent evaporation from the continuous phase (Li et al., 2008).
131
Figure 35. Schematic of solvent diffusion and evaporation steps
The solvent diffusion/evaporation process contains three stages based on the
concentration of the organic solvent in two phases. At the first stage, the dispersed
phase is rich in solvent therefore the solvent is rapidly diffused into the continuous
phase. As a result, the concentration of solvent inside the continuous phase (Cs)
reaches the saturation level. This stage is very short (few seconds) and it can be
neglected. In the second stage, the Cs remains constant because the evaporated
solvent is compensated with solvent diffused into the continuous phase. Initial quantities
of the dispersed phase and of the continuous phase affect the duration of this stage.
During the final stage, the polymer concentration in the continuous phase increases by
decreasing the diffusivity of solvent from the dispersed phase to the continuous phase.
The diffusion rate become smaller than evaporation rate, so Cs begins to decrease (Li et
al., 2008).
Based on Fick’s law and by assumption of zero solvent concentration above the surface
of the continuous phase, the solvent evaporation would be (Li et al., 2008):
dM/dt= −Awa.KCs (18)
where;
M is the total mass of solvent in the reactor (kg)
Evaporation (F2) Diffusion (F1) Drop of the dispersed phase
Continuous phase
132
Awa is the surface area of water-air interface (m2)
t is time (s)
K is evaporation constant (m/s)
Cs is concentration of solvent in the continuous phase (kg/m3).
During stage B, concentration of solvent in the continuous phase (Cs) is equal to the
solubility of solvent in the continuous phase (Csol).
dM/dt= −AKCsol (19)
Therefore, this stage of the solvent evaporation profile is linear.
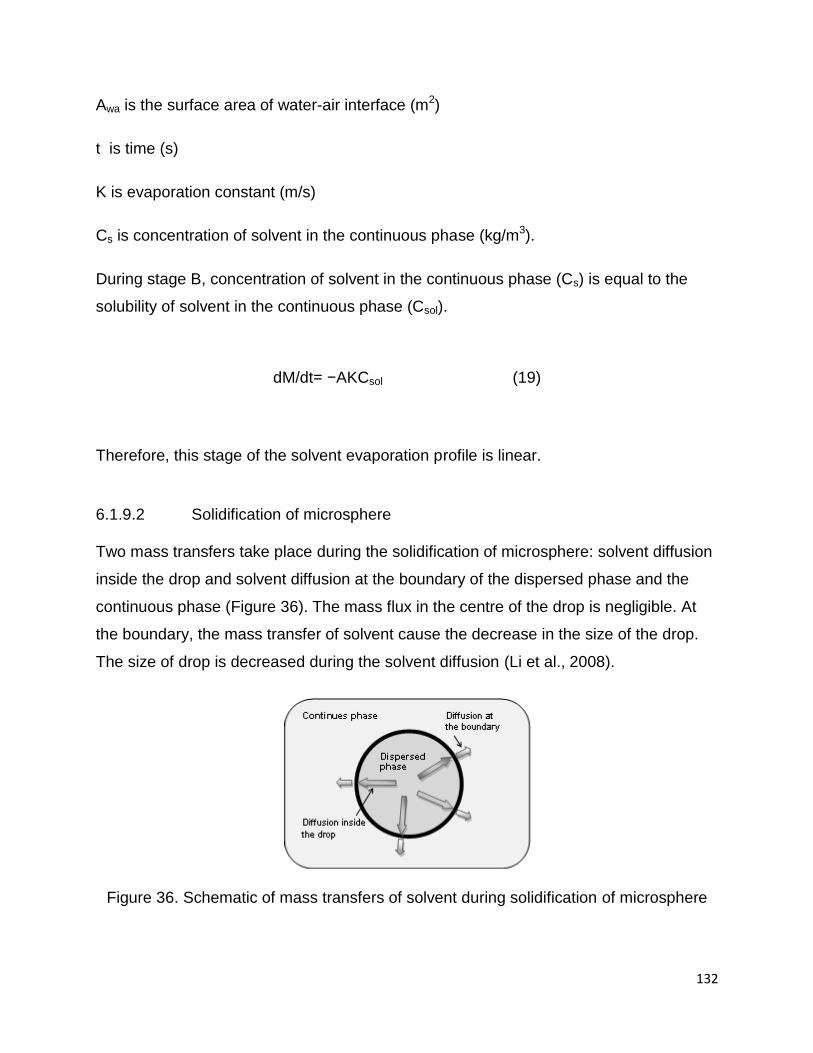
6.1.9.2 Solidification of microsphere
Two mass transfers take place during the solidification of microsphere: solvent diffusion
inside the drop and solvent diffusion at the boundary of the dispersed phase and the
continuous phase (Figure 36). The mass flux in the centre of the drop is negligible. At
the boundary, the mass transfer of solvent cause the decrease in the size of the drop.
The size of drop is decreased during the solvent diffusion (Li et al., 2008).
Figure 36. Schematic of mass transfers of solvent during solidification of microsphere
133
6.1.10 Synthesis of hollow spheres
Hollow spheres have shown to have potential in a variety of applications ranging from
controlled release to catalysis (Lasic, 1993; Yow and Routh, 2006). Hollow polymer
spheres can be synthesized by using either chemical or physical methods (Kim and
Yoon, 2004). Chemical methods are involved in chemical reactions through
polymerization of monomers. For instance, McKelevy (2000) reported hollow cross-
linked polystyrene spheres that can be templated from equilibrium vesicle phases
(McKelvey et al., 2000). In another study from McKelvey (2002), divinyl benzene
monomers were polymerized through free radical polymerization in the vesicle bilayer
microstructure and results in a hollow polymeric sphere product (McKelvey and Kaler,
2002).
Physical methods do not involve chemical reactions during the formation of hollow
polymer spheres. There are different ways to obtain hollow polymer spheres through
physical methods: self-assembly of polymers in solutions, dispersing polymer solution
droplets in immiscible media, and coating polymers on physically removable spherical
templates (Kim and Yoon, 2004).
Hollow porous PLGA microspheres were prepared by double emulsion method when
the organic phase to the volume ratio of the aqueous phase was 2:1 (Zhang et al.,
2013b). Liu et al (2014) reported the fabrication, characterization and use of PLGA
hollow microcapsules loaded with an anticancer drug for targeted drug delivery to
cancer cells. PLGA hollow microcapsules were prepared by a double emulsion method;
those having a size of 2.5 μm were stable (Liu et al., 2014).
6.1.11 Dynamic Light Scattering techniques
Photon correlation spectroscopy or dynamic light scattering is a valuable technique for
particle size analysis of submicron particulates. This technique involves the focusing a
monochrometer laser beam on a particulate dispersion within a cell. Most of the laser
beam passes straight through the sample, but some is scattered by the particles within
the sample. A detector is used to measure the intensity of the scattered light. These
fluctuations are the result of random Brownian motion of the particles, the rate of which
134
is inversely proportional to the particle size when the temperature is maintained at
constant level. The technique provides information about the intensity distribution of the
particles. It became routine particle-sizing tool in the study of several colloidal systems
both micro and nanosize. The advantages associated with this method are the absence
of traditional calibration, rapid sample analysis and minimal preparation of the sample
(Zetasizer user manual, 2004).
6.1.11.1 Z-Average mean
The Z-Average mean or Z-Average size is the primary and most stable parameter
produced by the dynamic light scattering technique. The Z-Average size is the best
value to report in a quality control setting as it is defined in ISO 13321 as the “harmonic
intensity averaged particle diameter”. The Z-average size is a hydrodynamic parameter
and is only applicable to particles in a dispersion. It should be noted that the Z-average
size is only comparable with the particle size measured by other techniques if the
sample is spherical (or semi-spherical), monomodal and monodisperse (Malvern user
manual, 2004).
6.1.11.2 Polydispersity Index (PDI)
Particles size distributions are one of the most important physical properties in a
colloidal suspension. The polydispersity index is a dimensionless number calculated
from a simple two parameter fit to the correlation data. This Index is scaled such that
values smaller than 0.05 are highly monodisperse while values greater than 0.7 indicate
very broad size distribution which is probably not suitable for the technique. Other size
distribution between these two extremes work based on the parameters defined in the
ISO 13321standard (Malvern user manual, 2004).
6.1.12 Surface Charge (Zeta Potential)
Most liquids contain both positive and negative ions. When particles are suspended in
liquid, liquid ions of opposite charge will be attracted to the surface of the particles. It is
obvious that ions closer to the particles surfaces will be bound strongly to it, whereas
ions that are positioned in outer layers of the particle will be loosely bound. A potential
135
exist between the particle surface and the dispersing liquid that vary accordingly with
the distance from the ions to the particle surface. The potential is known as zeta
potential.
Based on electrophoresis, the Zetasizer equipment measures the velocity by which the
particles move towards the electrode of opposite charge. The technique is used in Laser
Doppler Velocimetry (LDV). An incident beam is applied onto the electrophoretic cell
and the resulting scattered light, produces a fluctuating intensity. The rate of fluctuation
is proportional to the speed of the particles. A digital processor extracts the frequencies
in the scattered light. In this equipment an optical modulator is present allowing an
accurate reading, for millions of particles in a short period of time. Also due to the
combination of both Laser Doppler Velocity and Phase analysis Light Scattering, the
electro-osmotic effect, streaming potential and sedimentation potential are all minimized
(Zetasizer manual, 2004).
The surface charge of the particles can be attributed to the dissociation of the polymeric
groups and or to the absorption of ions or ionisable molecules from the dispersing
phase (Mangenheim and Benita, 1991). The nature of the charge on the surface of
particles can modify the biological response of these carriers, since it determines the
type and nature of the interaction between the carriers and the active site (Douglas,
1987; Müller, 1991).
The stability of colloidal system, when dependent upon electrostatic stabilization, is
related with the surface charge of the particles. Particles with high zeta potential value
lead to a stable system, whereas a low zeta potential value results in particle
aggregation (Harfield and Bunter, 1988).
Zeta potential is the difference in the electric potential existing between the dispersion
medium and the first layer around the particle, referred to as the shear plane. The shear
plane follows the movement of the particle. Zeta potential is dependent on the potential
of the particles surface (Nerst potential). Zeta potential have another definition such as
measure of the charge of the particles, the larger the absolute value of the zeta
potential, the greater the amount of charge of charge at the surface. Therefore, the zeta
136
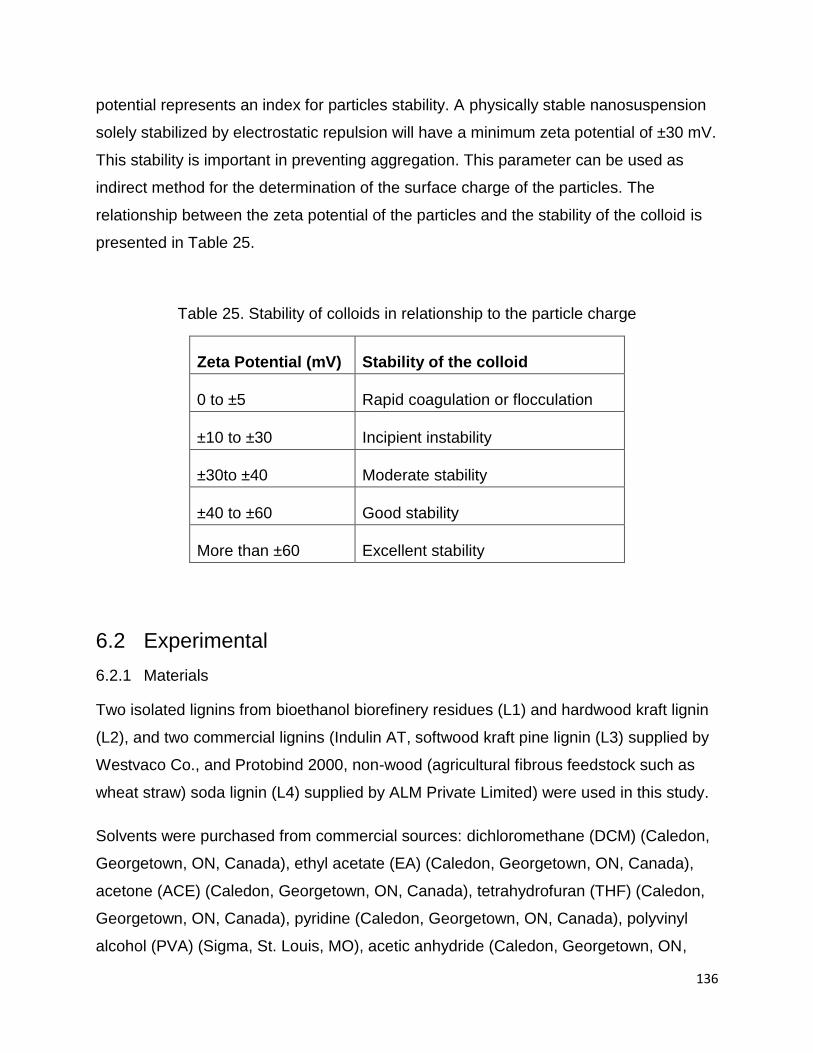
potential represents an index for particles stability. A physically stable nanosuspension
solely stabilized by electrostatic repulsion will have a minimum zeta potential of ±30 mV.
This stability is important in preventing aggregation. This parameter can be used as
indirect method for the determination of the surface charge of the particles. The
relationship between the zeta potential of the particles and the stability of the colloid is
presented in Table 25.
Table 25. Stability of colloids in relationship to the particle charge
Zeta Potential (mV) Stability of the colloid
0 to ±5 Rapid coagulation or flocculation
±10 to ±30 Incipient instability
±30to ±40 Moderate stability
±40 to ±60 Good stability
More than ±60 Excellent stability
6.2 Experimental
6.2.1 Materials
Two isolated lignins from bioethanol biorefinery residues (L1) and hardwood kraft lignin
(L2), and two commercial lignins (Indulin AT, softwood kraft pine lignin (L3) supplied by
Westvaco Co., and Protobind 2000, non-wood (agricultural fibrous feedstock such as
wheat straw) soda lignin (L4) supplied by ALM Private Limited) were used in this study.
Solvents were purchased from commercial sources: dichloromethane (DCM) (Caledon,
Georgetown, ON, Canada), ethyl acetate (EA) (Caledon, Georgetown, ON, Canada),
acetone (ACE) (Caledon, Georgetown, ON, Canada), tetrahydrofuran (THF) (Caledon,
Georgetown, ON, Canada), pyridine (Caledon, Georgetown, ON, Canada), polyvinyl
alcohol (PVA) (Sigma, St. Louis, MO), acetic anhydride (Caledon, Georgetown, ON,
137
Canada). All the chemicals used were analytical grade and used without further
purification.
6.2.2 Acetylation of lignin
The method used in this study follows that used by Olarte (2011). 1.0 g lignin was mixed
with 40 ml of pyridine-acetic anhydride (50-50%) solution. The mixture was allowed to
react for 24 hours while mixing. The solids were re-precipitated with 150 ml of
hydrochloric acid solution (pH = 1.0) and collected using a vacuum filtration technique.
The solids were washed with some HCl solution and then with deionized water. The
collected solids were dried at 40°C for overnight and stored in vials for further analysis.
6.2.3 Synthesis of lignin acetate microspheres at different conditions
Commercial non-wood soda lignin (Protobind 2000) was used in this study. To achieve
a uniform lignin microspheres, the preparation parameters (i.e. shear rate, mixing time,
and concentration of the surfactant) were designed based on the literature (Budhian et
al., 2007; Freitas et al., 2005; Li et al., 2008; Sameni et al., 2009; Stewart et al., 2014).
First, 10mg lignin acetate was dissolved in 1 mL organic solvent. The organic phase
was transferred into 10 mL aqueous phase containing PVA with concentration of 0.0,
0.05, 0.1, 0.2, 0.5, 1 and 2 w/v%. The mixture was agitated with either magnetic stirrer
(800 rpm and 1000 rpm) for 30 seconds or homogenizer (10,000-20,000 rpm) for 5, 10,
20 or 30 seconds. Then, the emulsion was transferred to a beaker containing 50 mL of
distilled water and stirred for 2-3 h with magnetic stirrer at room temperature to allow the
solvent to evaporate from the mixture. The particles collected by centrifugation for 10
min at 9000g, and washed twice with hot water to remove the surfactant. Samples were
freeze-dried in and kept in a desiccator for further tests (Asrar and Ding, 2010; Silva et
al., 2013).
Table 26 shows all the preparation parameters for synthesis of lignin acetate
microspheres. The effect of each preparation parameter on the particle size was
analyzed by using one-way ANOVA with significance when p<0.05.
138
Table 26. Preparation parameters for synthesis of lignin acetate microspheres
Sample Mixer Shear rate
(rpm)
Mixing Time
(s)
PVA Conc.
(w/v %)
1 Magnetic stirrer 1000 30 0.0
2 Magnetic stirrer 800 30 0.2
3 Magnetic stirrer 1000 30 0.2
4 Homogenizer 10000 5 0.2
5 Homogenizer 10000 10 0.2
6 Homogenizer 10000 20 0.2
7 Homogenizer 10000 30 2.0
8 Homogenizer 10000 30 1.0
9 Homogenizer 10000 30 0.5
10 Homogenizer 10000 30 0.2
11 Homogenizer 10000 30 0.1
12 Homogenizer 10000 30 0.05
13 Homogenizer 10000 30 0.0
14 Homogenizer 12500 30 0.2
15 Homogenizer 15000 30 0.2
16 Homogenizer 20000 30 0.2
6.2.4 Preparation of lignin microspheres and lignin acetate microspheres using different lignins
After optimization of the parameters (i.e. shear rate, mixing time, and concentration of
the surfactant), lignin microspheres were synthesized with isolated lignins (or lignin
acetates) from different sources. The organic phase was prepared by dissolving 10 mg
of soluble part of lignin (or lignin acetate) in 1 mL organic solvent. The soluble part of
lignin in organic solvent was collected by centrifuging and removing the insoluble part.
139
Then, the organic phase was intermixed with 10 mL PVA (0.2%) by using homogenizer
at 10,000rpm for 30 seconds and the transferred into 50 mL water. Samples were
collected in a similar way as explained in the section 6.2.3. Figure 37 illustrates the
overall process for the synthesis of the lignin microspheres.
6.2.5 Preparation of lignin acetate hollow spheres
At low shear rate (1000 rpm) a portion of particles (hollow spheres) remained on the
surface of the water after centrifugation due to their lower density than water. Particles
were collected from the surface of water, washed with distilled water and dried in the
freeze drier.
140
Figure 37. Method for synthesis of lignin microspheres: (1) lignin-containing organic solvent is mixed with an aqueous PVA solution to make an oil-in-water emulsion, (2) Diffusion of organic solvent from organic phase to aqueous phase, (3) washing and
collection the particles, and finally (4) drying samples by using freeze drier.
141
6.2.6 Determination of size and size distribution of lignin particles by using Dynamic light scattering (DLS) technique
The average diameter of microspheres and polydispersity index (PDI) were determined
by using ZETASIZER NANO ZS Malvern Instrument (Malvern, United Kingdom), at
25.0±0.1 °C. The colloidal dispersions of lignin microspheres were prepared at 0.1%
concentration of aqueous solution. The size distribution graphs were obtained based on
the relative intensity of scattered light on the hydrodynamic diameter of lignin
microspheres. The relative intensity peaks were normalized (the intensity of highest
peak normalized to unity) for all samples. At least three measurements were carried out
for each test.
6.2.7 Determination of zeta potential by using DLS technique
The zeta-potentials of lignin microspheres were determined using ZETASIZER NANO
ZS Malvern Instrument (Malvern, United Kingdom), at 25.0±0.1 °C. A colloidal
dispersion of lignin microspheres was prepared in an aqueous solution with
concentration of 0.01%. At least three measurements were carried out for each test.
6.2.8 Morphology of lignin particles by Scanning Electron Microscopy
The morphology of microspheres was observed under scanning electron microscopy
(SEM). SEM was used to characterize the morphology of the lignin particles. Samples
were sputter-coated by a fine gold layer (10 nm) and observed on a JEOL field emission
microscope (5 kV). Diameters of the lignin particles were measured by using ImageJ
software. The mean diameter of each sample was estimated based on the
measurements of 100 randomly selected particles.
6.2.9 The yield percentage determination
The yield percentage of the obtained lignin microspheres or lignin acetate microspheres
was determined by measuring the dry weight of the particles after the filtration of the
suspension using a Buchner funnel with 11 µm pore filter paper.
142
6.2.10 Mixture Stability test
The stability of the lignin microspheres mixture was studied by analyzing the particles
over time. Particle size, PDI and zeta-potential of ACL4DCM and ACL4EA particles
were determined on the first day of preparation and after 15, 25, 35 and 60 days in a
neutral suspension at room temperature. The stability test for other formulations was
determined only on the first day and after 60 days in a neutral suspension at room
temperature. The results were reported as mean ±standard deviation (±SD). Statistical
analysis were performed by using one-way analysis of variance (ANOVA) with
significance (p<0.05), highly significant (p<0.01) and very significant (p<0.001). The
morphology of the particles on the 60th day was studied by analyzing SEM images.
6.3 Results and discussion
6.3.1 The effect of preparation parameters on the lignin particles formation
6.3.1.1 The influence of mixing shear rate
Generally the size of droplets in an emulsion is inversely related to the magnitude of
shear stresses. Therefore, smaller microspheres are formed by increasing the shear
rate. It is reported that increasing stirring speed produced smaller particles using
emulsion solvent evaporation technique (O'Donnell and McGinity, 1997). As the speed
of the motor or the power of the sonicator is increased, the size of the dispersed
droplets decreases (Ansari et al., 2012). Therefore, if high shear is produced by
homogenizer or sonicator, the droplets become much smaller than the droplets in the
emulsion produced by conventional agitation. This phenomenon strongly supports the
concept that the stronger shear forces and increased turbulences that are generated at
high stirring speed could breakdown the droplets into smaller sizes (Freitas et al., 2005).
Figure 38a shows the particle size distribution of lignin acetate microspheres that were
prepared at low shear (800 rpm and 1000 rpm) and high shear rates (10,000 rpm). The
low shear was applied by a magnetic stirrer and high shear by a homogenizer. The size
of the particles prepared using a magnetic stirrer was determined by imageJ software
(Table 27). Particles were formed in larger size and in wider distribution by using
143
magnetic stirrer. The average particle size at 800 rpm and 1000 rpm was 13.6 µm and
10.6 µm, respectively.
Figure 38b shows the size distribution of lignin acetate microspheres prepared by
homogenizer at four different shear rates between 10,000 rpm and 20,000 rpm. All
samples showed unimodal size distribution. However, it seems that the distributions of
lignin acetate microspheres were slightly shifted to lower sizes at higher shear rate.
Figure 38. Particle size distribution of lignin acetate microspheres at different shear rate; Particle size was determined by a) imageJ software and b) DLS technique
Table 27. Minimum, maximum and mean particle size prepared by using magnetic stirrer and measure by imageJ software
Shear rate (rpm)
Particle size (µm)
Min. Max. Mean
800 3.8 25.0 13.6
1,000 2.0 18.0 10.6
10,000 0.5 2.4 1.0
144
Figure 39 shows the effect of shear rate on the average particle size and PDI of the
lignin acetate microspheres. It is clear that the average size of microspheres was
decreased from 1075 nm to 886 nm when the shear rate was increased from 10,000
rpm to 20,000 rpm. Significance of the influence was statistically confirmed by one-way
ANOVA (p < 0.05). Although, the size distribution became slightly narrower by
increasing the shear rate from 10,000 rpm to 15,000 rpm, the value of PDI was
increased at very high shear rates (20,000 rpm). It has been reported that the particle
size distribution of PLGA and Eudragit RS microspheres decreased when stirring speed
increased (Gabor, 1999; Mateovic et al., 2002). SEM images (Figure 40) shows the
obvious differences between the effects of the different shear rates on the particle size.
Figure 39. Average particle size (Z-Ave) and polydispersity (PDI) of lignin acetate microspheres at different shear rate applied by homogenizer
145
Figure 40. SEM images of lignin acetate microspheres which prepared by using
magnetic stirrer at low shear (800 rpm and 1000 rpm) and homogenizer at high shear rate (10,000-20,000 rpm).
10000 rpm 12500 rpm
15000 rpm 20000 rpm
800 rpm 1000 rpm
5 μm
50 μm 50 μm
5 μm
5 μm
5 μm
146
Many other factors related to agitation also have an influence on the size of the
microspheres, such as the geometry of the reactor, the number of impellers and the
impeller’s diameter (Maa and Hsu, 1996). Based on the Kolmogoroff/Hinze model
(Hinze, 1955) the correlation between the agitation rate and the diameter of the agitator
could be expressed as:
(20)
Where;
dmax is the largest drop size which can be formed under turbulence (m),
D is the diameter of the agitator (m)
ρc is the density of continuous phase (kg/m3),
Nt is the agitation rate (turns/s)
σ is the interfacial tension between the continuous phase and the dispersed phase
(N/m)
c1 is a constant value which depends on the factors linked to the agitation conditions
If we assume a constant density for the continuous phase and a constant interfacial
tension between the continuous phase and the dispersed phase, then;
(21)
where C2 is a constant.
From (20 and (21, it is clear that the maximum size of microspheres is decreased by
increasing the agitation rate (Gabor, 1999; Mateovic et al., 2002; Yang et al., 2001).
147
Figure 41 shows the relationship between the largest particle size of lignin acetate
microspheres with the diameter of the agitator and the agitation rate.
Figure 41. The relationship between the diameter of the agitator (D) and the agitation rate (N) with the maximum size of the lignin acetate microspheres (dmax)
6.3.1.2 Formation of lignin acetate hollow spheres
Figure 42 shows SEM images of the lignin acetate hollow spheres. The average
diameter and the thickness of the lignin acetate hollow spheres were determined by
imageJ software on the SEM images. It was found that the thickness of the hollow
spheres was about 1-3 µm, and the average particle size was about 58 µm (Figure 43).
A hollow structure of poly(3-hydroxybutyrate-co-3-hydroxyvalerate) was also observed
by using Tween80 and PVA as emulsifiers (Khang et al., 2001). PLGA hollow
microcapsules loaded with an anticancer drug for targeted drug delivery to cancer cells
was reported by Liu et al (2014). These PLGA hollow microcapsules were synthesized
by a double emulsion technique having a size of 2.5 μm (Liu et al., 2014). Hollow
porous PLGA microspheres were also prepared by double emulsion technique at
organic phase to aqueous phase ratio of 2:1 (Zhang et al., 2013b).
148
Figure 42. SEM images of lignin acetate hollow spheres
Figure 43. Particle size distribution of lignin acetate hollow sphere
80 µm
149
Formation of lignin hollow spheres was directly related to the shear rate of the mixer. At
lower energy dispersion lignin particles were formed in bilayer to reduce the Gibbs free
energy (Figure 44).
Figure 44. Formation of lignin microspheres and hollow spheres at different shear rate
6.3.1.3 The role of surfactant in microspheres formation
Surfactants play an important role in the formulation of microspheres and in their
resulting shape and size. The main role of the surfactant is to prevent the emulsion
droplets from coalescing. The surfactant molecules are located in the interface between
the aqueous phase and organic phase. The concentration and properties of the
surfactants will affect the total surface area of the particles and may change the final
particle size (Manchanda et al., 2010). Figure 45 illustrates the surfactant stabilized
lignin microspheres and hollow spheres. The hollow sphere structure consists of an
aqueous core, lignin acetate layer and two PVA monolayers.
150
Figure 45. A schematic of surfactant stabilized lignin acetate microsphere and lignin acetate hollow sphere
6.3.1.4 The influence of surfactant concentration
Figure 46 shows the particle size distribution of lignin acetate microspheres that were
prepared at different PVA concentrations (0.05 - 2.0% w/v). Unimodal distribution was
observed for all cases. The size distribution was shifted to smaller particles by
increasing the PVA concentration from 0.05% to 1%. However, by increasing the PVA
to 2%, the size distribution was moved to larger particles.
151
Figure 46. Particle size distributions of lignin acetate microspheres at different PVA concentration
Figure 47 shows that the average particle size of lignin acetate microspheres was
decreased by addition of PVA from 0.05% to 1%, and then increased by addition of 2%
PVA. Therefore, the smallest particle size (744 nm) was obtained when 1% PVA was
used for particles formation. However, the polydispersity of particles at 1% PVA was the
highest (PDI=0.22) in comparison with other samples. According to ANOVA, the PVA
concentration is found to have a significant influence on the lignin acetate particle size
(p<0.05).
Feritas and co-workers (Freitas et al., 2005) found that the polymeric particle size is
reduced with an increasing the surfactant concentration. Silva et, al (2013) reported that
the PVA concentrations below 1% led to a larger particle size of poly(lactic-co-glycolic
acid) microspheres (Silva et al., 2013). Smaller particles have a higher total interfacial
area compared to the large particles, thus they require a higher concentration of the
surfactant. Therefore, the addition of higher surfactant concentration to the solution
results in decreased particles size. An increase (Zweers et al., 2004) and decrease
(Allemann et al., 1992) in size of poly(lactic-co-glycolic acid) nanoparticles at high PVA
concentration have been reported. These contradictory findings were clarified by
152
Budhian (Budhian et al., 2007) who proposed two competing effects at high PVA
concentration. The size of the particles decreases due to enhanced interfacial
stabilization while the size of the particles increases due to increased viscosity of the
aqueous phase.
Figure 47. Average particle size and PDI of lignin acetate microspheres at different PVA concentration
SEM images show the effect of surfactant concentration on the morphology of lignin
acetate microspheres (Figure 48). A comparison between SEM images showing the
formation of lignin acetate particles with surfactant was completely in spherical shape
and had a smooth surface. Absence of surfactant causes particle shrinkage and a rough
surface on the particles.
153
Figure 48. SEM images of lignin acetate microspheres at different PVA concentration (0.0-2.0%). Agitation rate was 10,000 rpm for all cases, unless stated on the image
0.2% 0.5%
1% 2%
0.05 % 0.1%
0% 0% (1,000 rpm)
154
6.3.1.5 The influence of mixing time
Figure 49 presents size distribution of lignin acetate microspheres that were prepared at
different mixing times (5, 10, 20 and 30 seconds) by using homogenizer at 10,000rpm
and constant PVA concentration (0.2%w/v). It shows uniform size distribution for all
samples, but obvious differences of particle sizes was observed between samples.
Larger particles were formed during shorter mixing time. The portion of large particles
was much higher when shorter time was applied in the process.
Figure 49. Particle size distribution of lignin acetate microspheres at different time for
agitation
Figure 50 shows the average particle size and PDI of lignin acetate microspheres at
different mixing time. The average particle size was 1767 nm, 1291 nm, 1062 nm and
1075 nm at 5, 10, 20 and 30 seconds of mixing time, respectively. ANOVA showed
significant difference between lignin acetate particle size at different mixing times
(p<0.05). PDI was decreased from 0.216 to 0.11 when the mixing time increased from 5
to 30 seconds.
Short mixing time yields coarse particles due to less magnitude of shear stress applied,
while at longer time, the energy density increases directly by increasing the shear
stresses and results in more efficient droplet breakdown (Budhian et al., 2007).
155
Therefore, increasing the mixing time decreases the particles mean size due to
reduction of emulsion droplets through sufficient shear forces.
Figure 51 shows SEM images of lignin acetate microspheres at different mixing time.
Figure 50. Average particle size and polydispersity index (PDI) of lignin acetate microspheres at different mixing time
156
Figure 51. SEM images of lignin acetate microspheres at different mixing time (the scale bar is 5 μm)
6.3.1.6 The effect of organic solvent on the particle formation
SEM images show the formation of lignin acetate microsphere when DCM, ACE, EA
and THF were chosen as organic solvents. Homogenizer was used as agitator with
10,000 rpm, mixing time was fixed at 30 seconds, and PVA concentration was 0.2
w/v%. Although lignin acetate was completely soluble in all four organic solvents, lignin
acetate microspheres were formed only in DCM and EA.
5 s 10 s
20 s 30 s
157
Figure 52. SEM images of lignin acetate microspheres at different organic solvents (the scale bar is 5 μm)
Figure 53 illustrates the size distribution of the lignin acetate microspheres. A
comparison between the size distributions indicates a wider size distribution with EA
compared with DCM.
Acetone
Ethyl acetate
Tetrahydrofuran
Dichloromethane
158
Figure 53. Particle size distribution of lignin acetate microspheres with different organic solvents
Table 28 shows the average size, PDI, and zeta-potential of the lignin acetate
microspheres when the organic solvent was EA and DCM. The average size of the
particles was 1881 nm and 1075 nm for EA and DCM, respectively. PDI was in
narrower distribution for DCM (0.118) in comparison to EA (0.173). The results show
that the zeta-potential of the lignin acetate microspheres with EA is -45.5 mV while with
DCM is -36.7 mV. The value of zeta-potential depends on the chemicals involved in the
synthesis process (Patil et al., 2007). The negative zeta-potential is caused by the
residue of the PVA surfactant on the particles surface (Chumakova et al., 2008), residue
of the solvent and surface free carboxylic acid groups on the lignin acetate.
159
Table 28. Average size, PDI and zeta-potential of lignin acetate microspheres in EA and DCM
It is clear that the formation of particles mainly depended on the physical properties of
the organic solvent. Physical properties of the selected organic solvents are presented
in Table 29. ACE and THF diffuse rapidly from the dispersed phase into the aqueous
phase due to their miscibility in water. Therefore, lignin acetate was dispersed in
aqueous phase in irregular shapes before it was formed and stabilized by the surfactant
molecules. On the other hand, DCM is immiscible in water and the solubility of EA is low
in water (8.3 g/100mL). Therefore, DCM and EA remained in the emulsion droplets for a
while before diffusing into the aqueous phase. The results indicate that lignin acetate
particles are formed and solidified in uniform size and shape by using DCM and EA in
the process.
Interfacial tension of DCM is higher than EA, and it is immiscible in water. Therefore,
DCM resulted in successful formation of smaller lignin acetate microspheres with
narrow size distribution in comparison with EA.
The higher solubility of EA in water may result in significant aggregation leading to
larger particles. In addition, higher density of DCM than water may delay the solvent
removal from the droplets and increase the uniformity of the particles. Lower viscosity of
DCM than EA may also affect the particle size.
Dichloromethane (chlorinated solvents that challenge human safety and environmental
concern) have been widely used as a good organic solvent in emulsion solvent
evaporation technique. In order to reduce the use of these toxic solvents, many
attempts have been made to prepare the polymer microspheres using a solvent with
160
lower toxicity, such as ethyl acetate, as the dispersing solvent. The effect of ethyl
acetate as a dispersing solvent was also studied in the production of different polymers
such as PLGA microspheres (Soppimath and Aminabhavi, 2002).
Table 29. Some physical properties of selected organic solvent (Patil et al., 2007; Sah, 1997)
Solvent Bp
(ºC)
Density
(g/cm3)
at 20 ºC
Solubility in
water (wt%)
at 20-25ºC
Viscosity
(Cp)
Interfacial tension
(dyne/cm)
DCM 39.8 1.3255 1.32 0.44 28.3
EA 76.7 0.9018 8.7 0.46 1.3
ACE 56.0 0.7910 miscible 0.32 -
THF 66.0 0.8892 miscible 0.48 -
6.3.1.7 Stability of the lignin acetate microspheres suspension
Table 30 shows the particle size, PDI and zeta-potential of the microspheres on the first
day of preparation and after 15, 25, 35 and 60 days in a neutral suspension at room
temperature. According to ANOVA analysis, lignin acetate microspheres prepared with
DCM were found to be stable up to 35 days (p>0.05), while the particle size was slightly
increased at 60 days (p<0.05). ANOVA results showed that the lignin acetate
microspheres prepared with EA were slightly enlarged in the first 10 days of the stability
test (p<0.05) and continued to 60 days of the test.
Zeta-potential drastically decreased over time when compared to those of freshly
prepared samples. Zeta-potential is a measure of the particle stability with greater
negative or positive charge causing more repulsion between the particles and reducing
161
the particles aggregation (Chumakova et al., 2008). The reduction of Zeta-potential over
time can be attributed to the slow diffusion of the organic solvent to the aqueous phase.
The zeta-potential of PVA particles alone (1% w/v) was reported to be -8 mV at neutral
pH (Ravi Kumar et al., 2004), therefore adhesion of PVA on the particles may alter the
particles zeta-potential. Adsorption of PVA on the surface of lignin microspheres may
be expressed by the Murakami (1999) model (Murakami et al., 1999); that is, the
hydroxyl groups of PVA molecules are fixed to the acetyl groups of Poly(lactic-co-
glycolic acid) via hydrophobic bonding (See Section 6.1.7).
162
Table 30. Average size, PDI and zeta-potential of lignin acetate microspheres prepared in dichloromethane and ethyl acetate subjected to stability test at room temperature over time. Mean value (±Standard Deviation)