Atmospheric Environment 40 (2006) 6988–7004 Physicochemical and redox characteristics of particulate matter (PM) emitted from gasoline and diesel passenger cars Michael D. Geller a , Leonidas Ntziachristos a , Athanasios Mamakos b , Zissis Samaras b , Debra A. Schmitz c , John R. Froines c , Constantinos Sioutas a, a Department of Civil and Environmental Engineering, University of Southern California, 3620 S. Vermont Avenue, Los Angeles, CA 90089, USA b Laboratory of Applied Thermodynamics, Aristotle University, Thessaloniki 54124, Greece c Center for Occupational and Environmental Health, University of California, Los Angeles, CA 90095, USA Received 23 March 2006; received in revised form 2 June 2006; accepted 12 June 2006 Abstract Particulate matter (PM) originating from mobile sources has been linked to a myriad of adverse health outcomes, ranging from cancer to cardiopulmonary disease, and an array of environmental problems, including global warming and acid rain. Till date, however, it is not clear which physical characteristics or chemical constituents of PM are significant contributors to the magnitude of the health risk. This study sought to determine the relationship between physical and chemical characteristics of PM while quantitatively measuring samples for redox activity of diesel and gasoline particulate emissions from passenger vehicles typically in use in Europe. The main objective was to relate PM chemistry to the redox activity in relation to vehicle type and driving cycle. Our results showed a high degree of correlation between several PM species, including elemental and organic carbon, low molecular weight polycyclic aromatic hydrocarbons, and trace metals such as lithium, beryllium, nickel and zinc, and the redox activity of PM, as measured by a quantitative chemical assay, the dithiothreitol (DTT) assay. The reduction in PM mass or number emission factors resulting from the various engine configurations, fuel types and/or after-treatment technologies, however, was non-linearly related to the decrease in overall PM redox activity. While the PM mass emission rate from the diesel particle filter (DPF)-equipped vehicle was on average approximately 25 times lower than that of the conventional diesel, the redox potential was only eight times lower, which makes the per mass PM redox potential of the DPF vehicle about three times higher. Thus, a strategy aimed at protecting public health and welfare by reducing total vehicle mass and number emissions may not fully achieve the desired goal of preventing the health consequences of PM exposure. Further, study of the chemical composition and interactions between various chemical species may yield greater insights into the toxicity of the PM content of vehicle exhaust. r 2006 Elsevier Ltd. All rights reserved. Keywords: Diesel; Gasoline; Ultrafine particles; Redox activity 1. Introduction Particulate matter (PM) originating from mobile sources is thought to be responsible for a myriad of adverse health outcomes, ranging from cancer to ARTICLE IN PRESS www.elsevier.com/locate/atmosenv 1352-2310/$ - see front matter r 2006 Elsevier Ltd. All rights reserved. doi:10.1016/j.atmosenv.2006.06.018 Corresponding author. E-mail address: [email protected] (C. Sioutas).
Transcript
ARTICLE IN PRESS
1352-2310/$ - se
doi:10.1016/j.at
�CorrespondE-mail addr
Atmospheric Environment 40 (2006) 6988–7004
www.elsevier.com/locate/atmosenv
Physicochemical and redox characteristics of particulate matter(PM) emitted from gasoline and diesel passenger cars
Michael D. Gellera, Leonidas Ntziachristosa, Athanasios Mamakosb,Zissis Samarasb, Debra A. Schmitzc, John R. Froinesc, Constantinos Sioutasa,�
aDepartment of Civil and Environmental Engineering, University of Southern California, 3620 S. Vermont Avenue,
Los Angeles, CA 90089, USAbLaboratory of Applied Thermodynamics, Aristotle University, Thessaloniki 54124, Greece
cCenter for Occupational and Environmental Health, University of California, Los Angeles, CA 90095, USA
Received 23 March 2006; received in revised form 2 June 2006; accepted 12 June 2006
Abstract
Particulate matter (PM) originating from mobile sources has been linked to a myriad of adverse health outcomes,
ranging from cancer to cardiopulmonary disease, and an array of environmental problems, including global warming and
acid rain. Till date, however, it is not clear which physical characteristics or chemical constituents of PM are significant
contributors to the magnitude of the health risk. This study sought to determine the relationship between physical and
chemical characteristics of PM while quantitatively measuring samples for redox activity of diesel and gasoline particulate
emissions from passenger vehicles typically in use in Europe. The main objective was to relate PM chemistry to the redox
activity in relation to vehicle type and driving cycle. Our results showed a high degree of correlation between several PM
species, including elemental and organic carbon, low molecular weight polycyclic aromatic hydrocarbons, and trace metals
such as lithium, beryllium, nickel and zinc, and the redox activity of PM, as measured by a quantitative chemical assay, the
dithiothreitol (DTT) assay. The reduction in PM mass or number emission factors resulting from the various engine
configurations, fuel types and/or after-treatment technologies, however, was non-linearly related to the decrease in overall
PM redox activity. While the PM mass emission rate from the diesel particle filter (DPF)-equipped vehicle was on average
approximately 25 times lower than that of the conventional diesel, the redox potential was only eight times lower, which
makes the per mass PM redox potential of the DPF vehicle about three times higher. Thus, a strategy aimed at protecting
public health and welfare by reducing total vehicle mass and number emissions may not fully achieve the desired goal of
preventing the health consequences of PM exposure. Further, study of the chemical composition and interactions between
various chemical species may yield greater insights into the toxicity of the PM content of vehicle exhaust.
ARTICLE IN PRESSM.D. Geller et al. / Atmospheric Environment 40 (2006) 6988–7004 6989
cardiopulmonary disease, and environmental pro-blems, from global warming to acid rain (Adleret al., 1994; Dockery et al., 1993; Lanki et al., 2006;Pope et al., 1995). Vehicles have been shown to emitsignificant particulate mass and numbers in theform of combustion byproducts and debris frommechanical wear (Cyrys et al., 2003; Shi andHarrison, 1999). Exhaust after treatment, such ascatalytic converters and diesel particle filters(DPFs), has resulted in significant reductions inthe masses of both gaseous and particulate pollu-tants. However, total particle number emissionshave not been equally reduced, with some studiesreporting increases in these emissions due to particlenucleation occurring downstream of after treatmentdevices (Sakurai et al., 2003; Vaaraslahti et al.,2004). Furthermore, Su et al. (2004) recentlyreported that modern engines emit smaller primaryparticles than older engines, which may have healthimplications.
Characterization of vehicular emissions has beenattempted mainly by three types of experimentalprocedures: on-road, tunnel, and dynamometermeasurements. While the latter method requiresdilution systems that attempt to replicate ambientconcentrations, it offers the advantage of control-ling for vehicle type, load and use of after treatmenttechnology. Various dynamometer experimentshave successfully characterized different types ofdiesel vehicles under varying loads (Kittelson, 1998;Su et al., 2004). These studies have determined thata significant fraction of diesel PM is semi-volatilewith a mode diameter typically smaller than 50 nm(nucleation mode), whereas a non-volatile (refrac-tory) portion, generally in the 50–200 nm range(accumulation mode), constitutes the bulk of PMmass and consists of particles with an elementalcarbon core and low vapor pressure hydrocarbonsand sulfur compounds adsorbed on their surface(Burtscher, 2005). Particles may be formed duringthe combustion process and as vapors cool andcondense in the exhaust lines, indicating that bothengine and ambient conditions control the fractionof semi-volatile diesel PM that is either in the gas orparticle phase.
Several studies have investigated the toxicology ofPM and co-pollutants emitted from diesel andgasoline engines (Maejima et al., 2001; Seagraveet al., 2001, 2002, 2003) including both in vivo andin vitro approaches. In most of these studies, thevehicle exhaust was treated as a mixture ofpollutants without attempting to link specific
chemical components or species of the exhaust tothe observed health outcomes. McDonald et al.(2004) reported lung toxicity and mutagenicity byusing principal component analysis and partialleast-squares regression on data from a dynam-ometer study (Zielinska et al., 2004b). The conclu-sions indicated that lung inflammation wasprimarily associated with hopanes and steranes,which are typically used as tracers of vehicularemissions, but not with any particular metal and/orPAH species. Recent in vitro research using ambientPM, however, has demonstrated a link betweenparticle-bound species, such as selected trace ele-ments and various organics, and redox activity,induction of antioxidant markers for oxidativestress, and mitochondrial damage (Li et al., 2003).
The mechanisms of PM-related health effects arestill incompletely understood, but a hypothesisunder investigation is that many of the adversehealth effects may derive from oxidative stress,initiated by the formation of reactive oxygen species(ROS) within affected cells. There is a growingliterature on specific health effects in associationwith cellular oxidative stress including the ability ofPM to induce pro-inflammatory effects in the nose,lung and cardiovascular system (Baulig et al., 2003;Donaldson et al., 2001; Li et al., 2003; Sigaud et al.,2005; Squadrito et al., 2001). High levels of ROScause a change in the redox status of the cell(Schafer et al., 2003), thereby triggering a cascade ofevents associated with inflammation and, at higherconcentrations, apoptosis (Li et al., 2001). Typi-cally, ROS are formed in cells through the reductionof oxygen by biological reducing agents such asNADH and NADPH, with the catalytic assistanceof electron transfer enzymes and redox-activechemical species such as redox-active organicchemicals and metals (Dellinger et al., 2001;Squadrito et al., 2001), and toxicity involving bothtypes of agents has been demonstrated (Veronesiet al., 1999). PM has been shown to participate inthese electron transfer reactions (Baulig et al., 2003;Li et al., 2003; Sigaud et al., 2005; Squadrito et al.,2001; Vogl and Elstner, 1989).
The objective of this study is to relate PMchemistry to chemical assays that quantitativelymeasure reactive oxygen formation (ROS) and are ameasure of redox activity with respect to vehicletype and driving cycle. This goal was accomplishedby simultaneously collecting filter samples fromvehicles for determination of particle physical andchemical characteristics and chemical assays for
ARTICLE IN PRESSM.D. Geller et al. / Atmospheric Environment 40 (2006) 6988–70046990
redox activity. The study was limited to typicaldiesel and gasoline passenger vehicles currently inuse in Europe. While this study is by no meanscomprehensive, due to the availability of limitedvehicle types, it is the first study of its kind toattempt a correlation between chemical compositionwith redox activity of PM emitted by passengervehicles.
2. Methods
2.1. Testing facility
Tests were conducted at the dynamometer facilityin the Laboratory of Applied Thermodynamics(LAT) at Aristotle University in Thessaloniki,Greece. The vehicle exhaust was primarily dilutedand conditioned according to the constant volumesampling (CVS) procedure. Exhaust was trans-ported to the tunnel through an insulated 6m longcorrugated stainless steel tube, and it was intro-duced along the tunnel axis near an orifice plate,ensuring rapid mixing with the dilution air. Apositive displacement pump controlled the nominalflow rate, 500m3 h�1, of dilute exhaust gas throughthe tunnel. In some tests, the HEPA filter wasremoved from the tunnel inlet to observe the effectof background aerosol to the particle samplescollected.
2.2. Test vehicles, fuels, and lubricants
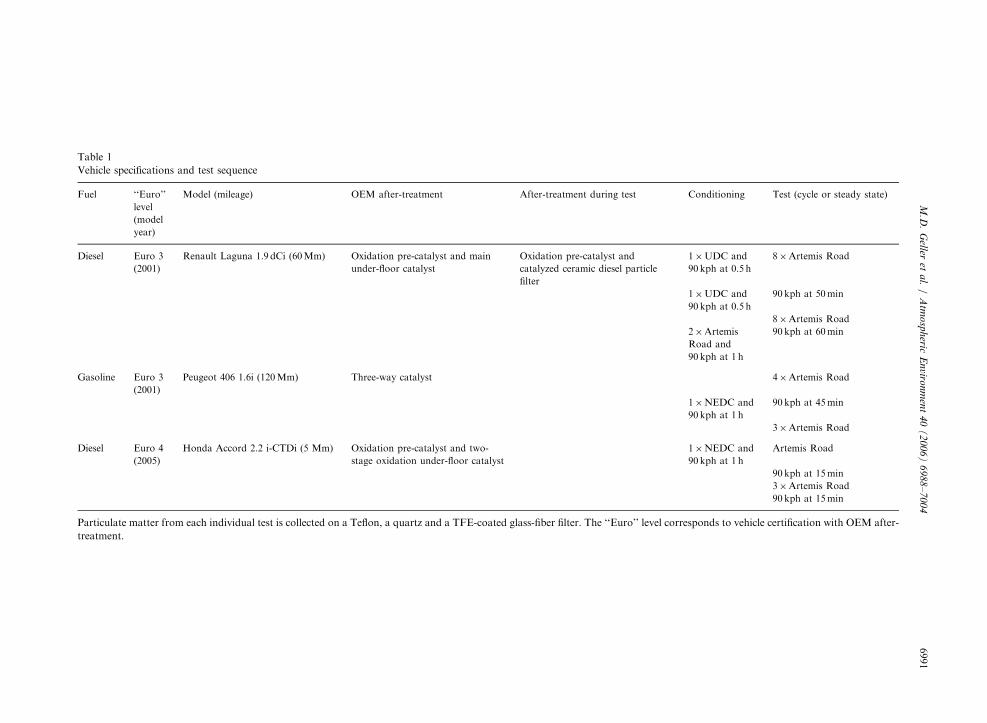
The vehicle sample set included three passengercars. The first vehicle was a 1.9 l Euro 3 diesel(Renault Laguna 1.9 dCi) retrofitted with a cata-lyzed DPF (NGK SiC 300 cpsi), which replaced amain oxidation catalyst with which the vehicle wasoriginally equipped. The catalyzed DPF was nearlynew and aged 10, 000 km. The second vehicle testedwas a Euro 3 port fuel injection spark ignitionvehicle (Peugeot 406), and the last one was a newEuro 4 compliant diesel passenger car (HondaAccord 2.2 i-CTDi) equipped with a three-stageoxidation after treatment system. Table 1 lists thecharacteristics of the different vehicles, includingtheir model year and total mileage.
The two diesel vehicles operated on diesel fuelfulfilling the specifications of the latest 2003/17/ECdirective and had a sulfur content of 8 ppmwt. Thegasoline vehicle used a fuel grade, which fulfilled therequirements of the same Directive and had a sulfurcontent of less than 50 ppmwt. The lubricant oils
used were of a grade recommended by themanufacturer but of unknown composition. TheEuro 4 diesel operated on run-in lubrication oil,which is expected to contain a relatively highermetal content than typical lubricants.
2.3. Vehicle test cycles
The vehicles were driven on a chassis dynam-ometer under both transient and steady-stateoperation. The cycles employed were the NewEuropean Driving Cycle (NEDC), the urban partof the NEDC (UDC) and the Artemis Road cycle.The latter is representative of road driving condi-tions commonly encountered in Europe and hasbeen developed in the framework of the Artemisproject (Andre, 2004). In addition, the vehicles weretested at a constant cruising speed of 90 km per hour(kph) under road load in order to sample undertypical freeway cruising conditions.
Before each measurement, the vehicle and theCVS tunnel were conditioned by driving the vehicleover a UDC or a NEDC followed by a period ofsteady speed cruising at 90 kph. This also providedthe means of checking the status of the FPS diluter(described below). A more intense conditioning ofthe CVS tunnel (2 � Artemis Road and 90 kphsteady speed) was applied before the first test of thegasoline vehicle in order to minimize the possibilityof contamination from the previously tested DPF-diesel vehicle.
2.4. Emissions sampling
ADekati Fine Particle Sampler (FPS Model FPS-4000, Dekati, Ltd., Tampere, Finland) sampled andfurther diluted a sample from the CVS tunnel withconditioned air. Depending on the emission levels ofthe vehicles tested, one or two additional ejector-type diluters have been used in order to bring theaerosol concentrations within the measuring rangeof each instrument. The dilution ratio of the FPSwas monitored daily over the 90 kph tests, usingCO2 as a trace gas. The dilution ratio of the ejectordiluters was determined by trace gas calibration inseparate measurements (Giechaskiel et al., 2004).
The instruments employed for the physicalcharacterization of the vehicle particulate emissionsare summarized below. A Condensation ParticleCounter (CPC Model 3010, TSI, Inc., St. Paul,Minnesota, USA) monitored the number of con-centration of the total particle population (50%
ARTIC
LEIN
PRES
S
Table 1
Vehicle specifications and test sequence
Fuel ‘‘Euro’’
level
(model
year)
Model (mileage) OEM after-treatment After-treatment during test Conditioning Test (cycle or steady state)
Diesel Euro 3
(2001)
Renault Laguna 1.9 dCi (60Mm) Oxidation pre-catalyst and main
Honda Accord 2.2 i-CTDi (5 Mm) Oxidation pre-catalyst and two-
stage oxidation under-floor catalyst
1�NEDC and
90 kph at 1 h
Artemis Road
90 kph at 15min
3�Artemis Road
90 kph at 15min
Particulate matter from each individual test is collected on a Teflon, a quartz and a TFE-coated glass-fiber filter. The ‘‘Euro’’ level corresponds to vehicle certification with OEM after-
treatment.
M.D
.G
elleret
al.
/A
tmo
sph
ericE
nviro
nm
ent
40
(2
00
6)
69
88
–7
00
46991
ARTICLE IN PRESSM.D. Geller et al. / Atmospheric Environment 40 (2006) 6988–70046992
cutpoint �10 nm) in real time. A Scanning MobilityParticle Sizer (SMPS Model 3936L, TSI, Inc.,St. Paul, Minnesota, USA) was employed insteadof the CPC during the steady-state runs in order tomeasure the number weighted size distributionsbetween �10 and 400 nm. The sheath-air andmonodisperse flow rates were set at 6 and 0.6 lpm,respectively. Dekati’s Diffusion Charger (DDC), aprototype diffusion charger calibrated by LAT, asdescribed by Ntziachristos et al. (2004), measuredthe active surface area of airborne particles in realtime. An Electrical Low Pressure Impactor (ELPI,Dekati, Ltd., Tampere, Finland) monitored thenumber weighted (aerodynamic) size distribution inreal time. The ELPI operated with oil-soakedsintered plates and a filter stage that extended thelower cutpoint to �7 nm. A thermodenuder (ModelELA-230, Dekati, Ltd., Tampere, Finland) was setat a fixed temperature of 250 1C, which has beenshown to adequately remove most of the volatilematerial. Thus, only solid particles will be measureddownstream of the thermodenuder.
During transient tests, the ELPI was locateddownstream of the thermodenuder and was there-fore measured the solid particle population. The
Fig. 1. Schematic of the experimental setup employed over the transi
90 kph tests, with the SMPS and the ELPI sampling simultaneously eit
remaining instruments monitored the total particlepopulation. Two additional configurations wereemployed throughout the steady-state tests, withthe SMPS and the ELPI sampling simultaneouslyupstream and downstream of the thermodenuder,which allowed for measurement of the solid andtotal particle concentrations. A schematic of thesetup employed in the measurements is shown inFig. 1.
A number of filters of different size and materialwere used in parallel to collect PM samples forchemical and toxicological analysis. Gravimetricmass and metal species concentrations were deter-mined from samples collected on 47mm Teflonfilters (2 mm pore, Pall Corp.); 47mm quartz filters(Pall Corp., East Hill, NY, USA) were also used tocollect particles for analysis of elemental andorganic carbon (EC/OC) as well as polycyclicaromatic hydrocarbons (PAH). Quartz filters werepre-baked at 550 1C for 8 h and stored in bakedaluminum foil-lined containers prior to deployment.Sampling flow rates were set at 10 lpm and werecontrolled by mass flow meters. Mass concentra-tions were determined by measuring the net filterweight gain after sampling and equilibration in a
ent tests. Two additional configurations were employed over the
her upstream or downstream of the thermodenuder.
ARTICLE IN PRESSM.D. Geller et al. / Atmospheric Environment 40 (2006) 6988–7004 6993
temperature and humidity controlled room. EC/OCconcentrations were measured by thermal opticaltransmittance (Birch and Cary, 1996), and PAHswere quantified by HPLC with selective fluorescencedetection (Eiguren-Fernandez and Miguel, 2003).Metals were determined via ICP-MS as described byLough et al. (2005). TFE-coated glass-fiber filters(Pallflex Fiberfilm T60A20-20� 25.4 cm, PallCorp.), sampling at a flow of 380 lpm, were usedto collect mass for in vitro toxicology assays. Thesefilters were washed with a solution of dichloro-methane (DCM) and methanol three times anddried prior to deployment. Such coated filters havebeen used to collect particles previously (Jang andKamens, 2001) and were chosen to minimize theorganic vapor adsorption artifacts that are oftenassociated with quartz fiber filters. In order tocollect sufficient mass on each filter, a variablenumber of test cycles were run with each vehicle,depending on its emission levels.
2.5. Dithiothreitol (DTT) assay
This assay provides a measure of the overallredox activity of the sample based on its ability tocatalyze electron transfer between DTT and oxygenin a simple chemical system (Cho et al., 2005). Theelectron transfer is monitored by the rate at whichDTT is consumed under a standardized set ofconditions and the rate is proportional to theconcentration of the catalytically active redox-activespecies in the sample. This assay has been applied toambient size-fractionated PM samples and theactivity is associated with the ability to inducehemoxygenase-1 expression (Li et al., 2003). Thisassay was used in our experiments to measure theredox potential of PM collected from differentvehicles and test configurations. Particles collectedon the TFE-coated glass-fiber filters were sonicatedin Milli-Q water for 20min. The filters wereremoved and the aqueous particle suspension wasused in the assay. The assay is described in detail byCho et al. (2005). In brief, the PM samples areincubated with DTT (100 mM) in phosphate buffer(0.1M, pH 7.4) for varying times from 0 to 30min,and the reaction quenched at preset times byaddition of 10% trichloroacetic acid. An aliquotof the quenched mixture is then transferred to atube containing Tris HCl (0.4M, pH 8.9), EDTA(20mM) and 5,50-dithiobis-2-nitrobenzoic acid(DTNB, 0.25mM). The concentration of theremaining DTT is determined from the concentra-
tion of the 5-mercapto-2-nitrobenzoic acid formedby its absorption at 412 nm. The DTT consumed isdetermined from the difference between the mer-captobenzoate formed by the blank and that formedby the sample. The data collected at the multipletime points are used to determine the rate of DTTconsumption which is normalized to the quantity ofPM used in the incubation mixture.
2.6. Calculations
All real-time CPC, DDC and ELPI recordingswere aligned with the recordings of speed and CVSflow. Then, the total particle number (ELPI–CPC)and surface area (DDC) emitted over the wholecycle were multiplied with the total flow in the CVStunnel (under normal conditions) and divided by thecorresponding distance covered. The CPC resultshave been corrected for coincidence effects. Ingeneral, this correction was small (o8%) since themeasured concentrations were effectively keptbelow 10,000 particles cm�3.
ELPI concentrations were determined consider-ing only the first seven impactor stages (notincluding the filter stage). The data reduction (whichalso considers collection due to diffusion and space-image charge) requires an assumption for theparticle effective density. The effective particledensity as a function of size was derived bycombining the ELPI and the SMPS results (Virta-nen et al., 2004). This information was available forthe steady-state tests of all vehicles, except thegasoline-fuelled car which emits particle numbers atthe ELPI noise level. The calculated effectivedensities were then used to calculate ELPI resultsalso during transient tests. The particle effectivedensity (and morphology) depends on the operatingconditions; hence, the transfer of density valuesfrom steady state to transient tests is associated withsome uncertainty. However, this approach shouldbe considered more realistic than that of unitdensity spherical particles. The latter has been usedonly for the gasoline car, because particles emittedfrom these vehicles typically do not contain a largenumber of fractal agglomerates but consist mostlyof spherical condensates of organic material withdensity on the order of 0.8–1.2 g cm�3 (Geller et al.,2006). Finally, the solid particle losses inside thethermodenuder were also accounted for accordingto Dekati, Ltd. (Dekati, 2001). For the flow rateused in the measurements (�10 lpm), the losses arealmost constant and equal to 23% from the upper
ARTICLE IN PRESSM.D. Geller et al. / Atmospheric Environment 40 (2006) 6988–70046994
size range down to 60 nm and increase withdecreasing diameter, reaching 34% at 10 nm.
3. Results and discussion
3.1. PM emissions
Table 2 displays the PM mass and chemicalspecies emissions (in mg km�1 and mg km�1 forselected PAHs) for each test, separated by vehicletype and type of after treatment. It is evident fromthe data listed in this table that the diesel vehicleretrofitted with a catalyzed DPF gave the lowest PMmatter emissions. The PM emissions ranged be-tween 0.88 and 1.02mg km�1 over the ArtemisRoad and between 0.32 and 0.56mg km�1 over thesteady states. The PM mass emissions of thegasoline vehicle under road driving conditions weredetermined to be 5.5 and 6mgkm�1. During 90 kphconstant speed cruising, the gasoline vehicle emittedextremely low particulate emissions (e.g.,0.41mg km�1), which were comparable to thoseobtained from the DPF vehicle during steady state.The conventional diesel vehicle (Honda Accord)emitted the highest amounts of PM, averaging24.975.9mg km�1 of PM over the transient testsand a slightly lower rate of 14.1mg km�1 during theconstant speed cycle. The above emission ratesindicate that the various vehicles and testingconfigurations were well within the range of typicalemission data for gasoline and diesel passenger
Table 2
Emission rates of PM mass (mgkm�1), elemental and organic carbon
Standard deviations are presented when multiple tests have been averaaSS ¼ steady state.bND: below the limit of detection.
vehicles operating with and without after-treatmenttechnologies of other studies (Zielinska et al.,2004b), which supports the generalizability ofour findings regarding PM properties from thesevehicles.
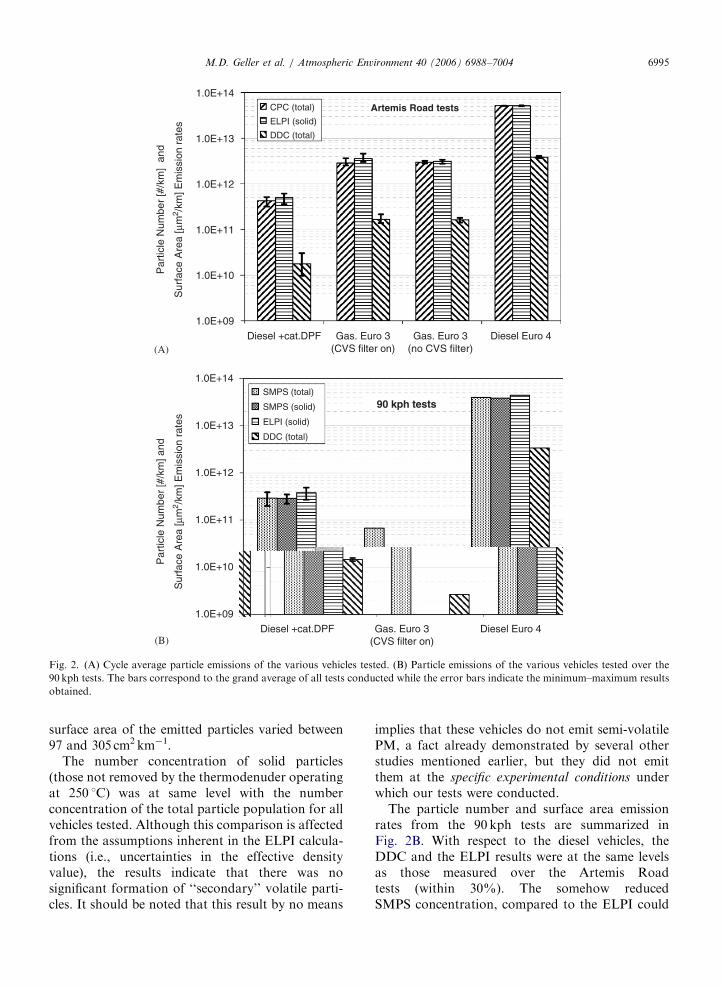
The particle number and surface area emissionrates of the different vehicles driven over the ArtemisRoad tests are summarized in Fig. 2A. To accom-modate for the different emission levels of thevehicles, the results are plotted in logarithmic scale.Generally, emissions rates by number and surfacedemonstrated similar trends as the PM mass emis-sions. The diesel vehicle was the highest particlenumber emitter, with emissions ranging between 5.15and 5.20� 1013 particles km�1 and between 3.63and 4.08m2km�1 for number and surface area,respectively. The particle numbers emitted by thegasoline vehicle varied between 2.5 and3.6� 1012 particles km�1, which are about an orderof magnitude lower than the conventional diesel. Theactive surface area of the total particle populationmeasured between 0.14 and 0.22m2 km�1. It is alsonoteworthy that the removal of the CVS filter did notseem to affect the recorded particle concentration. Itwas hypothesized that the addition of particle-ladenair could enhance nucleation by providing possiblesurfaces for vapor adsorption. The lowest particlenumber emissions were those of the DPF-equippedvehicle, ranging from 3.2 to 5.1� 1011 particles km�1,thus, almost 100-fold lower than those of theconventional diesel passenger vehicle, and the active
and selected PAH species (ng km�1)
ine Gasoline SSa Cat DPF transient Cat DPF SSa
0.3 0.4 1.070.1 0.470.1
134 13 137766 67740
491 375 482745 230778
5 1.9 1.771.4 NDb
16 3.4 7.371.7 4.070.2
1.9 0.4 0.370.3 NDb
12 5.3 1271.7 5.873.2
12 5.4 2673.2 9.676.6
4.2 17.0 1375.0 6.471.0
4.4 27.7 1774.3 1171.2
0.5 1.2 7.075.4 1.870.8
0.4 0.5 ND ND
0.4 0.3 0.270.2 ND
2.9 0.3 ND ND
ged.
ARTICLE IN PRESS
1.0E+09
1.0E+10
1.0E+11
1.0E+12
1.0E+13
1.0E+14
Diesel +cat.DPF Gas. Euro 3(CVS filter on)
Gas. Euro 3(no CVS filter)
Diesel Euro 4
CPC (total)
ELPI (solid)
DDC (total)
Par
ticle
Num
ber
[#/k
m]
and
Sur
face
Are
a [µ
m2 /
km] E
mis
sion
rat
es
Artemis Road tests
1.0E+09
1.0E+10
1.0E+11
1.0E+12
1.0E+13
1.0E+14
Diesel +cat.DPF Gas. Euro 3(CVS filter on)
Diesel Euro 4
SMPS (total)
SMPS (solid)
ELPI (solid)
DDC (total)
90 kph tests
Par
ticle
Num
ber
[#/k
m] a
nd
Sur
face
Are
a [µ
m2 /
km] E
mis
sion
rat
es
(A)
(B)
Fig. 2. (A) Cycle average particle emissions of the various vehicles tested. (B) Particle emissions of the various vehicles tested over the
90 kph tests. The bars correspond to the grand average of all tests conducted while the error bars indicate the minimum–maximum results
surface area of the emitted particles varied between97 and 305 cm2 km�1.
The number concentration of solid particles(those not removed by the thermodenuder operatingat 250 1C) was at same level with the numberconcentration of the total particle population for allvehicles tested. Although this comparison is affectedfrom the assumptions inherent in the ELPI calcula-tions (i.e., uncertainties in the effective densityvalue), the results indicate that there was nosignificant formation of ‘‘secondary’’ volatile parti-cles. It should be noted that this result by no means
implies that these vehicles do not emit semi-volatilePM, a fact already demonstrated by several otherstudies mentioned earlier, but they did not emitthem at the specific experimental conditions underwhich our tests were conducted.
The particle number and surface area emissionrates from the 90 kph tests are summarized inFig. 2B. With respect to the diesel vehicles, theDDC and the ELPI results were at the same levelsas those measured over the Artemis Roadtests (within 30%). The somehow reducedSMPS concentration, compared to the ELPI could
ARTICLE IN PRESS
1.0E+09
1.0E+10
1.0E+11
1.0E+12
1.0E+13
1.0E+14
10 100 1000
Diesel+Cat.DPF (total) Diesel+Cat.DPF (solid)
Gas. Euro 3 (total) Diesel Euro 4 (total)
Diesel Euro 4 (solid)
Mobility diameter [nm]
90 kphP
artic
le n
umbe
r flu
x [#
/km
/dlo
gDP
]
Fig. 3. Number weighted size distributions as measured with the SMPS over the 90 kph tests. The presented distributions correspond to
the average of all SMPS scans taken during each 90 kph test.
M.D. Geller et al. / Atmospheric Environment 40 (2006) 6988–70046996
be due to particles losses in the SMPS (Burtscher,2005).
Contrary to the conventional diesel vehicle, forwhich the PM number and surface area concentra-tions were slightly lower in the steady-state test,significant differences between transient and steady-state cycles were observed for the gasoline vehicle.Under steady-state conditions, the gasoline vehicleemitted 3.8� 108 particles km�1 and 26 cm2 km�1,which are about two orders of magnitude lowerthan the transient tests. The emission levels were infact lower than the limit of detection of the ELPI,which explains why there are no data available forthat instrument in Fig. 2B. The low emission levelsover steady-state tests are due to the accuratecontrol of the stoichiometric air-to-fuel ratio atconstant speed driving. In transient tests, frequentexcursions from stoichiometry during accelerationslead to an overall increase of the average emissionlevel.
Due to the variable emission levels duringtransient tests, measurements of the particle sizedistributions with the SMPS were only possibleduring steady-state runs. The number weighted sizedistributions of both total and solid particle
populations are shown in Fig. 3. A lognormaldistribution was obtained for all diesel vehicles.Moreover, similar distributions were obtained withand without thermal conditioning of the aerosol,indicating again the absence of significant numbersof non-solid particles. The aerosol geometric meandiameters were between 60 and 70 nm for the threediesel vehicle configurations. In contrast, the parti-cle size distributions of the gasoline vehicle weredistinctly different, with the number concentrationsmonotonically decreasing with particle size and ageometric mean diameter of �25 nm.
3.2. Elemental and organic carbon and PAH
emission factors
Emission factors for individual elements andcompounds are presented in Tables 2 and 3. Table2 summarizes emission factors for elemental andorganic carbon as well as PAHs. Generally, thediesel vehicle emitted the highest amounts of EC perkilometer, with the transient and steady-state cyclesranked first and second in emission rates. Incontrast to the EC data, the OC emissions duringsteady-state operation of the diesel vehicle were
ARTICLE IN PRESSM.D. Geller et al. / Atmospheric Environment 40 (2006) 6988–7004 6997
quite similar, but still the highest of all vehiclestested. Similar results for EC and OC emissionfactors were reported by Durbin et al. (2000) andZielinska et al. (2004b). The DPF-diesel vehicledemonstrated the lowest EC-OC carbon massemissions due to the effective removal of solidparticles by the catalyzed DPF. The EC levels of theDPF-equipped vehicle are about 1% of those of theconventional diesel vehicle, whereas the OC emis-sion rates are on average 11% of that vehicle. Theseresults support the argument made in previousstudies that organic carbon is often not reduced aseffectively as elemental carbon, possibly because asignificant fraction of OC may exist as vapors thatcan condense downstream of the DPF (Burtscher,2005; Mayer et al., 1999). The gasoline vehicleemitted 97% less EC and 69% less OC than thediesel vehicle, consistent with similar results pre-viously reported (Zielinska et al., 2004b).
Although both EC and OC constituted themajority of the emissions of the engines tested here,the ratio of OC to EC varied with vehicle type. ECdominated OC for the diesel vehicle, whereas OCdominated EC for the gasoline vehicle and the DPF-diesel vehicle. The ratios of OC to EC were 0.38 and0.81 for transient and steady-state driving of thediesel vehicle, respectively. The catalyzed DPFadded to the DPF-diesel vehicle removed EC andOC emissions such that they were 99% and 90%less than the diesel vehicle. In fact, the OC-EC ratiosof the DPF-diesel vehicle were 3.52 and 3.44 fortransient and steady-state driving, respectively,which closely resemble the same ratio for thegasoline vehicle (3.09).
Interesting comparisons can be drawn betweenthe PAH emissions from different vehicle config-urations. With the exception of naphthalene, forwhich the steady state and transient cycle levels weresimilar, nearly all measured PAH were reduced by40–75% when the diesel vehicle operated at steadyspeed versus varying load. Similarly, the PAHconcentrations of the DPF-diesel vehicle in thesteady-state cycle were lower than those of thetransient by 40–60%. By contrast, the steady-statecycle PAH for the gasoline vehicle were more than90% lower than those of the transient cycle, exceptfor chrysene and benzo(a)anthracene, for which thelevels were quite similar but still lower than thetransient cycle. The DPF-diesel vehicle demon-strated overall greatly reduced low molecular weightPAH, but it emitted somewhat higher concentra-tions of high molecular weight PAH when con-
trasted with the diesel vehicle. During theirrespective transient runs, naphthalene, phenan-threne, anthracene, and pyrene were more than95% lower in the exhaust of the DPF diesel vehicle,whereas benz(a)anthracene, chrysene, and benzo(b)-fluoranthene were between two- to three-fold high-er. Fluoranthene emissions were nearly equivalent.Differences in the PAH emission between these twovehicles may be due to the fact that the Euro 4vehicle has a 3-stage oxidation after-treatmentsystem with a total capacity of 3.2 l and a highprecious metal loading (up to 90 g ft�3), whereas theEuro 3 vehicle included a small closed coupledcatalyst (�0.5 l) and a 2-l catalyzed DPF with aprecious metal loading of �40 g ft�3. This meansthat the oxidation activity of the Euro 4 is muchstronger than that of the Euro 3, resulting in a moreeffective oxidation of high molecular weight PAHsaccomplished by that vehicle.
Similar trends were observed for the gasolinevehicle’s emission profile (Table 2), which alsodemonstrated greater emission of the heavierPAH, a result that is consistent with previousstudies, reporting similar differences in PAH pro-files between diesel and gasoline vehicles (Grosset al., 2000; Marr et al., 1999; Miguel et al., 1998;Venkataraman et al., 1994; Zielinska et al., 2004a).The high molecular weight PAH emission bygasoline vehicles has been attributed to the factthat lube oil in gasoline vehicles absorbs andconcentrates PAH (including heavy, particle-asso-ciated PAH) that are formed during combustion,and as a result, the PAH from these vehicles were atleast in part emitted as a component of unburnedlubrication oil. In contrast, the PAH profile of thediesel vehicles is similar to the PAH content of theirfuel (Zielinska et al., 2004b).
3.3. Elemental composition
Individual trace element and metal emissionfactors are presented in Table 3. Crustal metalsare separated at the top of the table because theseelements make up the bulk of the metal masscomposition of diesel fuel and diesel emissions(Wang et al., 2003). This holds for the results ofthe vehicles tested here with a few exceptions. Thediesel vehicle, in both steady-state and transienttesting, emitted Zn at a rate comparable to thecrustal metals. The emission profile of the gasolinevehicle was similar to those of the diesel vehicles inthat the crustal metals were among the highest
ARTICLE IN PRESS
Table 3
Emission factors of selected trace elements (ng km�1)
Element Diesel transient Diesel SS Gasoline transient Gasoline SS Cat. DPF transient Cat. DPF SS
Al 910875224 2706 22737545 252 712741 270770
Ca 69,443723,640 16,128 18,24773044 2324 24977931 8497250
Fe 22,910721,448 2036 10,26679928 138 31937297 2967191
K 46727752 1191 19357558 117 4627295 180720
Mg 30877461 997 518371706 183 279798 98711
Na 773671751 1945 223771125 321 10437507 385767
Ba 5837349 73 331755 4.8 41712 6.771.0
Be 26712 23 6.771.1 1.5 1.470.7 1.770.4
Cr 6347354 93 13876.7 8.6 15272.8 9.676.4
Cu 19447679 627 174571803 16 11667165 74746
Li 1370.2 7.9 3.071.4 0.9 0.970.2 0.570.2
Mn 3687183 76 152785 3.4 62733 4.470.2
Ni 23107656 644 10770.7 21 71721 3.270.9
Pb 7937593 79 23772.3 11 156742 1678.0
S 23,75075295 6713 870573375 349 10957156 513768
Ti 10367320 345 11879.3 24 2527302 59734
V 2879.4 11 15711 1.8 3.770.1 1.170.4
Zn 21,11874422 5620 465071225 198 5337103 73785
Standard deviations are presented when multiple tests have been averaged.
M.D. Geller et al. / Atmospheric Environment 40 (2006) 6988–70046998
elemental concentrations present in the exhaust.The concentration of sulfur in each vehicle’s exhaustwas the highest of the non-metallic elements ana-lyzed, and its relative abundance was very high ineach vehicle configuration (between second andfourth out of 18 elements). For the diesel car, thecontribution of sulfur in PM is much less than thetypical level of �15% sulfate reported by Kittelson(1998). This is probably due to the negligible sulfurcontent in the fuel (8 ppmwt) and to the lowlubricant consumption of this new vehicle. On theother hand, the relatively high amount of sulfuremitted by the gasoline vehicle (roughly 30% of thatemitted by the diesel vehicle) is due to the highersulfur content of the fuel (�50ppmwt) and thehigher lubricant consumption from this aged vehicle.
Besides iron, barium, magnesium, and copper,which were found in similar (Ba, Fe, Mg) or higher(Cu) amounts in the gasoline vehicle emissions, theconventional diesel vehicle emitted 3–5 times higheramounts per km of most metals and trace elements,a result consistent with the tunnel studies by Gelleret al. (2005). The largest difference between thegasoline and diesel vehicles was observed for Ni,whose emission rates were almost 20 times higher inthe diesel vehicle. This may be due to the potentiallyhigher metal content of the lubrication oil used inthe Euro 4 diesel vehicle, compared to the DPF andthe gasoline ones. Compared to the diesel vehicle,the DPF-diesel vehicle released on average about
70–95% lower emissions of metals and traceelements per kilometer driven.
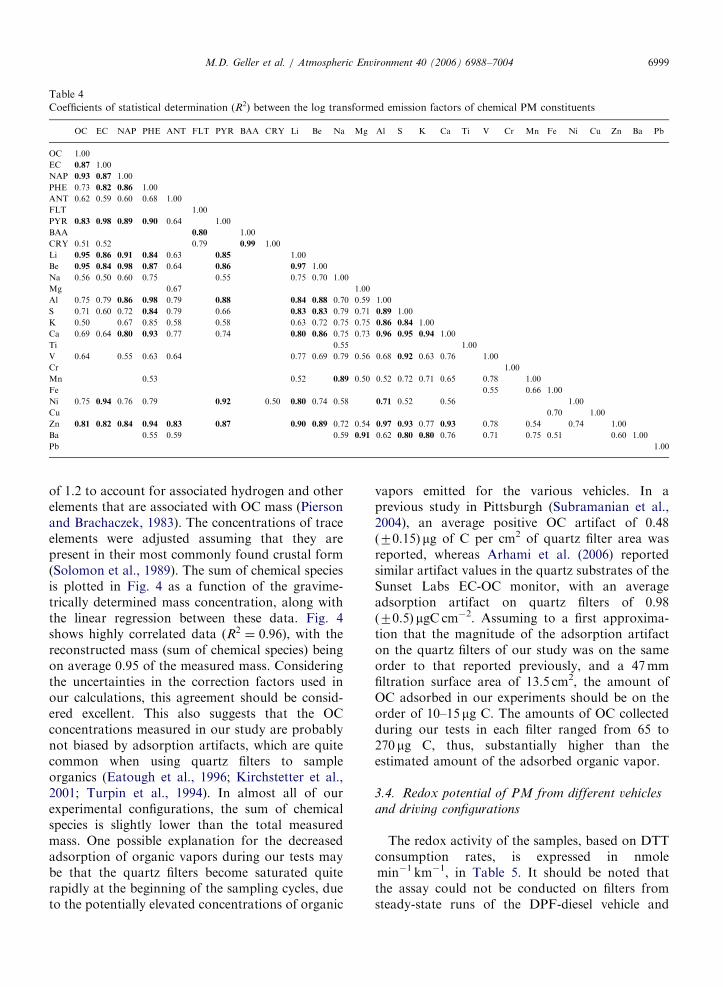
Coefficients of statistical determination (R2)between the different PM species measured in ourtesting configurations are shown in Table 4.Considering that the concentrations of trace ele-ments as well as PAH varied by more than oneorder of magnitude among different vehicle config-urations, the degree of correlation between theiremission rates was examined by transforming thesedata into their logarithms. For clarity, in ourpresentation we only included R2 values higherthan 0.5. R2 values higher than 0.80 are shown inbold letters. Only species found in measurablequantities for all vehicle configurations were in-cluded in this table. Species emitted mostly by thediesel vehicles, such as EC, light PAH (naphthalene,pyrene, phenanthrene), and metals such as Li, Be,Ti, Ni, Zn were very highly correlated, with R2
exceeding 0.75–0.80. Heavier PAH (fluoranthene,benzo anthracene, chrysene) found mostly in theemission of the gasoline vehicle were also highlycorrelated. High correlations were also obtained forFe and Cu, indicating possibly a common origin, asdiscussed earlier.
We have further attempted a comparison betweenthe sum of the measured chemical species and thegravimetrically determined mass concentrations foreach vehicle configuration tested. For the purposesof that comparison, OC was multiplied by a factor
ARTICLE IN PRESS
Table 4
Coefficients of statistical determination (R2) between the log transformed emission factors of chemical PM constituents
OC EC NAP PHE ANT FLT PYR BAA CRY Li Be Na Mg Al S K Ca Ti V Cr Mn Fe Ni Cu Zn Ba Pb
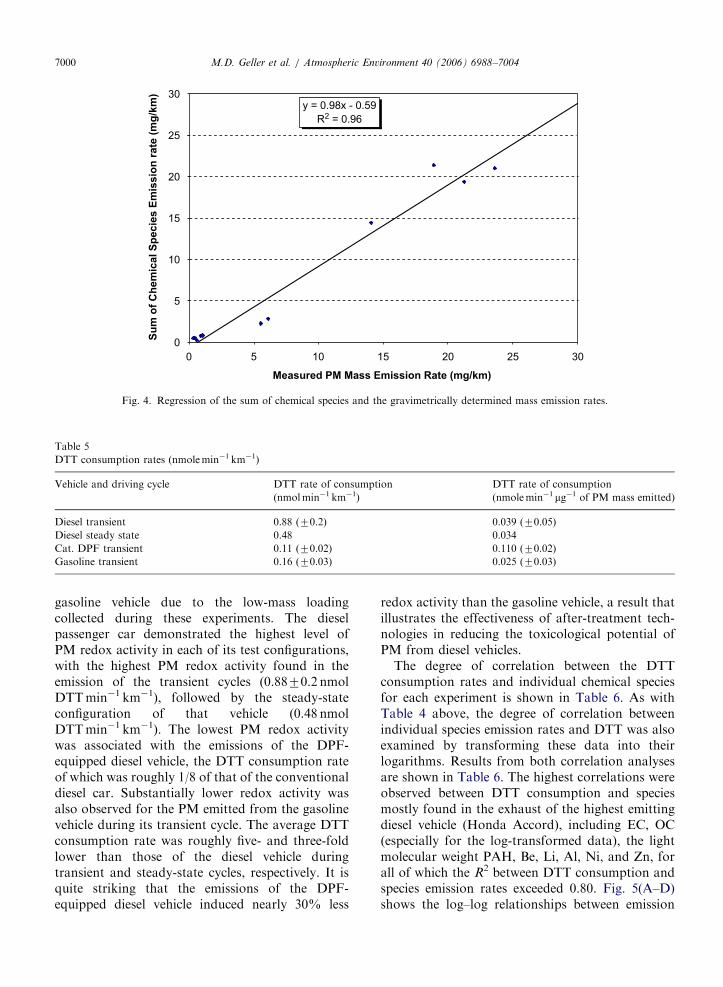
of 1.2 to account for associated hydrogen and otherelements that are associated with OC mass (Piersonand Brachaczek, 1983). The concentrations of traceelements were adjusted assuming that they arepresent in their most commonly found crustal form(Solomon et al., 1989). The sum of chemical speciesis plotted in Fig. 4 as a function of the gravime-trically determined mass concentration, along withthe linear regression between these data. Fig. 4shows highly correlated data (R2 ¼ 0:96), with thereconstructed mass (sum of chemical species) beingon average 0.95 of the measured mass. Consideringthe uncertainties in the correction factors used inour calculations, this agreement should be consid-ered excellent. This also suggests that the OCconcentrations measured in our study are probablynot biased by adsorption artifacts, which are quitecommon when using quartz filters to sampleorganics (Eatough et al., 1996; Kirchstetter et al.,2001; Turpin et al., 1994). In almost all of ourexperimental configurations, the sum of chemicalspecies is slightly lower than the total measuredmass. One possible explanation for the decreasedadsorption of organic vapors during our tests maybe that the quartz filters become saturated quiterapidly at the beginning of the sampling cycles, dueto the potentially elevated concentrations of organic
vapors emitted for the various vehicles. In aprevious study in Pittsburgh (Subramanian et al.,2004), an average positive OC artifact of 0.48(70.15) mg of C per cm2 of quartz filter area wasreported, whereas Arhami et al. (2006) reportedsimilar artifact values in the quartz substrates of theSunset Labs EC-OC monitor, with an averageadsorption artifact on quartz filters of 0.98(70.5) mgC cm�2. Assuming to a first approxima-tion that the magnitude of the adsorption artifacton the quartz filters of our study was on the sameorder to that reported previously, and a 47mmfiltration surface area of 13.5 cm2, the amount ofOC adsorbed in our experiments should be on theorder of 10–15 mg C. The amounts of OC collectedduring our tests in each filter ranged from 65 to270 mg C, thus, substantially higher than theestimated amount of the adsorbed organic vapor.
3.4. Redox potential of PM from different vehicles
and driving configurations
The redox activity of the samples, based on DTTconsumption rates, is expressed in nmolemin�1 km�1, in Table 5. It should be noted thatthe assay could not be conducted on filters fromsteady-state runs of the DPF-diesel vehicle and
ARTICLE IN PRESS
Table 5
DTT consumption rates (nmolemin�1 km�1)
Vehicle and driving cycle DTT rate of consumption
(nmolmin�1 km�1)
DTT rate of consumption
(nmolemin�1 mg�1 of PM mass emitted)
Diesel transient 0.88 (70.2) 0.039 (70.05)
Diesel steady state 0.48 0.034
Cat. DPF transient 0.11 (70.02) 0.110 (70.02)
Gasoline transient 0.16 (70.03) 0.025 (70.03)
y = 0.98x - 0.59
R2 = 0.96
0
5
10
15
20
25
30
0 5 10 15 20 25 30
Measured PM Mass Emission Rate (mg/km)
Su
m o
f C
hem
ical S
pecie
s E
mis
sio
n r
ate
(m
g/k
m)
Fig. 4. Regression of the sum of chemical species and the gravimetrically determined mass emission rates.
M.D. Geller et al. / Atmospheric Environment 40 (2006) 6988–70047000
gasoline vehicle due to the low-mass loadingcollected during these experiments. The dieselpassenger car demonstrated the highest level ofPM redox activity in each of its test configurations,with the highest PM redox activity found in theemission of the transient cycles (0.8870.2 nmolDTTmin�1 km�1), followed by the steady-stateconfiguration of that vehicle (0.48 nmolDTTmin�1 km�1). The lowest PM redox activitywas associated with the emissions of the DPF-equipped diesel vehicle, the DTT consumption rateof which was roughly 1/8 of that of the conventionaldiesel car. Substantially lower redox activity wasalso observed for the PM emitted from the gasolinevehicle during its transient cycle. The average DTTconsumption rate was roughly five- and three-foldlower than those of the diesel vehicle duringtransient and steady-state cycles, respectively. It isquite striking that the emissions of the DPF-equipped diesel vehicle induced nearly 30% less
redox activity than the gasoline vehicle, a result thatillustrates the effectiveness of after-treatment tech-nologies in reducing the toxicological potential ofPM from diesel vehicles.
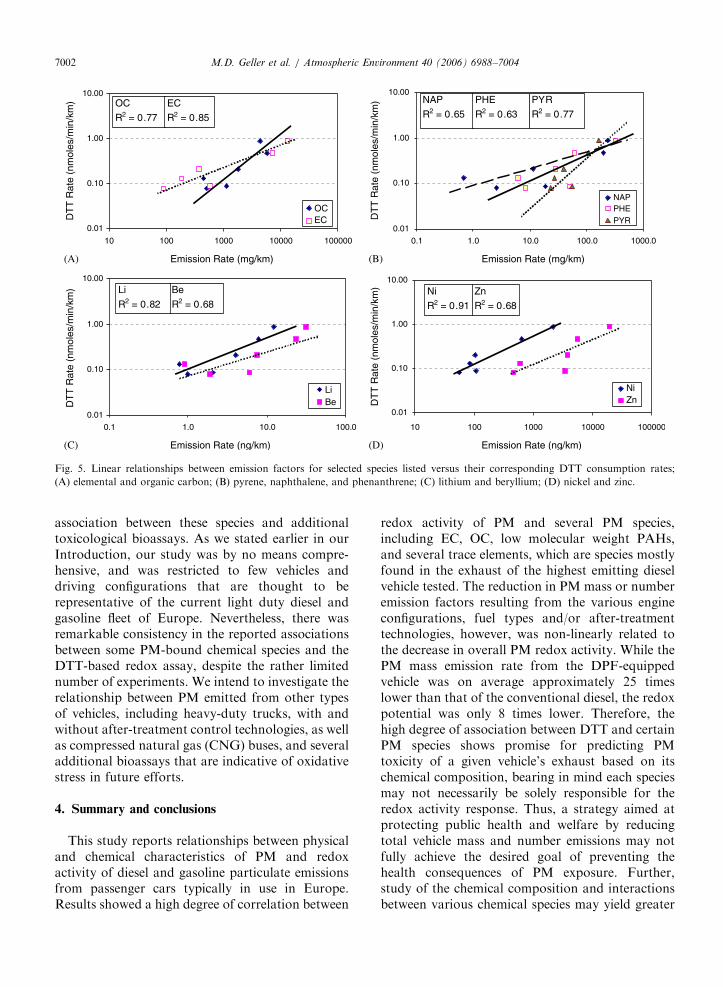
The degree of correlation between the DTTconsumption rates and individual chemical speciesfor each experiment is shown in Table 6. As withTable 4 above, the degree of correlation betweenindividual species emission rates and DTT was alsoexamined by transforming these data into theirlogarithms. Results from both correlation analysesare shown in Table 6. The highest correlations wereobserved between DTT consumption and speciesmostly found in the exhaust of the highest emittingdiesel vehicle (Honda Accord), including EC, OC(especially for the log-transformed data), the lightmolecular weight PAH, Be, Li, Al, Ni, and Zn, forall of which the R2 between DTT consumption andspecies emission rates exceeded 0.80. Fig. 5(A–D)shows the log–log relationships between emission
ARTICLE IN PRESS
Table 6
Coefficients of statistical determination (R2) between the emission
factors of chemical PM constituents and the rate of consumption
factors for the species listed in the previousparagraph versus their corresponding DTT con-sumption rates. The high degree of correlationbetween redox activity and these species persistseven in the log-transformed data, although for mostof them the R2 decreases somewhat from the0.80–0.95 to the 0.65–0.85 range. It should beemphasized here that the high correlation betweenredox activity and elements such as Li and Be maynot necessarily reflect their redox activity, but ratherthe correlation of their concentration (as shown inTable 4) and redox-active species, such as EC, OC,light PAH, Zn, and Ni, whose activity has beendemonstrated previously (Behndig et al., 2006; Choet al., 2005). The degree of correlation actuallyincreases substantially for OC (from 0.65 to 0.80)and for V (from 0.43 to 0.53) when the log-transformed emissions rates are considered. Here,we should point out some notable differencesbetween the results of this study and those ofMcDonald et al. (2004), whose study only reported
significant associations between inflammatory mar-kers and the concentrations of hopanes-steranes.It needs to be emphasized that these studies reportdifferent metrics of toxicity, but a comparisonbetween the two reveals the difficulty in associatinghealth effects with particular PM components.While PAHs and metals did not correlate with lunginflammation, certain PAHs and various metalscorrelated with the redox activity in the presentstudy. Thus, establishing the metric of toxicresponse is as important as ascertaining its relationto individual PM chemical species.
While the high degree of association betweenDTT and certain PM species appears to bepromising for predicting the PM toxicity of a givenvehicle’s exhaust based on its chemical composition,it must be reiterated that each species alone may notnecessarily be responsible for the redox activityresponse. This point is further reinforced by notingthat the reductions in DTT activity and thereductions in mass PM emission are non-linearlyrelated, as evidenced by examining the normalizedrate of DTT consumption per PM mass emitted, ametric of the PM intrinsic redox potential, shown inthe last column of Table 5. While the PMmass emission rate from the DPF-equippedvehicle was on average approximately 25 timeslower than that of the conventional diesel, theredox potential was only eight times lower, whichmakes the per mass PM redox potential of the DPFvehicle about 3 times higher, as listed in Table 5.Therefore, while particle reduction technologieseffectively reduce the vast majority of both massand number from vehicle emissions, the redoxactivity of PM in these emissions is not diminishedat the same rate.
The most obvious difference in the chemicalcomposition between the DPF-equipped vehicleand the rest of the vehicles tested is its very highOC mass fraction, accounting for roughly 60% ofthe total PM mass emitted during the transientcycle, compared to approximately 20% and 30% ofthe diesel and gasoline vehicles, respectively. Thesum of the PAH measured accounts for a very smallportion of the total OC in each vehicle, suggestingthat there may be several other organic species inthe exhaust that are potentially important from atoxicological perspective. More detailed organicspeciation of the PM emitted by various vehicleswas beyond the scope of the current study, but itcould very well be the subject of future investiga-tions, which could also examine the degree of
ARTICLE IN PRESS
0.01
0.10
1.00
10.00
10 100 1000 10000 100000
Emission Rate (mg/km)
DT
T R
ate
(nm
oles
/min
/km
)
OCEC
OC
R2 = 0.77
EC
R2 = 0.85
0.01
0.10
1.00
10.00
0.1 1.0 10.0 100.0 1000.0
Emission Rate (mg/km)
DT
T R
ate
(nm
oles
/min
/km
)
NAPPHEPYR
NAP
R2 = 0.65
PHE
R2 = 0.63
PYR
R2 = 0.77
0.01
0.10
1.00
10.00
0.1 1.0 10.0 100.0
Emission Rate (ng/km)
DT
T R
ate
(nm
oles
/min
/km
)
LiBe
Be
R2 = 0.68
Li
R2 = 0.82
0.01
0.10
1.00
10.00
10 100 1000 10000 100000
Emission Rate (ng/km)
DT
T R
ate
(nm
oles
/min
/km
)
NiZn
Ni
R2 = 0.91
Zn
R2 = 0.68
(A) (B)
(D)(C)
Fig. 5. Linear relationships between emission factors for selected species listed versus their corresponding DTT consumption rates;
(A) elemental and organic carbon; (B) pyrene, naphthalene, and phenanthrene; (C) lithium and beryllium; (D) nickel and zinc.
M.D. Geller et al. / Atmospheric Environment 40 (2006) 6988–70047002
association between these species and additionaltoxicological bioassays. As we stated earlier in ourIntroduction, our study was by no means compre-hensive, and was restricted to few vehicles anddriving configurations that are thought to berepresentative of the current light duty diesel andgasoline fleet of Europe. Nevertheless, there wasremarkable consistency in the reported associationsbetween some PM-bound chemical species and theDTT-based redox assay, despite the rather limitednumber of experiments. We intend to investigate therelationship between PM emitted from other typesof vehicles, including heavy-duty trucks, with andwithout after-treatment control technologies, as wellas compressed natural gas (CNG) buses, and severaladditional bioassays that are indicative of oxidativestress in future efforts.
4. Summary and conclusions
This study reports relationships between physicaland chemical characteristics of PM and redoxactivity of diesel and gasoline particulate emissionsfrom passenger cars typically in use in Europe.Results showed a high degree of correlation between
redox activity of PM and several PM species,including EC, OC, low molecular weight PAHs,and several trace elements, which are species mostlyfound in the exhaust of the highest emitting dieselvehicle tested. The reduction in PM mass or numberemission factors resulting from the various engineconfigurations, fuel types and/or after-treatmenttechnologies, however, was non-linearly related tothe decrease in overall PM redox activity. While thePM mass emission rate from the DPF-equippedvehicle was on average approximately 25 timeslower than that of the conventional diesel, the redoxpotential was only 8 times lower. Therefore, thehigh degree of association between DTT and certainPM species shows promise for predicting PMtoxicity of a given vehicle’s exhaust based on itschemical composition, bearing in mind each speciesmay not necessarily be solely responsible for theredox activity response. Thus, a strategy aimed atprotecting public health and welfare by reducingtotal vehicle mass and number emissions may notfully achieve the desired goal of preventing thehealth consequences of PM exposure. Further,study of the chemical composition and interactionsbetween various chemical species may yield greater
ARTICLE IN PRESSM.D. Geller et al. / Atmospheric Environment 40 (2006) 6988–7004 7003
insights into the toxicity of the PM content ofvehicle exhaust.
Acknowledgments
We would like to thank Geniki AftokinitonAEBE, member of Sarakakis Group of Companiesand official importer and distributor of HondaMotor Co Ltd, and Lion Hellas (ThessalonikiBranch) official importer and distributor of Peugeotautomobiles, for providing the Honda Accord 2.2i-CTDi and the Peugeot 406 for the measurements.
This research was supported by the SouthernCalifornia Particle Center and Supersite (SCPCS),funded by EPA under the STAR program throughGrant Nos. 53-4507-0482 and 53-4507-7721 to theUniversity of Southern California. The researchdescribed herein has not been subjected to theagency’s required peer and policy review andtherefore does not necessarily reflect the views ofthe agency, and no official endorsement should beinferred. Mention of trade names or commercialproducts does not constitute an endorsement orrecommendation for use.
The research was also funded by the Ministry ofEducation of Greece, under the Pythagoras Iprogram to Aristotle University of Thessaloniki(project number 89207).