Physicochemical Effects in Aging Aqueous Laponite SuspensionsA. Shahin and Yogesh M Joshi*
Department of Chemical Engineering, Indian Institute of Technology Kanpur, Kanpur 208016, India
*S Supporting Information
ABSTRACT: We study aging behavior of an aqueous suspension of Laponite as afunction of concentration of Laponite, concentration of salt, time elapsed sincepreparation of suspension (idle time), and temperature by carrying extensiverheological and conductivity experiments. We observe that temporal evolution ofelastic moduli, which describes structural build-up and aging, shifts to low times forexperiments carried out for higher concentration of Laponite, higher concentration ofsalt, greater temperature, and longer idle time while preserving the curvature ofevolution in the solid regime (elastic modulus greater than viscous modulus).Consequently appropriate shifting of evolution of elastic modulus in the solid regimeleads to aging time−idle time−salt concentration−Laponite concentration−temper-ature superposition. The existence of such a superposition suggests the generic natureof microstructure buildup irrespective of mentioned variables in the explored range.The behavior of shift factors needed to obtain the superposition indicate that theenergy barrier associated with structural buildup decreases with an increase in idle time and temperature and decreases linearlywith an increase in concentration of Laponite and that of salt. The conductivity experiments show that ionic conductivity of thesuspension increases with increasing Laponite concentration, salt concentration, temperature, and very importantly the idle time.We also analyze the interparticle interactions using DLVO theory that suggests an increase in idle time, temperature, and saltconcentration increases the height of the repulsive energy barrier while it decreases the width of the same when particlesapproach each other in a parallel fashion. However when particles approach each other in a perpendicular fashion, owing todissimilar charges on edge and face, the energy barrier for the attractive interaction is expected to decrease with an increase in idletime, temperature, and salt concentration. Analysis of rheological and conductivity experiments suggests a strong influence ofattractive interactions on the low energy structures in an aqueous suspension of Laponite.
I. INTRODUCTION
Smectite clay minerals are an important class of colloidalmaterials with immense academic importance and wide rangingapplications.1,2 Smectite clays have an oblate shape (layeredlike) with an aspect ratio in the range 25−1000.1 Particularlyclays embedded in aqueous media are used as rheologymodifiers in industries such as petroleum, healthcare, cosmetic,etc.3 Therefore, it is not surprising that rheological and phasebehaviors of clays have been very active areas of research overthe past several decades.1,2,4−17 In the recent literature, asynthetic clay mineral called Laponite has received significantattention due to its rich physical behavior and industrialapplications. In addition, an aqueous Laponite suspensionshows time dependence evolution of its microstructure andphysical properties that is reminiscent of physical aging inmolecular, spin, and colloidal glasses.18,19 In this work we carryout extensive rheological and conductivity studies on anaqueous suspension of Laponite and analyze various distinctcharacteristic features of aging observed in this system.Physical aging is a natural tendency of those materials that,
owing to kinetic constraints, have fallen out of thermodynamicequilibrium.20 In a physical aging process, a material explores itsphase space and undergoes time dependent evolution in orderto progressively attain lower energy microstructures.21 Thereare many soft materials such as concentrated suspensions and
emulsions, cosmetic and pharmaceutical pastes, colloidal gels,clay suspensions, foams, etc. that demonstrate physical agingand have enormous academic and industrial importance.22
Physical aging is, in principle, a reversible phenomenon. Theapplication of a deformation field reverses the effects of agingby rejuvenating the material to higher energy levels.23,24
Physical aging is analyzed by monitoring the affected physicalproperties of the material that show time dependent change. Insoft materials, the light scattering techniques are commonlyused to probe the structure and evolution of the mobility of theconstituents of materials,25−30 which also leads to the relaxationtime of the same. Bulk rheological techniques are also used tomonitor evolution of viscoelastic properties such as elastic andviscous modulus which get strongly affected by physicalaging.31−33 Recently microrheological techniques have alsobeen used to analyze soft glassy materials.34−36 For various softmaterials that are thermodynamically out of equilibrium,including aqueous Laponite suspension, ample literature isavailable that employs scattering as well as rheologicaltechniques to study the aging behavior. However, since theeffect of aging in soft glassy materials can be reversed by
Received: May 16, 2012Revised: September 9, 2012Published: October 11, 2012
application of deformation field alone, rheological techniquesare crucial for studying these phenomena.18,31,37−39
Laponite (hydrous sodium lithium magnesium silicate,Na+0.7[(Si8Mg5.5Li0.3)O20(OH)4]−0.7) is a synthetic layeredsilicate clay mineral available as a white powder. A Laponiteparticle has a disk like shape with a diameter in the range 25−30 nm with a thickness of 1 nm.40 In dry form Laponiteparticles are present in stacks with sodium ions residing in theinterparticle gallery. When dispersed in aqueous mediumsodium ions dissociate rendering a permanent negative chargeon the faces of Laponite disks. The edge of the Laponiteparticle, which is composed of hydrous oxides of magnesiumand silica, is reported to acquire a positive charge at low pH(below the pH of around 11).41 Overall Laponite particlesshare edge-to-face attractive interactions while face-to-facerepulsive interactions among each other. Addition of a salt suchas NaCl enhances the concentration of cations and anions inthe suspension which shield the charges on the particle therebyreducing repulsion among the particles. The addition ofLaponite to water, typically beyond 2 wt %, increases itsviscosity and elastic modulus by several orders of magnitudeover a short duration.31 The microstructure of Laponitesuspension and its time dependency that is responsible forsuch enormous increase in viscosity is, however, not completelyunderstood even after more than 15 years of research on thistopic.42−44 The issue of contention is whether the micro-structure of Laponite is an attractive gel (interconnectedparticles through positive edge−negative face con-tact)16,30,42,45−47 or a repulsive glass (particles in a self-suspended state in a liquid media owing to repulsion amongthem).15,48−50 Some reports claim the existence of both statesover a certain concentration regime.51 Interestingly, severalgroups have observed Laponite disks to show anisotropicorientation in a suspended state.6−9,13 Recently our groupreported that anisotropy originates at the air−suspensioninterface and percolates into the bulk as a function of time.52
The aging behavior of a Laponite suspension can berheologically monitored by applying a small amplitudeoscillatory shear to a shear melted suspension so as to recordevolution of elastic (G′) and viscous (G″) moduli as a functionof time.39,44,53,54 However, it has been observed that, unlikemany soft materials that show complete reversal of aging whena strong deformation field is applied, the evolution ofviscoelastic properties in an aqueous suspension of Laponiteis only partly reversible over a time scale of days.19,37,39,44
Shahin and Joshi44 observed that under large amplitudeoscillatory shear (shear melting protocol in an oscillatorymode) an aqueous suspension of Laponite demonstrates aplateau of complex viscosity after a sufficient time of shearing,which has a higher value for samples kept idle over a longerduration since the preparation of the suspension (we representthis time as idle time). In addition, the temporal evolution of G′and G″ after shear melting is stopped shifts to lower times forexperiments carried out on higher idle times. It was concludedthat the structure formed by Laponite particles in a suspensioncannot be completely destroyed by application of shearsuggesting irreversibility in aging over a duration of days.39,44
This observation suggests that the shear melted sample on ahigher idle time is in a more matured (low energy) state.Furthermore, for suspensions having a greater concentration ofsalt (NaCl) or experiments carried out at a higher temperature,the evolution of G′ is also observed to shift to lower timessuggesting the rate of formation of the structure to be faster
with an increase in the two mentioned variables.31,37,44,55 In thispaper we extend this work and analyze the effect of differentconcentrations of Laponite, different concentrations of salt foreach concentration of Laponite, and temperatures on the agingbehavior at various idle times by carrying out extensiverheological experiments. We simultaneously perform con-ductivity studies as a function of the same variables andestimate interparticle interactions using DLVO theory for theLaponite suspension. We believe that both of these studies givecomplementary information leading to new insights intovarious features of aging dynamics in this system.
II. MATERIAL AND EXPERIMENTAL PROTOCOLIn this work we have used smectite hectorite clay Laponite RDprocured from Southern Clay Products Inc. White powder of Laponitewas dried at 120 °C for 4 h before mixing with deionized water havingpH 10 and predetermined amount of NaCl. The pH was maintainedby addition of NaOH. Mixing was carried out using an ultra turrexdrive for a period of 45 min. Subsequent to mixing, suspensions werestored in sealed polypropylene bottles at room temperature. In thiswork we have used five Laponite concentrations: 2, 2.4, 2.8, 3.2, and3.5 wt %. For each concentration of Laponite, suspensions wereprepared with five concentrations of salt (NaCl) in the range 0.1−7mM of externally added Na+ ions (a concentration of 0.1 mM isachieved merely by NaOH used to maintain pH; therefore, thisconcentration corresponds to a no salt situation). We carried out therheological, ionic conductivity, and complexometric titration experi-ments on these 25 samples on various days elapsed since preparationof the suspensions up to 21 days (idle time) at an interval of 3 days(for some samples we also carried out experiments up to 60 days).Complexometric titration56 experiments using EDTA were carried outto confirm the stability of these suspensions at regular interval. Theseexperiments did not show the presence of Mg2+ ions for any sampleover the above-mentioned period, thereby ruling out the possibility ofMg2+ leaching from the Laponite particles.56,57
Rheological experiments were performed using a stress controlledrheometer AR 1000 (Couette geometry with a bob diameter of 28 mmand a gap of 1 mm). The procedure employed in the rheologicalexperiments is described in Figure 1. For every experiment, at a
specific idle time (mentioned in days) a fresh sample was loaded in theCouette geometry using an injection syringe, and proper care wastaken to avoid entrapment of air bubbles. After attaining thermalequilibrium the sample was shear melted using an oscillatory stress of60−80 Pa (varied depending on the concentration of Laponite) and afrequency of 0.1 Hz. The time at which shear melting was stoppedmarks the beginning of aging time (tw = 0). Subsequent to shearmelting, aging experiments were carried out by applying a smallamplitude oscillatory shear stress with magnitude 10 Pa at a frequencyof 0.1 Hz. An evolution of the viscoelastic properties of a suspensionwas monitored as a function of aging time (tw). It should be notedthat, owing to a time dependent increase in elastic modulus andviscosity, the rheological linear response regime undergoes continuousbroadening as a function of aging time. However estimation of thelinear response regime poses some practical difficulties for samples
Figure 1. Schematic representing the experimental protocol employedfor the rheological experiments.
having a small age. When the time scale associated with the stresssweep experiment is larger than the age of the sample, evolution ofviscoelastic properties takes place over the duration of the experimentforbidding the estimation of the linear response regime. At higher ages,the aging experiments were indeed carried out in the linear responseregime. Interestingly, irrespective of the age of the sample, the strainresponse to the stress controlled experiments was always close toharmonic justifying usage of G′ and G″ as discussed before in greaterdetail.39,44,58 For all of the above-mentioned concentrations, agingexperiments were carried at 10 °C.We also measured the ionic conductivity (Cyberscan PC 6000) of
all of the samples at regular intervals since preparation of suspensionsup to 18 days. In order to measure conductivity, suspension sampleswere shear melted using an injection syringe with a needle having a 0.5mm diameter and 30 mm length. In this process,the soft solid shearmelts and forms a liquid. Our experience suggests that, withinexperimental uncertainty, thte extent of shearing does not show anyeffect on the conductivity. However, as expected, for a low viscositysample, the conductivity meter shows a steady state over a shorterduration. For significantly aged samples, measurement of an accuratevalue of conductivity becomes difficult because of the high viscosity ofthe suspension. Moreover, under these conditions, measurement ofthe ionic conductivity as a function of temperatures becomes moredifficult owing a faster increase in viscosity of the suspension at hightemperatures.In addition to the experiments at different Laponite and salt
concentrations, we also studied the effect of temperature in the range10−40 °C on the evolution of viscoelastic properties of a 2.8 wt %Laponite suspension with five concentrations (0.1−7 mM) of NaCl.The temperature dependence was studied over idle time duration from3 days up to 60 days at regular intervals. In all of the rheologicalexperiments a thin layer of low viscosity silicon oil was applied on thefree surface to prevent evaporation.
III. RESULTS
We begin by discussing the results of a rheological study. Beforestarting the aging experiments all of the samples were shearmelted until the complex viscosity of the respective suspensionattained a steady state plateau. This steady state plateau ofcomplex viscosity demonstrated a higher value for experimentscarried out on greater idle times indicating the inability of thestrong shear deformation field to destroy the structure formedduring aging irrespective of the concentration of Laponite andthat of salt. Subsequently, shear melting was stopped and thesuspension was allowed to age. It is usually observed that shearmelting carried out at different stress levels does not affect thesubsequent aging if the applied stress completely rejuvenatesthe material. Therefore any excessive or otherwise shearmelting/history the material is subjected to while loading thesample is erased in the shear melting protocol. Cessation of theshear melting step marks the beginning of aging time (tw = 0).Similar to that observed for the 2.8 wt % concentrationsystem,44 evolution of G′ typically follows a two-step evolutionfor other concentrations as well. Usually for experiments carriedout on low idle times or with lesser salt concentrations,suspensions are observed to be in a liquid state (G′ < G″)immediately after the shear melting is stopped. On the otherhand, for experiments carried out on higher idle times or with agreater concentration of salt, the suspension directly enters asolid state after the shear melting (G′ > G″). In the liquidregime, G′ shows a stronger enhancement as a function of agingtime compared to that of G″ and eventually crosses the same.The point of crossover (G′ = G″) is represented as a liquid−solid transition in the literature.32 It should be noted that thispoint of transition does depend on the applied frequency (or atime scale of probe),39 as also observed for glass transition in
molecular glasses.59 In the solid state (G′ > G″), G′ increaseswith a weaker dependence on aging time and G″decreases aftershowing a maxima. We also perform aging experiments atdifferent frequencies. Interestingly, G′ does not show anydependence on frequency beyond G′ > G″. However G″ showsa weak decrease with frequency in the solid state.As mentioned before, evolution of G′ and G″ for experiments
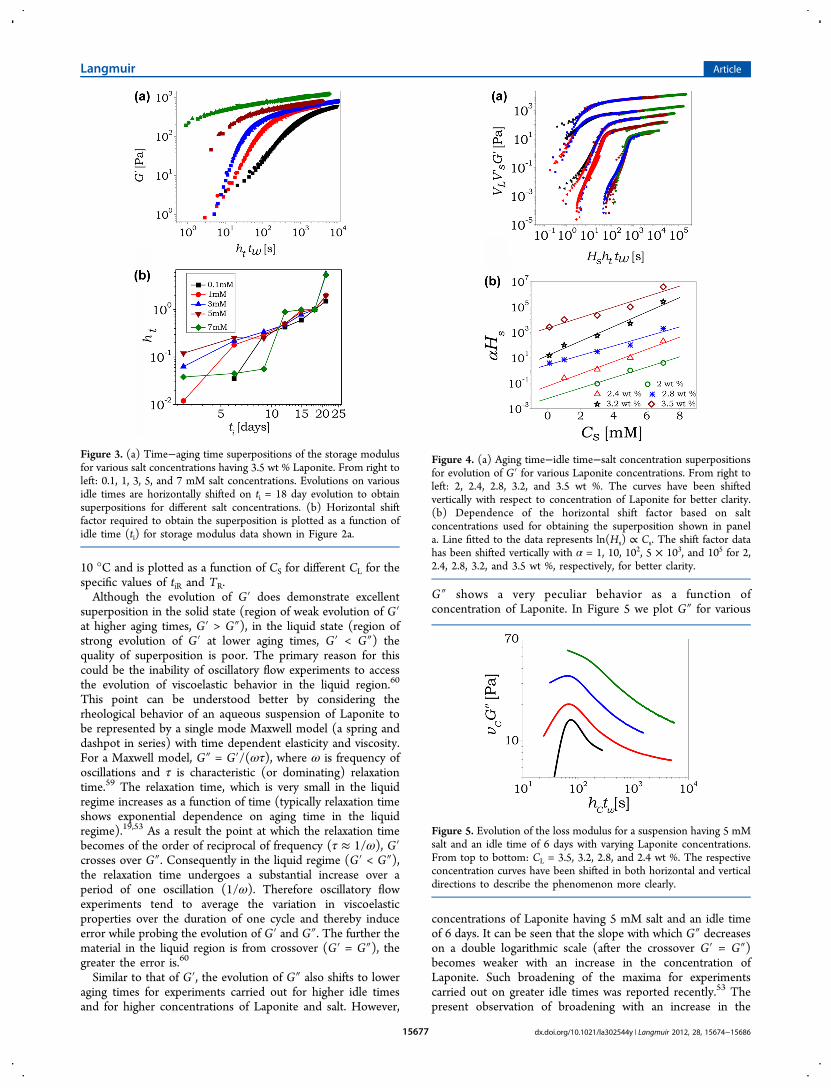
on Laponite suspension carried out at higher idle times andwith greater concentration of salt shift to lower aging times.The representative behavior for a 3.5 wt % suspension isplotted in Figure 2. It can be seen that the curvature of the
evolution of G′ beyond the crossover is self-similar, which leadsto an aging time−idle time superposition for variousconcentrations of salt as shown in Figure 3a. Varioussuperpositions of G′ at different concentrations of salt alsoshare self-similar curvature in the solid state (G′ > G″) andproduce aging time−idle time−salt concentration superpositionfor all of the explored concentrations of Laponite. We reportthese superpositions in Figure 4a. Similar to the effect of idletime and salt concentration, evolution of the elastic (andviscous) modulus at higher Laponite concentration shifts tolower aging times. In order to get the aging time−idle time−saltconcentration superposition at various Laponite concentrationsshown in Figure 4a, we have primarily carried out thehorizontal shifting of all of the G′ evolutions. The verticalshift factor is required for salt concentration dependent shifting,though the value of Vs is observed to be of the order of unity(vertical shift factor VL shown in Figure 4a is merely used toshow the superpositions for various Laponite concentrationsclearly). The horizontal shift factors (ht) associated with idletime shifting (shown in Figure 3b) were observed to increasewith the increase in idle time. The salt concentration dependenthorizontal shift factors (HS) plotted as a function ofconcentration of salt for various concentrations of Laponiteare shown in Figure 4b. It can be seen that the shift factorsshow an exponential dependence on salt concentrationrepresented by ln(HS) ≈ CS, irrespective of the Laponiteconcentration in the explored range of 2−3.5 wt %. It should benoted that various shift factors discussed in this work are notindependent and separable from others and do depend onvalues of other variables. For example, in Figure 3a, ht =H(CL,CS,ti,T), where CL = 3.5 wt % and T = 10 °C, and isplotted as a function of CS and ti in Figure 3b. Similarly inFigure 3a, HSht = H(CL,CS,tiR,TR), where tiR = 18 day and TR =
Figure 2. Evolution of storage (symbols) and loss moduli (lines) ondifferent idle times (ti) for a suspension having 1 mM salt and 3.5 wt %Laponite.
10 °C and is plotted as a function of CS for different CL for thespecific values of tiR and TR.Although the evolution of G′ does demonstrate excellent
superposition in the solid state (region of weak evolution of G′at higher aging times, G′ > G″), in the liquid state (region ofstrong evolution of G′ at lower aging times, G′ < G″) thequality of superposition is poor. The primary reason for thiscould be the inability of oscillatory flow experiments to accessthe evolution of viscoelastic behavior in the liquid region.60
This point can be understood better by considering therheological behavior of an aqueous suspension of Laponite tobe represented by a single mode Maxwell model (a spring anddashpot in series) with time dependent elasticity and viscosity.For a Maxwell model, G″ = G′/(ωτ), where ω is frequency ofoscillations and τ is characteristic (or dominating) relaxationtime.59 The relaxation time, which is very small in the liquidregime increases as a function of time (typically relaxation timeshows exponential dependence on aging time in the liquidregime).19,53 As a result the point at which the relaxation timebecomes of the order of reciprocal of frequency (τ ≈ 1/ω), G′crosses over G″. Consequently in the liquid regime (G′ < G″),the relaxation time undergoes a substantial increase over aperiod of one oscillation (1/ω). Therefore oscillatory flowexperiments tend to average the variation in viscoelasticproperties over the duration of one cycle and thereby induceerror while probing the evolution of G′ and G″. The further thematerial in the liquid region is from crossover (G′ = G″), thegreater the error is.60
Similar to that of G′, the evolution of G″ also shifts to loweraging times for experiments carried out for higher idle timesand for higher concentrations of Laponite and salt. However,
G″ shows a very peculiar behavior as a function ofconcentration of Laponite. In Figure 5 we plot G″ for various
concentrations of Laponite having 5 mM salt and an idle timeof 6 days. It can be seen that the slope with which G″ decreaseson a double logarithmic scale (after the crossover G′ = G″)becomes weaker with an increase in the concentration ofLaponite. Such broadening of the maxima for experimentscarried out on greater idle times was reported recently.53 Thepresent observation of broadening with an increase in the
Figure 3. (a) Time−aging time superpositions of the storage modulusfor various salt concentrations having 3.5 wt % Laponite. From right toleft: 0.1, 1, 3, 5, and 7 mM salt concentrations. Evolutions on variousidle times are horizontally shifted on ti = 18 day evolution to obtainsuperpositions for different salt concentrations. (b) Horizontal shiftfactor required to obtain the superposition is plotted as a function ofidle time (ti) for storage modulus data shown in Figure 2a.
Figure 4. (a) Aging time−idle time−salt concentration superpositionsfor evolution of G′ for various Laponite concentrations. From right toleft: 2, 2.4, 2.8, 3.2, and 3.5 wt %. The curves have been shiftedvertically with respect to concentration of Laponite for better clarity.(b) Dependence of the horizontal shift factor based on saltconcentrations used for obtaining the superposition shown in panela. Line fitted to the data represents ln(Hs) ∝ Cs. The shift factor datahas been shifted vertically with α = 1, 10, 102, 5 × 10³, and 105 for 2,2.4, 2.8, 3.2, and 3.5 wt %, respectively, for better clarity.
Figure 5. Evolution of the loss modulus for a suspension having 5 mMsalt and an idle time of 6 days with varying Laponite concentrations.From top to bottom: CL = 3.5, 3.2, 2.8, and 2.4 wt %. The respectiveconcentration curves have been shifted in both horizontal and verticaldirections to describe the phenomenon more clearly.
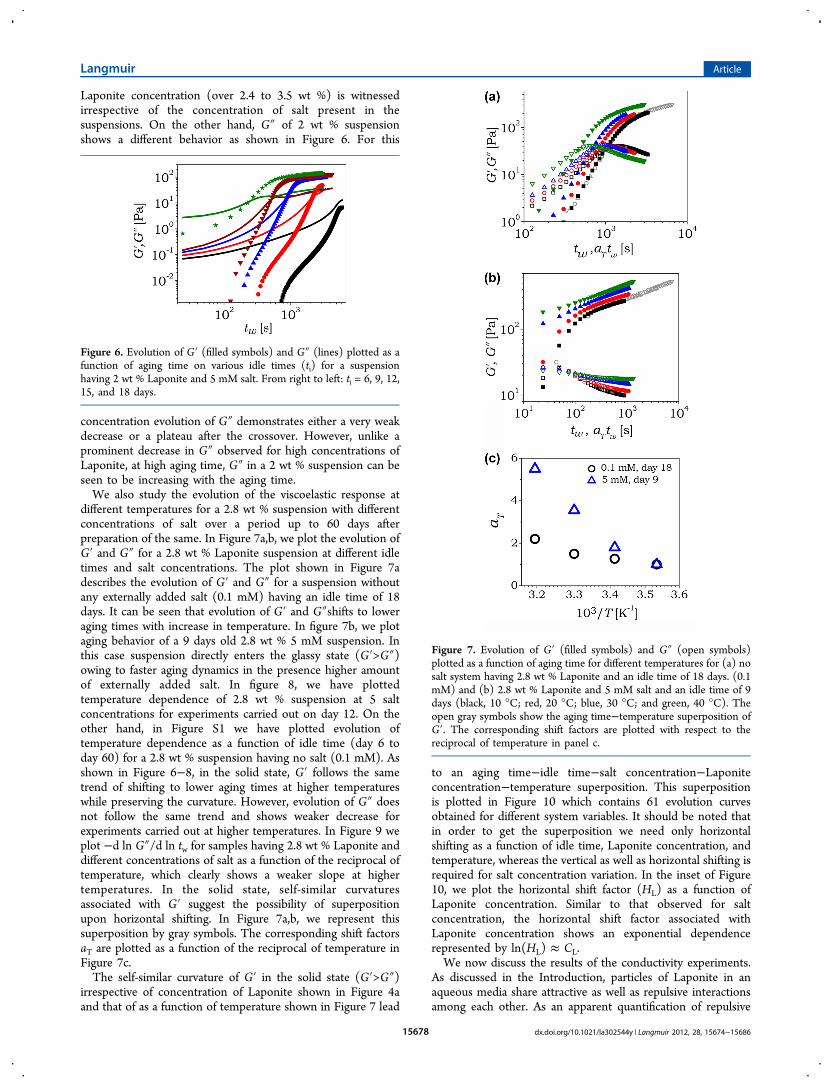
Laponite concentration (over 2.4 to 3.5 wt %) is witnessedirrespective of the concentration of salt present in thesuspensions. On the other hand, G″ of 2 wt % suspensionshows a different behavior as shown in Figure 6. For this
concentration evolution of G″ demonstrates either a very weakdecrease or a plateau after the crossover. However, unlike aprominent decrease in G″ observed for high concentrations ofLaponite, at high aging time, G″ in a 2 wt % suspension can beseen to be increasing with the aging time.We also study the evolution of the viscoelastic response at
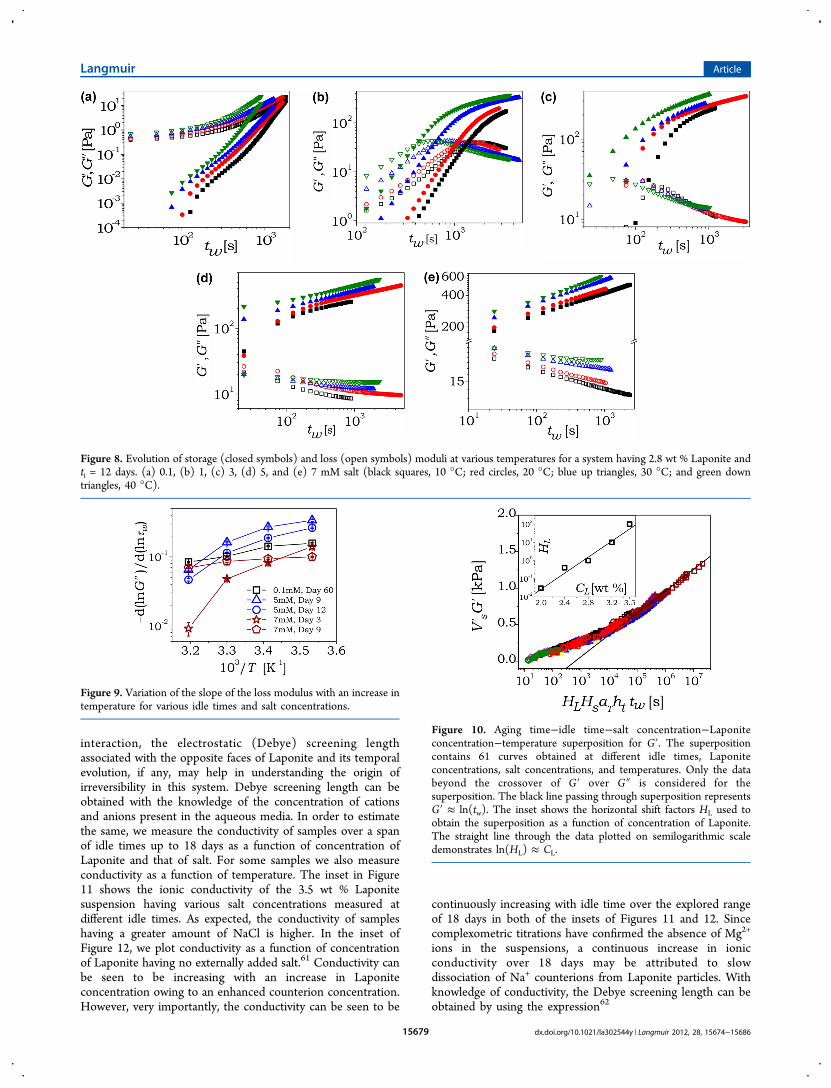
different temperatures for a 2.8 wt % suspension with differentconcentrations of salt over a period up to 60 days afterpreparation of the same. In Figure 7a,b, we plot the evolution ofG′ and G″ for a 2.8 wt % Laponite suspension at different idletimes and salt concentrations. The plot shown in Figure 7adescribes the evolution of G′ and G″ for a suspension withoutany externally added salt (0.1 mM) having an idle time of 18days. It can be seen that evolution of G′ and G″shifts to loweraging times with increase in temperature. In figure 7b, we plotaging behavior of a 9 days old 2.8 wt % 5 mM suspension. Inthis case suspension directly enters the glassy state (G′>G″)owing to faster aging dynamics in the presence higher amountof externally added salt. In figure 8, we have plottedtemperature dependence of 2.8 wt % suspension at 5 saltconcentrations for experiments carried out on day 12. On theother hand, in Figure S1 we have plotted evolution oftemperature dependence as a function of idle time (day 6 today 60) for a 2.8 wt % suspension having no salt (0.1 mM). Asshown in Figure 6−8, in the solid state, G′ follows the sametrend of shifting to lower aging times at higher temperatureswhile preserving the curvature. However, evolution of G″ doesnot follow the same trend and shows weaker decrease forexperiments carried out at higher temperatures. In Figure 9 weplot −d ln G″/d ln tw for samples having 2.8 wt % Laponite anddifferent concentrations of salt as a function of the reciprocal oftemperature, which clearly shows a weaker slope at highertemperatures. In the solid state, self-similar curvaturesassociated with G′ suggest the possibility of superpositionupon horizontal shifting. In Figure 7a,b, we represent thissuperposition by gray symbols. The corresponding shift factorsaT are plotted as a function of the reciprocal of temperature inFigure 7c.The self-similar curvature of G′ in the solid state (G′>G″)
irrespective of concentration of Laponite shown in Figure 4aand that of as a function of temperature shown in Figure 7 lead
to an aging time−idle time−salt concentration−Laponiteconcentration−temperature superposition. This superpositionis plotted in Figure 10 which contains 61 evolution curvesobtained for different system variables. It should be noted thatin order to get the superposition we need only horizontalshifting as a function of idle time, Laponite concentration, andtemperature, whereas the vertical as well as horizontal shifting isrequired for salt concentration variation. In the inset of Figure10, we plot the horizontal shift factor (HL) as a function ofLaponite concentration. Similar to that observed for saltconcentration, the horizontal shift factor associated withLaponite concentration shows an exponential dependencerepresented by ln(HL) ≈ CL.We now discuss the results of the conductivity experiments.
As discussed in the Introduction, particles of Laponite in anaqueous media share attractive as well as repulsive interactionsamong each other. As an apparent quantification of repulsive
Figure 6. Evolution of G′ (filled symbols) and G″ (lines) plotted as afunction of aging time on various idle times (ti) for a suspensionhaving 2 wt % Laponite and 5 mM salt. From right to left: ti = 6, 9, 12,15, and 18 days.
Figure 7. Evolution of G′ (filled symbols) and G″ (open symbols)plotted as a function of aging time for different temperatures for (a) nosalt system having 2.8 wt % Laponite and an idle time of 18 days. (0.1mM) and (b) 2.8 wt % Laponite and 5 mM salt and an idle time of 9days (black, 10 °C; red, 20 °C; blue, 30 °C; and green, 40 °C). Theopen gray symbols show the aging time−temperature superposition ofG′. The corresponding shift factors are plotted with respect to thereciprocal of temperature in panel c.
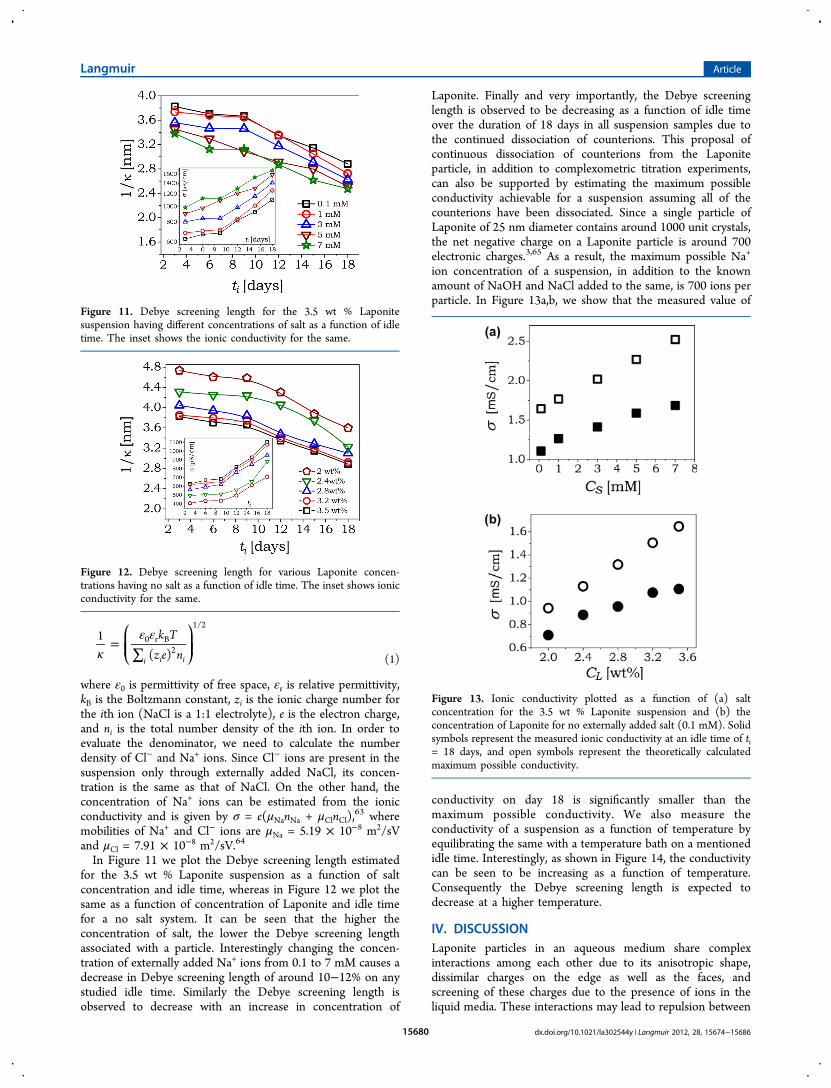
interaction, the electrostatic (Debye) screening lengthassociated with the opposite faces of Laponite and its temporalevolution, if any, may help in understanding the origin ofirreversibility in this system. Debye screening length can beobtained with the knowledge of the concentration of cationsand anions present in the aqueous media. In order to estimatethe same, we measure the conductivity of samples over a spanof idle times up to 18 days as a function of concentration ofLaponite and that of salt. For some samples we also measureconductivity as a function of temperature. The inset in Figure11 shows the ionic conductivity of the 3.5 wt % Laponitesuspension having various salt concentrations measured atdifferent idle times. As expected, the conductivity of sampleshaving a greater amount of NaCl is higher. In the inset ofFigure 12, we plot conductivity as a function of concentrationof Laponite having no externally added salt.61 Conductivity canbe seen to be increasing with an increase in Laponiteconcentration owing to an enhanced counterion concentration.However, very importantly, the conductivity can be seen to be
continuously increasing with idle time over the explored rangeof 18 days in both of the insets of Figures 11 and 12. Sincecomplexometric titrations have confirmed the absence of Mg2+
ions in the suspensions, a continuous increase in ionicconductivity over 18 days may be attributed to slowdissociation of Na+ counterions from Laponite particles. Withknowledge of conductivity, the Debye screening length can beobtained by using the expression62
Figure 8. Evolution of storage (closed symbols) and loss (open symbols) moduli at various temperatures for a system having 2.8 wt % Laponite andti = 12 days. (a) 0.1, (b) 1, (c) 3, (d) 5, and (e) 7 mM salt (black squares, 10 °C; red circles, 20 °C; blue up triangles, 30 °C; and green downtriangles, 40 °C).
Figure 9. Variation of the slope of the loss modulus with an increase intemperature for various idle times and salt concentrations.
Figure 10. Aging time−idle time−salt concentration−Laponiteconcentration−temperature superposition for G′. The superpositioncontains 61 curves obtained at different idle times, Laponiteconcentrations, salt concentrations, and temperatures. Only the databeyond the crossover of G′ over G″ is considered for thesuperposition. The black line passing through superposition representsG′ ≈ ln(tw). The inset shows the horizontal shift factors HL used toobtain the superposition as a function of concentration of Laponite.The straight line through the data plotted on semilogarithmic scaledemonstrates ln(HL) ≈ CL.
where ε0 is permittivity of free space, εr is relative permittivity,kB is the Boltzmann constant, zi is the ionic charge number forthe ith ion (NaCl is a 1:1 electrolyte), e is the electron charge,and ni is the total number density of the ith ion. In order toevaluate the denominator, we need to calculate the numberdensity of Cl− and Na+ ions. Since Cl− ions are present in thesuspension only through externally added NaCl, its concen-tration is the same as that of NaCl. On the other hand, theconcentration of Na+ ions can be estimated from the ionicconductivity and is given by σ = e(μNanNa + μClnCl),
63 wheremobilities of Na+ and Cl− ions are μNa = 5.19 × 10⁻⁸ m2/sVand μCl = 7.91 × 10⁻⁸ m2/sV.64
In Figure 11 we plot the Debye screening length estimatedfor the 3.5 wt % Laponite suspension as a function of saltconcentration and idle time, whereas in Figure 12 we plot thesame as a function of concentration of Laponite and idle timefor a no salt system. It can be seen that the higher theconcentration of salt, the lower the Debye screening lengthassociated with a particle. Interestingly changing the concen-tration of externally added Na+ ions from 0.1 to 7 mM causes adecrease in Debye screening length of around 10−12% on anystudied idle time. Similarly the Debye screening length isobserved to decrease with an increase in concentration of
Laponite. Finally and very importantly, the Debye screeninglength is observed to be decreasing as a function of idle timeover the duration of 18 days in all suspension samples due tothe continued dissociation of counterions. This proposal ofcontinuous dissociation of counterions from the Laponiteparticle, in addition to complexometric titration experiments,can also be supported by estimating the maximum possibleconductivity achievable for a suspension assuming all of thecounterions have been dissociated. Since a single particle ofLaponite of 25 nm diameter contains around 1000 unit crystals,the net negative charge on a Laponite particle is around 700electronic charges.3,65 As a result, the maximum possible Na+
ion concentration of a suspension, in addition to the knownamount of NaOH and NaCl added to the same, is 700 ions perparticle. In Figure 13a,b, we show that the measured value of
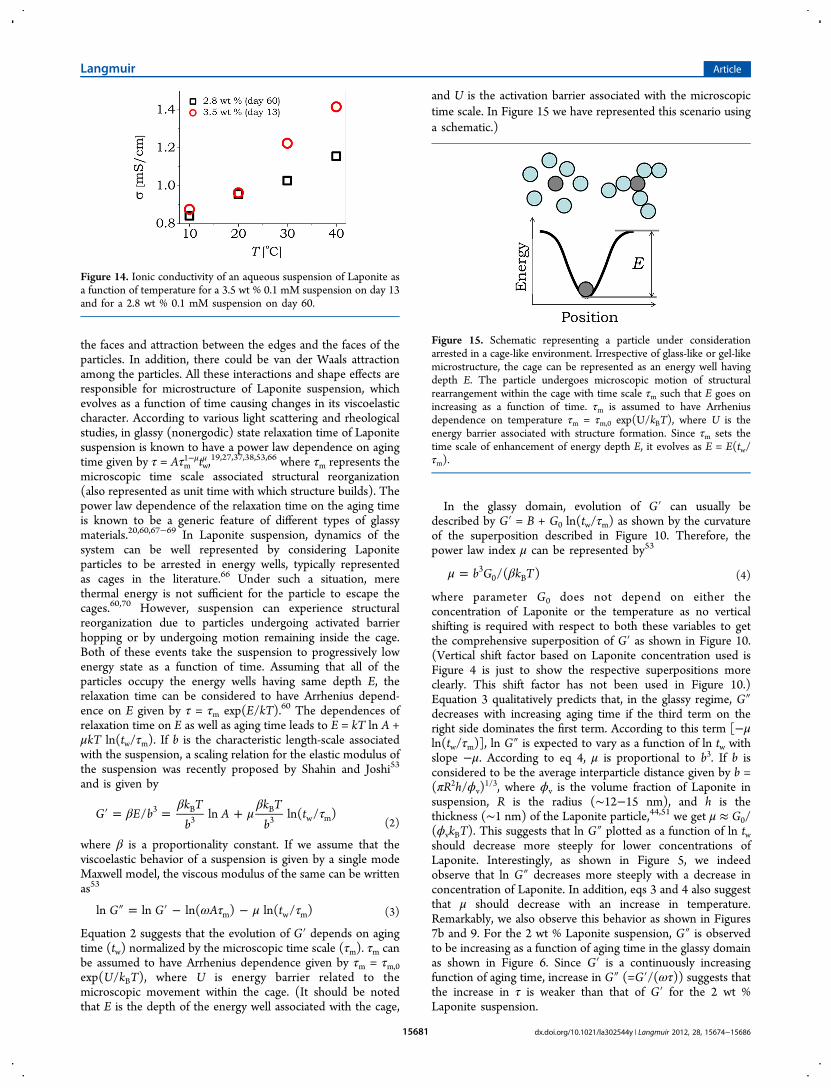
conductivity on day 18 is significantly smaller than themaximum possible conductivity. We also measure theconductivity of a suspension as a function of temperature byequilibrating the same with a temperature bath on a mentionedidle time. Interestingly, as shown in Figure 14, the conductivitycan be seen to be increasing as a function of temperature.Consequently the Debye screening length is expected todecrease at a higher temperature.
IV. DISCUSSIONLaponite particles in an aqueous medium share complexinteractions among each other due to its anisotropic shape,dissimilar charges on the edge as well as the faces, andscreening of these charges due to the presence of ions in theliquid media. These interactions may lead to repulsion between
Figure 11. Debye screening length for the 3.5 wt % Laponitesuspension having different concentrations of salt as a function of idletime. The inset shows the ionic conductivity for the same.
Figure 12. Debye screening length for various Laponite concen-trations having no salt as a function of idle time. The inset shows ionicconductivity for the same.
Figure 13. Ionic conductivity plotted as a function of (a) saltconcentration for the 3.5 wt % Laponite suspension and (b) theconcentration of Laponite for no externally added salt (0.1 mM). Solidsymbols represent the measured ionic conductivity at an idle time of ti= 18 days, and open symbols represent the theoretically calculatedmaximum possible conductivity.
the faces and attraction between the edges and the faces of theparticles. In addition, there could be van der Waals attractionamong the particles. All these interactions and shape effects areresponsible for microstructure of Laponite suspension, whichevolves as a function of time causing changes in its viscoelasticcharacter. According to various light scattering and rheologicalstudies, in glassy (nonergodic) state relaxation time of Laponitesuspension is known to have a power law dependence on agingtime given by τ = Aτm
1−μtwμ ,19,27,37,38,53,66 where τm represents the
microscopic time scale associated structural reorganization(also represented as unit time with which structure builds). Thepower law dependence of the relaxation time on the aging timeis known to be a generic feature of different types of glassymaterials.20,60,67−69 In Laponite suspension, dynamics of thesystem can be well represented by considering Laponiteparticles to be arrested in energy wells, typically representedas cages in the literature.66 Under such a situation, merethermal energy is not sufficient for the particle to escape thecages.60,70 However, suspension can experience structuralreorganization due to particles undergoing activated barrierhopping or by undergoing motion remaining inside the cage.Both of these events take the suspension to progressively lowenergy state as a function of time. Assuming that all of theparticles occupy the energy wells having same depth E, therelaxation time can be considered to have Arrhenius depend-ence on E given by τ = τm exp(E/kT).60 The dependences ofrelaxation time on E as well as aging time leads to E = kT ln A +μkT ln(tw/τm). If b is the characteristic length-scale associatedwith the suspension, a scaling relation for the elastic modulus ofthe suspension was recently proposed by Shahin and Joshi53
and is given by
ββ
μβ
τ′ = = +G E bk Tb
Ak Tb
t/ ln ln( / )3 B3
B3 w m (2)
where β is a proportionality constant. If we assume that theviscoelastic behavior of a suspension is given by a single modeMaxwell model, the viscous modulus of the same can be writtenas53
ω τ μ τ″ = ′ − −G G A tln ln ln( ) ln( / )m w m (3)
Equation 2 suggests that the evolution of G′ depends on agingtime (tw) normalized by the microscopic time scale (τm). τm canbe assumed to have Arrhenius dependence given by τm = τm,0exp(U/kBT), where U is energy barrier related to themicroscopic movement within the cage. (It should be notedthat E is the depth of the energy well associated with the cage,
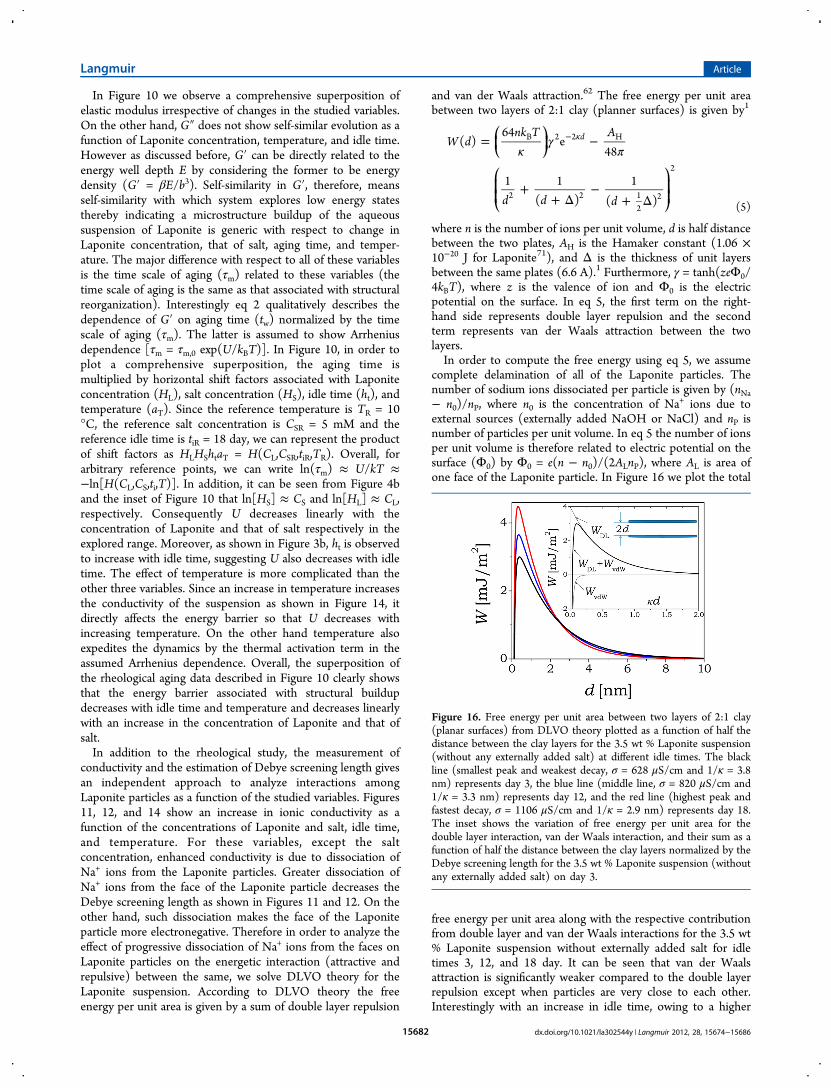
and U is the activation barrier associated with the microscopictime scale. In Figure 15 we have represented this scenario usinga schematic.)
In the glassy domain, evolution of G′ can usually bedescribed by G′ = B + G0 ln(tw/τm) as shown by the curvatureof the superposition described in Figure 10. Therefore, thepower law index μ can be represented by53
μ β= b G k T/( )30 B (4)
where parameter G0 does not depend on either theconcentration of Laponite or the temperature as no verticalshifting is required with respect to both these variables to getthe comprehensive superposition of G′ as shown in Figure 10.(Vertical shift factor based on Laponite concentration used isFigure 4 is just to show the respective superpositions moreclearly. This shift factor has not been used in Figure 10.)Equation 3 qualitatively predicts that, in the glassy regime, G″decreases with increasing aging time if the third term on theright side dominates the first term. According to this term [−μln(tw/τm)], ln G″ is expected to vary as a function of ln tw withslope −μ. According to eq 4, μ is proportional to b3. If b isconsidered to be the average interparticle distance given by b =(πR2h/ϕv)
1/3, where ϕv is the volume fraction of Laponite insuspension, R is the radius (∼12−15 nm), and h is thethickness (∼1 nm) of the Laponite particle,44,51 we get μ ≈ G0/(ϕvkBT). This suggests that ln G″ plotted as a function of ln twshould decrease more steeply for lower concentrations ofLaponite. Interestingly, as shown in Figure 5, we indeedobserve that ln G″ decreases more steeply with a decrease inconcentration of Laponite. In addition, eqs 3 and 4 also suggestthat μ should decrease with an increase in temperature.Remarkably, we also observe this behavior as shown in Figures7b and 9. For the 2 wt % Laponite suspension, G″ is observedto be increasing as a function of aging time in the glassy domainas shown in Figure 6. Since G′ is a continuously increasingfunction of aging time, increase in G″ (=G′/(ωτ)) suggests thatthe increase in τ is weaker than that of G′ for the 2 wt %Laponite suspension.
Figure 14. Ionic conductivity of an aqueous suspension of Laponite asa function of temperature for a 3.5 wt % 0.1 mM suspension on day 13and for a 2.8 wt % 0.1 mM suspension on day 60.
Figure 15. Schematic representing a particle under considerationarrested in a cage-like environment. Irrespective of glass-like or gel-likemicrostructure, the cage can be represented as an energy well havingdepth E. The particle undergoes microscopic motion of structuralrearrangement within the cage with time scale τm such that E goes onincreasing as a function of time. τm is assumed to have Arrheniusdependence on temperature τm = τm,0 exp(U/kBT), where U is theenergy barrier associated with structure formation. Since τm sets thetime scale of enhancement of energy depth E, it evolves as E = E(tw/τm).
In Figure 10 we observe a comprehensive superposition ofelastic modulus irrespective of changes in the studied variables.On the other hand, G″ does not show self-similar evolution as afunction of Laponite concentration, temperature, and idle time.However as discussed before, G′ can be directly related to theenergy well depth E by considering the former to be energydensity (G′ = βE/b3). Self-similarity in G′, therefore, meansself-similarity with which system explores low energy statesthereby indicating a microstructure buildup of the aqueoussuspension of Laponite is generic with respect to change inLaponite concentration, that of salt, aging time, and temper-ature. The major difference with respect to all of these variablesis the time scale of aging (τm) related to these variables (thetime scale of aging is the same as that associated with structuralreorganization). Interestingly eq 2 qualitatively describes thedependence of G′ on aging time (tw) normalized by the timescale of aging (τm). The latter is assumed to show Arrheniusdependence [τm = τm,0 exp(U/kBT)]. In Figure 10, in order toplot a comprehensive superposition, the aging time ismultiplied by horizontal shift factors associated with Laponiteconcentration (HL), salt concentration (HS), idle time (ht), andtemperature (aT). Since the reference temperature is TR = 10°C, the reference salt concentration is CSR = 5 mM and thereference idle time is tiR = 18 day, we can represent the productof shift factors as HLHShtaT = H(CL,CSR,tiR,TR). Overall, forarbitrary reference points, we can write ln(τm) ≈ U/kT ≈−ln[H(CL,CS,ti,T)]. In addition, it can be seen from Figure 4band the inset of Figure 10 that ln[HS] ≈ CS and ln[HL] ≈ CL,respectively. Consequently U decreases linearly with theconcentration of Laponite and that of salt respectively in theexplored range. Moreover, as shown in Figure 3b, ht is observedto increase with idle time, suggesting U also decreases with idletime. The effect of temperature is more complicated than theother three variables. Since an increase in temperature increasesthe conductivity of the suspension as shown in Figure 14, itdirectly affects the energy barrier so that U decreases withincreasing temperature. On the other hand temperature alsoexpedites the dynamics by the thermal activation term in theassumed Arrhenius dependence. Overall, the superposition ofthe rheological aging data described in Figure 10 clearly showsthat the energy barrier associated with structural buildupdecreases with idle time and temperature and decreases linearlywith an increase in the concentration of Laponite and that ofsalt.In addition to the rheological study, the measurement of
conductivity and the estimation of Debye screening length givesan independent approach to analyze interactions amongLaponite particles as a function of the studied variables. Figures11, 12, and 14 show an increase in ionic conductivity as afunction of the concentrations of Laponite and salt, idle time,and temperature. For these variables, except the saltconcentration, enhanced conductivity is due to dissociation ofNa+ ions from the Laponite particles. Greater dissociation ofNa+ ions from the face of the Laponite particle decreases theDebye screening length as shown in Figures 11 and 12. On theother hand, such dissociation makes the face of the Laponiteparticle more electronegative. Therefore in order to analyze theeffect of progressive dissociation of Na+ ions from the faces onLaponite particles on the energetic interaction (attractive andrepulsive) between the same, we solve DLVO theory for theLaponite suspension. According to DLVO theory the freeenergy per unit area is given by a sum of double layer repulsion
and van der Waals attraction.62 The free energy per unit areabetween two layers of 2:1 clay (planner surfaces) is given by1
κγ
π= −
++ Δ
−+ Δ
κ−⎛⎝⎜
⎞⎠⎟
⎛⎝⎜⎜
⎞⎠⎟⎟
W dnk T A
d d d
( )64
e48
1 1( )
1( )
dB 2 2 H
2 2 12
2
2
(5)
where n is the number of ions per unit volume, d is half distancebetween the two plates, AH is the Hamaker constant (1.06 ×10⁻²⁰ J for Laponite71), and Δ is the thickness of unit layersbetween the same plates (6.6 A).1 Furthermore, γ = tanh(zeΦ0/4kBT), where z is the valence of ion and Φ0 is the electricpotential on the surface. In eq 5, the first term on the right-hand side represents double layer repulsion and the secondterm represents van der Waals attraction between the twolayers.In order to compute the free energy using eq 5, we assume
complete delamination of all of the Laponite particles. Thenumber of sodium ions dissociated per particle is given by (nNa− n0)/nP, where n0 is the concentration of Na+ ions due toexternal sources (externally added NaOH or NaCl) and nP isnumber of particles per unit volume. In eq 5 the number of ionsper unit volume is therefore related to electric potential on thesurface (Φ0) by Φ0 = e(n − n0)/(2ALnP), where AL is area ofone face of the Laponite particle. In Figure 16 we plot the total
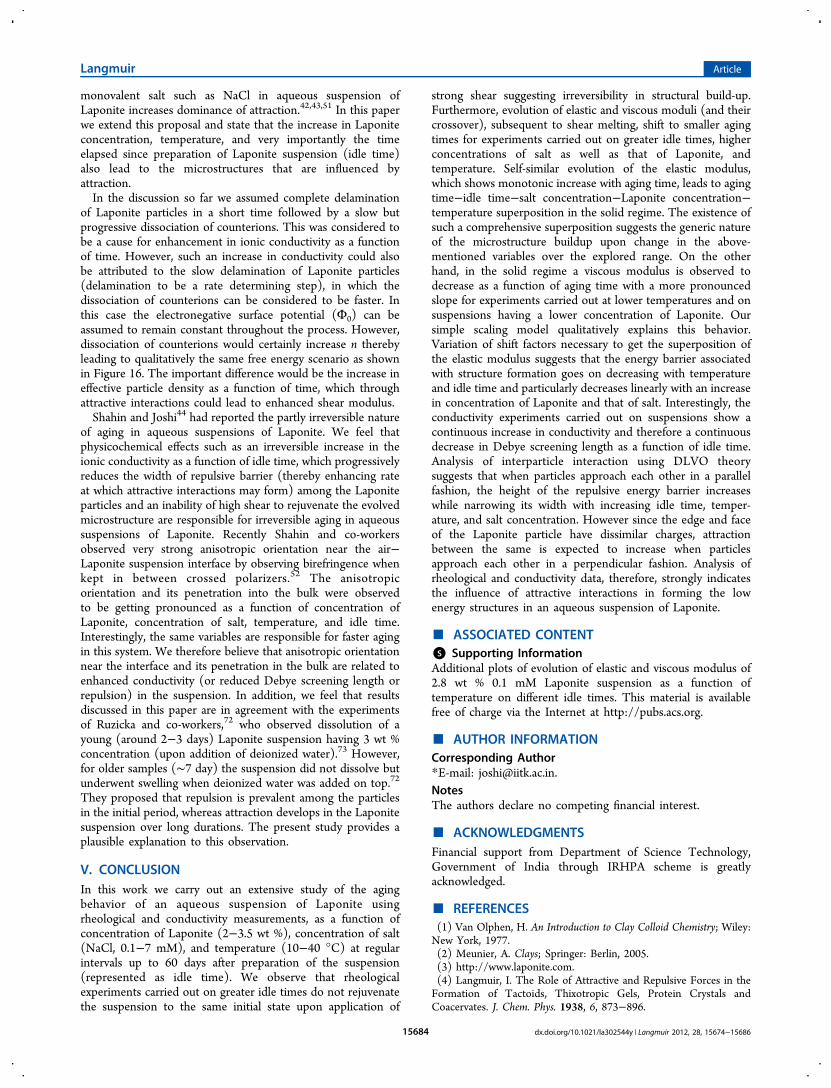
free energy per unit area along with the respective contributionfrom double layer and van der Waals interactions for the 3.5 wt% Laponite suspension without externally added salt for idletimes 3, 12, and 18 day. It can be seen that van der Waalsattraction is significantly weaker compared to the double layerrepulsion except when particles are very close to each other.Interestingly with an increase in idle time, owing to a higher
Figure 16. Free energy per unit area between two layers of 2:1 clay(planar surfaces) from DLVO theory plotted as a function of half thedistance between the clay layers for the 3.5 wt % Laponite suspension(without any externally added salt) at different idle times. The blackline (smallest peak and weakest decay, σ = 628 μS/cm and 1/κ = 3.8nm) represents day 3, the blue line (middle line, σ = 820 μS/cm and1/κ = 3.3 nm) represents day 12, and the red line (highest peak andfastest decay, σ = 1106 μS/cm and 1/κ = 2.9 nm) represents day 18.The inset shows the variation of free energy per unit area for thedouble layer interaction, van der Waals interaction, and their sum as afunction of half the distance between the clay layers normalized by theDebye screening length for the 3.5 wt % Laponite suspension (withoutany externally added salt) on day 3.
value of coefficient γ2 arising from a greater negative surfacepotential (Φ0), the height of the repulsive barrier that particlesneed to cross in order to approach each other in parallel fashionincreases. On the other hand, the width of the repulsive barrierbecomes narrower as a function of idle time due to strongerexponential decay (e−2kd) caused by a decrease in the Debyescreening length 1/κ). We expect a qualitatively similarbehavior as shown in Figure 16 when the idle time is replacedby temperature. For the case of externally added salt (CS), theincrease in CS, for the same extent of dissociation ofcounterions, will decrease the Debye screening length furtherwithout affecting the value of the coefficient γ2. However since,κ ≈ n0.5 the coefficient of the double layer repulsion term(nkBT/κ) given by eq 5, will still scale as nkBT/κ ≈ n0.5. Thiswould, therefore, lead to an increase in the height of therepulsive barrier while making its width narrower with anincrease in CS when particles approach each other in a parallelfashion. Therefore the scenario will be qualitatively similar tothat described by Figure 16 when the increase in idle time isreplaced by an increase in T as well as CS.The results of the rheological study suggest a decrease in the
energy barrier for structure formation with an increase in idletime, salt concentration, and temperature (time scale associatedwith increase in G′ shifts to lower times with increase in ti, CS,and T). Therefore, although the height of the repulsive energybarrier is increasing, the fact that the width of the same isshrinking (reduction in Debye screening length) with anincrease in ti, CS, and T is intuitively in disagreement with theproposal of low energy structures being repulsion dominated.In order to quantitatively probe effect of repulsive interactionson the low energy structure, we analyze the time scaleassociated with structure formation at which material undergoesa liquid−solid transition with respect to the Debye screeninglength. In Figure 18, we plot aging time at which G′ crossesover G″ as a function of the normalized Debye screening length(the Debye screening length divided by the averageinterparticle distance 1/(bκ)) for 1 and 3 mM saltconcentration suspensions having different Laponite concen-trations (For 2.4, 2.8, 3.2, and 3.5 wt % suspension, value of b isapproximately 42, 40, 39, and 37 nm, respectively). Werepresent this crossover time by tw*. As mentioned before, if weassume the material behavior to be represented by a timedependent single mode Maxwell model, the point at which G′crosses over G″ corresponds to τ = 1/ω. Since, in all of theexperiments we have employed fixed ω = 0.1 Hz, tw* representsthe time at which the dominating relaxation time of thesuspension reaches a level of 10 s. It can be seen in Figure 16that the Debye screening length is around or less than 10% ofthat of the average interparticle distance. For a givenconcentration of Laponite and salt, points from right to leftsuggest an increase in idle time, which causes a decreases in theDebye screening length (or increase in electronegative surfacepotential) as shown in Figures 11 and 12. Figure 17 shows thattw* continuously decreases with a decrease in Debye screeninglength. Furthermore, for a given concentration of Laponite, anincrease in CS shifts the dependence of tw* on 1/(bκ) to lowervalues of tw*. If low energy structures are repulsive in origin, wewould have expected tw* to be a decreasing function of 1/(bκ),contrary to experimental observation. In addition, the overallbehavior described in Figure 17 suggests that the concentrationof Laponite and that of salt affect the dynamics independentlyin addition to the Debye screening length. In purely repulsiveinteractions, we would have expected tw* to demonstrate a
superposition as a function of 1/(bκ) irrespective of varioussystem variables.While undergoing thermal motion, rather than approaching
in a parallel fashion, if two Laponite particles approach eachother in a perpendicular fashion or from the sides as shown inthe schematic in Figure 18, owing to dissimilar charges on the
edge and on the face, we intuitively expect the repulsive energybarrier to reduce with an increase in the negative surfacepotential (Φ0) and/or a reduction in the Debye screeninglength. Interestingly, this proposal agrees well with the findingsof the rheological study. When particles approach each other ina perpendicular fashion, they form a house of cards structure,whereas when they approach each other from the sides, theyform an overlapping coin configuration. Interestingly, a veryrecent Monte Carlo simulation study inspired by Laponitesuspension reports a mixture of both of these configurations.16
Although simply based on rheological and conductivity resultsit is difficult to comment on the precise microstructure, variousresults discussed in this paper make it amply clear that lowenergy structures associated with an aqueous suspension ofLaponite are influenced by attraction among Laponite particles.In the literature it is clearly established that addition of
Figure 17. Aging time at cross over (tw*) of G′ and G″ is plottedagainst the normalized Debye screening length for various Laponiteconcentrations [square, 2.4 wt %; circles, 2.8 wt %; triangles, 3.2 wt %;and stars, 3.5 wt %]. Filled blue symbols represent the 1 mM NaClconcentration, and open black symbols represent the 3 mMconcentration.
Figure 18. Schematic of a scenario when two Laponite particles, owingto thermal motion, approach each other (a) in a perpendicular fashionand (b) from the sides.
monovalent salt such as NaCl in aqueous suspension ofLaponite increases dominance of attraction.42,43,51 In this paperwe extend this proposal and state that the increase in Laponiteconcentration, temperature, and very importantly the timeelapsed since preparation of Laponite suspension (idle time)also lead to the microstructures that are influenced byattraction.In the discussion so far we assumed complete delamination
of Laponite particles in a short time followed by a slow butprogressive dissociation of counterions. This was considered tobe a cause for enhancement in ionic conductivity as a functionof time. However, such an increase in conductivity could alsobe attributed to the slow delamination of Laponite particles(delamination to be a rate determining step), in which thedissociation of counterions can be considered to be faster. Inthis case the electronegative surface potential (Φ0) can beassumed to remain constant throughout the process. However,dissociation of counterions would certainly increase n therebyleading to qualitatively the same free energy scenario as shownin Figure 16. The important difference would be the increase ineffective particle density as a function of time, which throughattractive interactions could lead to enhanced shear modulus.Shahin and Joshi44 had reported the partly irreversible nature
of aging in aqueous suspensions of Laponite. We feel thatphysicochemical effects such as an irreversible increase in theionic conductivity as a function of idle time, which progressivelyreduces the width of repulsive barrier (thereby enhancing rateat which attractive interactions may form) among the Laponiteparticles and an inability of high shear to rejuvenate the evolvedmicrostructure are responsible for irreversible aging in aqueoussuspensions of Laponite. Recently Shahin and co-workersobserved very strong anisotropic orientation near the air−Laponite suspension interface by observing birefringence whenkept in between crossed polarizers.52 The anisotropicorientation and its penetration into the bulk were observedto be getting pronounced as a function of concentration ofLaponite, concentration of salt, temperature, and idle time.Interestingly, the same variables are responsible for faster agingin this system. We therefore believe that anisotropic orientationnear the interface and its penetration in the bulk are related toenhanced conductivity (or reduced Debye screening length orrepulsion) in the suspension. In addition, we feel that resultsdiscussed in this paper are in agreement with the experimentsof Ruzicka and co-workers,72 who observed dissolution of ayoung (around 2−3 days) Laponite suspension having 3 wt %concentration (upon addition of deionized water).73 However,for older samples (∼7 day) the suspension did not dissolve butunderwent swelling when deionized water was added on top.72
They proposed that repulsion is prevalent among the particlesin the initial period, whereas attraction develops in the Laponitesuspension over long durations. The present study provides aplausible explanation to this observation.
V. CONCLUSIONIn this work we carry out an extensive study of the agingbehavior of an aqueous suspension of Laponite usingrheological and conductivity measurements, as a function ofconcentration of Laponite (2−3.5 wt %), concentration of salt(NaCl, 0.1−7 mM), and temperature (10−40 °C) at regularintervals up to 60 days after preparation of the suspension(represented as idle time). We observe that rheologicalexperiments carried out on greater idle times do not rejuvenatethe suspension to the same initial state upon application of
strong shear suggesting irreversibility in structural build-up.Furthermore, evolution of elastic and viscous moduli (and theircrossover), subsequent to shear melting, shift to smaller agingtimes for experiments carried out on greater idle times, higherconcentrations of salt as well as that of Laponite, andtemperature. Self-similar evolution of the elastic modulus,which shows monotonic increase with aging time, leads to agingtime−idle time−salt concentration−Laponite concentration−temperature superposition in the solid regime. The existence ofsuch a comprehensive superposition suggests the generic natureof the microstructure buildup upon change in the above-mentioned variables over the explored range. On the otherhand, in the solid regime a viscous modulus is observed todecrease as a function of aging time with a more pronouncedslope for experiments carried out at lower temperatures and onsuspensions having a lower concentration of Laponite. Oursimple scaling model qualitatively explains this behavior.Variation of shift factors necessary to get the superposition ofthe elastic modulus suggests that the energy barrier associatedwith structure formation goes on decreasing with temperatureand idle time and particularly decreases linearly with an increasein concentration of Laponite and that of salt. Interestingly, theconductivity experiments carried out on suspensions show acontinuous increase in conductivity and therefore a continuousdecrease in Debye screening length as a function of idle time.Analysis of interparticle interaction using DLVO theorysuggests that when particles approach each other in a parallelfashion, the height of the repulsive energy barrier increaseswhile narrowing its width with increasing idle time, temper-ature, and salt concentration. However since the edge and faceof the Laponite particle have dissimilar charges, attractionbetween the same is expected to increase when particlesapproach each other in a perpendicular fashion. Analysis ofrheological and conductivity data, therefore, strongly indicatesthe influence of attractive interactions in forming the lowenergy structures in an aqueous suspension of Laponite.
■ ASSOCIATED CONTENT*S Supporting InformationAdditional plots of evolution of elastic and viscous modulus of2.8 wt % 0.1 mM Laponite suspension as a function oftemperature on different idle times. This material is availablefree of charge via the Internet at http://pubs.acs.org.
■ ACKNOWLEDGMENTSFinancial support from Department of Science Technology,Government of India through IRHPA scheme is greatlyacknowledged.
■ REFERENCES(1) Van Olphen, H. An Introduction to Clay Colloid Chemistry; Wiley:New York, 1977.(2) Meunier, A. Clays; Springer: Berlin, 2005.(3) http://www.laponite.com.(4) Langmuir, I. The Role of Attractive and Repulsive Forces in theFormation of Tactoids, Thixotropic Gels, Protein Crystals andCoacervates. J. Chem. Phys. 1938, 6, 873−896.
(5) Luckham, P. F.; Rossi, S. Colloidal and rheological properties ofbentonite suspensions. Adv. Colloid Interface Sci. 1999, 82, 43−92.(6) Paineau, E.; Antonova, K.; Baravian, C.; Bihannic, I.; Davidson,P.; Dozov, I.; Imperor-Clerc, M.; Levitz, P.; Madsen, A.; Meneau, F.;Michot, L. J. Liquid-Crystalline Nematic Phase in AqueousSuspensions of a Disk-Shaped Natural Beidellite Clay. J. Phys. Chem.B 2009, 113, 15858−15869.(7) Michot, L. J.; Bihannic, I.; Maddi, S.; Funari, S. S.; Baravian, C.;Levitz, P.; Davidson, P. Liquid-crystalline aqueous clay suspensions.Pro. Natl. Acad. Sci. 2006, 103, 16101−16104.(8) Lemaire, B. J.; Panine, P.; Gabriel, J. C. P.; Davidson, P. Themeasurement by SAXS of the nematic order parameter of laponitegels. Europhys. Lett. 2002, 59, 55−61.(9) Gabriel, J.-C. P.; Sanchez, C.; Davidson, P. Observation ofnematic liquid-crystal textures in aqueous gels of smectite clays. J. Phys.Chem. 1996, 100, 11139−11143.(10) Paineau, E.; Bihannic, I.; Baravian, C.; Philippe, A. M.;Davidson, P.; Levitz, P.; Funari, S. S.; Rochas, C.; Michot, L. J.Aqueous Suspensions of Natural Swelling Clay Minerals. 1. Structureand Electrostatic Interactions. Langmuir 2011, 27, 5562−5573.(11) Paineau, E.; Michot, L. J.; Bihannic, I.; Baravian, C. AqueousSuspensions of Natural Swelling Clay Minerals. 2. RheologicalCharacterization. Langmuir 2011, 27, 7806−7819.(12) Chang, S. H.; Ryan, M. H.; Gupta, R. K. The effect of pH, ionicstrength, and temperature on the rheology and stability of aqueousclay suspensions. Rheol. Acta 1993, 32, 263−269.(13) van der Beek, D.; Lekkerkerker, H. N. W. Nematic ordering vs.gelation in suspensions of charged platelets. Europhys. Lett. 2003, 61,702−707.(14) Shalkevich, A.; Stradner, A.; Bhat, S. K.; Muller, F.;Schurtenberger, P. Cluster, Glass, and Gel Formation and ViscoelasticPhase Separation in Aqueous Clay Suspensions. Langmuir 2007, 23,3570−3580.(15) Mourchid, A.; Delville, A.; Lambard, J.; Lecolier, E.; Levitz, P.Phase diagram of colloidal dispersions of anisotropic charged particles:Equilibrium properties, structure, and rheology of laponite suspen-sions. Langmuir 1995, 11, 1942−1950.(16) Delhorme, M.; Jonsson, B.; Labbez, C. Monte Carlo simulationsof a clay inspired model suspension: the role of rim charge. Soft Matter2012, 8, 9691−9704.(17) Atmuri, A. K.; Peklaris, G. A.; Kishore, S.; Bhatia, S. R. A re-entrant glass transition in colloidal disks with adsorbing polymer. SoftMatter 2012, 8, 8965−8971.(18) Willenbacher, N. Unusual thixotropic properties of aqueousdispersions of Laponite RD. J. Colloid Interface Sci. 1996, 182, 501−510.(19) Shahin, A.; Joshi, Y. M. Prediction of long and short timerheological behavior in soft glassy materials. Phys. Rev. Lett. 2011, 106,038302.(20) Struik, L. C. E. Physical Aging in Amorphous Polymers and OtherMaterials; Elsevier: Houston, 1978.(21) Wales, D. J. Energy Landscapes; Cambridge University Press:Cambridge, U.K., 2003.(22) Cipelletti, L.; Ramos, L. Slow dynamics in glassy soft matter. J.Phys.: Condens. Matter 2005, 17, R253−R285.(23) Ianni, F.; Di Leonardo, R.; Gentilini, S.; Ruocco, G. Aging aftershear rejuvenation in a soft glassy colloidal suspension: Evidence fortwo different regimes. Phys. Rev. E 2007, 75, 011408.(24) Bonn, D.; Tanasc, S.; Abou, B.; Tanaka, H.; Meunier, J.Laponite: Aging and shear rejuvenation of a colloidal glass. Phys. Rev.Lett. 2002, 89, 157011−157014.(25) Pusey, P. N.; Van Megen, W. Dynamic light scattering by non-ergodic media. Physica A 1989, 157, 705−741.(26) Pusey, P. N.; Van Megen, W. Observation of a glass transition insuspensions of spherical colloidal particles. Phys. Rev. Lett. 1987, 59,2083−2086.(27) Schosseler, F.; Kaloun, S.; Skouri, M.; Munch, J. P. Diagram ofthe aging dynamics in laponite suspensions at low ionic strength. Phys.Rev. E 2006, 73, 021401.
(28) Kaloun, S.; Skouri, R.; Skouri, M.; Munch, J. P.; Schosseler, F.Successive exponential and full aging regimes evidenced by tracerdiffusion in a colloidal glass. Phys. Rev. E 2005, 72, 011403.(29) Nicolai, T.; Cocard, S. Structure of gels and aggregates of disk-like colloids. Eur. Phys. J. E 2001, 5, 221−227.(30) Nicolai, T.; Cocard, S. Light scattering study of the dispersion oflaponite. Langmuir 2000, 16, 8189−8193.(31) Joshi, Y. M.; Reddy, G. R. K.; Kulkarni, A. L.; Kumar, N.;Chhabra, R. P. Rheological Behavior of Aqueous Suspensions ofLaponite: New Insights into the Ageing Phenomena. Proc. R. Soc. A2008, 464, 469−489.(32) Ovarlez, G.; Coussot, P. Physical age of soft-jammed systems.Phys. Rev. E 2007, 76, 011406.(33) Coussot, P.; Tabuteau, H.; Chateau, X.; Tocquer, L.; Ovarlez, G.Aging and solid or liquid behavior in pastes. J. Rheol. 2006, 50, 975−994.(34) Rich, J. P.; McKinley, G. H.; Doyle, P. S. Size dependence ofmicroprobe dynamics during gelation of a discotic colloidal clay. J.Rheol. 2011, 55, 273−299.(35) Rich, J. P.; Lammerding, J.; McKinley, G. H.; Doyle, P. S.Nonlinear microrheology of an aging, yield stress fluid using magnetictweezers. Soft Matter 2011, 7, 9933−9943.(36) Jop, P.; Mansard, V.; Chaudhuri, P.; Bocquet, L.; Colin, A.Microscale Rheology of a Soft Glassy Material Close to Yielding. Phys.Rev. Lett. 2012, 108, 148301.(37) Gupta, R.; Baldewa, B.; Joshi, Y. M. Time TemperatureSuperposition in Soft Glassy Materials. Soft Matter 2012, 8, 4171.(38) Baldewa, B.; Joshi, Y. M. Delayed Yielding in Creep, Time -Stress Superposition and Effective Time Theory for a soft Glass. SoftMatter 2012, 8, 789−796.(39) Joshi, Y. M.; Shahin, A.; Cates, M. E. Delayed solidification ofsoft glasses: New experiments, and a theoretical challenge. FaradayDiscuss. 2012, 158, 313−324.(40) Kroon, M.; Vos, W. L.; Wegdam, G. H. Structure and formationof a gel of colloidal disks. Phys. Rev. E 1998, 57, 1962−1970.(41) Tawari, S. L.; Koch, D. L.; Cohen, C. Electrical double-layereffects on the Brownian diffusivity and aggregation rate of Laponiteclay particles. J. Colloid Interface Sci. 2001, 240, 54−66.(42) Mongondry, P.; Tassin, J. F.; Nicolai, T. Revised state diagramof Laponite dispersions. J. Colloid Interface Sci. 2005, 283, 397−405.(43) Ruzicka, B.; Zaccarelli, E. A fresh look at Laponite phasediagram. Soft Matter 2011, 7, 1268−1286.(44) Shahin, A.; Joshi, Y. M. Irreversible Aging Dynamics andGeneric Phase Behavior of Aqueous Suspensions of Laponite.Langmuir 2010, 26, 4219−4225.(45) Mongondry, P.; Nicolai, T.; Tassin, J.-F. Influence ofpyrophosphate or polyethylene oxide on the aggregation and gelationof aqueous laponite dispersions. J. Colloid Interface Sci. 2004, 275,191−196.(46) Sun, K.; Kumar, R.; Falvey, D. E.; Raghavan, S. R. PhotogellingColloidal Dispersions Based on Light-Activated Assembly of Nano-particles. J. Am. Chem. Soc. 2009, 131, 7135−7141.(47) Dijkstra, M.; Hansen, J.-P.; Madden, P. A. Statistical model forthe structure and gelation of smectite clay suspensions. Phys. Rev. E1997, 55, 3044−3053.(48) Bonn, D.; Kellay, H.; Tanaka, H.; Wegdam, G.; Meunier, J.Laponite: What is the difference between a gel and a glass. Langmuir1999, 15, 7534−7536.(49) Ruzicka, B.; Zulian, L.; Angelini, R.; Sztucki, M.; Moussaid, A.;Ruocco, G. Arrested state of clay-water suspensions: Gel or glass? Phys.Rev. E 2008, 77, 020402−4.(50) Tanaka, H.; Jabbari-Farouji, S.; Meunier, J.; Bonn, D. Kinetics ofergodic-to-nonergodic transitions in charged colloidal suspensions:Aging and gelation. Phys. Rev. E 2005, 71, 021402.(51) Jabbari-Farouji, S.; Tanaka, H.; Wegdam, G. H.; Bonn, D.Multiple nonergodic disordered states in Laponite suspensions: Aphase diagram. Phys. Rev. E 2008, 78, 061405−10.
(52) Shahin, A.; Joshi, Y. M.; Ramakrishna, S. A. Interface-InducedAnisotropy and the Nematic Glass/Gel State in Jammed AqueousLaponite Suspensions. Langmuir 2011, 27, 14045−14052.(53) Shahin, A.; Joshi, Y. M. Hyper-Aging Dynamics of NanoclaySuspension. Langmuir 2012, 28, 5826−5833.(54) Morariu, S.; Bercea, M. Effect of Temperature and Aging Timeon the Rheological Behavior of Aqueous Poly(ethylene glycol)/Laponite RD Dispersions. J. Phys. Chem. B 2012, 116, 48−54.(55) Awasthi, V.; Joshi, Y. M. Effect of temperature on aging andtime−temperature superposition in nonergodic laponite suspensions.Soft Matter 2009, 5, 4991−4996.(56) Vogel, A. I. A textbook of quantitative inorganic analysis;Longman: New York, 1978.(57) Mourchid, A.; Levitz, P. Long-term gelation of laponite aqueousdispersions. Phys. Rev. E 1998, 57, R4887−R4890.(58) Shukla, A.; Joshi, Y. M. Ageing under oscillatory stress: Role ofenergy barrier distribution in soft glassy materials. Chem. Eng. Sci.2009, 64, 4668−4674.(59) Shaw, M. T.; MacKnight, W. J. Introduction to PolymerViscoelasticity, 3rd ed.; Wiley: New York, 2005.(60) Fielding, S. M.; Sollich, P.; Cates, M. E. Aging and rheology insoft materials. J. Rheol. 2000, 44, 323−369.(61) Values of ionic conductivity reported by Jabbari-Farouji and co-workers51 for Laponite XLG as a function of concentration withoutany externally added salt at an early stage of aging is consistentlyhigher than those reported in the present work for Laponite RDsuspension. According to the manufacturer, the two grades arechemically identical; however, we feel that batch to batch variation ofindustrial samples may lead to the observed variation.(62) Israelachvili, J. N. Intermolecular and Surface Forces, 3rd ed.;Academic Press: London, 2010.(63) Benenson, W.; Harris, J. W.; Stocker, H.; Lutz, H. Handbook ofPhysics, Springer-Verlag: New York, 2002.(64) Haynes, W. M. CRC Handbook of Chemistry and Physics, 91sted.; CRC Press: Boca Raton, FL, 2010.(65) Cummins, H. Z. Liquid, glass, gel: The phases of colloidalLaponite. J. Non-Cryst. Solids 2007, 353, 3891−3905.(66) Bandyopadhyay, R.; Liang, D.; Yardimci, H.; Sessoms, D. A.;Borthwick, M. A.; Mochrie, S. G. J.; Harden, J. L.; Leheny, R. L.Evolution of particle-scale dynamics in an aging clay suspension. Phys.Rev. Lett. 2004, 93, 228302.(67) Cloitre, M.; Borrega, R.; Leibler, L. Rheological aging andrejuvenation in microgel pastes. Phys. Rev. Lett. 2000, 85, 4819−4822.(68) Derec, C.; Ducouret, G.; Ajdari, A.; Lequeux, F. Aging andnonlinear rheology in suspensions of polyethylene oxide-protectedsilica particles. Phys. Rev. E 2003, 67, 061403.(69) Sibani, P.; Kenning, G. G. Origin of end-of-aging and subagingscaling behavior in glassy dynamics. Phys. Rev. E 2010, 81, 011108.(70) Sollich, P.; Lequeux, F.; Hebraud, P.; Cates, M. E. Rheology ofsoft glassy materials. Phys. Rev. Lett. 1997, 78, 2020−2023.(71) Laxton, P. B.; Berg, J. C. Relating clay yield stress to colloidalparameters. J. Colloid Interface Sci. 2006, 296, 749−755.(72) Ruzicka, B.; Zulian, L.; Zaccarelli, E.; Angelini, R.; Sztucki, M.;Moussaïd, A.; Ruocco, G. Competing Interactions in Arrested States ofColloidal Clays. Phys. Rev. Lett. 2010, 104, 085701.(73) In these dissolution experiments, no shear melting wasemployed by Ruzicka and co-workers unlike the case with rheologicalexperiments reported in this paper.