Page 1
14 Himeda et al.
Int. J. Biosci. 2012
RESEARCH PAPER OPEN ACCESS
Physicochemical, rheological and thermal properties of taro
(Colocassia esculenta) starch harvested at different maturity
stages
Makhlouf Himeda1, Nicolas Njintang Yanou2*, Richard Marcel Nguimbou1, Claire
Gaiani3, Joel Scher3, J. Balaam Facho4, Carl M. F. Mbofung1
1ENSAI, University of Ngaoundere, P.O. Box 455, Ngaoundere, Cameroon
2Corresponding author email [email protected] ; Department of Biological Sciences, Faculty of Sciences,
University of Ngaoundere, P.O. Box 454, Ngaoundere, Cameroon
3Laboratoire d’Ingénierie de Biomolécules, ENSAIA-INPL. 2, avenue de la Forêt de Haye, B.P. 172,
54500 Vandoeuvre-lès-Nancy, France
4Faculté des Sciences Exactes et Appliquées, Université de N’djamena, B. P. 1027 N’djamena, Tchad
Received: 06 February 2012 Revised: 22 February 2012 Accepted: 22 February 2012
Key words: Taro corms, starch, maturity stage, physicochemical properties, thermal
properties.
Abstract
The objective of this study was to evaluate the effects of tubers maturity stage on the physicochemical characteristics
and thermal properties of Colocasia esculenta (Sosso ecotype) starches. Plantation was done in Chad, tropical area
from May to February following a randomized design with 5 maturity stages (6, 7, 8, 9 and 10 months after planting)
as the main treatments. The results showed significant increase in phosphorus content (from 113.99 to
145.64µg/100g), temperature (from 80.69 to 84.54°C) and enthalpy of gelatinization (from 13.24 to 16.27 J/g), water
absorption capacity (from 140.11 to 304.48 %), solubility index (from 17.50 to 29.42%) and swelling index (from 115
to 135%). In addition the monomolecular moisture content (varying from 2.67 to 3.36 %) and the GAB constant C
(varying from 11.73 to 113.22) exhibited significant increase with maturity. Furthermore, a significant decrease in
amylose content (from 35.90 to 27.65%) was observed as the maturity increases. In conclusion and on the basis of the
correlation observed, the changes in phosphorus and amylose composition of starch during growth seemed to play a
role not only on the molecular structure of the starch granules, but also on its functionality.
*Corresponding Author: Nicolas Njintang Yanou [email protected]
International Journal of Biosciences (IJB) ISSN: 2220-6655 (Print) 2222-5234 (Online)
Vol. 2, No. 3, p. 14-27, 2012 http://www.innspub.net
Page 2
15 Himeda et al.
Int. J. Biosci. 2012
Introduction
Taro (Colocasia esculenta) is grown widely in tropical
and subtropical regions of the world for its
underground starch. Taro tubers yield starch between
70 and 85% dry matter (Jane et al., 1992). Taro starch
has major economic importance due not only to its
high yield but also to its functionality (Jane et al.,
1992; Carr et al., 1995; Aboubakar et al., 2008). In this
respect taro starch has granules of sizes lower than
5µm and as such is highly digestible and recommended
for infant foods (Nip, 1997; Aboubakar et al., 2008); is
useful as a filler in biodegradable plastics, in toilet
formulations or aerosol (Nip, 1997). Taro starch has
also been proposed to mimic oil droplet in food
emulsions such as mayonnaise, thus contributing to
reducing the consumption of oil by consumers and
risks of cardiovascular diseases (Nip, 1997). In food
systems such as achu (taro based paste), taro starch
exhibited specific visco-elastic properties characterized
by its high hardness, force of adhesion and relaxation
(Njintang et al., 2007). Several other studies have been
conducted on development of taro based-foods
emphasizing the properties of taro starch (Rodriguez-
Miranda et al., 2011; Ahromrit and Nema, 2010;
Ammar et al., 2009; Onyeike et al., 1995). The
properties of the starch including the viscosity, the
ability to absorb water and swell, and the gelatinization
profile have been shown to depend on the content and
structure of amylose and amylopectin (Lu et al., 2008).
The properties of taro starch have been quite studied
(Jane et al., 1992; Sefa-Dedeh and Sackey 2002;
Aboubakar et al., 2008).
In the event of taro flour or starch processing in Chad
in the Centre Africa, corms are generally harvested at
varying periods of maturity from 5 to 10 months
depending on the demand. Many studies reported that
starch characteristics generally alter with plant
developmental stage. In this respect it has been shown
that harvesting dates influence Pachyrhizus ahipa root
and starch characteristics (Leonel et al., 2005). In
addition a study on the effect of harvest dates on the
starch properties of various potato cultivars revealed
that late harvest date significantly enhanced the
phosphorus content, peak viscosity and breakdown,
while it led to slight decreases in amylose content,
pasting temperature, and gelatinization temperature
and no influences on gelatinization enthalpy (Noda et
al., 2004). Other studies on potatoes also revealed
significant effect of maturity on the properties of
starches (Noda et al., 1997, Svegmark et al., 2002; Liu
et al., 2003). Similar studies on Dioscorea sp. revealed
significant changes on their biochemical (Trèche and
Agbor-Egbe, 1996), rheological and physicochemical
properties (Huang et al., 2006)
For taro flour or starch to become economically
competitive, the quality of the harvested tubers needs
to be guarantee. However the fundamental question
concerning the effect of stage of maturity on the
utilization of the harvested tubers still to be answered.
In other words what are the physicochemical,
functional properties, rheological and thermal
properties of taro starch harvested at different
maturity periods since these parameters constituted
the determinant factors of their properties in food
systems? To our knowledge very few if none such study
has been conducted on taro. The present study was
initiated in an effort to investigate this issue.
This research attempted to determine the biochemical,
the thermal properties, rheological and physical
properties of taro starch, as influenced by harvesting
time. The expected result may improve the
technological quality and commercialization of this
valuable crop.
Material and methods
Planting experiments
The experiments were carried out at Kolobo in Mayo-
Kebi division (9-11°N, 14-16°E), Chad, from May 2007
to February 2008. This region has a tropical monsoon
climate with two main seasons: raining and hot-dry.
The hot-dry season lasts from December-April with the
Page 3
16 Himeda et al.
Int. J. Biosci. 2012
highest temperatures occurring in the months of
March-April. The rainy season lasts from May to
November with the highest rainfall occurring in August
and September. The experiments were carried out
following a randomized planting design on a farm
space of 200 m2 surrounded by a border representing
1/5 the total size. The soil in this area is of the sandy
loam quality with moderate fertility, and pH of 5.0 -
6.0. The sosso-taro variety was used for the experiment
and harvesting was carried out at varying periods of 6,
7, 8, 9 and 10 months after planting. Each batch of
harvested tubers were thoroughly washed with tap
water to remove all foreign materials and taken to the
laboratory for starch preparation.
Isolation of taro starch
Taro starches were isolated from taro flours of tubers
harvested after each harvesting period using standard
procedures (Perez et al., 1993). In this respect, the
tubers were sliced and dried in air convection at 40 ± 2
°C. The dried slices were first hammer milled (Culatti
polymix, France) to pass through a 200 µm screen.
Taro flour (1 kg) was steeped in 10 L of 2 % NaCl
solution with continue mixing at 40 °C for 5 h before
being passed through a 80 µm mesh sieve. The filtrate
was allowed to stand overnight and the supernatant
discarded. The precipitate (starch sediment) was
treated with 10 L NaOH 0,03 M and then centrifuged
at 4500 rpm for 15 min. the precipitate was washed
twice with distilled water and lastly with ethanol which
was evaporated during drying in a convection electric
dryer at 30 °C. The starch was then collected ground
with a mortar and stored in a sealed dried polyethylene
bags until required for analysis. The yield of extraction
of starch was evaluated gravimetrically.
Evaluation of Chemical composition of taro starch
Starch of each maturity was analyzed for moisture (air
oven method), fat (Soxhlet), crude proteins (Nx6.25)
and ash (incineration method) content, as a percentage
(w/w), following AACC (1990) procedures. Semi
automatic machine (GEHARDT, Paris, France) was
used for crude proteins analysis. Phosphorous content,
as a percentage (w/w), was determined following the
photometric method as described by AOAC (2000).
The amylose content was determined using the iodine
colorimetric method (Mc Grance et al., 1998). Purity
was calculated from the difference between 100 and
percent of moisture, crude protein, fatty material and
ash content following the equation: % purity = (100-[%
crude protein + % fatty materials + % ash]).
Color characterization of taro starch
Color measurements of the starch were carried out
using a Chromameter CR210 (Minolta France S.A.S.,
Carrières-sur-Seine) on the basis of L* a* and b*
values. The instrument was calibrated against a
standard light yellow-coloured reference tile. A glass
cell containing the powdered flour was placed above
the light source and covered with a white plate and L*,
a* and b* values were recorded. The whiteness index
(WI) was determined according to the following
equation (Saricoban and Tahsin, 2010).
Wide – angle X-ray investigations (WAXS)
The crystallographic properties of the different starch
maturities were examined on a guinier-camera
arrangement with a quartz monochromator. A Cu-
anode (Philips PW/ 2273/ 20, The Netherlands) gave
and average wavelength of 1.54 Ǻ, and was operated at
40 KV and 20 mA. All the starch samples were
examined at a starch to water ratio of 1:1, and mounted
in hermetically sealed cuvettes to keep their moisture
during examination. The scattered patterns were
recorded on reflex 25 Medical X-ray film (CEA AB,
Sweden), processed according to the recommendations
of the manufacturer.
Differential scanning calorimetry (DSC) analysis of
taro starch
DSC thermograms of taro starches were recorded on a
NETZSCH model Phoenix (NETZSCH 204 F1), with
Page 4
17 Himeda et al.
Int. J. Biosci. 2012
heating rate of 5 °C/min and temperature rate range of
25–120 °C. Starch was dispersed in distilled water (1:3;
w/v) in an aluminium pan and hermetically sealed.
The instrument was calibrated for temperature and
enthalpy measurement with indium, and an empty pan
was used as reference. The manufacturers’ software
was used to calculate the heat capacity and integrate
the peaks. The onset and end temperatures of the
gelatinization peaks were determined by the
intersection of tangents fitted to the leading and
trailing flanks of the peak with the baseline.
Equilibrium moisture content (EMC) and adsorption
isotherm of taro starch
The EMC of the taro starch was determined at 20 °C
according to the static gravimetric method (Wolf et al.,
1985). The desorption isotherms were determined on
samples hydrated in a glass jar over distilled water at a
room temperature to approximately 30% dry basis
moisture content. Samples of 1.00 ± 0.02 g were
weighed in weighing bottles which were put in
hygrostats with six saturated salt solutions (LiCl,
CH3COOK, MgCl2, Mg(NO3)2, NH4Cl and BaCl2) used
to obtain constant water activity environments
between 0.1 and 0.9. All the salts used were of reagent
grade. At high water activities (aw > 0.70) crystalline
thymol was placed in the hygrostats to prevent the
microbial spoilage of the starch. The hygrostats were
kept in thermostats at 20 ± 0.2 °C. Samples were
weighed (balance sensitivity ± 0.0001 g) every three
days. Equilibrium was acknowledged when three
consecutive weight measurements showed a difference
less than 0.001 g. The moisture content of each sample
was determined by the oven method (105 °C for 24 h)
by means of triplicate measurements. The resulting
adsorption curve was tested to follow the multilayer
GAB model of adsorption of the general form
where M is the moisture content expressed in g/g dried
weight, and aw is the water activity. The GAB model
was transformed to a quadratic equation (Chen and
Jayas 1998), and the constants M0 (g/g), kb and C were
determined using the nonlinear power equation
category of Sigma plot 8.02 (Chicago, IL, USA)
statistical package. The coefficient of determination
(R2) and the mean relative percent error (P) were
determined.
Xobs is the measured equilibrium moisture content
expressed in %; Xpred is the predicted equilibrium
moisture content expressed in % and n is the number
of data points.
Determination of water absorption capacity and
water solubility index of taro starch
For the determination of these variables, 1 g of starch
was suspended in 10 mL of distilled water and
incubated with mixing for 30 min in a shaking water-
bath (Kottermann, Germany) set at 20, 40, 60, 80 and
100 °C and centrifuged at 5600 rpm for 30 min. The
pellet was dried at 105 °C for 12 h and the water
absorption capacity calculated as g of water absorbed
per 100 g of dried pellet (Phillips et al., 1988) and the
water solubility index calculated as the soluble matter
per 100g of dried pellet (Anderson et al., 1969).
Evaluation of the Swelling index of taro starch
Three grams portions of each starch were transferred
into cleaned, dry and graduated (50 mL) cylinders. The
starch samples were gently leveled and the volumes
noted. Distilled water (30 mL) was added to each
sample; the cylinder was swirled and allowed to stand
for 60 min while the change in volume (swelling) was
recorded after 60 min. The swelling index of each
starch sample was calculated as a multiple of the
original volume (Ukpabi and Ndimele, 1990).
Statistical analysis
All measurements were carried out in triplicate.
Analysis of variance was performed to determine the
effect of harvesting time on the responses parameters.
Page 5
18 Himeda et al.
Int. J. Biosci. 2012
When statistical differences were found, the Duncan’s
Multiple Range Test was applied in order to classify
samples at the significant level of 5%. Statgraphics
Program (Statically Graphics Educational, version 6.0
1992 Manugistics, Inc. and Statistical Graphics Corp.,
USA) was used for the statistical analysis.
Results and discussion
Chemical composition of taro starches
The compositions of taro starches from each maturity
are shown in Table 1. Ash, fat and crude protein
present in starches of different maturities of Colocasia
esculenta variety Sosso were very limited, indicating
high purity of the starch fractions. Similar to values
earlier on Colocasia starch (Perez et al., 2005), it can
be observed that the purity of our taro starches is
quietly high (98.89 - 99.00%), given evidence of low
levels of ash and proteins in the starches. One
important parameter in response to the effect of
maturity is the starch yield which significantly and
continuously increased following ageing. Such
observations have been made on other food such as
cassava (Sriroth et al., 1999), yam (Huang et al., 2006)
and potatoes (Liu et al., 2003). This is an important
observation since dry matter and starch act as
important indicators for quality evaluation of starchy
foods (Huang et al., 2006). In this respect the
optimum period for harvesting has very often been
based on starch yield. In our case since no significant
variation was observed beyond 8 months, 8 months
could be considered as the optimum period of
harvesting. This approach of determination of optimal
harvesting time assumed the quality of starch is
constant all aver the growth time. This is not the case
since the most important parameter of starch, the
amylose content often varied with growth time (Liu et
al., 2003; Huang et al., 2006). In this respect the
amylose content in our starch samples decreased from
35.9 % to 27.6 % in a linear manner (R= -0.97; p <
0.05). The amylose content were relatively close to
those reported in our previous studies (16.65 %-30.85
%), but significantly higher compared to the other
values (8.7-13.4 %) reported on taro starches
(Aboubakar et al., 2008; Lu et al., 2008).
Table 1. Chemical composition of taro starch differing in maturity stage.
Parameters Maturity (months)
6 7 8 9 10
Moisture (g/100g) 7.76±0.09 7.78±0.20 7.91±0.08 7.85±0.26 7.83±0.04
Ash (g/100g) 0.31±0.00a 0.32±0.00b 0.32±0.00b 0.33±0.01c 0.35±0.01d
Protein (g/100g) 0.62±0.01a 0.64±0,01b 0.66±0.02b 0.69±0.00c 0.69±0.01c
Fats (g/100g) 0.063±0.001 0.064±0.001 0.065±0.001 0.070±0.010 0.068±0.010
Amylose (%) 35.9±0.92e 33.8±0.49d 31.1±0.36c 29.7±0.80b 27.6±0.40a
Phosphorus (µg/100g) 114.0±0.70a 126.0±1.14b 130.0±0.92c 143.6±0.95d 154.6±1.03e
Yield (%) 57.9 60.9 68.0 68.1 68.3
Purity (%) 99.0 99.0 99.0 98.9 98.9
N=3; means±standard deviation; Means in the same line followed by different letters in superscript are significantly different at
probability level 0.05.
The effect of harvesting time on the amylose level
observed in this study agreed with those observed by
some authors on cassava varieties who further
reported the highest increase at the early harvest time
(Asaoka et al., 1992). Similarly a decrease in potatoes
amylose content has equally been observed, but this
Page 6
19 Himeda et al.
Int. J. Biosci. 2012
happened only after the first harvest and remained
unchanged during growth of tubers (Liu et al., 2003).
In addition a decrease (during growth from 5 to 7
months) in amylose level was observed on Pachyrhizus
ahipa starch, but the magnitude of decrease depend on
the planting period with those planted in October
exhibiting 4% decrease while those planted in February
showed a magnitude decrease of 13.3%. These
observations contrasted with a study on cassava which
revealed inconsistent changes of amylose content
within a narrow band during the growth from 6 to 16
months. In the same vein studies on potatoes showed
an increase in the amylose content with maturity
(Sugimoto et al., 1995). Our observation coupled to
those in literature suggested that the amylose content
not only depends on the specie and the variety but also
on the cultivation conditions and the harvesting time.
Table 2. Variation in color parameters of taro starch at different maturity stages
Maturity
(months)
L* a* b* WI
6 98.4±1.36a 1.16±0.10a 3.6±1.17a 95.9a
7 98.6±1.18a 1.36±0.35a 4.6±1.00a 95.0a
8 98.8±1.13a 1.59±0.18a 4.5±1.39a 95.1a
9 98.8±0.79a 1.33±0.15a 3.9±0.68a 95.1a
10 98.7±0.56a 1.39±0.24a 3.4±0.81a 96.0a
N=3; means± standard deviation; Means in the same column followed by different letters in superscript are
significantly different at probability level 0.05
Table 3. Degree of crystallinity and relative crystallinity of taro starch
Maturity
(months)
Degree of crystallinity (%) Relative
crystallinity (%) 17° 20° 27°
6 17.50 19.90 26.50 27.22 37.48
7 17.80 19.93 26.50 27.11 37.34
8 17.75 19.90 27.00 27.31 37.57
9 17.80 20.00 26.70 27.47 37.82
10 17.80 19.95 27.00 27.40 37.69
Table 4. Starch gelatinization properties by DSC in taro differing in maturity stage
Maturity
(months)
To (°C) Tp (°C) Tc (°C) ∆H (J/g)
6 72.5±0.27a 80.7±0.40a 89.3±0.41a 13.2±0.17a
7 73.5±0.36b 81.6±0.70b 90.4±0.18b 13.7±0.16b
8 74.3±0.35c 82.7±0.09c 91.4±0.48c 14.6±0.25c
9 75.2±0.35d 83.5±0.28d 92.5±0.30d 15.4±0.35d
10 76.2±0.34e 84.5±0.32e 93.2±0.35e 16.3±0.21e
N=3; means± standard deviation; Means in the same column followed by different letters in superscript are
significantly different at probability level 0.05.
Page 7
20 Himeda et al.
Int. J. Biosci. 2012
The maturity stage had a large effect on the starch
phosphorus content; and in contrary to the behavior in
amylose content. A significant and linear increase (r =
0.98; p < 0.05) in phosphorus level was observed with
the harvesting time. In this respect the phosphorus
value at 6 months was 114.0 µg/100 g while the value
at 10 months was 154.6 µg/100 g. This behavior is in
agreement with report on potatoes (Liu et al., 2003).
Hence a negative significant correlation (r = -0.95; p <
0.05) was observed between the phosphorous level and
the amylose content in our starch samples. This
observation was good evidence in favor of the concept
that tuber starches with higher amylose had less
phosphorus, since the phosphate groups are covalently
bound to amylopectin molecules (Zaidul et al., 2008).
Since the planting started during the raining season
(lower temperature) and ended during the hot season
(higher temperature), it is possible that this could have
influenced the observed increase in phosphorus
content of the starch. This however disagreed with the
concept developed on potato tubers that lower
environmental temperature during the development of
potato tubers is associated with higher phosphorus
content in starch granules (Noda et al., 2004).
Physical properties of taro starch
Color is an important criterion for starch quality,
especially for use in food industries and textile
(Moorthy, 2002). The color indexes L*, a*, b* and WI
characteristics of the starches samples extracted at
different maturity stage are presented in Table 2.
Narrow range values of L* (98.43 - 98.85), a* (1.16 -
1.59), b* (3.37 - 4.64) and WI (94.95 – 96.00) were
observed during growth time of taro tubers, and no
statistically significant effect of maturity was found on
the color coordinate of starch. In general the starches
were white (high values of L* and WI), less red (low a*
value) and less yellow (low b* value). The overall
whiteness of the starch expressed as Whiteness index
(WI) showed values higher than 94, thus justifying the
good color of our sample (Hsu et al., 2003). This is
probably a consequence of peeling and rinse prior to
grinding which otherwise could have induced
browning (Kurup and Nanda, 1994). Due to the
presence of mucilages, aroids starches especially
Colocasia have been thought to have a bad color and
use of ammonia has been suggested as a means to
improve it (Moorthy, 2002). The variety sosso may
probably be poor in mucilages and phenols which are
generally responsible of browning in aroids (Moothy,
2002).
The X-ray diffraction of the starches was done in order
to investigate the changes in crystallinity of starch due
to maturity stage of taro tubers (Sosso variety), since
this has a connection with the functionality of the
starches. Irrespective of the maturity stage, the
diffraction curves were similar suggesting a unique
type of starch during growing. Fig. 1 shows the typical
X-ray diffraction pattern of starches extracted from
taro at different maturity stages. For all starch
samples, characteristic peaks appeared at the Bragg
reflection angle 2θ 17.50°, 19.90° and 27° suggesting
an A-type starch pattern. The A type crystal pattern
suggested the amylopectin of our starch samples have
shorter chain and are packed in a more compact
structure (Jane, 2006). Previous studies reported that
Colocasia and Xanthosoma starches also possess ‟A”
pattern while the edible Dioscorea starches possessed
‟B” patterns (Moorthy, 2002). Cassava starch
possesses ‟A”, ‟C” or a mixed pattern with three major
peaks at 2θ = 15.3, 17.1 and 23.5°. It has been reported
that most starches from root and tuber exhibited a
typical ‟B” - type X-ray diffraction pattern, but this was
not the case with the sosso variety (Les Copeland et al.,
2009). In a theoricall view point it has been
hypothesized that the development of ‟A” or ‟B” type
diffraction patterns during aging is dependent on the
amount of water present, with water content higher
than 43% leading to development of a ‟B” type pattern
while water content lower than 29% leads to an ‟A”
type pattern (Osella et al., 2005). This seems to be not
the case in our studies since the moisture content of
the starch during the growth period was always higher
Page 8
21 Himeda et al.
Int. J. Biosci. 2012
than 50% while the starches exhibited an ‟A” type
crystallinity. In Table 3 are reported the crystallinity
indexes of the starches. The index of crystallinity was
not significantly influenced by the growth time, and
this agreed with previous studies on sweet potato,
potato and yam starches (Noda et al., 1995; Chiang et
al., 2007; Liu et al., 2003; Huang et al., 2006). The
degree of crystallinity of taro tuber varied from 27.1 to
27.5 % and the relative crystallinity from 37.3 to 37.8
%. The absolute crystallinity values of starch from five
varieties of cassava were found to be in the range 8 –
14 % (Moorthy et al., 1996). Absolute crystallinity of
some Colombian cassava varieties were determined
and values (15.3 - 17.3%) did not varied significantly
through the different seasons and all of them belonged
to ‟CA” pattern (Asaoka et al., 1992). The similar X-ray
diffraction pattern indicated that the organization of
semi-crystalline structure of starch was not affected by
taro maturity stage. Although differences existed in the
peak intensities among the taro starches examined,
more detailed information, such as the crystallinity
development during taro growth is to be investigated
in the future.
2 Theta (°)
0 10 20 30 40 50 60 70
Inte
nsity
0
100
200
300
400
500
Fig.1. A typical of X-ray diffraction pattern of taro
sosso starch during growth.
Differential scanning calorimetry of taro starch
During heating, all starches exhibited a single
endothermic transition between 70 and 95 °C,
indicating starch gelatinization (Liu et al., 2003). The
parameters of the thermogram from differential
scanning calorific analysis (onset temperature (To),
peak temperature (Tp), completion temperature (Tc)
and enthalpy of gelatinization (ΔH)) of starch
harvested at five different levels of maturity are
presented in Table 4. The gelatinization temperature
(To, Tp and Tc) and enthalpy (ΔH) increased
significantly (P<0.01) with increase in maturity in a
linear manner (r = 0.98, p <0.05). For the period of
vegetative growth under study, the enthalpy of
gelatinization (ΔH) of taro starch significantly
increased from 13.24 ± 0.17 J/g at 6 months maturity
to 16.27 ± 0.21 J/g at 10 months. Similar behavior has
been reported for Trapa quadrispinosa Roxb (Chiang
et al., 2007) and taro (Wang et al., 2001) starch during
growth while a reverse tendency was reported for the
gelatinization temperature of potatoes (Liu et al.,
2003; Huang et al., 2006). The high values of enthalpy
of gelatinization were generally associated with high
levels of amylose in starches (Jane et al., 1992:
Aboubakar et al., 2008). Unfortunately in this study
while the level of amylose decreased, there was an
increase in the enthalpy. This suggested that not only
the amylose content influenced the enthalpy of
gelatinization, but also other parameters such as
crystallinity, intermolecular bonding, treatment
conditions, etc (Moorthy, 2002).
Adsorption isotherm of taro starch
The ability of taro starch to hold water is shown in
Figure 2. This figure corresponds to the adsorption
isotherm of water and describes the change in water
content of a product based on the water activity (aw).
The curves show that the change in water content of
starch depends on the relative humidity (RH) of the
atmosphere in which they were stored. If the HR
decreases, starches reject water, but, if the RH
increases, they absorb moisture (Swinkels, 1985).
Without exception, the adsorption isotherm of starches
of different degrees of maturity shows an increase in
humidity with increasing water activity at a constant
temperature. This behavior which results in a sigmoid
Page 9
22 Himeda et al.
Int. J. Biosci. 2012
shaped curve reflects a Type II isotherm according to
Brunauer's classification. The adsorption isotherm of
starch is due to hydrogen bonds between water
molecules and hydroxyl groups available in the
amorphous regions and on the crystallite surfaces
(Urquhart, 1959). Very long time, several authors refer
to three general areas of a sorption isotherm, with a
particular method of attachment of the water on the
product (Aboubakar et al., 2008). The area for which
the water activity is between 0 and 0.3 corresponds to
the formation of a molecular monolayer on the surface
of the product (Van der Waals forces between
hydrophilic groups and water molecules).
Table 5. The GAB coefficients (M0, C and kb), coefficient of determination (R2) and mean relative percent error (P) of
the adsorption isotherm modeling of taro starch at different maturities
Maturity (Month) Kb C M0 (g/100g) R2 P
6 0.82 11.73 2.80 0.99 6.05
7 0.84 11.73 2.72 0.99 10.13
8 0.83 33.93 2.67 0.99 5.05
9 0.83 81.94 2.86 0.99 6.08
10 0.82 113.22 3.36 0.98 7.60
The GAB model was used to describe the sorption of
taro starch presented in Fig. 2. The GAB coefficients
(M0, C and kb) of the model are given in Table 5 along
with the correlation determination (R2) and mean
relative percent error (P). The correlation
determination were all higher than 98% and P lower
than 10% suggesting that the experimental results
fitted quite well to the GAB model. In this respect the
five constants of the model were estimated with
reasonable accuracy. The monolayer moisture content,
M0, considered as that corresponding to the amount
adsorbed at specific sites varied from 2.67 (maturity 8
months) to 3.36 (maturity 10 months). Increase in
monolayer moisture with the maturity suggested an
increase of the amorphous character of the starch
granules during growth, and hence its hydroscopicity.
The monolayer moisture content determined in this
study fall in the range reported for potatoes starch (2.1-
3.7%) (Al-Muhtaseb et al., 2004). Significant variation
was observed on the constant kb (range 0.82-0.84).
Relatively high kb values (range 0.88-0.89) have been
reported for high amylose and high amylopectine
potatoes starch (Al-Muhtaseb et al., 2004). The most
important change observed on the GAB model
parameters was on the C value. Known as the surface
energy constant, C value significantly increased with
increase in maturity varying from 11.7 to 113.2. As
equally reported in literature, the most varying
constant of the GAB model with temperature is C
which decreases as the temperature increases (Al-
Muhtaseb et al., 2004; Peng et al., 2007). Theoretically
type II isotherm generally exhibited C values between 2
and 50, while values higher (range 50-200) reflected
type 1 isotherm with significant chemisorptions
(Labuza, 1975). This observation suggested that during
growing the surface energy constant of starch granule
increase, such as the gelatinization temperature
determined by DSC.
aW
0,0 0,2 0,4 0,6 0,8 1,0
Equili
brium
mois
ture
conte
nt
(%)
0,00
0,02
0,04
0,06
0,08
0,10
0,12
0,14
0,16
6 months
7 months
8 Months
9 Months
10 Months
Fig. 2. Adsorption isotherm of taro starch influenced
by maturity stage.
Page 10
23 Himeda et al.
Int. J. Biosci. 2012
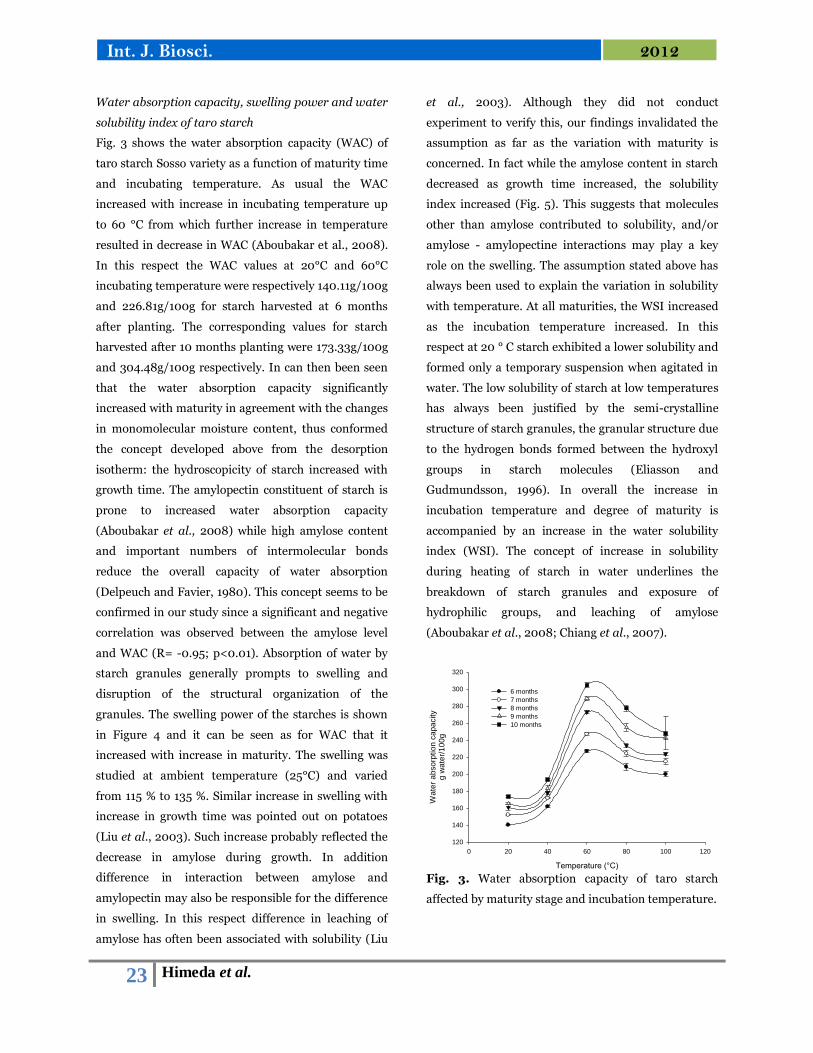
Water absorption capacity, swelling power and water
solubility index of taro starch
Fig. 3 shows the water absorption capacity (WAC) of
taro starch Sosso variety as a function of maturity time
and incubating temperature. As usual the WAC
increased with increase in incubating temperature up
to 60 °C from which further increase in temperature
resulted in decrease in WAC (Aboubakar et al., 2008).
In this respect the WAC values at 20°C and 60°C
incubating temperature were respectively 140.11g/100g
and 226.81g/100g for starch harvested at 6 months
after planting. The corresponding values for starch
harvested after 10 months planting were 173.33g/100g
and 304.48g/100g respectively. In can then been seen
that the water absorption capacity significantly
increased with maturity in agreement with the changes
in monomolecular moisture content, thus conformed
the concept developed above from the desorption
isotherm: the hydroscopicity of starch increased with
growth time. The amylopectin constituent of starch is
prone to increased water absorption capacity
(Aboubakar et al., 2008) while high amylose content
and important numbers of intermolecular bonds
reduce the overall capacity of water absorption
(Delpeuch and Favier, 1980). This concept seems to be
confirmed in our study since a significant and negative
correlation was observed between the amylose level
and WAC (R= -0.95; p<0.01). Absorption of water by
starch granules generally prompts to swelling and
disruption of the structural organization of the
granules. The swelling power of the starches is shown
in Figure 4 and it can be seen as for WAC that it
increased with increase in maturity. The swelling was
studied at ambient temperature (25°C) and varied
from 115 % to 135 %. Similar increase in swelling with
increase in growth time was pointed out on potatoes
(Liu et al., 2003). Such increase probably reflected the
decrease in amylose during growth. In addition
difference in interaction between amylose and
amylopectin may also be responsible for the difference
in swelling. In this respect difference in leaching of
amylose has often been associated with solubility (Liu
et al., 2003). Although they did not conduct
experiment to verify this, our findings invalidated the
assumption as far as the variation with maturity is
concerned. In fact while the amylose content in starch
decreased as growth time increased, the solubility
index increased (Fig. 5). This suggests that molecules
other than amylose contributed to solubility, and/or
amylose - amylopectine interactions may play a key
role on the swelling. The assumption stated above has
always been used to explain the variation in solubility
with temperature. At all maturities, the WSI increased
as the incubation temperature increased. In this
respect at 20 ° C starch exhibited a lower solubility and
formed only a temporary suspension when agitated in
water. The low solubility of starch at low temperatures
has always been justified by the semi-crystalline
structure of starch granules, the granular structure due
to the hydrogen bonds formed between the hydroxyl
groups in starch molecules (Eliasson and
Gudmundsson, 1996). In overall the increase in
incubation temperature and degree of maturity is
accompanied by an increase in the water solubility
index (WSI). The concept of increase in solubility
during heating of starch in water underlines the
breakdown of starch granules and exposure of
hydrophilic groups, and leaching of amylose
(Aboubakar et al., 2008; Chiang et al., 2007).
Temperature (°C)
0 20 40 60 80 100 120
Wa
ter
ab
so
rptio
n c
ap
acity
g w
ate
r/1
00
g
120
140
160
180
200
220
240
260
280
300
320
6 months
7 months
8 months
9 months
10 months
Fig. 3. Water absorption capacity of taro starch
affected by maturity stage and incubation temperature.
Page 11
24 Himeda et al.
Int. J. Biosci. 2012
Maturity (months)
6 7 8 9 10
Sw
elli
ng index (
%)
110
115
120
125
130
135
140
Fig. 4. Swelling power of taro starch affected by
maturity stage.
Temperature (°C)
0 20 40 60 80 100 120
Wate
r solu
bili
ty index
g/1
00g s
tarc
h
14
16
18
20
22
24
26
28
30
326 months
7 months
8 months
9 months
10 months
Fig. 5. Water solubility index of taro starch affected by
maturity stage and incubation temperature.
Conclusion
In this study, the physicochemical properties of taro
starches from tubers harvested at different maturities
were investigated. The maturity stage significantly
influences the composition, physicochemical and
thermal properties of taro starch. While the amylose
content decreases, the phosphorus content increases
with maturity. The change in amylose and
amylopectine content induces significant changes on
the molecular structure of the granules reflected on
their monomolecular moisture and surface energy with
significantly increase with maturity. All the changes on
composition and structure induce significant changes
on the thermal and functional properties. In this
respect the gelatinization temperature, the water
absorption capacity, the swelling power and the water
solubility index significantly increases with increase in
maturity.
Acknowledgement
The authors wished to thank the Cooperation pour la
Recherche Universitaire (CORUS, FRANCE) for
financial support.
References
AACC. 1990. American Association of Cereal
Chemists. Approved methods of the AACC (7th ed.). St.
Paul, MN.
Aboubakar, Njintang YN, Scher J, Mbofung
CMF. 2008. Physicochemical, thermal properties and
microstructure of six varieties of taro (Colocasia
esculenta L. Schott) flours and starches. Journal of
Food Engineering 86, 294–305.
Ahromrit A, Nema KP. 2010. Heat and mass
transfer in deep-frying of pumpkin, sweet potato and
taro. Journal of Food Science and Technology 47,
632–637.
Al-Muhtaseb AH, McMinn WAM, Magee TRA.
2004. Water sorption isotherms of starch powders
Part 1: Mathematical description of experimental data.
Journal of Food Engineering 61, 297–307.
Ammar MS, Hegazy AE, Bedeir SH. 2009. Using
of Taro Flour as Partial Substitute of Wheat Flour in
Bread Making. World Journal of Dairy & Food
Sciences 4, 94-99.
Anderson RA, Conway HF, Pfeifer VF, Griffin
EL. 1969. Roll and extrusion cooking of grain
Sorghum grits. Cereal Science Today 14, 372–380.
AOAC. 2000. Association of Official Analytical
Chemists. Official methods of analysis of the
Page 12
25 Himeda et al.
Int. J. Biosci. 2012
Association of Official Analytical Chemists.
Washington, DC.
Asaoka M, Blanshard JMV, Rickard JE. 1992.
Effect of cultivar and growth season on the
gelatinisation properties of cassava (Manihot
esculenta) starch. Journal of the Science of Food and
Agriculture 59, 53-58.
Carr JM, Sufferling K, Poppe J. 1995.
Hydrocolloids and their use in the confectionery
industry. Journal of Food Technology 20, 41–44.
Chen C, Jayas DS. 1998. Evaluation of the GAB
equation for the isotherms of agricultural products.
Transactions of the ASAE 41, 1755–1760.
Chiang PY, Li PH, Huang CC, Wang CCR. 2007.
Changes in functional characteristics of starch during
water caltrop (Trapa Quadrispinosa Roxb.) growth.
Food Chemistry 104, 376-382.
Delpeuch F, Favier JC. 1980. Characteristics of
starches from tropical food plants; α-amylase
hydrolysis, swelling and solubility patterns. Annal
Technology Agriculture 29, 53-67.
Eliasson AC, Gudmundsson M. 1996. Starch:
Physicochemical and functional aspects. In: Eliasson
AC, Ed. Carbohydrates in food. New York: Marcel
Dekker,. 31–503.
Hsu C-L, Chen W, Weng Y-M, Tseng C-Y. 2003.
Chemical composition, physical properties, and
antioxidant activities of yam flours as affected by
different drying methods. Food Chemistry 83, 85–92.
Huang CJ, Lin MC, Wang CR. 2006. Changes in
morphological, thermal and pasting properties of yam
(Dioscorea alata) starch during growth. Carbohydrate
Polymers 64, 524–531.
Jane J, Shen L, Chen J, Lim S, Kasemsuwan T,
Nip WK. 1992. Physical and Chemical studies of taro
starches and flours. Cereal Chemistry 69, 528-535.
Jane JL. 2006. Current understanding on starch
granule structures. Journal of Applied Glycoscience
53, :205–213.
Kurup GT, Nanda SK. 1994. Storage and drying
systems, in Chadha KL, Nair GG Eds. Advances in
horticulture, Malhotra Publications, New Delhi 8, 589-
607.
Labuza TP. 1975. Interpretation of sorption data in
relation to the state of constituent water. In R.
Duckworth (Ed.), Water relations in foods. New York:
Academic Press pp. 155–172.
Leonel M, Ferrari TB, Sarmento SBS, Oliveira
MA. 2005. Planting time, developmental stages and
characteristics of roots and starch of Pachyrhizus
ahipa. Scientia Agricola (Piracicaba, Braz.) 62, 528-
533.
Les Copeland, Blazek J, Salman H, Tang CM.
2009. Form and functionality of starch. Food
Hydrocolloids 23, 1527–1534.
Liu Q, Weber E, Currie V, Yada R. 2003.
Physicochemical properties of starches during potato
growth. Carbohydrate Polymers 51, 213–221.
Lu T-J, Lin J-H, Chen J-C, Chang Y-H. 2008.
Characteristics of taro (Colocasia esculenta) starches
planted in different seasons and their relations to the
molecular structure of starch. Journal of Agricultural
and Food Chemistry 56, 2208–2215.
Mc Grance SJ, Cornell HJ, Rix JC. 1998. A
simple and rapid colorimetric method for the
determination of amylose in starch products.
Starch/Stärke 50, 158-163.
Page 13
26 Himeda et al.
Int. J. Biosci. 2012
Moorthy SN, Wenham JE, Blanshard JMV.
1996. Effect of solvent extraction on the gelatinization
properties of starch and flour of five cassava varieties.
Journal of the Science of Food and Agriculture 72,
329-336.
Moorthy SN. 2002. Physicochemical and Functional
Properties of Tropical Tuber Starches: A Review.
Starch/Stärke 54, 559–592.
Nip WK. 1997. Taro. In: Smith DS (ed) Processing
vegetable and technology, 1st edn. Technomic
Publishing, Lancaster.
Njintang NY, Mbofung CMF, Kesteloot R. 2007.
Multivariate analysis of the effect of drying method
and particle size of flour on the instrumental texture
characteristics of paste made from two varieties of taro
(Colocasia esculenta L. Schott) flour. Journal of Food
Engineering 81, 250–256.
Noda T, Takahata Y, Sato T, Hisamatsu M,
Yamada T. 1995. Physicochemical properties of
starches extracted from sweet potato roots differing in
physiological age. Journal of Agricultural and Food
Chemistry 43, 3016–3020.
Noda T, Takahata Y, Sato T, Ikoma H, Mochida
H. 1997. Combined effects of planting and on starch
properties of sweet harvesting dates potato roots.
Carbohydrate Polymers 33, 169-176.
Noda T, Tsuda S, Mori M, Takigawa S,
Matsuura-Endo C, Saito K, Mangalika WHA,
Hanaoka A, Suzuki Y, Yamauchi H. 2004. The
effect of harvest dates on the starch properties of
various potato cultivars. Food Chemistry 86, 119–125.
Onyeike NE, Olungwe T, Uwakwe AA. 1995.
Effect of heat-treatment and defatting on the
proximate composition of some Nigerian local soup
thickeners. Food Chemistry 53, 173- 175.
Osella CA, Sanchez HD, Carrara CR, De la
Torre MA, Buera MP. 2005. Water redistribution
and structural changes of starch during storage of a
gluten-free bread. Starch 57, 208–216.
Peng G, Chen X, Wu W, Jiang X. 2007. Modeling
of water sorption isotherm for corn starch. Journal of
Food Engineering 80, 562–567.
Pérez E, Bahnassey Y, Breene, W. 1993. A simple
laboratory scale method for isolation of amaranth
starch. Starch/Stârke 4, 211–241.
Pérez E, Schultzb FS, Pacheco de Delahaye E.
2005. Characterization of some properties of starches
isolated from Xanthosoma sagittifolium (tannia) and
Colocassia esculenta (taro). Carbohydrate Polymers
60, 139–145.
Phillips RD, Chhinnan MS, Branch AL, Miller J,
McWatters KA. 1988. Effect of pre-traitment on
functional and nutritional properties of cowpea meal.
Journal of Food Sciences 15, 805–809.
Rodríguez-Miranda J, Ruiz-López II, Herman-
Lara E, Martínez-Sánchez CE, Delgado-Licon E,
Vivar-Vera MA. 2011. Development of extruded
snacks using taro (Colocasia esculenta) and
nixtamalized maize (Zea mays) flour blends. LWT -
Food Science and Technology 44, 673-680.
Saricoban C, Tahsin Yilmaz M. 2010. Modeling
the effects of processing factors on the changes in
colour parameters of cooked meatballs using response
surface methodology. World Applied Science Journal
9, 14–22.
Sefa-Dedeh S, Sackey K-AE. 2002. Starch
structure and some properties of cocoyam
(Xanthosoma sagittifolium and Colocasia esculenta)
starch and raphides. Food Chemistry 79, 435–444.
Page 14
27 Himeda et al.
Int. J. Biosci. 2012
Sriroth K, Santisopasri V, Petchalanuwat C,
Kurotanawong K, Piyachomkwan K, Oates CG.
1999. Cassava starch granule structure– function
properties: influence of time and conditions at harvest
on four cultivars of cassava starch. Carbohydrate
Polymers 38, 161–170.
Sugimoto Y, Yamashita Y, Hori I, Abe K, Fuwa
H. 1995. Developmental changes in the properties of
potato (Solanum tuberosum L.) starches. Journal of
Applied Glycoscience (Oyo Toshitsu Kagaku) 42, 345–
353.
Svegmark K, Helmerson K, Nilson G, Nilson
PO, Anderson R, Svenson E. 2002. Comparison of
potato amylopectin starches and potato starches
influence of year and variety. Carbohydrate polymers
47, 331-340.
Swinkels JJM. 1985. Sources of starch its Chemistry
and physics. In: Van Beymun, G. M. A. and J. A. Roels
(Ed.), Starch conversion technology. Marcel Dekkers,
New York and Basel, pp. 15–46.
Trèche S, Agbor-Egbe T. 1996. Biochemical
changes occurring during growth and storage of two
yam Species. International journal of Food Science and
Nutrition 47, 93-102.
Ukpabi UJ, Ndimele C. 1990. Evaluation of the
quality of gari produced in Imo State. Nigerian Food
Journal 8, 105–110.
Urquhart AR. 1959. Sorption of water by cellulose
and starch. In J. Honeyman (Ed.), Recent advances in
the chemistry of cellulose and starch. London:
Heywood and Company pp. 240–264.
Wang CR, Wu SP, Lai LS, Huang SS. 2001. The
changes of composition and physicochemical
properties of taro tuber during growth. Taiwanese
Journal of Agricultural Chemistry and Food Science
39, 173–184.
Wolf W, Spiess WEL, Jung G, Weisser H, Bizot
H, Duckworth RB. 1985. The water-vapor sorption
isotherms of microcrystalline cellulose and purified
potato starch, results of a collaborative study. Journal
of Food Engineering 3, 51–73.
Zaidul ISM, Absar N, Kim SJ, Suzuki T, Karim
AA, Yamauchi H, Noda T. 2008. DSC study of
mixtures of wheat flour and potato, sweet potato,
cassava, and yam starches. Journal of Food
Engineering 86, 68-73.