1 Madeline Smith IB Physics SL November 18, 2013 PHYSICS LABORATORY: The Simple Pendulum The purpose of this lab was to experimentally determine a value for g, the acceleration of Earth’s gravity, by using the given ‘pendulum equation’ and experimental data for the period of a pendulum and the length of a pendulum string. Additionally, we were to consider how the period of a pendulum is affected by its length. HYPOTHESIS: I think that as the string length gets shorter, the period of the pendulum will decrease. I am basing this hypothesis on a game that I play with my little brother on the swingset at the playground. We like to flip the swing over the top bar and make the seat higher. When we do this, it seems like the swing moves back and forth faster. DATA COLLECTION AND PROCESSING (DCP) Data collected on 12 November 2013 with Scarlett Gemmer. The mass on the pendulum was 200 g. Table 1: RAW DATA String Length (± 0.001 m) 10T TRIAL 1 (±0.30 s) 10T TRIAL 2 (±0.30 s) 10T TRIAL 3 (±0.30 s) 0.600 15.54 15.56 15.28 0.486 14.09 14.10 14.03 0.435 13.31 13.22 13.34 0.371 12.25 12.66 12.62 0.273 10.66 10.81 10.75 0.198 9.09 9.03 9.25 0.106 6.69 6.47 6.63 Table 2: PROCESSED DATA 10T Ave (s) Unc in 10T (s) T Ave (s) Unc in T (s) T^2 (s^2) Unc in T^2 (s^2) 15.46 0.14 1.55 0.01 2.39 0.04 14.07 0.04 1.41 0.01 1.98 0.01 13.29 0.06 1.33 0.01 1.77 0.02 12.51 0.21 1.25 0.02 1.57 0.05 10.74 0.08 1.07 0.01 1.15 0.02 9.12 0.11 0.91 0.01 0.83 0.02 6.60 0.11 0.66 0.01 0.44 0.01 I decided to measure the time taken for 10 full swings of the pendulum for each length. The uncertainty in 10 swings was calculated by ((max trial value) – (min trial value))/2. For example, for the first data point: 15.56 s − 15.28 s 2 = 0.14 s
Transcript
1
Madeline Smith IB Physics SL November 18, 2013
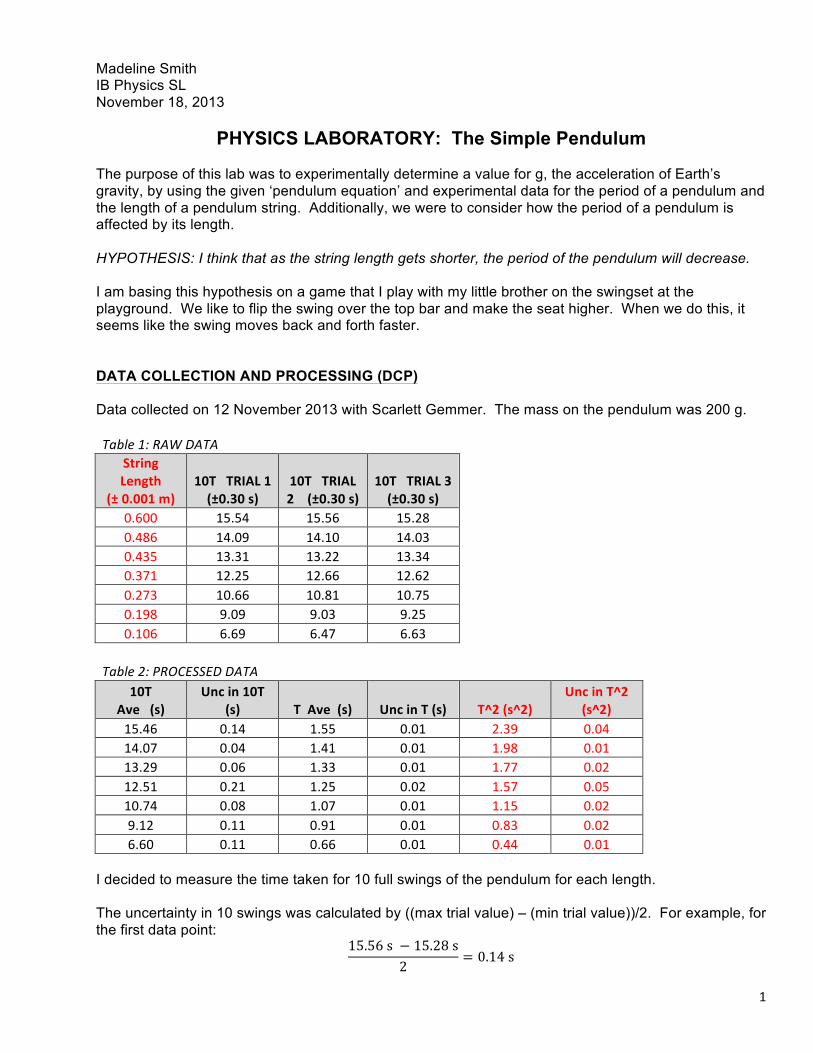
PHYSICS LABORATORY: The Simple Pendulum The purpose of this lab was to experimentally determine a value for g, the acceleration of Earth’s gravity, by using the given ‘pendulum equation’ and experimental data for the period of a pendulum and the length of a pendulum string. Additionally, we were to consider how the period of a pendulum is affected by its length. HYPOTHESIS: I think that as the string length gets shorter, the period of the pendulum will decrease. I am basing this hypothesis on a game that I play with my little brother on the swingset at the playground. We like to flip the swing over the top bar and make the seat higher. When we do this, it seems like the swing moves back and forth faster. DATA COLLECTION AND PROCESSING (DCP) Data collected on 12 November 2013 with Scarlett Gemmer. The mass on the pendulum was 200 g. Table 1: RAW DATA
I decided to measure the time taken for 10 full swings of the pendulum for each length. The uncertainty in 10 swings was calculated by ((max trial value) – (min trial value))/2. For example, for the first data point:
15.56 s − 15.28 s2
= 0.14 s
2
To get the average period and uncertainty, I divided each average and uncertainty for 10T by 10. The simple pendulum equation was given to us as Which means if we graph T against l, we should get a square root function. In order to determine a value for g, however, we had to graph T2 against l, then consider the gradient of the linear function. Sample calculation for uncertainty in T2 (first data point):
𝑝𝑒𝑟𝑐𝑒𝑛𝑡 𝑢𝑛𝑐𝑒𝑟𝑡𝑎𝑖𝑛𝑡𝑦 𝑖𝑛 𝑇 =0.011.55
= 0.0065
𝑝𝑒𝑟𝑐𝑒𝑛𝑡 𝑢𝑛𝑐𝑒𝑟𝑡𝑎𝑖𝑛𝑡𝑦 𝑖𝑛 𝑇! = 2 × 0.00645 = 0.0129
𝑎𝑏𝑠𝑜𝑙𝑢𝑡𝑒 𝑢𝑛𝑐𝑒𝑟𝑡𝑎𝑖𝑛𝑡𝑦 𝑖𝑛 𝑇! = 0.0129 × 1.55! = 0.04 s These calculations were done in an Excel spreadsheet, which rounded the values to 2 decimal places. When it performed the calculations, therefore, more decimal places were used.
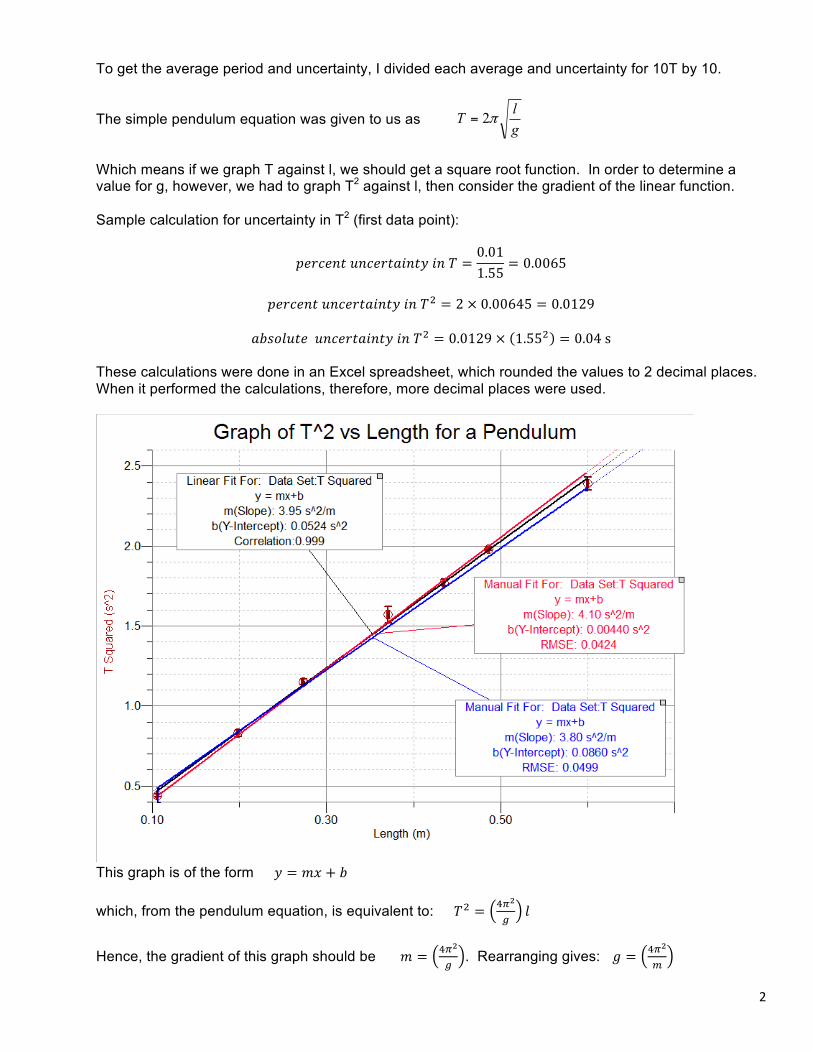
This graph is of the form 𝑦 = 𝑚𝑥 + 𝑏
which, from the pendulum equation, is equivalent to: 𝑇! = !!!
!𝑙
Hence, the gradient of this graph should be 𝑚 = !!!
!. Rearranging gives: 𝑔 = !!!
!
glT π2=
3
From the graph, with uncertainty given by (max slope – min slope)/2 : m = 3.95 ± 0.15 s2m-‐1 = 3.95 ± 3.80% s2m-‐1 The final experimental value for g is: g = 9.99 ± 0.38 m s-‐2
CONCLUSION AND EVALUATION (CE) This goal of this experiment was to determine an experimental value for g using the simple pendulum equation and measuring the period against varying lengths of string. The mass at the end of the string was held constant at 200 g. From the graph of T2 against l, the final experimental value of g was found to be 9.99 ± 0.38 ms-2 . This agrees well with the given (theoretical) value of at the Earth’s surface of 9.81 ms-2.
In fact, the percent error is !!!"#!$%&'( !"#$%!!"#!$%&!'()* !"#$%!!!"#!$%&'( !"#$%
×100 = !.!"!!.!!!.!!
×100 = 1.8%. Additionally, as can be seen from the raw data table, as the length of the pendulum decreases, the period decreased. The graph of T2 against l is linear, which suggests that that period is proportional the square root of the length (T (l).5 ). Based on these results, therefore, my hypothesis was correct.
There were no notable irregularities in the data and I believe the method was both reliable and valid. However, there were limitations in the method. The following are the main limitations and possible ways to address these limitations if I were to repeat the experiment:
Limitation How to address it The pendulum did not have a consistent initial displacement (angle from the vertical from which is was let go was not constant).
Use a draftsman’s triangle to precisely maintain a 20 or 30° angle each time, or set up some set object against which to measure this initial position for each trial.
During the 10 periods I measured, the pendulum likely lost amplitude due to friction between mass-air and the string-rod above.
Measure the time for 5 swings instead, and/or put lubricant between the string above and the metal rod.
It was very difficult (especially with short string lengths) to measure even 10 swings accurately, because it was hard to tell when the mass reached the ‘edge’ of its swing.
Use Vernier Photogates, which would allow us to measure one swing very accurately.
It may be that these limitations did not affect the period of the pendulum anyway; nevertheless, they are important to mention here. An interesting related experiment would be to repeat this one with the pendulum mass under water, and investigate whether the variables of length and period are related as they are here. Another idea would be to keep the string length constant and see how the mass at the end of the string affects the period. Here, the variables would be period and mass.