Quantifying signals with power-law correlations: A comparative study of detrended fluctuationanalysis and detrended moving average techniques
Limei Xu,1 Plamen Ch. Ivanov,1 Kun Hu,1 Zhi Chen,1 Anna Carbone,2 and H. Eugene Stanley1
1Center for Polymer Studies and Department of Physics, Boston University, Boston, Massachusetts 02215, USA2INFM and Physics Department, Politecnico di Torino, Corso Duca degli Abruzzi 24, 10129, Torino, Italy
sReceived 7 August 2004; revised manuscript received 14 February 2005; published 6 May 2005d
Detrended fluctuation analysissDFAd and detrended moving averagesDMA d are two scaling analysis meth-ods designed to quantify correlations in noisy nonstationary signals. We systematically study the performanceof different variants of the DMA method when applied to artificially generated long-range power-law corre-lated signals with ana priori known scaling exponenta0 and compare them with the DFA method. We find thatthe scaling results obtained from different variants of the DMA method strongly depend on the type of themoving average filter. Further, we investigate the optimal scaling regime where the DFA and DMA methodsaccurately quantify the scaling exponenta0, and how this regime depends on the correlations in the signal.Finally, we develop a three-dimensional representation to determine how the stability of the scaling curvesobtained from the DFA and DMA methods depends on the scale of analysis, the order of detrending, and theorder of the moving average we use, as well as on the type of correlations in the signal.
There is growing evidence that output signals of manyphysical f1–15g, biological f16–19g, physiological f20–35gand economic systemsf36–43g, where multiple componentfeedback interactions play a central role, exhibit complexself-similar fluctuations over a broad range of space and/ortime scales. These fluctuating signals can be characterized bylong-range power-law correlations. Due to nonlinear mecha-nisms controlling the underlying interactions, the output sig-nals of complex systems are also typically nonstationary,characterized by embedded trends and heterogeneous seg-ments spatches with different local statistical propertiesdf44–46g. Traditional methods such as power-spectrum andautocorrelation analysisf48–50g are not suitable for nonsta-tionary signals.
Recently, new methods have been developed to addressthe problem of accurately quantifying long-range correla-tions in nonstationary fluctuating signals:sad the detrendedfluctuation analysissDFAd f16,23,51g, andsbd the detrendedmoving average methodsDMA d f52–56g. An advantage ofthe DFA methodf44–47g is that it can reliably quantify scal-ing features in the fluctuations by filtering out polynomialtrends. However, trends may not necessarily be polynomial,and the DMA method was introduced to estimate correlationproperties of nonstationary signals without any assumptionson the type of trends, the probability distribution, or othercharacteristics of the underlying stochastic process.
Here, we systematically compare the performance of theDFA and different variants of the DMA method. To this endwe generate long-range power-law correlated signals with ana priori known correlation exponenta0 using the Fourierfiltering methodf57g. Tuning the value of the correlationexponenta0, we compare the scaling behavior obtained fromthe DFA and different variants of the DMA methods to de-termine:s1d how accurately these methods reproducea0; s2dwhat are the limitations of the methods when applied to sig-
nals with small or large values ofa0. Based on single real-ization as well as on ensemble averages of a large number ofartificially generated signals, we also compare the best fittingrange si.e., the minimum and the maximum scalesd overwhich the correlation exponenta0 can be reliably estimatedby the DFA and DMA methods.
The outline of this paper is as follows. In Sec. II, wereview the DFA method and we introduce variants of theDMA method based on different types of moving averagefilters. In Sec. III we compare the performance of DFA andDMA on correlated and anticorrelated signals. We also testand compare the stability of the scaling curves obtained bythese methods by estimating the local scaling behaviorwithin a given window of scales and for different scalingregions. In Sec. IV we summarize our results and discuss theadvantages and disadvantages of the two methods. In Appen-dix A we consider higher order weighted detrended movingaverage methods, and in Appendix B we discuss movingaverage techniques in the frequency domain.
II. METHODS
A. Detrended fluctuation analysis
The DFA method is a modified root-mean-squaresrmsdanalysis of a random walk. Starting with a signalusid, wherei =1, . . . ,N, andN is the length of the signal, the first step ofthe DFA method is to integrateusid and obtain
The integrated profileysid is then divided into boxes ofequal lengthn. In each boxn, we fit ysid using a polynomialfunction ynsid, which represents the local trend in that box.When a different order of a polynomial fit is used, we have adifferent order DFA-, se.g., DFA-1 if ,=1, DFA-2 if ,=2,etcd.
Next, the integrated profileysid is detrended by subtract-ing the local trendynsid in each box of lengthn:
Ynsid ; ysid − ynsid. s3d
Finally, for each boxn, the rms fluctuation for the integratedand detrended signal is calculated:
Fsnd ;Î 1
Noi=1
N
fYnsidg2. s4d
The above calculation is then repeated for varied box lengthn to obtain the behavior ofFsnd over a broad range of scales.For scale-invariant signals with power-law correlations, thereis a power-law relationship between the rms fluctuation func-tion Fsnd and the scalen:
Fsnd , na. s5d
Because power laws are scale invariant,Fsnd is alsocalled the scaling function and the parametera is the scalingexponent. The value ofa represents the degree of the corre-lation in the signal: if a=0.5, the signal is uncorrelatedswhite noised; if a.0.5, the signal is correlated; ifa,0.5,the signal is anticorrelated.
B. Detrended moving average methods
The DMA method is a new approach to quantify correla-tion properties in nonstationary signals with underlyingtrendsf52,53g. Moving average methods are widely used infields such as chemical kinetics, biological processes, andfinance f56,58–61g to quantify signals where large high-frequency fluctuations may mask characteristic low-frequency patterns. Comparing each data point to the movingaverage, the DMA method determines whether data followthe trend, and how deviations from the trend are correlated.
Step 1. The first step of the DMA method is to detecttrends in data employing a moving average. There are twoimportant categories of moving average:sId simple movingaverage andsII d weighted moving average.
(I) Simple moving average. The simple moving averageassigns equal weight to each data point in a window of sizen. The position to which the average of all weighted datapoints is assigned determines the relative contribution of the“past” and “future” points. In the following we consider thebackward and the centered moving average.
(a) Backward moving average. For a window of sizen thesimple backward moving average is defined as
ynsid ;1
nok=0
n−1
ysi − kd, s6d
whereysid is the integrated signal defined in Eq.s1d. Here,the average of the signal data points within the window re-
fers to the last datapoint covered by the window. Thus, theoperatoryn in Eq. s6d is “causal,” i.e., the averaged value ateach data pointi depends only on the pastn−1 values of thesignal. The backward moving average is however affected bya rather slow reaction to changes in the signal, due to a delayof lengthn/2 shalf the window sized compared to the signal.
(b) Centered moving average. This is an alternative mov-ing average method, where the average of the signal datapoints within a window of sizen is placed at the center of thewindow. The moving average function is defined as
ynsid =1
no
k=−fsn+1d/2g+1
fn/2g
ysi + kd, s7d
whereysid is the integrated signal defined in Eq.s1d andfxgis the integer part ofx. The functionyn defined in Eq.s7d isnot “causal,” since the centered moving average performsdynamic averaging of the signal by mixing data points lyingto the left and to the right side ofi. In practice, while thedynamical system under investigation evolves with timeiaccording toysid, the output of Eq.s7d mixes past and futurevalues ofysid. However, this averaging procedure is moresensitive to changes in the signal without introducing delayin the moving average compared to the signal.
(II) Weighted moving average. In dynamical systems themost recent data points tend to reflect better the current stateof the underlying “forces.” Thus, a filter that places moreemphasis on the recent data values may be more useful indetermining reversals of trends in data. A widely used filter isthe exponentially weighted moving average, which we em-ploy in our study. In the following we consider the backwardand the centered weighted moving average.
(a) Backward moving average. The weighted backwardmoving average is defined as
ynsid ; s1 − ldysid + lynsi − 1d, s8d
where the parameterl=n/ sn+1d, n is the window size,i=2,3, . . . ,N andyns1d;ys1d. Expanding the termynsi −1d inEq. s8d, we obtain a recursive relation of step one with pre-vious data points weighted by increasing powers ofl. Sincel,1, the contribution of the previous data points becomesexponentially small. The weighted backward moving aver-age of higher order,.1 sWDMA-,d where, is the step sizein the recursive Eq.s8d is defined in Appendix A.
(b) Centered moving average. The weighted centeredmoving average is defined as
ynsid =1
2fyn
Lsid + ynRsidg, s9d
where ynLsid is defined by Eq.s8d, and yn
Rsid=s1−ldysid+lyn
Rsi +1d, where i =N−1,N−2, . . . ,1 and ynRsNd;ysNd.
The termynRsid is the weighted contribution of all data points
to the right of i sfrom i +1 to the end of the signalNd, andyn
Lsid is the weighted contribution of all data points to the leftof i.
XU et al. PHYSICAL REVIEW E 71, 051101s2005d
051101-2
The exponentially weighted moving average reduces thecorrelation between the current data point at which the mov-ing average window is positioned and the previous and fu-ture points.
Step 2. Once the moving averageynsid is obtained, wenext detrend the signal by subtracting the trendyn from theintegrated profileysid
Cnsid ; ysid − ynsid. s10d
For the backward moving average, we then calculate thefluctuation for a window of sizen as
Fsnd =Î 1
N − n + 1oi=n
N
fCnsidg2. s11d
For the centered moving average the fluctuation for a win-dow of sizen is calculated as
Fsnd =Î 1
N − n + 1 oi=fsn+1d/2g
N−fn/2g
fCnsidg2. s12d
Step 3. Repeating the calculation for differentn, we ob-tain the fluctuation functionFsnd. A power law relation be-tween the fluctuation functionFsnd and the scalen fsee Eq.s5dg indicates a self-similar behavior.
When the moving averageyn is calculated as in Eq.s6d,Eq. s7d, Eq. s8d and Eq.s9d, we have the detrended movingmethod sDMA d, the centered detrened moving averagesCDMAd, the weighted detrended moving average with order, sWDMA-,d and the weighted centered detrended movingaveragesWCDMAd, respectively.
III. ANALYSIS AND COMPARISON
Using the modified Fourier filtering methodf57g, we gen-erate uncorrelated, positively correlated, and anticorrelatedsignals usid, where i =1,2, . . . ,N and N=220, with a zeromean and unit standard deviation. By introducing a designedpower-law behavior in the Fourier spectrumf45,57g, themethod can efficiently generate signals with long-rangepower-law correlations characterized by ana priori knowncorrelation exponenta0.
A. Detrended moving average method and DFA
In this section we investigate the performance of theDMA and WDMA-1 methods when applied to signals withdifferent type and degree of correlations, and compare themto the DFA method. Specifically, we compare the features ofthe scaling functionFsnd obtained from the DMA andWDMA-1 methods with the DFA method, and how accu-rately these methods estimate the correlation properties ofthe artificially generated signalsusid. Ideally, the output scal-ing functionFsnd should exhibit a power-law behavior overall scalesn, characterized by a scaling exponenta which isidentical to the given correlation exponenta0 of the artificialsignals. Previous studiesf44–46g show that the scaling be-havior obtained from the DFA method depends on the scalenand the order, of the polynomial fit when detrending the
signal. We investigate if the results of the DMA andWDMA-1 method also have a similar dependence on thescalen. We also show how the scaling results depend on theorder, when WDMA-, with ,=2,3,4,5 areapplied to thesignalsssee Appendix Ad.
To compare the performance of different methods, we firststudy the behavior of the scaling functionFsnd obtained fromDFA-0, DFA-1, DMA, and WDMA-1. In Fig. 1 we show therms fluctuation functionFsnd obtained from the differentmethods for an anti-correlated signal with correlation expo-nenta0=0.2, an uncorrelated signal witha0=0.5, and a posi-
FIG. 1. A comparison of the scaling behavior obtained from theDMA, WDMA-1, DFA-0, and DFA-1 methods for artificially gen-erated power-law correlated signals with a scaling exponenta0. Thelength of the signals isN=220. Scaling curvesFsnd versus scalenfor sad an anticorrelated signal witha0=0.2, sbd an uncorrelatedsignal with a0=0.5, andscd a positively correlated signal witha0
=0.8. At small scales, all methods exhibit a weak crossover, whichis more pronounced for anticorrelated signals. At large scales, theFsnd curves obtained from DMA, WDMA-1, and DFA-0 exhibit aclear crossover to a flat region for all signals, independent of thetype of correlations. No such crossover is observed for the scalingcurves obtained from the DFA-1 method, suggesting a more accu-rate estimate of the scaling exponenta0 at large scales.
QUANTIFYING SIGNALS WITH POWER-LAW… PHYSICAL REVIEW E 71, 051101s2005d
051101-3
tively correlated signal witha0=0.8. We find that in the in-termediate regimeFsnd sobtained from all methodsd exhibitsan approximate power-law behavior characterized by asingle scaling exponenta. At large scalesn for DFA-0,DMA, and WDMA-1, we observe a crossover inFsnd lead-ing to a flat regime. With increasinga0 this crossover be-comes more pronounced and moves to the intermediate scal-ing range. In contrast, such a crossover at large scales is notobserved for DFA-1, indicating that the DFA-1 method canbetter quantify the correlation properties at large scales. Atsmall scalesn the scaling curvesFsnd obtained from allmethods exhibit a crossover which is more pronounced foranticorrelated signalssa0=0.2d and becomes less pro-nounced for uncorrelatedsa0=0.5d and positively correlatedsignalssa0=0.8d.
We next systematically examine the performance of theDFA-0, DFA-1, DMA, and WDMA-1 methods by varyinga0over a very broad range of valuess0.1øa0ø3.5d sFig. 2d.For all four methods, we comparea0 with the exponentaobtained from fitting the rms fluctuation functionFsnd in thescaling range 102,n,104, i.e., the range where all methodsperform well according to our observations in Fig. 1. If themethods work properly, for each value of the “input” expo-nent a0 we expect the estimated “output” exponent to bea=a0. We find that the scaling exponenta, obtained fromdifferent methods, saturates as the “input” correlation expo-nent a0 increases, indicating the limitation of each method.The saturation of scaling exponent ata=1 indicates thatDMA and WDMA-1 do not accurately quantify the correla-tion properties of signals witha0.1.
In contrast, the DFA-, method can quantify accurately thescaling behavior of strongly correlated signals if the appro-priate order, of the polynomial fit is used in the detrendingprocedure. Specifically, we find that the values of the scaling
exponenta obtained from the DFA-, are limited toaø,+1. Thus the DFA-, can quantify the correlation propertiesof signals characterized by exponenta0ø,+1. For signalswith a0.,+1 we find that the output exponenta from theDFA-, method remains constant ata=,+1. These findingssuggest that in order to obtain a reliable estimate of the cor-relations in a signal one has to apply the DFA-, for severalincreasing orders, until the obtained scaling exponentastops changing with increasing,.
Since the accuracy of the scaling exponent obtained fromthe different methods depends on the range of scalesn overwhich we fit the rms fluctuation functionFsnd sas seen inFig. 1d, and since different methods exhibit different limita-tions for the range of scaling exponent valuessas demon-strated in Fig. 2d, we next investigate the local scaling be-havior of theFsnd curves to quantify the performance of thedifferent methods in greater details. To ensure a good esti-mation of the local scaling behavior, we calculateFsnd atscalesn=432i/64, i =0,1,2, . . .,which in log scale provides64 equidistant points forFsnd per bin of size log 2. To esti-mate the local scaling exponentaloc, we locally fit Fsnd in awindow of sizew=3 log 2, e.g,aloc is the slope ofFsnd in awindow containing 3364 points. To quantify the detailedfeatures of the scaling curveFsnd at different scalesn, weslide the windoww in small steps of sizeD= 1
4 log 2 startingat n=4, thus obtaining approximately 70 equidistantaloc inlog scale per each scaling curve. We consider the averagevalue of aloc obtained from 50 different realizations of sig-nals with the same correlation exponenta0.
In Fig. 3, we compare the behavior ofaloc as a function ofthe scalen to more accurately determine the best fittingrange in the scaling curvesFsnd obtained from the DMA,WDMA-1, DFA-0, and DFA-1. A rms fluctuation functionexhibiting a perfect scaling behavior would be characterizedby aloc=a0 for all scalesn and for all values ofa0 denotedby horizontal lines in Fig. 3. A deviation of thealoc curvesfrom these horizontal lines indicates an inaccuracy in quan-tifying the correlation properties of a signal and the limita-tion of the methods. Our results show that the performanceof different methods depends on the “input”a0 and scalen.At small scales and fora0,0.8 we observe thataloc for allmethods deviates up from the horizontal lines suggesting anoverestimation of the real correlation exponenta0. This ef-fect is less pronounced for uncorrelated and positively corre-lated signals. At intermediate scalesaloc exhibits a horizontalplateau indicating that all methods closely reproduce the in-put exponent fora0,0.8. This intermediate scaling regimechanges for different types of correlations and for differentmethods. At large scales ofn.104, the DMA, WDMA-1,and DFA-0 methods strongly underestimate the actual corre-lations in the signal, withaloc curves sharply dropping for allvalues ofa0 fFigs. 3sad–3scdg. In contrast, the DFA-1 methodaccurately reproducesa0 at large scales withaloc followingthe horizontal lines up to approximatelyN/10 fFig. 3sddg. Inaddition, the DFA-1 method accurately reproduces the corre-lation exponent at small and intermediate scales even whena0.1 fFig. 3sddg, while the DMA, WDMA-1, and DFA-0are limited toa0,0.8.
For a certain “input” correlation exponenta0, we can es-timate the good fitting regime ofFsnd to be the length of the
FIG. 2. A comparison of the performance of the different scalingmethodssDMA, WDMA-1, DFA-0, DFA-1, and DFA-2d when ap-plied to artificially generated signals with long-range power-lawcorrelations. Herea0 is the correlation exponent of the generatedsignals anda is the exponent value estimated using different meth-ods. For all methods we obtaina by fitting the corresponding scal-ing curvesFsnd in the rangenP f102,104g. Flat regions indicate thelimitations of the methods in accurately estimating the degree ofcorrelations in the generated signals, as the “output” exponentaremains unchanged when the “input” exponenta0 is varied.
XU et al. PHYSICAL REVIEW E 71, 051101s2005d
051101-4
plateau in Fig. 3. For example, fora0=0.2 the calculatedscaling exponentaloc obtained from the DMA method is ap-proximately equal to the expected valuea0=0.2 within arange of two decadess102,n,104d. Similarly, the goodfitting range ofFsnd obtained from the DFA-0 fora0=0.2 isabout three decadess102,n,105d. However, the calculatedlocal scaling exponentaloc can fluctuate for different realiza-tions of correlated signals. Although the mean value obtainedfrom many independent realizations is close to the expectedvalue, the fluctuation of the estimated scaling exponent canbe very large. Thus, it is possible foraloc to deviate froma0and the scaling range estimated from Fig. 3 may not be agood fitting range. Therefore, it is necessary to study thedispersion of the local scaling exponent to determine thereliability of the “good” fitting range estimated from Fig. 3.In Figs. 4–6 we show the results foraloc from 20 differentrealizations of the correlated signal witha0=0.2, a0=0.5,and a0=0.8, respectively. For all methods, we observe thatthere is a large dispersion ofaloc, indicating strong fluctua-tions in the scaling functionFsnd at large scalesn sn,103
for DMA and WDMA-1 andn,104 for DFA-0 and DFA-1dsFigs. 4–6d. This suggests that the good fitting range ob-tained only from the mean value ofaloc, as shown in Fig. 3,may be overestimated.
FIG. 3. A comparison of the local scaling exponentaloc as a function of the scalen for the DMA, WDMA-1, DFA-0, and DFA-1methods. We consider signals of lengthN=220 and varying values of the correlation exponenta0. The local scaling exponentaloc quantifiesthe stability of the scaling curvesFsnd ssee Fig. 1d and is expected to exhibit small fluctuations around a constant valuea0 if Fsnd is wellfitted by a power-law function.a0 is denoted by horizontal dotted lines. Symbols denote the estimated values ofaloc and represent averageresults from 50 realizations of artificial signals for each value of the “input” scaling exponenta0. Deviations from the horizontal lines atsmall or at large scales indicate limitations of the methods to accurately quantify the built-in correlations in different scaling ranges.
FIG. 4. Values of the local scaling exponentaloc as a function ofthe scalen obtained from 20 different realizations of artificial anti-correlated signals with an identical scaling exponenta0=0.2.
QUANTIFYING SIGNALS WITH POWER-LAW… PHYSICAL REVIEW E 71, 051101s2005d
051101-5
To better quantify the best fitting range for different meth-ods and for different types of correlations we develop athree-dimensional representationsFig. 7d. Based on 50 real-izations of correlated signals with different values of 0.1,a0,1.1, for each scalen we define the probabilityp snor-malized frequencyd to obtain values fora0−d,aloc,a0+d,where d=0.02 sarguments supporting this choice ofd arepresented in Sec. III Bd. Again, as in Fig. 3, for each realiza-tion of correlated signals with a givena0, we calculatealoc
FIG. 5. Values of the local scaling exponentaloc as a function ofthe scalen obtained from 20 different realizations of artificial un-correlated signals with an identical scaling exponenta0=0.5.
FIG. 6. Values of the local scaling exponentaloc as a function ofthe scalen obtained from 20 different realizations of artificial posi-tively correlated signals with an identical scaling exponenta0
=0.8.
FIG. 7. Probability density of the estimated values ofa0−d,aloc,a0+d, whered=0.02 for a varying scale rangen and fordifferent values of the “input” correlation exponenta0. Separatepanels show the performance of the DMA, WDMA-1, DFA-0 andDFA-1 methods, respectively, based on 50 realizations of correlatedsignals for each value ofa0. The probability density valuesp arepresented in color, with the darker color corresponding to highervalues as indicated in the vertical columns next to each panel. Aperfect scaling behavior would correspond to dark-colored columnsspanning all scalesn for each value ofa0.
XU et al. PHYSICAL REVIEW E 71, 051101s2005d
051101-6
by fitting the rms fluctuation functionFsnd in a window ofsizew=3 log 2 sliding in steps ofD= 1
4 log 2. Vertical colorbars in Fig. 7 represent the value of the probabilityp—darker colors corresponding to higher probability to ob-tain accurate values foraloc. Thus dark-colored columns inthe panels of Fig. 7 represent the range of scalesn where themethods perform best.
For the DMA and WDMA-1 methods, we find that withhigh probabilitysp.0.7d, accurate scaling results can be ob-tained in the scaling range of two decades for 0.4øa0ø0.6. However, WDMA-1 performs better at small scalescompared to DMA. For an explanation of why the WDMA-1performs better at small scales compared to DMA, see Ap-pendix B. In contrast, DFA-0 exhibits an increased fittingrange of about three decades for 0.4øa0ø0.8, while for theDFA-1 we find the best fitting range to be around three de-cades fora0.0.5. For strongly anticorrelated signalssa0
,0.2d, all methods do not provide an accurate estimate ofthe scaling exponentsa0. However, by integrating anticorre-lated signals witha0,0.3 and applying the DFA-1 method,
we can reliably quantify the scaling exponent, since DFA-1has the advantage to quantify signals witha0.1 fFig. 7sddg.This cannot be obtained by the other three methodsfFigs.7sad–7scdg.
B. Centered moving average method and DFA
To test the accuracy of the CDMA method we perform thesame procedure as shown in Fig. 3. We calculate the localscaling exponentaloc for signals with different “input” cor-relation exponenta0 and for a broad range of scalesn sFig.8d. We find that for 0.3,a0,0.8 the CDMA method per-forms better than the DMA for all scalesn, and the averagevalue of aloc follows very closely the expected values ofaindicated by horizontal lines in Fig. 8. For anticorrelatedsignals witha0ø0.3, both DMA and CDMA overestimatethe value ofa0 at small scalesn,102. For strongly corre-lated signals witha0.0.8, CDMA underestimatesa0 atsmall scalesn,102, in contrast to DMA which overesti-matesa0. For correlated signals witha0.1.1 fnot shown in
FIG. 8. A comparison of the local scaling exponentaloc as a function of the scalen for the DMA, CDMA, DFA-0, and DFA-1 methods.We consider signals of lengthN=220 and varying values of the correlation exponenta0. The local scaling exponentaloc quantifies thestability of the scaling curvesFsnd and is expected to exhibit small fluctuations around a constant valuea0 if Fsnd is well fitted by apower-law function.a0 is denoted by horizontal dotted lines. Symbols denote the estimated values ofaloc and represent average results from50 realizations of artificial signals for each value of the “input” scaling exponenta0. Deviations from the horizontal lines at small or at largescales indicate limitations of the methods to accurately quantifying the built-in correlations in different scaling ranges. Error bars representthe standard deviation for each average value ofaloc at different scalesn, and determine the accuracy of each method.
QUANTIFYING SIGNALS WITH POWER-LAW… PHYSICAL REVIEW E 71, 051101s2005d
051101-7
Fig. 8scdg the deviation ofaloc from the expected valuea0 forthe CDMA method becomes even more pronounced andspreads to large scales. At intermediate and large scalesCDMA performs much better—aloc closely follows the hori-zontal linesfFigs. 8sad–8scdg. These differences in the per-formance of the DMA and CDMA methods are also clearlyseen in the probability density plots shown in Fig. 9.
Next, we compare the stability of the DMA, CDMA,DFA-0, and DFA-1 methods in reproducing the same “input”value ofa0 for different realizations of correlated signals. Wegenerate 50 realizations of signals for eacha0, and we obtainthe average value and the standard deviation ofaloc for arange of scalesn. The values of the standard deviation arerepresented by error bars in Fig. 8 for each value ofaloc at all
scalesn. We find that with increasing scalesn, the standarddeviation gradually increases, and that for DMA the standarddeviation is less than 0.02 while for DFA the standard devia-tion is less than 0.01 in the range of scalesn up toN/100 sNis the signal lengthd. For all methods at scalesn.N/100, thestandard deviation increases more rapidly, and thus the sta-bility of the methods in reproducing the same value of theexponent for different realizations decreases.
In Fig. 10 we present the dependence ofaloc on the scalen for the weighted centered detrended moving averagemethod. Compared to the CDMA method, the WCDMAmethod weakens the overestimation ofaloc at small scale foranticorrelated signals and provides accurate results ofaloc atsmall scales for positively correlated signals with 0.5,a0,1. Compared to the DFA method, the WCDMA performsbetter at small scales for 0.5,a0,1.0. However, at largerscalesn.102, the standard deviation of DFA-1 is smallerthan that of WCDMAfFigs. 8sdd, 10, and 11g, indicatingmore reliable results for the local scaling exponentaloc ob-tained from DFA-1.
Finally, we test how the choice of the parameterd willaffect the probability density plots shown in Fig. 7 and Fig.9. To access the precision of the methods one has to increasethe confidence level by decreasingd. In Fig. 7 and Fig. 9 wehave chosend=0.02 to correspond to the value of the stan-dard deviation foraloc at scalesn,104 as estimated by theDMA method sFig. 8d. We demonstrate that the distributionplot for DMA with d=0.02 sshown in Fig. 7d changes dra-matically when we choosed=0.01 fas shown in Fig. 12sbdg.This result confirms the observation from Figs. 8sad and 8sddthat the DFA-1 method is more stablessmaller standard
FIG. 9. Probability density of the estimated values ofa0−d,aloc,a0+d, whered=0.02 for a varying scale rangen and fordifferent values of the “input” correlation exponenta0. The twopanels show the performance of the DMA and CDMA methods,respectively, based on 50 realizations of correlated signals for eachvalue ofa0. The probability density valuesp are presented in color,with the darker color corresponding to higher values, as indicated inthe vertical columns next to each panel. A perfect scaling behaviorwould correspond to dark-colored columns spanning all scalesn foreach value ofa0.
FIG. 10. Local scaling exponentaloc as a function of the scalenfor the WCDMA method. We consider signals of lengthN=220 andvarying values of the correlation exponenta0. The expected valueof the exponenta0 is denoted by horizontal dotted lines. Symbolsdenote the estimated values ofaloc and represent average resultsfrom 50 realizations of artificial signals for each value of the “in-put” scaling exponenta0. Deviations from the horizontal lines atsmall or at large scales indicate limitations of the methods to accu-rately quantify the built-in correlations in different scaling ranges.Error bars represent the standard deviation for each average valueof aloc at different scalesn, and determine the accuracy of themethod.
XU et al. PHYSICAL REVIEW E 71, 051101s2005d
051101-8
deviationd and more accuratesaverage ofaloc closer to thetheoretically expected valuea0d than the DMA method.
IV. DISCUSSION
We have systematically studied the performance of thedifferent variants of DMA method when applied to signalswith long-range power-law correlations, and we have com-pared them to the DFA method. Specially, we have consid-ered two categories of detrended moving average methods—the simple moving average and the weighted movingaverage—in order to investigate the effect of the relativecontribution of data points included in the moving averagewindow when estimating correlations in signals. To investi-gate the role of “past” and “future” data points in the dy-namic averaging process for signals with different correla-tions, we have also considered the cases of backward andcentered moving average within each of the above two cat-egories. Finally, we have introduced a three-dimensional rep-resentation to compare the performance of different variantsof the DMA method and the DFA methods over different
scaling ranges based on an ensemble of multiple signal real-izations.
We find that the simple backward moving average DMAmethod and the weighted backward moving average methodWDMA-, have limitations when applied to signals with verystrong correlations characterized by scaling exponenta0.0.8. A similar limitation is also found for the,=0 order ofthe DFA method. However, for higher order,, the DFA-,method can accurately quantify correlations witha0,,+1.We also find that at large scales the DMA, WDMA-,, andDFA-0 methods underestimate the correlations in signalswith 0.5,a0,1.0, while the DFA-, method can more ac-curately quantify the scaling behavior of such signals. Fur-ther, we find that the scaling curves obtained from the DFA-1
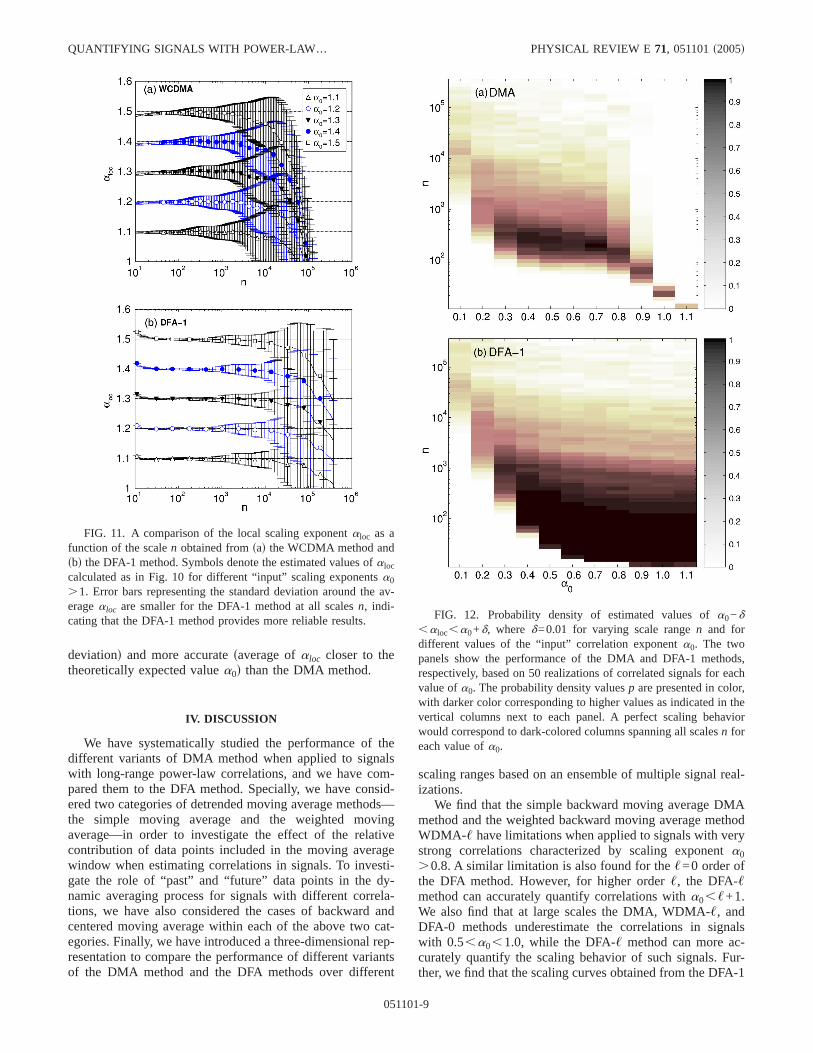
FIG. 11. A comparison of the local scaling exponentaloc as afunction of the scalen obtained fromsad the WCDMA method andsbd the DFA-1 method. Symbols denote the estimated values ofaloc
calculated as in Fig. 10 for different “input” scaling exponentsa0
.1. Error bars representing the standard deviation around the av-eragealoc are smaller for the DFA-1 method at all scalesn, indi-cating that the DFA-1 method provides more reliable results. FIG. 12. Probability density of estimated values ofa0−d
,aloc,a0+d, where d=0.01 for varying scale rangen and fordifferent values of the “input” correlation exponenta0. The twopanels show the performance of the DMA and DFA-1 methods,respectively, based on 50 realizations of correlated signals for eachvalue ofa0. The probability density valuesp are presented in color,with darker color corresponding to higher values as indicated in thevertical columns next to each panel. A perfect scaling behaviorwould correspond to dark-colored columns spanning all scalesn foreach value ofa0.
QUANTIFYING SIGNALS WITH POWER-LAW… PHYSICAL REVIEW E 71, 051101s2005d
051101-9
method are stable over a much broader range of scales com-pared to the DMA, WDMA-1, and DFA-0 methods, indicat-ing a better fitting range to quantify the correlation exponenta0. In contrast, we find that WDMA-, with a higher order,,more accurately reproduce the correlation properties of anti-correlated signalssa0,0.5d at small scales. Accurate resultsfor anticorrelated signals can also be obtained from theDFA-1 method after first integrating the signal and thus re-ducing the value of the estimated correlation exponent by 1.
In contrast to the simple backward moving averagesDMA d and DFA-0 methods, the centered moving averageCDMA provides a more accurate estimate of the correlationsin signals with 0.3,a0,0.7 at small scalesn,102, and insignals with a0.0.7 at intermediate scales 102,n,104.However, the CDMA method strongly underestimates corre-lations in signals witha0.0.7 at small scalessn,102d,while the DFA-1 method reproduces quite accurately the cor-relations of signals witha0.0.7 at both small and interme-diate scales. We also find that by introducing weighted cen-tered moving average WCDMA, one can overcome thelimitation of the CDMA method in estimating correlations insignals witha0.0.5 at small scalessn,102d. On the otherhand, the WCDMA method is characterized by larger errorbars foraloc at intermediate scales compared to the CDMA
method. Further, we find that the performance of theWCDMA is comparable to the DFA-1 method for signalswith 0.5,a0,1. At small scales the WCDMA performsbetter than the DFA-1 method, while at the intermediatescales 102,n,104, DFA-1 provides more reliable localscaling exponent with smaller standard deviation based on50 independent realizations for eacha0. For very stronglycorrelated signals witha0.1, we find that the DFA-1method performs much better at all scales compared toWCDMA and all other variants of the DMA method.
ACKNOWLEDGMENTS
This work was supported by NIH Grant HL071972 andby the MIUR sPRIN 2003029008d.
APPENDIX A
1. Higher order weighted moving average
To account for different types of correlations in signals,we consider the,-order weighted moving averagesWDMA-,d, defined as
FIG. 13. A comparison of the local scaling exponentaloc as a function of the scalen for the WDMA-, method with different order,=2, . . . ,5 of the weighted moving average. We consider signals of lengthN=220 and varying values of the correlation exponenta0. The localscaling exponentaloc quantifies the stability of the scaling curvesFsnd ssee Fig. 1d, and is expected to exhibit small fluctuations around aconstant valuea0 if Fsnd is well fitted by a power-law function.a0 is denoted by horizontal dotted lines. Symbols denote the estimatedvalues ofaloc and represent average results from 50 realizations of artificial signals for each value of the “input” scaling exponenta0. Forsmall values of, at small and intermediate scalesn, WDMA-, accurately reproduces the scaling behavior of signals with 0.4,a0,0.8,while for large,, the scaling behavior of anticorrelated signals witha0,0.4 are better reproduced at small scales.
XU et al. PHYSICAL REVIEW E 71, 051101s2005d
051101-10
ynsid ;s1 − ld
,ok=0
,−1
ysi − kd + lynsi − ,d, sA1d
wherel=n/ sn+,d, , is the order of the moving average,ysidis defined in Eq.s1d. The relative importance of the twoterms entering the function in Eq.sA1d can be further under-stood by analyzing the properties of the transfer functionHsfd in the frequency domainssee Appendix Bd.
Compared to the traditional exponentially weighted mov-ing averagesof order ,=1d where the terms in Eq.sA1ddecrease exponentially, the higher order,.1 allows for aslower, step-size decrease of the terms in Eq.sA1d with a“step” of size ,. The fluctuation functionFsnd is obtainedfollowing Eq. s10d and Eq.s11d. The WDMA-, allows for amore gradual decrease in the distribution of weights in themoving average box, and thus may be more appropriate
when estimating the scaling behavior of anticorrelated anduncorrelated signals.
We apply the WDMA-, method for increasing values of,to correlated signals with varied values of the scaling expo-nenta0. To study the performance of the WDMA-, methods,we estimate the scaling behavior of the rms fluctuation func-tion Fsnd at different scalesn by calculating the local scalingexponentaloc in the same way as discussed in Fig. 3. We findthat at large scales for,=2, . . . ,5, thealoc curves deviatesignificantly from the expected valuesa0—presented withhorizontal dashed lines in Fig. 13. This indicates that theWDMA-, method significantly underestimates the strengthof the correlations in our artificially generated signals. Fur-ther, as for,=1, we find that for higher order,.1 theWDMA-, methods exhibit an inherent limitation to accu-rately quantify the scaling behavior of positively correlatedsignals witha0.0.7. This behavior is also clear from ourthree-dimensional presentation in Fig. 14. For anticorrelated
FIG. 14. Probability density of estimated values ofa0−d,aloc,a0+d, whered=0.02 for the varying scale rangen and for differentvalues of the “input” correlation exponenta0. Separate panels show the performance of the WDMA-2, WDMA-3, WDMA-4, and WDMA-5methods, respectively, based on 50 realizations of correlated signals for each value ofa0. The probability density valuesp are presented incolor, with the darker color corresponding to higher values, as indicated in the vertical columns next to each panel. A perfect scaling behaviorwould correspond to dark-colored columns spanning all scalesn for each value ofa0.
QUANTIFYING SIGNALS WITH POWER-LAW… PHYSICAL REVIEW E 71, 051101s2005d
051101-11
signals, however, the WDMA-, performs better at small andintermediate scales for increasing order, as a0 decreasessFig. 13d ssee Appendix Bd. These observations are also con-firmed from the three-dimensional probability histograms inFig. 14, where it is clear that the scaling range for the best fitshrinks for positively correlated signalssa0.0.5d for in-creasing order,, while for anticorrelated signalssa0,0.5d,there is a broader range of scales over which a best fitswitha probability ofp.0.7d is observed.
APPENDIX B
1. Moving average methods in frequency domain
In this appendix, the performance of the DMA algorithmis discussed in the frequency domain. The interest of thefrequency domain derives from the simplification designedto describe the effect of the detrending functionynsid interms of the product of the square modulus of the transferfunction Hnsfd and ofSsfd, the power spectral density of thenoisy signalysid.
The simple moving averageynsid of window size n isdefined as
ynsid ;1
nok=0
n−1
ysi − kd, sB1d
corresponding to the discrete form of the causal convolutionintegral, where the convolution kernel introduces thememory effect. EquationsB1d is a sum with a constantmemory kernelhstd, i.e., a step function with an amplitude1/n fFig. 15sadg. The functionhstd uniformly weights thecontribution of all the past events in the windowf0,nd, thusit works better for random paths with a correlation exponentcentered around 0.5. For higher degrees of correlation oranticorrelation, it should be taken into accountsas alreadyexplained in the section describing the DMA functiond thateach data point is more correlated to the most recent pointsthan to the points further away.
In the frequency domain,ynsid is characterized by thetransfer functionHnsfd sthe Dirichlet kerneld, which is
Hnsfd =sinsnpfd
npfe−inpf . sB2d
Hnsfd takes the valuesHns0d=1 and Hnskf0d=0 for k=1,2, . . .n.
The transfer functionHsfd of any filter should ideally be awindow of constant amplitude, going to zero very quicklyabove the cutoff frequency 1/n. By observing the curves ofFig. 15sbd and Fig. 16, it is clear that the filtering perfor-mance ofHnsfd is affected by the presence of the side lobesat frequency higher than 1/n.
As observed in Fig. 16,uH4sfdu2 presents a side lobe al-lowing the components of the signalysid, with a frequencybetween 1/n and 2/n si.e., time scales betweenn/2 andnd topass through the filter, thus giving a spurious contribution toynsid. These components contribute to the rmsFsnd fdefinedin Eq. s11dg less than what should correspond ton on thebasis of the scaling lawFsnd,na, with the consequence ofincreasing the slopeFsnd at small scales.
We next discuss the reasons why the weighted movingaverage might reduce this effect. The exponentially weightedmoving averagesWDMA-,d weights recent data more thanolder data. It is defined as
yn,,sid ;s1 − ld
,ok=0
,−1
ysi − kd + lyn,,si − ,d. sB3d
The coefficients are commonly indicated asweightsof thefilter and are given by
l =n
, + n. sB4d
Taking the Fourier transform on Eq.sB3d, we obtain
FIG. 15. Plot of the moving average filter kernel in the timesadand in the frequency domainsbd, respectively.
FIG. 16. Plot of the functionuHsfdu2 for the simple movingaverage withn=4, uH4sfdu2; for the weighted moving average, withn=4 and ,=2, uH4,2sfdu2, respectively; for the weighted movingaverage withn=4 and,=4 uH4,4sfdu2, respectively.
where Ysfd, Yn,,sfd are the Fourier transforms ofysid andyn,,sid, respectively. Further, we have
Yn,,sfd =1 − l
1 − le−i2p,f H,sfdYsfd. sB6d
Thus the transfer function is
Hn,,sfd =1 − l
1 − le−i2p,f H,sfd. sB7d
From Eq. sB7d, one can find that the cutoff frequency foruHn,,sfdu2 is minh1/f2pÎnsn+,dg ,1 /,j. In Fig. 16, the trans-fer function of the weighted moving averages withn=4 and,=2 and withn=4 and,=4, respectively, are shown. It canbe observed that the effect of the side lobe to the perfor-mance of uH4,2sfdu2 and uH4,4sfdu2 has become negligiblecompared to that ofuH4sfdu2, with the consequence of reduc-ing the high frequency components in the detrended signaland thus reducing the deviation of thealoc, as discussed inthe paper.
f1g P. A. Robinson, Phys. Rev. E67, 032902s2003d.f2g K. Ivanova, T. P. Ackerman, E. E. Clothiaux, P. Ch. Ivanov, H.
E. Stanley, and M. Ausloos, J. Geophys. Res.,fAtmos.g 108,4268 s2003d.
f3g Z. Siwy, M. Ausloos, and K. Ivanova, Phys. Rev. E65,031907s2002d.
f4g P. A. Varotsos, N. V. Sarlis, and E. S. Skordas, Phys. Rev. E67, 021109s2003d.
f5g P. A. Varotsos, N. V. Sarlis, and E. S. Skordas, Phys. Rev. E68, 031106s2003d.
f6g E. Koscielny-Bunde, A. Bunde, S. Havlin, H. E. Roman, Y.Goldreich, and H. J. Schellnhuber, Phys. Rev. Lett.81, 729s1998d.
f7g P. Talkner and R. O. Weber, Phys. Rev. E62, 150 s2000d.f8g J. F. Eichner, E. Koscielny-Bunde, A. Bunde, S. Havlin, and
H. J. Schellnhuber, Phys. Rev. E68, 046133s2003d.f9g K. Fraedrich and R. Blender, Phys. Rev. Lett.90, 108501
s2003d.f10g M. Pattantyus-Abraham, A. Kiraly, and I. M. Janosi, Phys.
Rev. E 69, 021110s2004d.f11g A. Montanari, R. Rosso, and M. S. Taqqu, Water Resour. Res.
36, 1249s2000d.f12g C. Matsoukas, S. Islam, and I. Rodriguez-Iturbe, J. Geophys.
Res.,fAtmos.g 105, 29 165s2000d.f13g M. A. Moret, G. F. Zebende, E. Nogueira, and M. G. Pereira,
Phys. Rev. E68, 041104s2003d.f14g R. G. Kavasseri and R. Nagarajan, IEEE Trans. Circuits Syst.,
I: Fundam. Theory Appl.51, 2255s2004d.f15g G. F. Zebende, M. V. S. da Silva, A. C. P. Rosa, A. S. Alves, J.
C. O. de Jesus, and M. A. Moret, Physica A342, 322 s2004d.f16g C.-K. Peng, S. V. Buldyrev, S. Havlin, M. Simons, H. E. Stan-
ley, and A. L. Goldberger, Phys. Rev. E49, 1685s1994d.f17g S. V. Buldyrev, A. L. Goldberger, S. Havlin, C.-K. Peng, H. E.
Stanley, and M. Simons, Biophys. J.65, 2673s1993d.f18g R. N. Mantegna, S. V. Buldyrev, A. L. Goldberger, S. Havlin,
C.-K. Peng, M. Simons, and H. E. Stanley, Phys. Rev. Lett.76, 1979s1996d.
f19g P. Carpena, P. Bernaola-Galván, P. Ch. Ivanov, and H. E. Stan-ley, NaturesLondond 418, 955 s2002d.
f20g N. Iyengar, C.-K. Peng, R. Morin, A. L. Goldberger, and L. A.Lipsitz, Am. J. Physiol.40, R1078s1996d.
f21g P. Ch. Ivanov, A. Bunde, L. A. Nunes Amaral, S. Havlin, J.
Fritsch-Yelle, R. M. Baevsky, H. E. Stanley, and A. L. Gold-berger, Europhys. Lett.48, 594 s1999d.
f22g S. M. Pikkujamsa, T. H. Makikallio, L. B. Sourander, I. J.Raiha, P. Puukka, J. Skytta, C.-K. Peng, A. L. Goldberger, andH. V. Huikuri, Circulation 100, 393 s1999d.
f23g C.-K. Peng, S. Havlin, H. E. Stanley, and A. L. Goldberger,Chaos5, 82 s1995d.
f24g D. Toweill, K. Sonnenthal, B. Kimberly, S. Lai, and B. Gold-stein, Crit. Care Med.28, 2051s2000d.
f25g A. Bunde, S. Havlin, J. W. Kantelhardt, T. Penzel, J. H. Peter,and K. Voigt, Phys. Rev. Lett.85, 3736s2000d.
f26g Y. Ashkenazy, P. Ch. Ivanov, S. Havlin, C.-K. Peng, A. L.Goldberger, and H. E. Stanley, Phys. Rev. Lett.86, 1900s2001d.
f27g P. Ch. Ivanov, L. A. Nunes Amaral, A. L. Goldberger, M. G.Rosenblum, H. E. Stanley, and Z. R. Struzik, Chaos11, 641s2001d.
f28g M. Cernelc, B. Suki, B. Reinmann, Graham L. Hall, and UrsFrey, J. Appl. Physiol.92, 1817s2002d.
f29g J. W. Kantelhardt, Y. Ashkenazy, P. Ch. Ivanov, A. Bunde, S.Havlin, T. Penzel, J.-H. Peter, and H. E. Stanley, Phys. Rev. E65, 051908s2002d.
f30g R. Karasik, N. Sapir, Y. Ashkenazy, P. Ch. Ivanov, I. Dvir, P.Lavie, and S. Havlin, Phys. Rev. E66, 062902s2002d.
f31g J. C. Echeverria, M. S. Woolfson, J. A. Crowe, B. R. Hayes-Gill, G. D. H. Croaker, and H. Vyas, Chaos13, 467 s2003d.
f32g K. Hu, P. Ch. Ivanov, Z. Chen, M. F. Hilton, H. E. Stanley, andS. A. Shea, Physica A337, 307 s2004d.
f33g D. N. Baldwin, B. Suki, J. J. Pillow, H. L. Roiha, S. Minoc-chieri, and U. Frey, J. Appl. Physiol.97, 1830s2004d.
f34g J. W. Kantelhardt, S. Havlin, and P. Ch. Ivanov, Europhys.Lett. 62, 147 s2003d.
f35g R. C. Hwaand T. C. Ferree, Physica A338, 246 s2004d.f36g N. Vandewalle and M. Ausloos, Phys. Rev. E58, 6832s1998d.f37g Y. Liu, P. Gopikrishnan, P. Cizeau, M. Meyer, C.-K. Peng, and
H. E. Stanley, Phys. Rev. E60, 1390s1999d.f38g I. M. Janosi, B. Janecsko, and I. Kondor, Physica A269, 111
s1999d.f39g M. Ausloos, N. Vandewalle, P. Boveroux, A. Minguet, and K.
Ivanova, Physica A274, 229 s1999d.f40g M. Roberto, E. Scalas, G. Cuniberti, and M. Riani, Physica A
269, 148 s1999d.
QUANTIFYING SIGNALS WITH POWER-LAW… PHYSICAL REVIEW E 71, 051101s2005d
051101-13
f41g P. Grau-Carles, Physica A287, 396 s2000d.f42g M. Ausloos and K. Ivanova, Phys. Rev. E63, 047201s2001d.f43g P. Ch. Ivanov, A. Yuen, B. Podobnik, and Y. Lee, Phys. Rev. E
69, 056107s2004d.f44g K. Hu, P. Ch. Ivanov, Z. Chen, P. Carpena, and H. E. Stanley,
Phys. Rev. E64, 011114s2001d.f45g Z. Chen, P. Ch. Ivanov, K. Hu, and H. E. Stanley, Phys. Rev. E
65, 041107s2002d.f46g Z. Chen, K. Hu, P. Carpena, P. Bernaola, H. E. Stanley, and P.
Ch. Ivanov, Phys. Rev. E71, 011104s2005d.f47g P. S. Wilson, A. C. Tomsett, and R. Toumi, Phys. Rev. E68,
017103s2003d.f48g R. L. Stratonovich,Topics in the Theory of Random Noise Vol.
1 sGordon & Breach, New York, 1981d.f49g H. E. Hurst, Trans. Am. Soc. Civ. Eng.116, 770 s1951d.f50g B. B. Mandelbrot and J. R. Wallis, Water Resour. Res.5, No.
2, 321s1969d.f51g M. S. Taqqu, V. Teverovsky, and W. Willinger, Fractals3, 785
s1995d.
f52g E. Alessio, A. Carbone, G. Castelli, and V. Frappietro, Eur.Phys. J. B27, 197 s2002d.
f53g A. Carbone, G. Castelli, and H. E. Stanley, Phys. Rev. E69,026105s2004d.
f54g A. Carbone and H. E. Stanley,Noise in Complex Systems andStochastic Dynamics, Proc. SPIE Vol. 5471sSPIE, Belling-ham, WA, 2004d, p. 1.
f55g A. Carbone, G. Castelli, and H. E. Stanley, Physica A340,540 s2004d.
f56g A. Carbone and H. E. Stanley, Physica A344, 267 s2004d.f57g H. A. Makse, S. Havlin, M. Schwartz, and H. E. Stanley, Phys.
Rev. E 53, 5445s1996d.f58g K. Kwon and R. J. Kish, Appl. Financ. Econ.12, 273 s2002d.f59g S. Talluri and J. Sarkis, Int. J. Prod. Res.74, 47 s2004d.f60g D. Q. Cai, M. Xie, and T. N. Goh, Int. J. Comput. Vis.14, 206
s2001d.f61g A. B. Yeh, D. K. J. Lin, H. Zhou, and C. Renkataramani, J.