Phytochemical Antioxidants with Potential Health Benefits in Foods A CASPiE Research Module Created by Jay Burgess Associate Professor Department of Foods & Nutrition Purdue University, West Lafayette, IN 47907 Course Manual for UIC Chemistry 114 - 118 Spring, 2008
Transcript
Phytochemical Antioxidants with Potential Health Benefits in Foods
A CASPiE Research Module
Created by Jay Burgess Associate Professor
Department of Foods amp Nutrition Purdue University West Lafayette IN 47907
Course Manual for UIC Chemistry 114 - 118
Spring 2008
Table of Contents Introduction 1 Essential Nutrients in Food 2 Chronic Disease and Oxidative Damage 2 How Antioxidants Prevent Oxidative Damage3 Phytochemicals as antioxidants5 Measurement of Antioxidant Activity7 What we donrsquot know and what you are going to do in this module 8 Module Calendar 9 Laboratory 1 Making Solutions and Spectral Scanning of the Trolox Equivalent Antioxidant Capacity (TEAC) Substrate10 Overview of this Laboratory Activity 10 Introduction to TEAC Assay Spectrophotometric Measurement of ABTS˙+ (the ABTS Radical Cation) 13 Pre-Lab Requirements15 Materials Available 15 Waste Disposal15 Laboratory Procedures 16 Post-Lab Calculations and Analysis of the results 18 Preparation for Next Week18 Laboratory 2 TEAC Activity of Epicatechin Quercetin and Trolox 19 Overview of This Activity19 Introduction 19 Pre-Lab Requirements20 Materials Available 20 Waste Disposal20 Laboratory Procedures 21 Post-Lab Calculations and Analysis of Results 21 Preparation for Next Week23 Laboratory Period 3 Determination of Ascorbate (Vitamin C) Concentration and Total Phenolics in Common Foods24 Introduction 24 A Primer on High Pressure Liquid Chromatography (HPLC) 25 Determination of Ascorbate Concentration by Titration 26 Measurement of the Total Polyphenolic Content of Foods 26 Overview of This Activity26 Pre-Lab Requirements27 Waste Disposal28 Procedures 28 Preparation of Ascorbate Standards and Juice Samples (for HPLC or Titration Method) 28 Post-Lab Calculations and Analysis of the Results 31 Post-Lab Questions and Analysis of Results34 Preparation for Next Week34 Laboratory 4 - 6 Original Research Project 35 Introduction 35 Pre-Lab Requirements35 Overview of this Research Activity 35 What is Currently Known and Unknown About Antioxidants in Foods 36 Design and Conduct a Research Project on Antioxidants in Food 37 Your Contribution to the Research of Dr Burgess38 Appendix A Procedure to Simulate Digestion 39 Appendix B Reading and Interpreting a Research Paper 40 Acknowledgements 46 Bibliography46
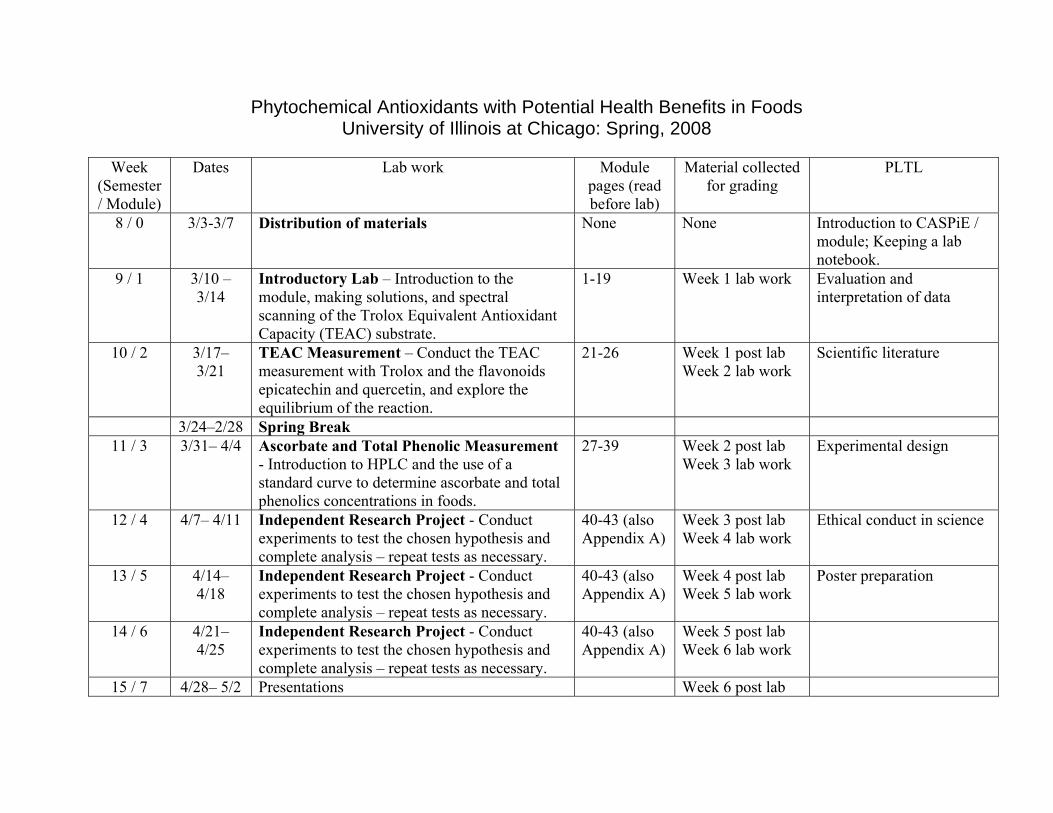
Phytochemical Antioxidants with Potential Health Benefits in Foods University of Illinois at Chicago Spring 2008
Week
(Semester Module)
Dates Lab work Module pages (read before lab)
Material collected for grading
PLTL
8 0 33-37 Distribution of materials None None Introduction to CASPiE module Keeping a lab notebook
9 1 310 ndash 314
Introductory Lab ndash Introduction to the module making solutions and spectral scanning of the Trolox Equivalent Antioxidant Capacity (TEAC) substrate
1-19 Week 1 lab work Evaluation and interpretation of data
10 2 317ndash 321
TEAC Measurement ndash Conduct the TEAC measurement with Trolox and the flavonoids epicatechin and quercetin and explore the equilibrium of the reaction
21-26 Week 1 post lab Week 2 lab work
Scientific literature
324ndash228 Spring Break 11 3 331ndash 44 Ascorbate and Total Phenolic Measurement
- Introduction to HPLC and the use of a standard curve to determine ascorbate and total phenolics concentrations in foods
27-39 Week 2 post lab Week 3 lab work
Experimental design
12 4 47ndash 411 Independent Research Project - Conduct experiments to test the chosen hypothesis and complete analysis ndash repeat tests as necessary
40-43 (also Appendix A)
Week 3 post lab Week 4 lab work
Ethical conduct in science
13 5 414ndash 418
Independent Research Project - Conduct experiments to test the chosen hypothesis and complete analysis ndash repeat tests as necessary
40-43 (also Appendix A)
Week 4 post lab Week 5 lab work
Poster preparation
14 6 421ndash 425
Independent Research Project - Conduct experiments to test the chosen hypothesis and complete analysis ndash repeat tests as necessary
40-43 (also Appendix A)
Week 5 post lab Week 6 lab work
15 7 428ndash 52 Presentations Week 6 post lab
About the Author Dr Jay Burgess is an Associate Professor in the Department of Foods and Nutrition at Purdue University His research focuses primarily on oxidative stress in mammals and the physiological results of such an accumulation of reactive oxygen species The Burgess lab has studied the role of reactive species in the pathophysiology of attention-deficithyperactivity disorder (ADHD) and has shown that some children with ADHD exhibit certain biochemical abnormalities indicative of cellular oxidative stress They have also shown in an animal model for ADHD that supplementing with antioxidants can reverse the abnormalities and improve behavior Another project the Burgess lab has been working on involves flavonoid antioxidants They have determined that such antioxidants can be helpful in reducing oxidative stress but are not sufficient to compensate for a deficiency of essential antioxidant nutrients like vitamin E From this module Dr Burgess would like to gain a greater amount of knowledge of the antioxidant activity from different food products currently on the market He is particularly interested at this time in the antioxidant characteristics of green tea and green tea mixtures with fruit juices and what happens to these during digestion Recent Publications Andrade J E and J R Burgess (2007) Effect of the citrus flavanone naringenin on oxidative stress in rats J Agric Food Chem 55(6) 2142-8 Nanua S S M Zick J E Andrade U S Sajjan J R Burgess N W Lukacs and M B Hershenson (2006) Quercetin blocks airway epithelial cell chemokine expression Am J Respir Cell Mol Biol 35(5) 602-10 Guo Q B T Richert J R Burgess D M Webel D E Orr M Blair G E Fitzner D D Hall A L Grant and D E Gerrard (2006) Effects of dietary vitamin E and fat supplementation on pork quality J Anim Sci 84(11) 3089-99 Cabo R J R Burgess and P Navas (2006) Adaptations to oxidative stress induced by vitamin E deficiency in rat liver J Bioenerg Biomembr 38(5-6) 309-17 Antalis C J L J Stevens M Campbell R Pazdro K Ericson and J R Burgess (2006) Omega-3 fatty acid status in attention-deficithyperactivity disorder Prostaglandins Leukot Essent Fatty Acids 75(4-5) 299-308
Center for Authentic Science Practice in Education Spring 2008 1
Figure 1 Label of Brocco Sprouts
Introduction
We are constantly being told to eat fruits and vegetables and that these types of plant foods contain chemicals that are good for us Now the message is that we need to eat up to nine servings a day of fruits and vegetables because this will help prevent people from getting cancer heart disease and other disorders that might afflict us as we age You may have many questions about these recommendations Why do people have to eat so many fruits and vegetables to obtain these health benefits What are the chemical components in fruits and vegetables that provide the proposed health benefits It is common practice to use vitamin and mineral supplements to replace the need to consume so many fruits and vegetables Are vitamins and minerals alone necessary to achieve the health benefits fruits and vegetables give us Is this a misconception or has our understanding changed in recent years You will explore the science that addresses some of these questions over the next six weeks The picture to the right illustrates an example of a vegetable source that is available in many of your local supermarkets Note that under the name of the product contents is the description ldquowith long lasting antioxidant activityrdquo Many would associate antioxidant activity with something good but what does this really mean As a consumer looking at this package you might wonder what would this so-called long lasting antioxidant activity do for you Is it this characteristic of the sprouts that make them good for your health Are these sprouts really better for you than the less expensive sprouts you can buy in the adjacent bin The more detailed information on the back of the package identifies a specific compound sulfurophane GS as something in these sprouts that provides ldquolong lasting antioxidant and cellular functionrdquo The sulfurophane GS is not an essential nutrient such as vitamin C which is also found in these sprouts This chemical substance is one of a multitude of substances in plants (called phytochemicals) that are thought to explain an observed association between high fruit and vegetable consumption and lower incidence of killer diseases such as cancer and heart disease Antioxidant activity is hypothesized to be one mechanism by which these chemical substances might exert this protective effect This characteristic is cited because many of these chemical substances show potent antioxidant activity in the test tube Despite these observations many questions remain concerning which chemical antioxidants in fruits and vegetables really contribute to a lower risk for chronic diseases and how the substances from multiple food sources interact with one another in a mixed food diet to provide such benefit
Center for Authentic Science Practice in Education Spring 2008 2
This introductory section describes the background information on food nutrients and antioxidants and their relationship to health A second section will describe phytochemicals and indicate the chemical characteristics that make them good antioxidants The final section will provide an overview of techniques you will use in this module and how these assessments are used to evaluate the potential health benefits of phytochemicals as antioxidants
Essential Nutrients in Food Food provides chemical substances that are required by heterotrophs1 to allow for growth reproduction and the overall maintenance of health By the first part of the twentieth century the chemical constituents in food that supported these outcomes for humans were identified and classified into groups water carbohydrates lipids proteins vitamins and minerals It was observed during this time that if one did not consume sufficient amounts of these essential nutrients that specific deficiency disorders would develop A good example is the disease scurvy which occurs as a result of insufficient consumption of vitamin C This scientific discovery process was carried out by chemists biochemists physiologists and nutritionists and eventually led to government-supported recommendations for the minimum amount of these nutrients that healthy people should consume to prevent the development of deficiency diseases Today most disorders resulting from nutritional deficiencies are uncommon in developed countries but still often occur in the developing world
You probably recognize the acronym RDA which stands for Recommended Dietary Allowance The RDAs define specific amounts for each nutrient which must be consumed to prevent deficiency in healthy people The US Dietary Guidelines2 and the Food Guide Pyramid3 are more practical tools that consumers can use to select combinations of foods to create diets that provide the RDA for all of the nutrients In recent years it has become apparent to many scientists who study human health that in addition to providing nutrients that prevent deficiency diseases consumption of certain foods appears to be associated with a lower occurrence of diseases that occur more frequently as we age These chronic diseases which generally require decades to develop include heart disease cancer diabetes hypertension and Alzheimerrsquos disease and are among the leading causes of death in the US population Fruits and vegetables are the types of foods that are most often cited as helping to protect people from developing chronic disease However the essential nutrient content of fruits and vegetables although abundant does not appear to account for all of these health benefits Thus over the past decade a great deal of research has been conducted to identify how other chemical constituents in fruits and vegetables might help prevent the development of chronic disease in people
Chronic Disease and Oxidative Damage Understanding the processes by which chronic diseases develop has led to the identification of key mechanisms underlying the development of a disease state Some of 1 Heterotrophs feed partially or exclusively off of other forms of life 2 httpwwwhealthgovdietaryguidelines 3 httpwwwnalusdagovfnicFpyrpyramidhtml
Center for Authentic Science Practice in Education Spring 2008 3
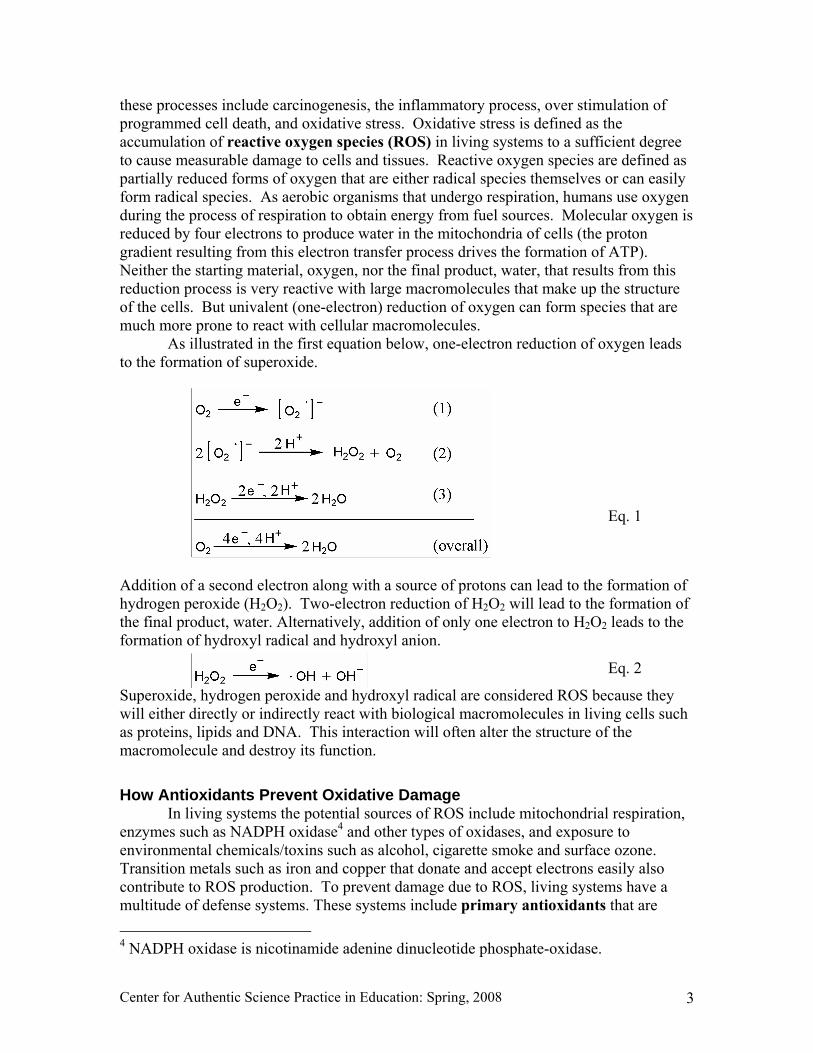
these processes include carcinogenesis the inflammatory process over stimulation of programmed cell death and oxidative stress Oxidative stress is defined as the accumulation of reactive oxygen species (ROS) in living systems to a sufficient degree to cause measurable damage to cells and tissues Reactive oxygen species are defined as partially reduced forms of oxygen that are either radical species themselves or can easily form radical species As aerobic organisms that undergo respiration humans use oxygen during the process of respiration to obtain energy from fuel sources Molecular oxygen is reduced by four electrons to produce water in the mitochondria of cells (the proton gradient resulting from this electron transfer process drives the formation of ATP) Neither the starting material oxygen nor the final product water that results from this reduction process is very reactive with large macromolecules that make up the structure of the cells But univalent (one-electron) reduction of oxygen can form species that are much more prone to react with cellular macromolecules As illustrated in the first equation below one-electron reduction of oxygen leads to the formation of superoxide
Addition of a second electron along with a source of protons can lead to the formation of hydrogen peroxide (H2O2) Two-electron reduction of H2O2 will lead to the formation of the final product water Alternatively addition of only one electron to H2O2 leads to the formation of hydroxyl radical and hydroxyl anion
Superoxide hydrogen peroxide and hydroxyl radical are considered ROS because they will either directly or indirectly react with biological macromolecules in living cells such as proteins lipids and DNA This interaction will often alter the structure of the macromolecule and destroy its function
How Antioxidants Prevent Oxidative Damage In living systems the potential sources of ROS include mitochondrial respiration enzymes such as NADPH oxidase4 and other types of oxidases and exposure to environmental chemicalstoxins such as alcohol cigarette smoke and surface ozone Transition metals such as iron and copper that donate and accept electrons easily also contribute to ROS production To prevent damage due to ROS living systems have a multitude of defense systems These systems include primary antioxidants that are 4 NADPH oxidase is nicotinamide adenine dinucleotide phosphate-oxidase
Eq 2
Eq 1
Center for Authentic Science Practice in Education Spring 2008 4
substances that directly inactivate ROS Primary antioxidants donate a neutral hydrogen atom (with one proton and one electron) to a free radical ROS thereby terminating the radical (allowing for the formation of an electron spin-pair in the outer orbital of the ROS) and preventing the molecule from causing damage Hydrogen-donating antioxidants form more stable less reactive radical species than the ROS Secondary antioxidants prevent damage due to ROS by a variety of other mechanisms including metabolism of non-radical ROS chelation5 of transition metals and repairing the damage that ROS cause to lipids protein and DNA
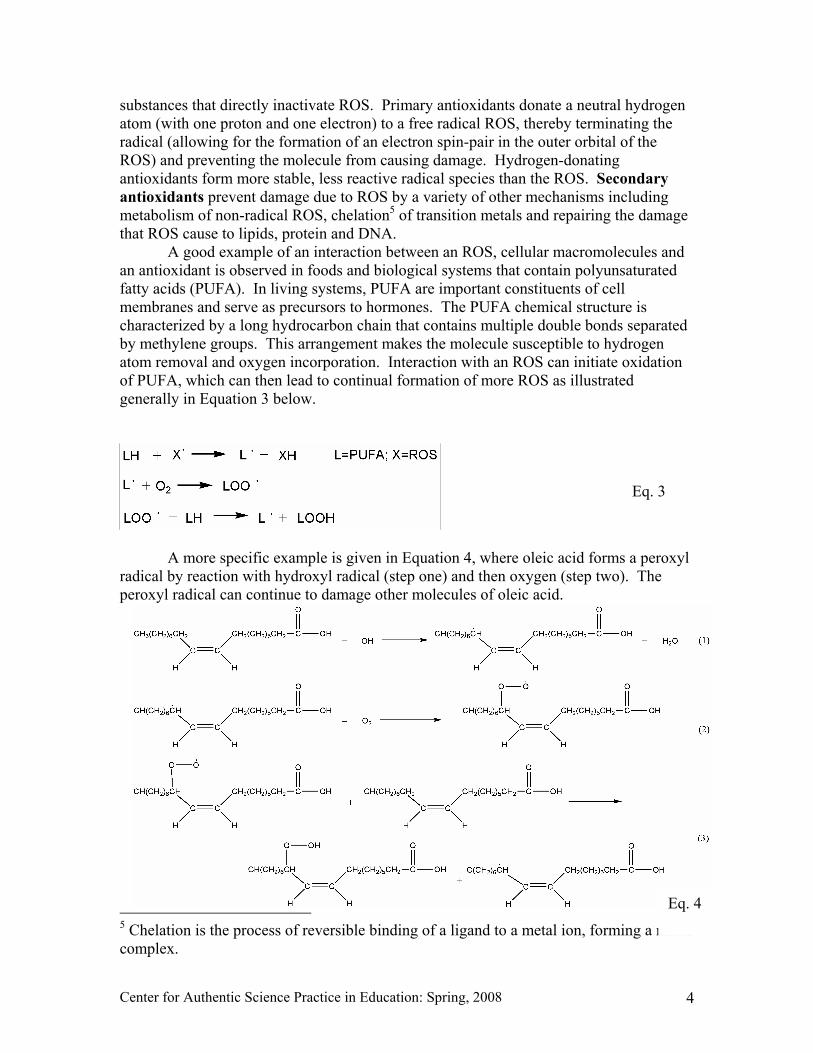
A good example of an interaction between an ROS cellular macromolecules and an antioxidant is observed in foods and biological systems that contain polyunsaturated fatty acids (PUFA) In living systems PUFA are important constituents of cell membranes and serve as precursors to hormones The PUFA chemical structure is characterized by a long hydrocarbon chain that contains multiple double bonds separated by methylene groups This arrangement makes the molecule susceptible to hydrogen atom removal and oxygen incorporation Interaction with an ROS can initiate oxidation of PUFA which can then lead to continual formation of more ROS as illustrated generally in Equation 3 below
A more specific example is given in Equation 4 where oleic acid forms a peroxyl radical by reaction with hydroxyl radical (step one) and then oxygen (step two) The peroxyl radical can continue to damage other molecules of oleic acid
5 Chelation is the process of reversible binding of a ligand to a metal ion forming a metal complex
Eq 4
Eq 3
Center for Authentic Science Practice in Education Spring 2008 5
O
OH
CH3
CH3
CH3
CH3
CH3
CH3CH3
CH3 Figure 2 α-Tocopherol
Eq 5
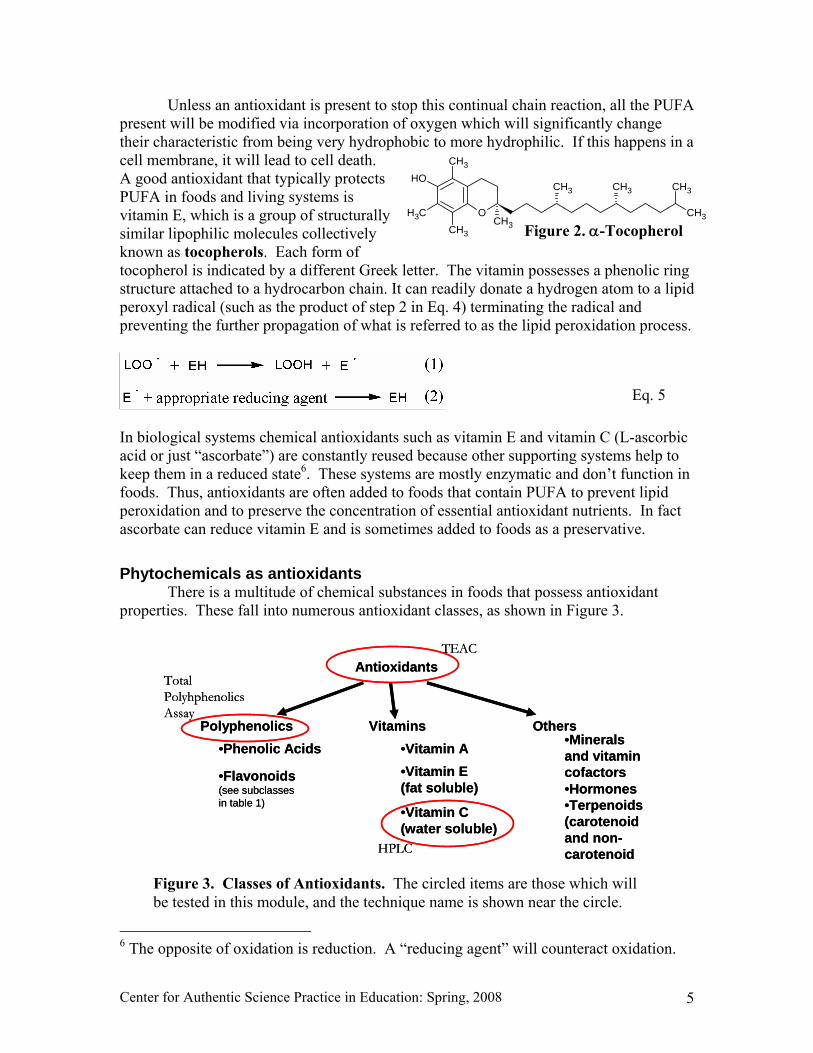
Unless an antioxidant is present to stop this continual chain reaction all the PUFA present will be modified via incorporation of oxygen which will significantly change their characteristic from being very hydrophobic to more hydrophilic If this happens in a cell membrane it will lead to cell death A good antioxidant that typically protects PUFA in foods and living systems is vitamin E which is a group of structurally similar lipophilic molecules collectively known as tocopherols Each form of tocopherol is indicated by a different Greek letter The vitamin possesses a phenolic ring structure attached to a hydrocarbon chain It can readily donate a hydrogen atom to a lipid peroxyl radical (such as the product of step 2 in Eq 4) terminating the radical and preventing the further propagation of what is referred to as the lipid peroxidation process
In biological systems chemical antioxidants such as vitamin E and vitamin C (L-ascorbic acid or just ldquoascorbaterdquo) are constantly reused because other supporting systems help to keep them in a reduced state6 These systems are mostly enzymatic and donrsquot function in foods Thus antioxidants are often added to foods that contain PUFA to prevent lipid peroxidation and to preserve the concentration of essential antioxidant nutrients In fact ascorbate can reduce vitamin E and is sometimes added to foods as a preservative
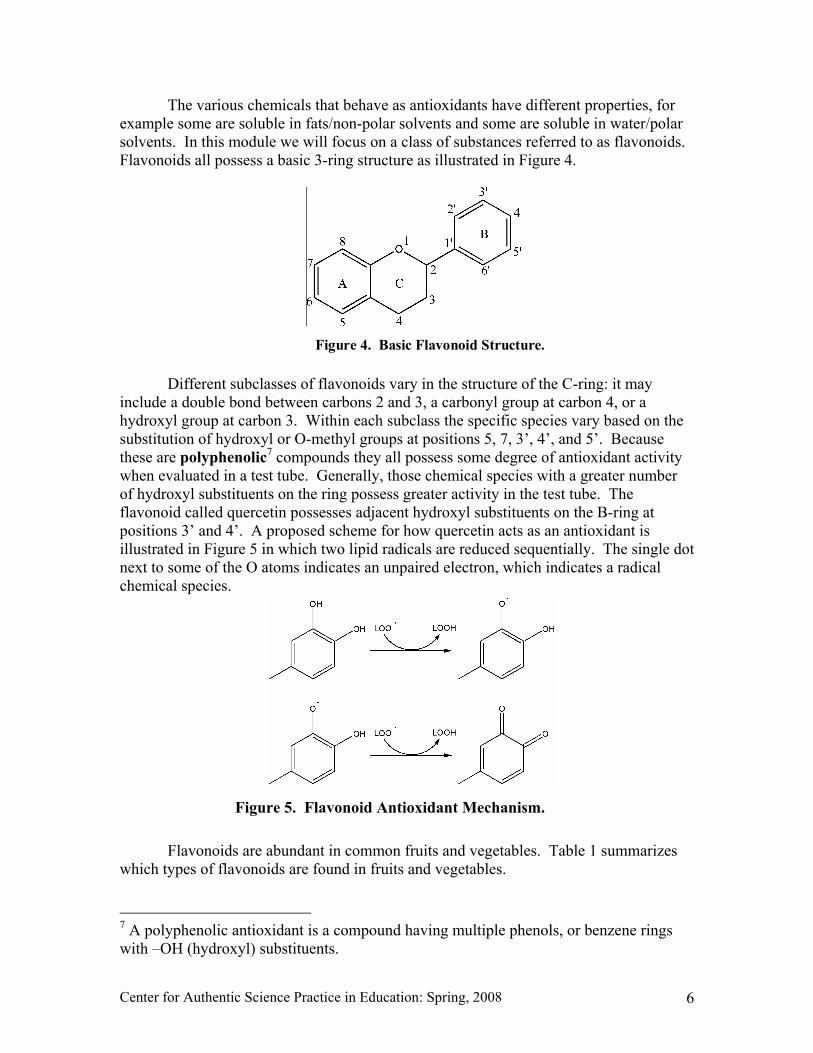
Phytochemicals as antioxidants There is a multitude of chemical substances in foods that possess antioxidant properties These fall into numerous antioxidant classes as shown in Figure 3
bullMinerals and vitamin cofactorsbullHormonesbullTerpenoids(carotenoidand non-carotenoidbullEsters
HPLC
TEAC
Total PolyhphenolicsAssay
6 The opposite of oxidation is reduction A ldquoreducing agentrdquo will counteract oxidation
Figure 3 Classes of Antioxidants The circled items are those which will be tested in this module and the technique name is shown near the circle
Center for Authentic Science Practice in Education Spring 2008 6
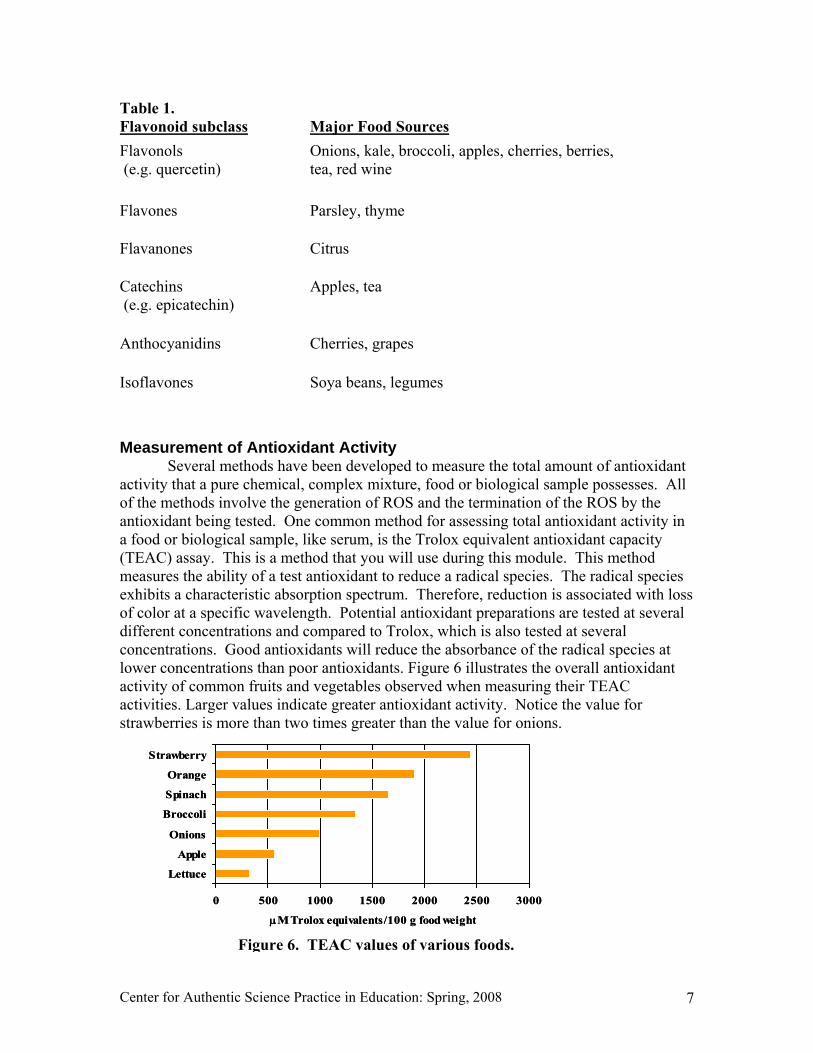
The various chemicals that behave as antioxidants have different properties for example some are soluble in fatsnon-polar solvents and some are soluble in waterpolar solvents In this module we will focus on a class of substances referred to as flavonoids Flavonoids all possess a basic 3-ring structure as illustrated in Figure 4
Figure 4 Basic Flavonoid StructureFigure 4 Basic Flavonoid Structure Different subclasses of flavonoids vary in the structure of the C-ring it may
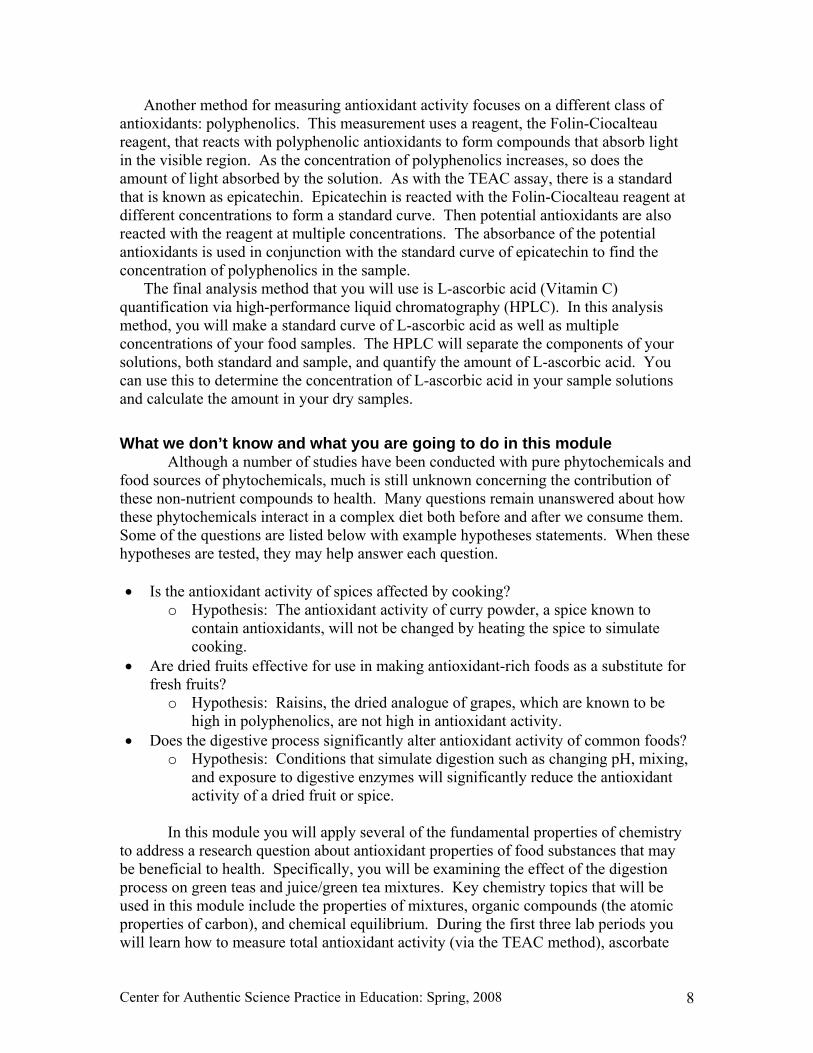
include a double bond between carbons 2 and 3 a carbonyl group at carbon 4 or a hydroxyl group at carbon 3 Within each subclass the specific species vary based on the substitution of hydroxyl or O-methyl groups at positions 5 7 3rsquo 4rsquo and 5rsquo Because these are polyphenolic7 compounds they all possess some degree of antioxidant activity when evaluated in a test tube Generally those chemical species with a greater number of hydroxyl substituents on the ring possess greater activity in the test tube The flavonoid called quercetin possesses adjacent hydroxyl substituents on the B-ring at positions 3rsquo and 4rsquo A proposed scheme for how quercetin acts as an antioxidant is illustrated in Figure 5 in which two lipid radicals are reduced sequentially The single dot next to some of the O atoms indicates an unpaired electron which indicates a radical chemical species
Flavonoids are abundant in common fruits and vegetables Table 1 summarizes
which types of flavonoids are found in fruits and vegetables 7 A polyphenolic antioxidant is a compound having multiple phenols or benzene rings with ndashOH (hydroxyl) substituents
Figure 5 Flavonoid Antioxidant Mechanism
Center for Authentic Science Practice in Education Spring 2008 7
Table 1 Flavonoid subclass
Major Food Sources
Flavonols (eg quercetin)
Onions kale broccoli apples cherries berries tea red wine
Flavones Parsley thyme
Flavanones Citrus
Catechins (eg epicatechin)
Apples tea
Anthocyanidins Cherries grapes
Isoflavones Soya beans legumes
Measurement of Antioxidant Activity Several methods have been developed to measure the total amount of antioxidant
activity that a pure chemical complex mixture food or biological sample possesses All of the methods involve the generation of ROS and the termination of the ROS by the antioxidant being tested One common method for assessing total antioxidant activity in a food or biological sample like serum is the Trolox equivalent antioxidant capacity (TEAC) assay This is a method that you will use during this module This method measures the ability of a test antioxidant to reduce a radical species The radical species exhibits a characteristic absorption spectrum Therefore reduction is associated with loss of color at a specific wavelength Potential antioxidant preparations are tested at several different concentrations and compared to Trolox which is also tested at several concentrations Good antioxidants will reduce the absorbance of the radical species at lower concentrations than poor antioxidants Figure 6 illustrates the overall antioxidant activity of common fruits and vegetables observed when measuring their TEAC activities Larger values indicate greater antioxidant activity Notice the value for strawberries is more than two times greater than the value for onions
0 500 1000 1500 2000 2500 3000
Lettuce
Apple
Onions
Broccoli
Spinach
Orange
Strawberry
μM Trolox equivalents100 g food weight
0 500 1000 1500 2000 2500 3000
Lettuce
Apple
Onions
Broccoli
Spinach
Orange
Strawberry
μM Trolox equivalents100 g food weight
Figure 6 TEAC values of various foods
Center for Authentic Science Practice in Education Spring 2008 8
Another method for measuring antioxidant activity focuses on a different class of antioxidants polyphenolics This measurement uses a reagent the Folin-Ciocalteau reagent that reacts with polyphenolic antioxidants to form compounds that absorb light in the visible region As the concentration of polyphenolics increases so does the amount of light absorbed by the solution As with the TEAC assay there is a standard that is known as epicatechin Epicatechin is reacted with the Folin-Ciocalteau reagent at different concentrations to form a standard curve Then potential antioxidants are also reacted with the reagent at multiple concentrations The absorbance of the potential antioxidants is used in conjunction with the standard curve of epicatechin to find the concentration of polyphenolics in the sample
The final analysis method that you will use is L-ascorbic acid (Vitamin C) quantification via high-performance liquid chromatography (HPLC) In this analysis method you will make a standard curve of L-ascorbic acid as well as multiple concentrations of your food samples The HPLC will separate the components of your solutions both standard and sample and quantify the amount of L-ascorbic acid You can use this to determine the concentration of L-ascorbic acid in your sample solutions and calculate the amount in your dry samples
What we donrsquot know and what you are going to do in this module Although a number of studies have been conducted with pure phytochemicals and food sources of phytochemicals much is still unknown concerning the contribution of these non-nutrient compounds to health Many questions remain unanswered about how these phytochemicals interact in a complex diet both before and after we consume them Some of the questions are listed below with example hypotheses statements When these hypotheses are tested they may help answer each question bull Is the antioxidant activity of spices affected by cooking
o Hypothesis The antioxidant activity of curry powder a spice known to contain antioxidants will not be changed by heating the spice to simulate cooking
bull Are dried fruits effective for use in making antioxidant-rich foods as a substitute for fresh fruits
o Hypothesis Raisins the dried analogue of grapes which are known to be high in polyphenolics are not high in antioxidant activity
bull Does the digestive process significantly alter antioxidant activity of common foods o Hypothesis Conditions that simulate digestion such as changing pH mixing
and exposure to digestive enzymes will significantly reduce the antioxidant activity of a dried fruit or spice
In this module you will apply several of the fundamental properties of chemistry
to address a research question about antioxidant properties of food substances that may be beneficial to health Specifically you will be examining the effect of the digestion process on green teas and juicegreen tea mixtures Key chemistry topics that will be used in this module include the properties of mixtures organic compounds (the atomic properties of carbon) and chemical equilibrium During the first three lab periods you will learn how to measure total antioxidant activity (via the TEAC method) ascorbate
Center for Authentic Science Practice in Education Spring 2008 9
Table 2 Flow-chart for Module Progression
Lab 1 Introductory Lab - Introduction to the module making solutions and spectral scanning of the Trolox Equivalent Antioxidant Capacity (TEAC) substrate
Lab 3 Ascorbate and Total Phenolic Measurement - Introduction to HPLC and the use of a standard curve to determine ascorbate and total phenolics concentrations in foods
Labs 4-7 Independent Research Project - Conduct experiments to test the chosen hypothesis and complete analysis ndash repeat tests as necessary
Lab 2 TEAC Measurement ndash Conduct the TEAC measurement with Trolox and the flavonoids epicatechin and quercetin and explore the equilibrium of the reaction
concentration and total phenolic concentration in standard and food samples During lab four you will begin to plan your own research project As a means of learning how to best design your own research project you will review a very recent paper testing the effect of processing on antioxidant activity of a food substance During this lab period you will also identify the experimental question that your group would like to address and design the experiment that you will conduct during the subsequent laboratories The following table illustrates this proposed schedule
Module Calendar The three main measurements for the upcoming labs are total antioxidant activity as TEAC ascorbate concentration (using HPLC) and total polyphenolics in standard and test samples The TEAC measurement estimates total antioxidant activity contributed by both known (ascorbate and polyphenolics) and unknown chemical components for a given sample Measurement of total polyphenolics concentration is used in this module to reflect the amount of flavonoid compounds present in a test sample
You will use a few standard substrates in the TEAC assay epicatechin quercetin and Trolox Epicatechin is a common flavonoid that is found in apples and tea and it is also a component of compounds that are found in cherries and grapes Quercetin is one of the more abundant flavonoids in our food supply one of the richest sources of quercetin is fried onions Trolox is a more polar form of vitamin E lacking the long hydrocarbon side chain in α-tocopherol Ascorbate is a known essential nutrient antioxidant that functions as such in the body
Center for Authentic Science Practice in Education Spring 2008 10
Laboratory 1 Making Solutions and Spectral Scanning of the Trolox Equivalent Antioxidant Capacity (TEAC)
Substrate
Overview of this Laboratory Activity During this laboratory period you will make a variety of stock solutions that you
will be using throughout the remaining weeks of this module You will also determine the exact concentration of a solution which has been previously prepared for you by using the spectrophotometer
Introduction to Making Solutions Understanding how to make solutions and how to measure their properties is
fundamental to many kinds of research simply because so many substances that are important to life are either solutions or inhomogeneous mixtures The liquids and solids that make up living systems and foods are mixtures of two or more substances physically mixed together but not chemically combined Mixtures possess two important defining characteristics variable composition and retention of individual component properties Solutions and colloids are two common types of mixtures A solution is a homogeneous mixture with each component dispersed evenly throughout the space or phase Salt dissolved in water is an example of a solution Heterogeneous mixtures exist in separate phases A colloid is an example of a heterogeneous mixture in which one component is dispersed evenly as very small particles in the other Milk is an example of a colloid to the unaided eye it appears to be a homogeneous mixture Applying centrifugal force to a milk sample will separate the phases and reveal the colloidal nature of the food Solutions and colloids differ because the particles in solutions are individual atoms ions or molecules whereas in colloids the particles are large macromolecules or aggregates of smaller molecules that are still small enough to remain dispersed In this module you will encounter both solutions and colloids The chemical reagents that you will use to carry out the experiments in each lab are solutions whereas the foods that you will analyze may be either solutions or colloids Solutions are usually defined as one substance (solute) dissolved in another (solvent) that is more abundant The solubility of a solute is the maximum amount of the chemical that will dissolve in a particular volume of solvent usually 1 liter (Some substances will mix together in any proportion and are said to be miscible) A major factor which influences the solubility of a solute in a solvent is the relative strength of the intermolecular forces within and between solute and solvent These forces and their effects are discussed in detail in most Chemistry textbooks Here however we will discuss issues relating to making solutions of various desired concentrations
Common conventions for expressing concentration include molarity molality percent mass and percent volume
bull Molarity (M) = moles of solute volume of solution (L) bull Molality (m) = moles of solute mass of solvent (kg) bull Percent mass = mass of solute total mass of solution x 100 bull Percent volume (vv) = volume of solute total volume of solution x 100
Center for Authentic Science Practice in Education Spring 2008 11
bull Percent volume (wv) = mass of solute total volume of solution x 100 In this module we will primarily be using molarity to express concentration units but you will also see some substances described with the other units so it is important to be familiar with them and the differences between them When making a solution of a desired concentration say 25 mM for example you need to determine two things
bull Total volume of solution that you need bull Mass of solute that you must add to get the desired number of moles
An important point to remember about solutions is that the concentration of the
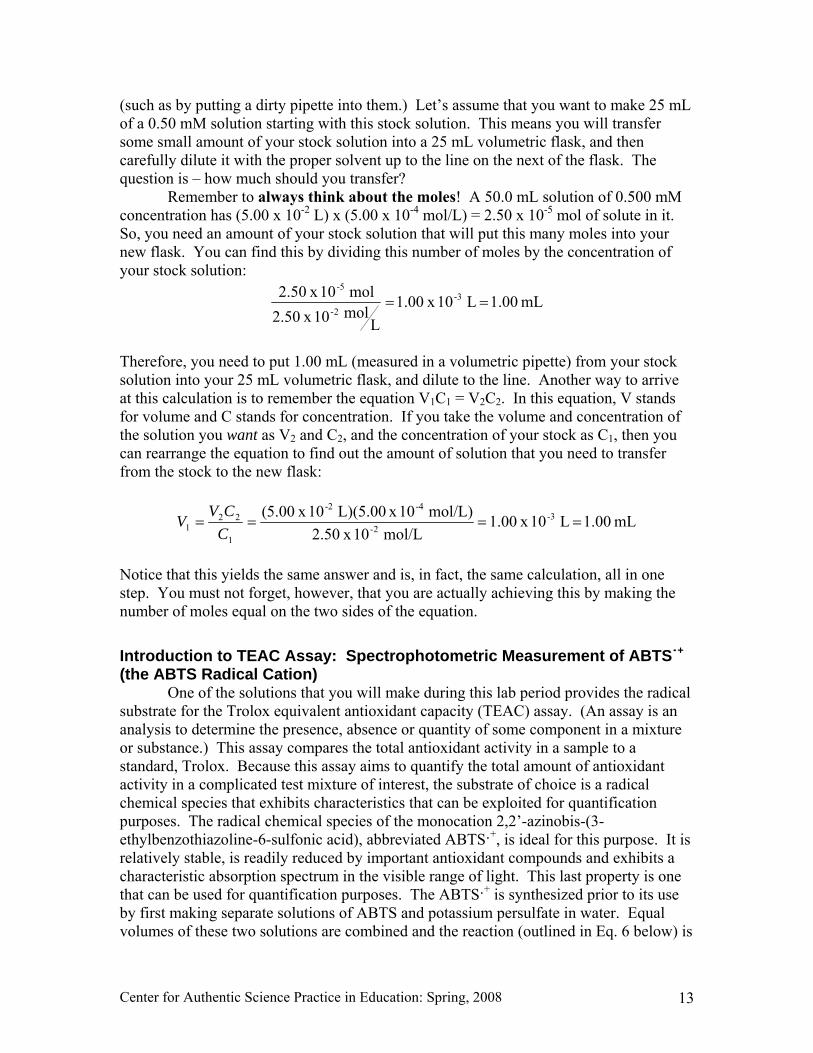
solution will be the same throughout the whole solution For example if you have a liter of solution with a concentration of 50 mM and you pour half of that into another container then the amount you have poured out also has a concentration of 50 mM (as well as the amount you left in the original container) This may seem like such an obvious point that it shouldnrsquot even deserve mention here However this simple point has a very practical purpose when you are making solutions in the laboratory If you need a very small amount of solution (for example 5 mL) and it will be a very dilute solution then it may be difficult or even impossible for you to weigh the proper amount of solute to make the proper concentration of solution at only 5 mL But you could instead make 100 mL of the solution at the desired concentration and simply use 5 mL of it if 100 mL is a more practical volume for weighing your solute Alternatively you could make a more concentrated solution and use what is known as a serial dilution technique to arrive at the more dilute concentration that you desire We will talk about each of these approaches In either case your own common sense is important in deciding how you will arrive at your final desired volumes and concentrations (For example if you are going to make a larger volume than you need donrsquot pick such a large volume that you would be wasting large amounts of solute ndash especially if it is an expensive solute)
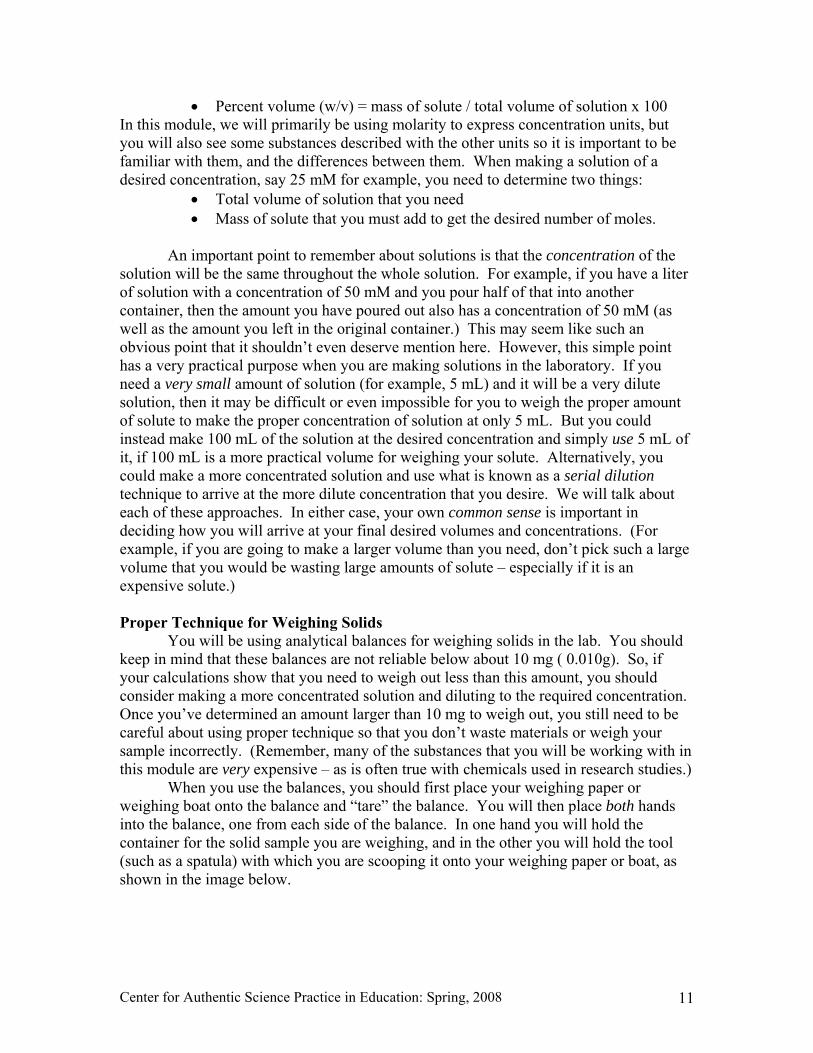
Proper Technique for Weighing Solids You will be using analytical balances for weighing solids in the lab You should keep in mind that these balances are not reliable below about 10 mg ( 0010g) So if your calculations show that you need to weigh out less than this amount you should consider making a more concentrated solution and diluting to the required concentration Once yoursquove determined an amount larger than 10 mg to weigh out you still need to be careful about using proper technique so that you donrsquot waste materials or weigh your sample incorrectly (Remember many of the substances that you will be working with in this module are very expensive ndash as is often true with chemicals used in research studies) When you use the balances you should first place your weighing paper or weighing boat onto the balance and ldquotarerdquo the balance You will then place both hands into the balance one from each side of the balance In one hand you will hold the container for the solid sample you are weighing and in the other you will hold the tool (such as a spatula) with which you are scooping it onto your weighing paper or boat as shown in the image below
Center for Authentic Science Practice in Education Spring 2008 12
When you have the desired amount in your weighing paper or boat leave your sample on the scale but remove both your hands and close the doors The mass displayed with the doors closed is the correct mass for the amount of sample you have weighed out Be sure that you have not spilled any solid sample on the weighing pan outside of your weighing boat since this will give you an incorrect reading Using Dilution to Reach a Desired Concentration You can make a more concentrated solution than you need and then dilute it volumetrically to reach the concentration you desire When you are trying to achieve very specific concentrations you should always be sure to use volumetric flasks to make your solutions In particular it is very important to never fill past the line on the neck You cannot fill past the line and then remove some liquid because that will change your concentration When diluting a solution you need to keep track of the number of moles (ie amount of solute) that you are moving from one place to another Conveniently the number of moles can be calculated by multiplying concentration and volume (conc) molL x (volume) L = mol Letrsquos take an example where we will start out with a ldquostockrdquo solution that has a concentration of 250 mM (that is 250 x 10-2 M) A ldquostockrdquo solution is the solution that you start with and you usually will have a relatively large quantity of it so that you will use it repeatedly to make your other solutions For this reason it is very important that you make your stock solutions carefully and make sure they do not become contaminated
Center for Authentic Science Practice in Education Spring 2008 13
(such as by putting a dirty pipette into them) Letrsquos assume that you want to make 25 mL of a 050 mM solution starting with this stock solution This means you will transfer some small amount of your stock solution into a 25 mL volumetric flask and then carefully dilute it with the proper solvent up to the line on the next of the flask The question is ndash how much should you transfer Remember to always think about the moles A 500 mL solution of 0500 mM concentration has (500 x 10-2 L) x (500 x 10-4 molL) = 250 x 10-5 mol of solute in it So you need an amount of your stock solution that will put this many moles into your new flask You can find this by dividing this number of moles by the concentration of your stock solution
mL 100 L 10 x 100 L
mol 10 x 502mol 10 x 502 3-
2-
-5
==
Therefore you need to put 100 mL (measured in a volumetric pipette) from your stock solution into your 25 mL volumetric flask and dilute to the line Another way to arrive at this calculation is to remember the equation V1C1 = V2C2 In this equation V stands for volume and C stands for concentration If you take the volume and concentration of the solution you want as V2 and C2 and the concentration of your stock as C1 then you can rearrange the equation to find out the amount of solution that you need to transfer from the stock to the new flask
mL 100 L 10 x 100molL 10 x 250
molL) 10 x L)(500 10 x 005( 3-2-
-4-2
1
221 ====
CCVV
Notice that this yields the same answer and is in fact the same calculation all in one step You must not forget however that you are actually achieving this by making the number of moles equal on the two sides of the equation
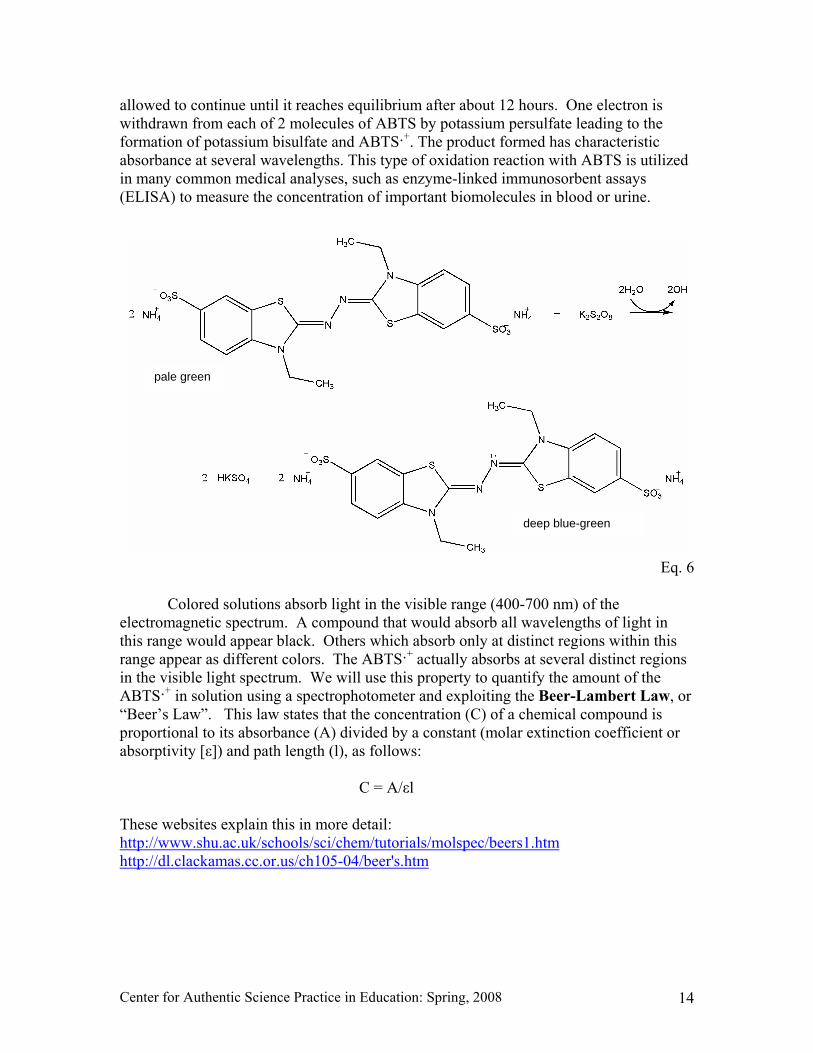
Introduction to TEAC Assay Spectrophotometric Measurement of ABTS˙+ (the ABTS Radical Cation) One of the solutions that you will make during this lab period provides the radical substrate for the Trolox equivalent antioxidant capacity (TEAC) assay (An assay is an analysis to determine the presence absence or quantity of some component in a mixture or substance) This assay compares the total antioxidant activity in a sample to a standard Trolox Because this assay aims to quantify the total amount of antioxidant activity in a complicated test mixture of interest the substrate of choice is a radical chemical species that exhibits characteristics that can be exploited for quantification purposes The radical chemical species of the monocation 22rsquo-azinobis-(3-ethylbenzothiazoline-6-sulfonic acid) abbreviated ABTS+ is ideal for this purpose It is relatively stable is readily reduced by important antioxidant compounds and exhibits a characteristic absorption spectrum in the visible range of light This last property is one that can be used for quantification purposes The ABTS+ is synthesized prior to its use by first making separate solutions of ABTS and potassium persulfate in water Equal volumes of these two solutions are combined and the reaction (outlined in Eq 6 below) is
Center for Authentic Science Practice in Education Spring 2008 14
allowed to continue until it reaches equilibrium after about 12 hours One electron is withdrawn from each of 2 molecules of ABTS by potassium persulfate leading to the formation of potassium bisulfate and ABTS+ The product formed has characteristic absorbance at several wavelengths This type of oxidation reaction with ABTS is utilized in many common medical analyses such as enzyme-linked immunosorbent assays (ELISA) to measure the concentration of important biomolecules in blood or urine
Eq 6
Colored solutions absorb light in the visible range (400-700 nm) of the electromagnetic spectrum A compound that would absorb all wavelengths of light in this range would appear black Others which absorb only at distinct regions within this range appear as different colors The ABTS+ actually absorbs at several distinct regions in the visible light spectrum We will use this property to quantify the amount of the ABTS+ in solution using a spectrophotometer and exploiting the Beer-Lambert Law or ldquoBeerrsquos Lawrdquo This law states that the concentration (C) of a chemical compound is proportional to its absorbance (A) divided by a constant (molar extinction coefficient or absorptivity [ε]) and path length (l) as follows
C = Aεl
These websites explain this in more detail httpwwwshuacukschoolsscichemtutorialsmolspecbeers1htm httpdlclackamasccorusch105-04beershtm
pale green
deep blue-green
Center for Authentic Science Practice in Education Spring 2008 15
According to Re et Al (Free Radical Biology and Medicine Vol 26 Nos 910 pp 1231-1237 1999) for ABTS+ at a wavelength of 734 nm
ε =15x104 mol-1Lcm-1
You will use this constant to calculate the concentration of ABTS+ in substrate solutions
Pre-Lab Requirements Write an introduction and experimental section for this laboratory period Your experimental section should include a description of what you plan to do in lab in your own words such that you could follow the instructions direction out of your own lab notebook In addition to writing introduction and experimental sections for this laboratory you will also need to calculate the masses and volumes needed to make all solutions and dilutions for this procedure before coming to lab You should also research proper volumetric techniques especially those techniques involving the use of equipment not used in the previous Chem 112-114 experiments namely measuring pipets and 3-way safety bulbs
benzopyran-4-one dihydrate) bull Ethanol 100 or equivalent bull ABTS+ that has been incubated for 12 hours bull 25 mL amber vials and 250 mL bottles bull volumetric flasks in 25mL 50mL 100mL and 250mL sizes bull 5 mL measuring pipets bull 1000-200 μL and 200-10 μL auto pipets (ldquomicro pipetsrdquo) bull 3-way safety bulb bull Cuvets bull Waste Jar
Waste Disposal You should have a beaker designated for waste material on your lab bench After you have performed the determination of maximum wavelength the ABTS radical should be disposed of in this beaker All the glassware used in preparing the solutions for the TEAC assay should be rinsed with a small amount of water from your wash bottle and poured into the waste beaker You can then empty the beaker into the large waste jar found in the main hood
Center for Authentic Science Practice in Education Spring 2008 16
Laboratory Procedures Part I Spectrophotometric determination of wavelengths of maximum absorbance (λmax) for the ABTS+ substrate
Today you will measure an absorbance spectrum (sometimes called ldquoUV-Visrdquo) of a completed ABTS+ preparation
While the spectrophotometer is warming up feel free to complete some of the solution preparation parts that follow
Throughout this module you will be using a square plastic cuvet instead of the glass test tube-like cuvets that you may have used in the past These cuvets have two clear sides and two ridged sides so it is important that you insert the cuvet into the spectrophotometer with the correct orientation The cuvets have an arrow molded into the plastic to help you orient the cuvet in the spectrophotometer
An ABTS+ solution that has already been incubated for 12 hours will be provided Make 100 mL of a 1100 dilution of this solution in distilled water This will be referred to as the ABTS+ substrate Transfer 3 mL of the ABTS+ substrate into a cuvet and begin making measurements of the absorbance of this solution at 375 nm For this sample measure the absorbance at intervals of 10 nm through the 375 to 835 nm range The spectrophotometer must be calibrated for each wavelength using deionized water as the blank
(Note For spectrophotometers with scanning capability intervals of 1 nm are preferred) For future studies the position of the peak that you find closest to 735 nm will be used for your TEAC analysis Dispose of the ABTS solution in the waste jar The cuvets can be thrown away Part II Preparation of Solutions for TEAC Assay
You will make two stock solutions that are stable in the dark for several months ABTS and potassium persulfate These two solutions are combined together in equal volumes to create the working ABTS+ that has strong spectrophotometric properties in the visible range and is used in diluted form for the TEAC assay It requires over 12 hours for the formation of ABTS+ to be complete ABTS+ (radical cation) reagent
Make 25 mL of a 0014 M ABTS solution in deionized water Make this solution in a volumetric flask (A word of caution when using a volumetric flask do not fill above the line and then try to remove solvent volume You can fill almost to the line relatively rapidly but then add drop wise until the meniscus of your solution is at the line for an accurate solution concentration) Transfer the solution to an amber vial or a clear vial covered with foil to block light for storage cap tightly and store in the refrigerator Put parafilm around the cap of the vial for weekly storage to avoid solvent evaporation
Make 100 mL of 00049 M potassium persulfate K2S2O8 in deionized water also in a volumetric flask Store in a bottle This solution is not light or temperature sensitive
To make the ABTS+ reagent mix 5 mL each of the ABTS and K2S2O8 solutions you just made into a foil covered or amber vial Cap tightly parafilm and store in the
Note to UIC Students For the implementation in Spring 2008 certain procedures are omitted We have left the original module text here for the sake of completeness But you will skip any sections that are shaded in
Center for Authentic Science Practice in Education Spring 2008 17
refrigerator Label all solutions with contents your name room number date and section number This solution will be ready to use after 12 hours and is stable if kept in the dark up to an additional 10 days
Standard Antioxidants Making Stock Solutions of Trolox Epicatechin and Quercetin Make 25 mL of 25mM Trolox stock solution in ethanol in a volumetric flask Transfer the solution to an amber vial Cap tightly parafilm and store in the refrigerator Label all solutions with contents your name room number date and section number Notice that it would be very difficult to do this in one step because you would need to weigh an extremely small amount of solute (Trolox) However in a situation such as this you can make a larger volume and then extract the amount you need Yoursquoll need to look at the sizes of the volumetric glassware that you have available in order to determine what volume you will scale up to
Make 25 mL of 25 mM epicatechin and 25 mL of 10 mM quercetin in ethanol in the same way Here again you need to consider the amount of material that you need to weigh in order to make these solutions One option is to make a more concentrated solution (for which you know the exact concentration) and dilute it For example you could make a 25 mM solution of epicatechin in 25 mL and a 50 mM solution of quercitin in 100 mL Then you can dilute those to end up with the solution concentrations and quantities that you need
In general it is important to think about not only the concentration of a solute that you need but how you will work with the substance when you are making the solution ndash such as weighing it You will want to keep this in mind for lab periods 4-6 when you design your own experimental procedure
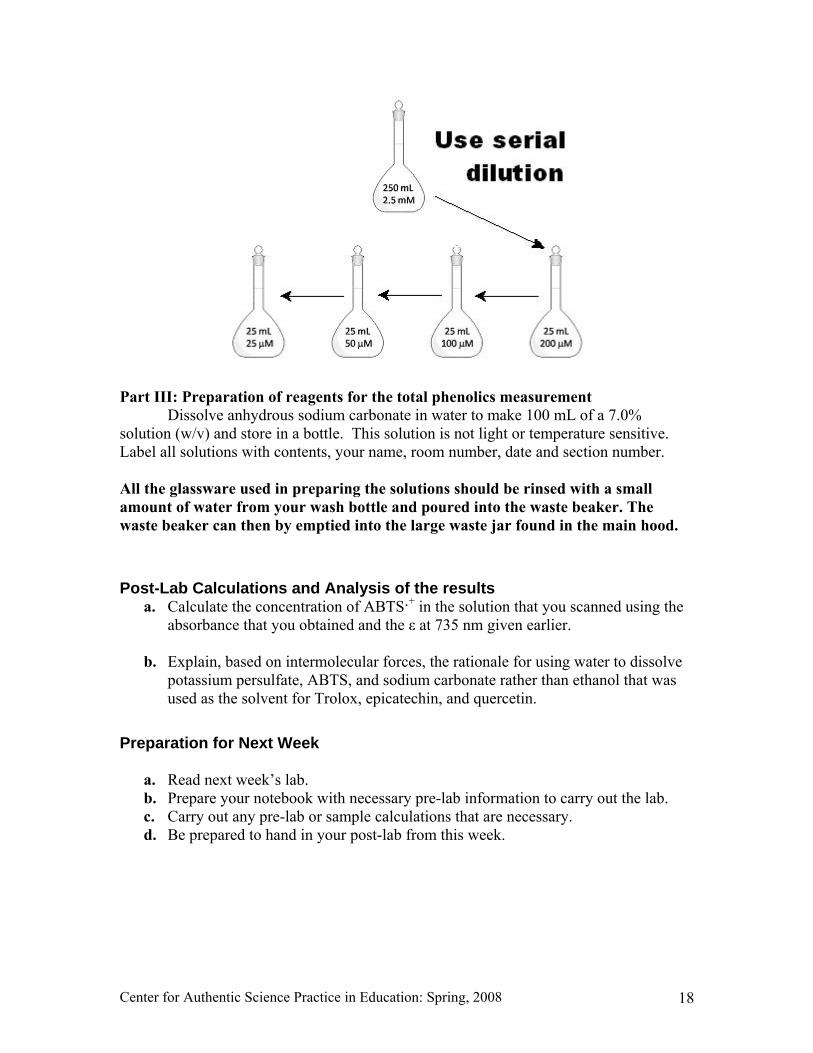
Preparation of Diluted Trolox Epicatechin and Quercetin Solutions Make dilutions of the stock solutions of Trolox
and epicatechin to 25 50 100 and 200 μM and quercetin to 20 40 80 and 160 μM (see example in figure on the next page) Be sure to use the appropriate solvent for dilutions Storage for the dilute solutions is the same as for the stocks When finished you should have twelve dilute or ldquosamplerdquo solutions Each of these will be run in a separate TEAC measurement in laboratory activity 2
UIC Spring 2008 The stock solutions of Trolox epicatechin and quercetin will be prepared for you Always check the bottle for the actual concentration of these and all other solutions
UIC Spring 2008 Your solutions will be stored in vials for use in Week 2 of the module All student groups should prepare solutions of Trolox Half of the groups will also prepare solutions of epicatechin The other half of the groups will do solutions of quercetin Check with your TA for your group assignment
Center for Authentic Science Practice in Education Spring 2008 18
Part III Preparation of reagents for the total phenolics measurement Dissolve anhydrous sodium carbonate in water to make 100 mL of a 70
solution (wv) and store in a bottle This solution is not light or temperature sensitive Label all solutions with contents your name room number date and section number All the glassware used in preparing the solutions should be rinsed with a small amount of water from your wash bottle and poured into the waste beaker The waste beaker can then by emptied into the large waste jar found in the main hood
Post-Lab Calculations and Analysis of the results a Calculate the concentration of ABTS+ in the solution that you scanned using the
absorbance that you obtained and the ε at 735 nm given earlier
b Explain based on intermolecular forces the rationale for using water to dissolve potassium persulfate ABTS and sodium carbonate rather than ethanol that was used as the solvent for Trolox epicatechin and quercetin
Preparation for Next Week
a Read next weekrsquos lab b Prepare your notebook with necessary pre-lab information to carry out the lab c Carry out any pre-lab or sample calculations that are necessary d Be prepared to hand in your post-lab from this week
Center for Authentic Science Practice in Education Spring 2008 19
Laboratory 2 TEAC Activity of Epicatechin Quercetin and Trolox
Overview of This Activity In this lab you will follow the reaction between ABTS+ and primary antioxidants
over time and estimate strength of antioxidant activity for the flavonoids quercetin and epicatechin in comparison to Trolox You will derive a value for quercitin and epicatechin known as the ldquoTrolox-equivalent antioxidant capacityrdquo or TEAC value There are two components to this analysis (1) the calculation to determine the extent of reaction for each antioxidant and (2) the comparison of the extent of reaction for each antioxidant with that of Trolox to determine antioxidant strength Introduction
The study of the extent of reactions or chemical equilibrium involves measuring the concentration of reactants and products at a point in time when no further observable change occurs For the reaction between strong primary antioxidants and ABTS+ the rate is quite fast reaching equilibrium in seconds For weaker antioxidants a much longer time period is required This reaction can be written in shorthand as Eq 7 where AH is an antioxidant capable of donating a hydrogen atom
Eq 7 The extent of the reaction in Eq 7 is measured in the TEAC assay The extent of
the reaction will be correlated with the antioxidant capacity or strength of the antioxidant being tested In the antioxidant research literature for TEAC the extent of reaction is determined based on the percentage of reactant specifically ABTS+ substrate converted to product at defined concentrations of antioxidant Measurements are taken for each test compound and compared to the extent of the reaction for Trolox the water-soluble form of the nutrient antioxidant vitamin E The first thing you will need to do is measure the extent of reaction of each antioxidant (Trolox epicatechin or quercitin) with the radical cation For this objective you will mix ABTS+ substrate with a defined concentration of each antioxidant and their solvent(s) and read the absorbance at 735 nm after 6 minutes The results of each measurement are first converted to a value of ΔAABTS+ (using absorbance units) then to the percent of ABTS+ substrate converted to product which is expressed as ldquopercent inhibitionrdquo You may wonder why the extent of reaction is represented as percent inhibition This relates to the functional role of antioxidants in foods and living systems Consider ABTS+ as a type of ROS In complex systems this ROS would interact with and potentially destroy large macromolecules Reduction of ABTS+ to ABTSH+ inactivates this ROS and prevents this damage Therefore antioxidants inhibit damage caused by ROS and representing the results as percent inhibition not only reflects the extent of the reaction but also the potential functionality of the antioxidant in biological systems Therefore a high percent inhibition implies that the antioxidant has inactivated a large amount of the ABTS+ substrate ROS
Center for Authentic Science Practice in Education Spring 2008 20
The second objective that you will accomplish is to compare the strength of the test antioxidants to Trolox This will be done by plotting the relationship between percent inhibition and concentration for each antioxidant used in the analysis From the slope of the straight line that fits this relationship you will determine the value of percent inhibition per unit concentration of the antioxidant The next step will be to divide the slope of each test antioxidant by the slope obtained for Trolox as a means to standardize the comparison of different antioxidant preparations to one another This ratio of slopes is the ldquoTEAC valuerdquo for each sample A larger TEAC value indicates greater antioxidant capacity What is the Purpose of a Control In all of the techniques you will be using in this module you will need to carefully use ldquocontrolsrdquo The purpose of a control is to ensure that your measurement is yielding the proper values for a known substance In some cases this means that you need to know what effect your solvent has on the measurement so that you can subtract it out In the first three laboratory periods you will be guided about when and how to use control measurements For your own research project you will need to carefully plan how you will incorporate controls into your measurements
Pre-Lab Requirements In addition to writing introduction and experimental sections for this laboratory as before you will also need to calculate the volumes needed to make all dilutions for the TEAC assay before coming to lab Determine if an absorbance measurement at time t=0 is necessary for every aliquot of the ABTS+ substrate
Materials Available bull Your previously prepared solutions of quercetin epicatechin Trolox and ABTS+ bull ethanol 100 bull volumetric flasks in 25mL 50mL 100mL and 250mL sizes bull 25mL amber vials bull spectrophotometer bull cuvets bull 5 mL measuring pipets bull 1000-200 μL and 200-10 μL auto pipets (ldquomicro pipetsrdquo) bull 3-way safety bulb bull Waste jar
Waste Disposal You should have a beaker designated for waste material on your lab bench After you have performed the TEAC procedure all solutions should be disposed of in this beaker All the glassware used in preparing the solutions should be rinsed with a small amount of water from your wash bottle and poured into the waste beaker The waste beaker can then be emptied into the large waste jar found in the main hood
Center for Authentic Science Practice in Education Spring 2008 21
Laboratory Procedures TEAC Procedure
Turn on the spectrophotometer and allow it to warm up for at least 30 minutes Preparation and dilution of ABTS+ (radical cation) reagent
Measure 25 mL of the ABTS+ solution into a 250mL volumetric flask and bring to volume with deionized water This solution will be referred to as the ABTS+ substrate Measurement of substrate quality
Blank the spectrophotometer using water at 735 nm Add 29 mL of ABTSsdot+ substrate to a clean cuvet Record the absorbance of the substrate at 735 nm If the absorbance of ABTSsdot+ is not above 065 then your ABTSsdot+ has gone bad You will need to borrow some for this measurement and you will need to remake your stock solution for next week
Measurement of samples
Next you will measure the absorbance of the Trolox epicatechin and quercitin dilutions that you made in Lab 1 reacting with ABTSsdot+ Add 29 mL of ABTSsdot+ and 100 μL of one sample to a clean cuvet and mix thoroughly (You can mix by putting a small piece of parafilm over the top of the cuvet putting your finger tightly over that and inverting a few times) Set aside for approximately 6 minutes and take a reading at 735 nm You will measure two trials of each of your twelve sample dilutions
You also need to run a control sample In the TEAC procedure this means
running the TEAC assay with 29 mL of ABTSsdot+ substrate and 100 μL of the solvent of the sample being tested The purpose of this measurement is to mimic the conditions of the sample measurements exactly except for the presence of the antioxidant Be sure to use the correct solvent If you are running more than one sample with the same solvent you do not need to do multiple controls
Run at least two trials of each sample and of the control
Dispose of all solutions in the waste jar provided The cuvets can be thrown in the trash Post-Lab Calculations and Analysis of Results Calculations and Graphing
To accomplish the first objective calculate the change (Δ) in [ABTS+] as represented by the change in absorbance on A735 described in Eq 10 Use the data obtained for the 6-minute time point Repeat for each antioxidant at each concentration For each sample concentration average the values of the two trials that you took Calculate Inhibition as illustrated in Eq 11
Center for Authentic Science Practice in Education Spring 2008 22
ΔAABTS+ 6 min = A735Control - A735Test at T=6 min Eq 10 A735Control = Absorbance at 735 nm of the reaction between ABTS+ and [AH]=00 A735Test = Absorbance at 735 nm of the reaction between ABTS+ and [AH]= x M inhibition = (ΔAABTS+ 6 min A735Control ) x 100 Eq 11
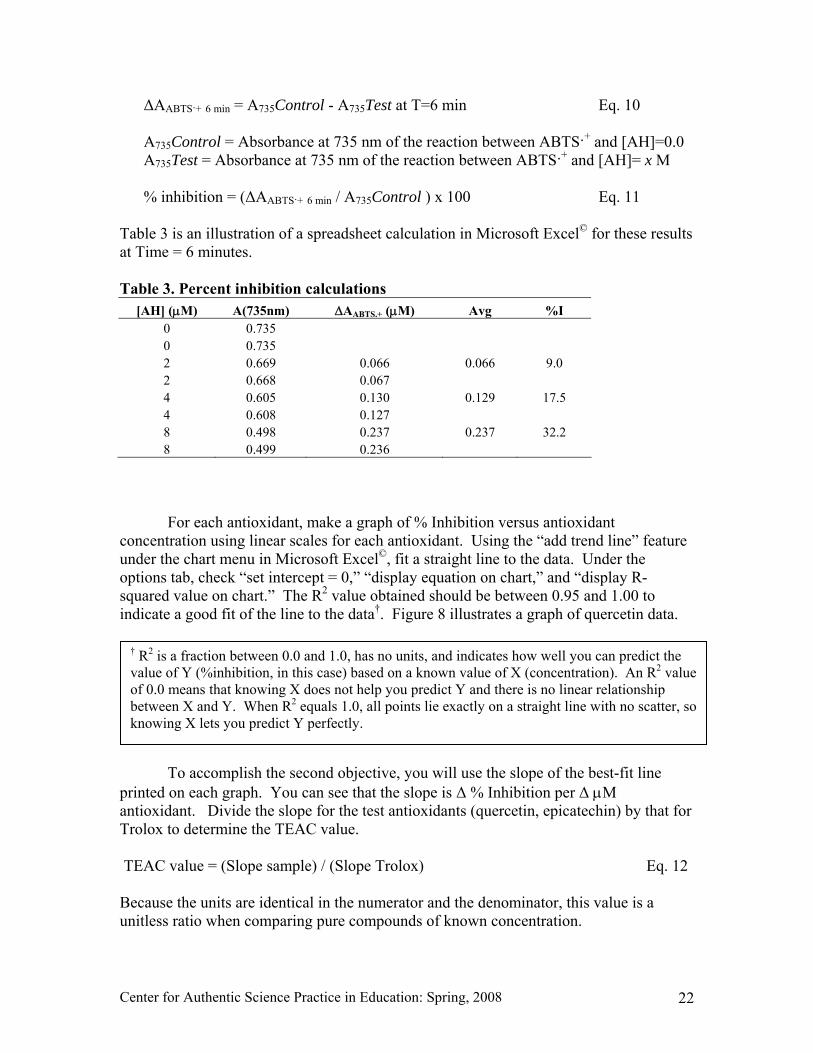
Table 3 is an illustration of a spreadsheet calculation in Microsoft Excelcopy for these results at Time = 6 minutes Table 3 Percent inhibition calculations
For each antioxidant make a graph of Inhibition versus antioxidant concentration using linear scales for each antioxidant Using the ldquoadd trend linerdquo feature under the chart menu in Microsoft Excelcopy fit a straight line to the data Under the options tab check ldquoset intercept = 0rdquo ldquodisplay equation on chartrdquo and ldquodisplay R-squared value on chartrdquo The R2 value obtained should be between 095 and 100 to indicate a good fit of the line to the datadagger Figure 8 illustrates a graph of quercetin data
To accomplish the second objective you will use the slope of the best-fit line printed on each graph You can see that the slope is Δ Inhibition per Δ μM antioxidant Divide the slope for the test antioxidants (quercetin epicatechin) by that for Trolox to determine the TEAC value TEAC value = (Slope sample) (Slope Trolox) Eq 12 Because the units are identical in the numerator and the denominator this value is a unitless ratio when comparing pure compounds of known concentration
dagger R2 is a fraction between 00 and 10 has no units and indicates how well you can predict the value of Y (inhibition in this case) based on a known value of X (concentration) An R2 value of 00 means that knowing X does not help you predict Y and there is no linear relationship between X and Y When R2 equals 10 all points lie exactly on a straight line with no scatter so knowing X lets you predict Y perfectly
Center for Authentic Science Practice in Education Spring 2008 23
The TEAC assay may also be used with food products To find the TEAC value for food products plot the TEAC results for TE and the food sample incubations for the 6 min reading as percent inhibition versus concentration in the reaction mixture For the food samples express this concentration in amount of food per liter of reaction (μLL) Calculate the TEAC values for the food sample incubations by dividing the slope of the regression line for each by that for Trolox Convert the units for TEAC for the food products to mM Trolox per L of food sample In some cases it may be more telling to also present the TEAC values in mM Trolox per g of food sample Analysis of the Results a Should there be variation in your control absorption values for the substrate Was there variation in your experiment Please explain b What TEAC values were obtained for quercetin and epicatechin Which is a better primary antioxidant c Why can A ABTS+ be used to represent the change in ABTS+ concentration
Preparation for Next Week a Find out which ascorbate quantification method you
will be using (HPLC or titration) and plan your procedure accordingly Find out if your instructor will provide juice samples or if you are to bring your own
b Write an introduction and experimental section in your notebook
c Carry out the pre-lab calculations before going to lab d Be prepared to turn in your post-lab from this week
Figure 8 TEAC results plot of Inhibition versus quercetin concentration
Effect of Quercetin concentration
on ABTS + Absorbance
y = 41124x
R2 = 09917
00
50
100
150
200
250
300
350
0 2 4 6 8 10
Quercetin concentration ( μM)
in
hibi
tion
UIC Spring 2008 We will only use the HPLC method not the titration method
Center for Authentic Science Practice in Education Spring 2008 24
Laboratory Period 3 Determination of Ascorbate (Vitamin C) Concentration and Total Phenolics in
Common Foods
Introduction Ascorbate (or vitamin C) is an essential nutrient that is found in a variety of plant
foods A lack of sufficient amounts of this nutrient in the diet is responsible for the disease known as ldquoscurvyrdquo Sir James Lind established the link between scurvy and an essential component of plant foods (primarily citrus) in the 1700s Lindrsquos experiments determined that limes contained a substance that would prevent the scurvy so British sailors began consuming limes during long voyages and acquired the nickname ldquolimeysrdquo This important substance was ascorbate
Most animal species can synthesize ascorbate but humans guinea pigs fish and fruit bats require dietary sources of the nutrient In the human body ascorbate serves two main functions It serves as a cofactor for reactions that lead to the maturation of collagen and vitamin C is the primary water-soluble antioxidant in the body Optimal ascorbate concentrations in the blood approach 75 μM and the requirement of up to 90 mgday is the largest of all the vitamins Vitamin C is the most common of the single-nutrient supplements and it is often added to many prepared foods to prevent oxidation Mega doses of the vitamin have been proposed to cure many diseases including the common cold and cancer Although most of these types of claims are disputable the importance of the vitamin for maintaining nutritional health is quite clear
As an antioxidant ascorbate can donate two electrons sequentially to terminate radicals the ascorbate is converted to the oxidized species dehydroascorbate
Eq 13
In living systems that utilize ascorbate as an antioxidant enzymatic reactions
catalyze the reduction of dehydroascorbate using reducing equivalents supplied by glucose oxidation This allows the vitamin to be reused multiple times - a common characteristic of essential nutrients Since ascorbate is the most abundant nutrient antioxidant in fruits and vegetables you will determine its concentration in the samples that you test as a basis for comparison Ascorbate present in foods and supplements will contribute to the overall TEAC activity Two methods are offered to quantify vitamin C content in foods The first method involves extraction of ascorbate from the food matrix followed by separation and quantification by high-pressure liquid chromatography (HPLC) The second method is a titration method using a dye compound that is reduced by vitamin C to a colorless liquid Your instructor will determine which method you will use
Center for Authentic Science Practice in Education Spring 2008 25
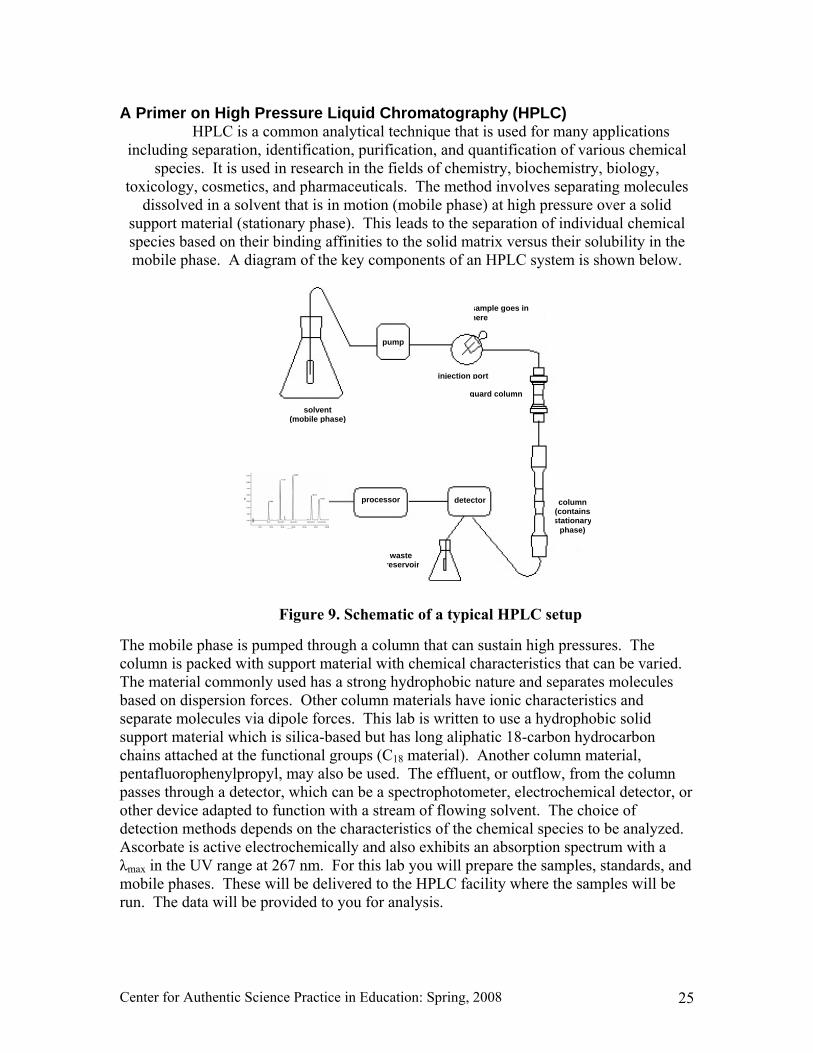
A Primer on High Pressure Liquid Chromatography (HPLC) HPLC is a common analytical technique that is used for many applications
including separation identification purification and quantification of various chemical species It is used in research in the fields of chemistry biochemistry biology
toxicology cosmetics and pharmaceuticals The method involves separating molecules dissolved in a solvent that is in motion (mobile phase) at high pressure over a solid
support material (stationary phase) This leads to the separation of individual chemical species based on their binding affinities to the solid matrix versus their solubility in the mobile phase A diagram of the key components of an HPLC system is shown below
The mobile phase is pumped through a column that can sustain high pressures The column is packed with support material with chemical characteristics that can be varied The material commonly used has a strong hydrophobic nature and separates molecules based on dispersion forces Other column materials have ionic characteristics and separate molecules via dipole forces This lab is written to use a hydrophobic solid support material which is silica-based but has long aliphatic 18-carbon hydrocarbon chains attached at the functional groups (C18 material) Another column material pentafluorophenylpropyl may also be used The effluent or outflow from the column passes through a detector which can be a spectrophotometer electrochemical detector or other device adapted to function with a stream of flowing solvent The choice of detection methods depends on the characteristics of the chemical species to be analyzed Ascorbate is active electrochemically and also exhibits an absorption spectrum with a λmax in the UV range at 267 nm For this lab you will prepare the samples standards and mobile phases These will be delivered to the HPLC facility where the samples will be run The data will be provided to you for analysis
Figure 9 Schematic of a typical HPLC setup
wastereservoir
solvent(mobile phase)
injection port
guard column
sample goes in here
column (contains stationary
phase)
pump
processor detector
Center for Authentic Science Practice in Education Spring 2008 26
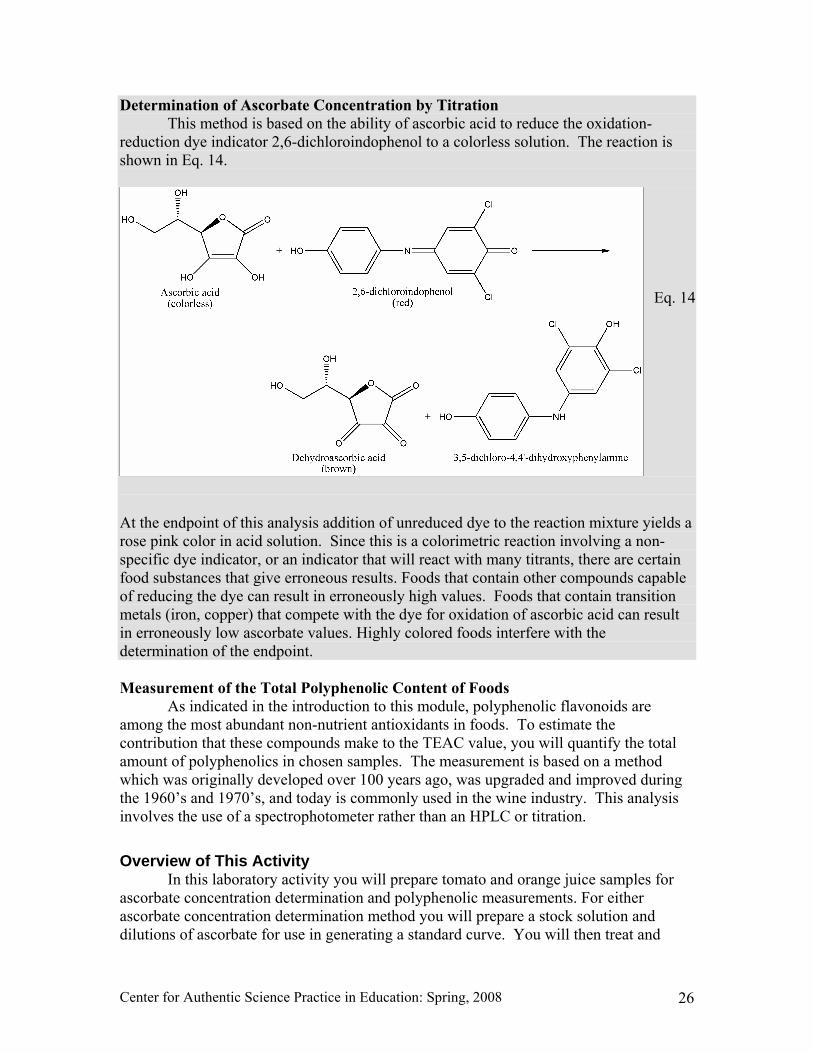
Determination of Ascorbate Concentration by Titration This method is based on the ability of ascorbic acid to reduce the oxidation-
reduction dye indicator 26-dichloroindophenol to a colorless solution The reaction is shown in Eq 14
At the endpoint of this analysis addition of unreduced dye to the reaction mixture yields a rose pink color in acid solution Since this is a colorimetric reaction involving a non-specific dye indicator or an indicator that will react with many titrants there are certain food substances that give erroneous results Foods that contain other compounds capable of reducing the dye can result in erroneously high values Foods that contain transition metals (iron copper) that compete with the dye for oxidation of ascorbic acid can result in erroneously low ascorbate values Highly colored foods interfere with the determination of the endpoint Measurement of the Total Polyphenolic Content of Foods As indicated in the introduction to this module polyphenolic flavonoids are among the most abundant non-nutrient antioxidants in foods To estimate the contribution that these compounds make to the TEAC value you will quantify the total amount of polyphenolics in chosen samples The measurement is based on a method which was originally developed over 100 years ago was upgraded and improved during the 1960rsquos and 1970rsquos and today is commonly used in the wine industry This analysis involves the use of a spectrophotometer rather than an HPLC or titration
Overview of This Activity In this laboratory activity you will prepare tomato and orange juice samples for ascorbate concentration determination and polyphenolic measurements For either ascorbate concentration determination method you will prepare a stock solution and dilutions of ascorbate for use in generating a standard curve You will then treat and
Eq 14
Center for Authentic Science Practice in Education Spring 2008 27
dilute samples of tomato and orange juices so that they are suitable for injection into the HPLC or use in the titration method For the ascorbate analysis by HPLC the standard and test samples will be sent to the instrumentation lab for injection and the results returned to you for later analysis For the total polyphenolic measurement (and titration analysis) you will conduct the analysis on the same juice samples in the lab today
Pre-Lab Requirements In addition to writing introduction and experimental sections for this laboratory
you will also need to calculate the volumes needed to make all dilutions mentioned below Pay special attention to the volumes and dilutions described in Total Polyphenolics Measurement ndash you will need to choose the volumes for many of the solutions NOTE the balances are not reliable below about 10 mg ( 0010g) So if your calculations show that you need to weigh out less than this amount you should consider making a more concentrated solution and diluting to the required concentration
It may be useful to map out the time you will be spending on this lab to determine which parts of the procedure should be attempted first to maximize time efficiency Some parts require long incubations and should be attempted earlier in the period
Materials Available bull Professionally prepared HPLC standards bull ascorbic acid bull 5 acetic acid with 035 mM tris(2-carboxyethyl)phosphine hydrochloride
(TCEP) ndash also referred to as acetic acidTCEP solution bull Folin-Ciocalteau reagent bull 7 (wv) sodium carbonate solution ndash previously prepared bull Orange juice bull Tomato juice bull 26-dichloroindophenol bull Sodium bicarbonate bull Spectrophotometer bull HPLC autosampler vials (for HPLC analysis only) bull Centrifuge bull Cuvets bull 1 microm syringe filters bull Syringes bull 25 mL 50 mL 100 mL and 250 mL volumetric flasks bull 25 mL amber vials bull 5 mL measuring pipets bull 1000-200 μL and 200-10 μL auto pipets (ldquomicro pipetsrdquo)Filter paper bull 3-way safety bulb bull 50 mL buret (for titration method only) bull Magnetic stirrers and stir bars (for titration method only)
Center for Authentic Science Practice in Education Spring 2008 28
Waste Disposal You should have a beaker designated for waste material on your lab bench After you have performed the measurement of Total Polyphenolics all solutions should be disposed of in this beaker All the glassware used in preparing the solutions for polyphenolic measurement should be rinsed with a small amount of water from your wash bottle and poured into the waste beaker The waste beaker can then by emptied into the large waste jar found in the main hood
Procedures Preparation of Ascorbate Standards and Juice Samples (for HPLC or Titration Method)
Record the serving size of the juices as you will need this information for analysis
You will first make 25 mL of a stock solution of 10 mM ascorbate in dilute (5 vv) acetic acid in 035mM TCEP (this is known as the acetic acid buffer) NOTE the balances are not reliable below about 10 mg So if your calculations show that you need to weigh out less than this amount you should consider making a more concentrated solution and diluting to the required 10 mM This ascorbate solution will serve as the stock concentration for either the HPLC method or the titration method Store in the cold and protect from light In our experience the stock is stable under these conditions for about 10 days Note that the standards for either assay method should be prepared at the same time as the test samples (below) All ascorbate solutions prepared with 5 acetic acid035 mM TCEP are stable up to 10 days if refrigerated and protected from light Without TCEP ascorbate solutions are extremely unstable
Ascorbate Measurement by HPLC Note If you are only performing the titration method skip this part
Each group in the laboratory will be responsible for preparing one HPLC standard Your teaching assistant will assign your group a concentration There are five 25 mL standards to be made by diluting the ascorbate stock with the acetic acid buffer to obtain working standards at 25 50 100 150 and 200μM Fill an HPLC vial for each solution you will need to lightly ldquoflickrdquo the top (wide diameter section) of the HPLC vial with your finger (fingernail side) to ensure that there is no air bubble trapped in the narrow tip at the bottom of the HPLC vial Make sure to flick the vial gently so as not to break it Make sure to label your sample with sample name concentration group name section number and date (ask your instructor about sample codes for your class) Calibration standards must be prepared on the day of HPLC analysis A set of professionally prepared ascorbate standards will also be loaded for comparison with the student made standards
UIC Spring 2008 Ascorbate standards will be prepared for you
Center for Authentic Science Practice in Education Spring 2008 29
To make the HPLC test samples (i) Make a 12 dilution tomato juice solution with acetic acid-TCEP and mix
thoroughly (This means 1 part tomato juice and 1 part acetic acid-TCEP solution so that the tomato juice ends up as frac12 of the total volume of the solution) Note ndash in the next step you will be diluting this solution so you need to make sufficient quantity to work with Centrifuge this dilution for five minutes and decant the supernatant
Dilute the supernatant to 15 with acetic acid-TCEP Filter this diluted supernatant with a 1 μm syringe filter to remove fine particles To do this pull the solution into a syringe then put the filter on the tip and push the solutions through the filter into a clean container Throw away the filter and return the syringe after use Fill an HPLC vial with this solution Now make additional dilutions of the filtered supernatant with acetic acid buffer to 12 and 15 making 25 mL of each solution Fill an HPLC vial with each of these two solutions as before You should now have three HPLC vials with diluted samples Make sure they are labeled
(ii) Make a 12 dilution of orange juice with acetic acid-TCEP and mix
thoroughly (calculate the amount of orange juice needed to make all of your dilutions) Centrifuge the mixture for 5 minutes and decant then dilute the supernatant to 15 with acetic acid-TCEP and filter using a vacuum filtration apparatus shown below
Pass the filtrate through a 1 microm syringe filter to remove fine particles Fill an HPLC vial with this filtered solution and label your HPLC vial Make additional dilutions of the filtered solution to 12 and 15 with acetic acid-TCEP to a final volume of 25 mL of each solution Fill HPLC vials with these diluted solutions and label the vials
Figure 10 Vacuum filtration apparatus
Place filter paper in funnel
Rubber tubing out to vacuum or aspirator
Ring stand
Filter flask (not an Erlenmeyer flask)
3-finger clamp
Buumlchner funnel
Center for Authentic Science Practice in Education Spring 2008 30
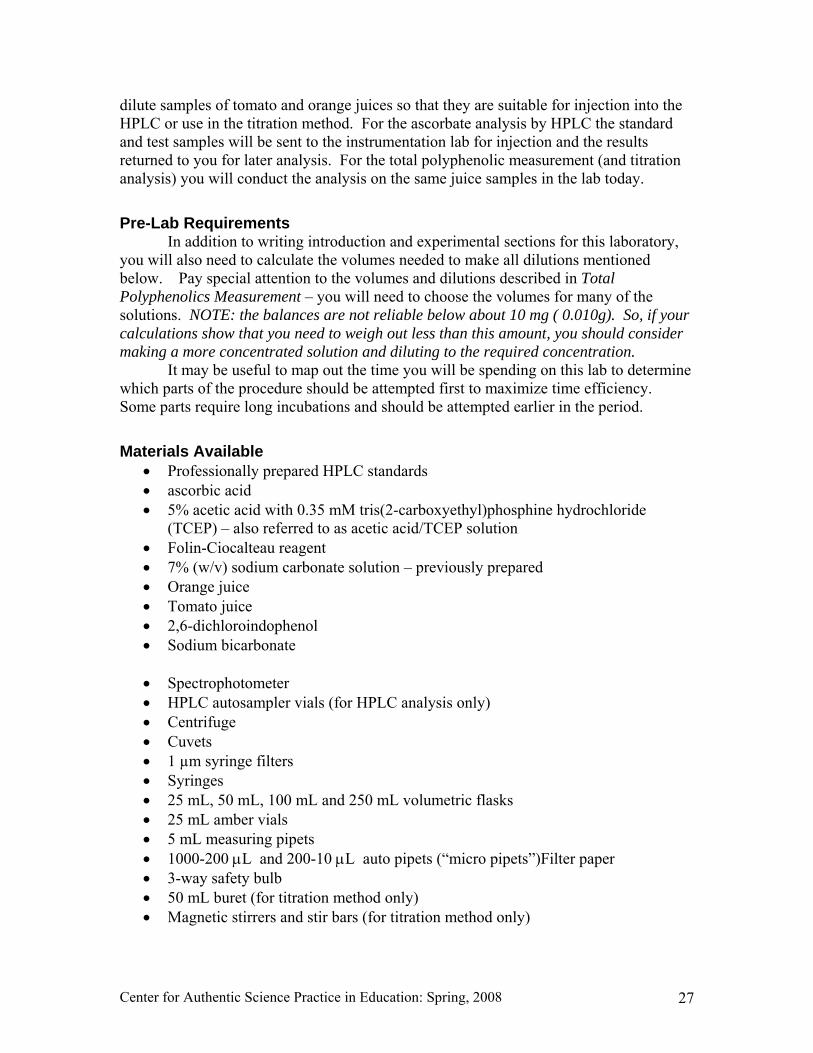
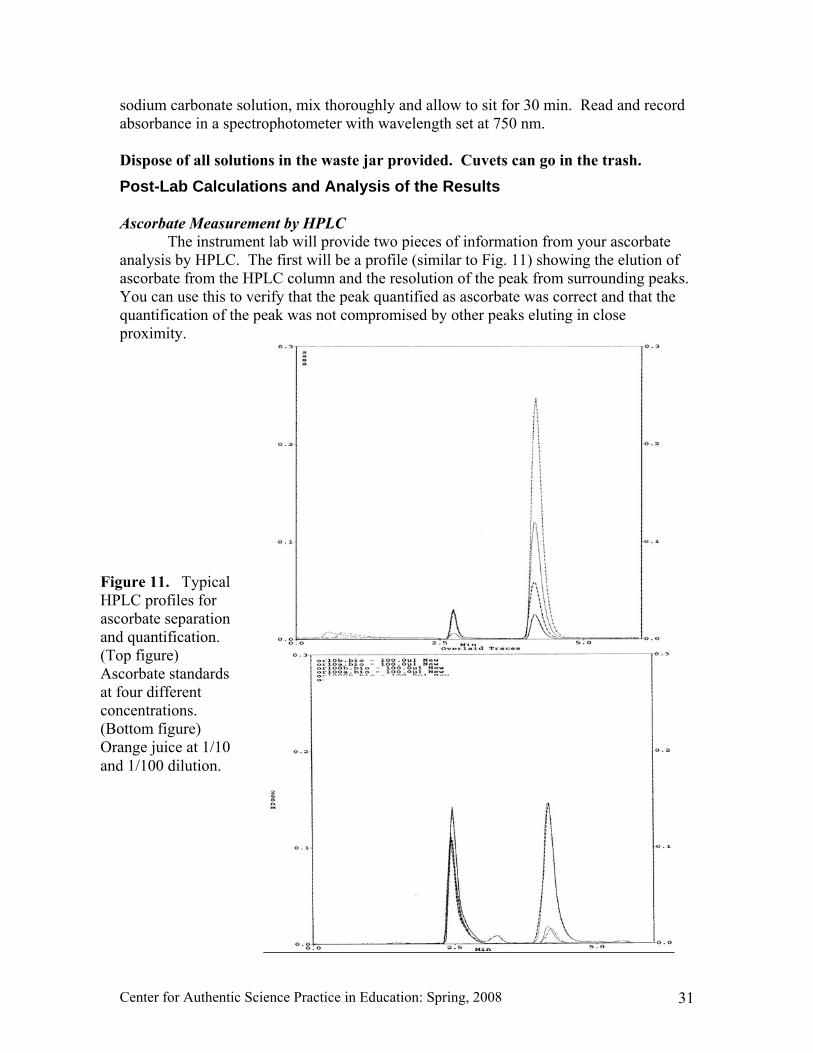
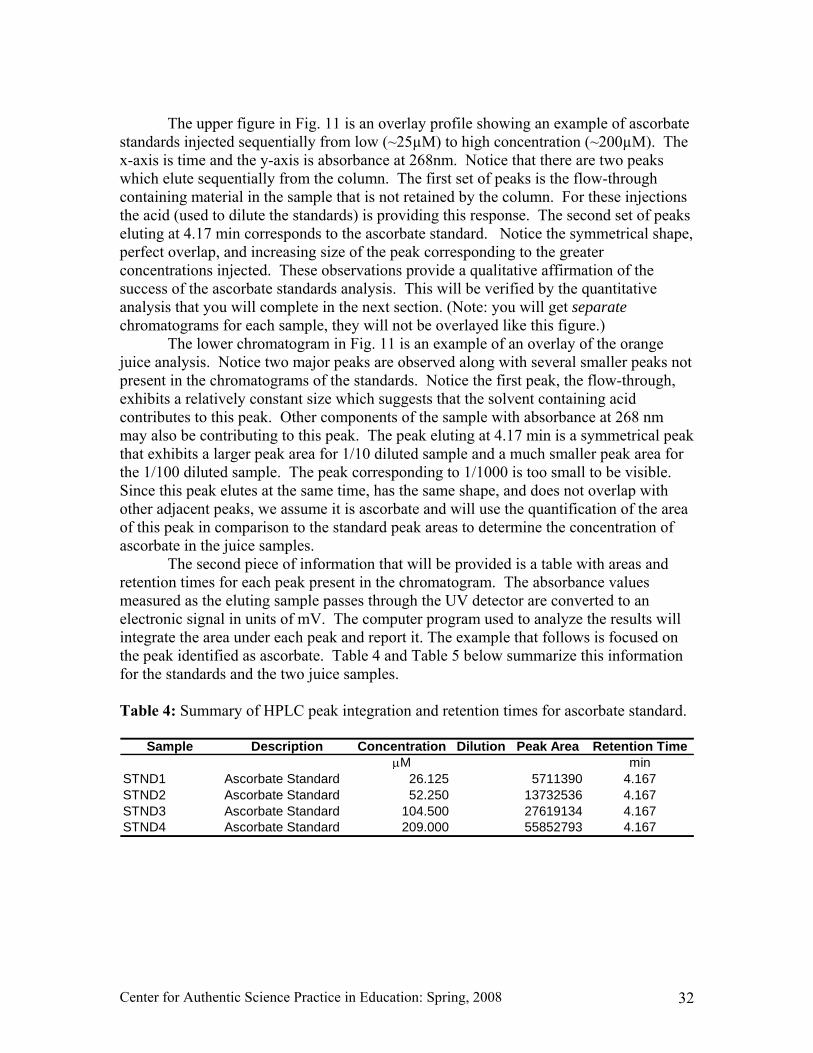
Your HPLC vials will be delivered to the instrument for HPLC analysis The samples will be loaded into an autosampler and sequentially injected onto the HPLC column The output from the column is monitored with a UV or electrochemical detector The signal from this detector is processed with a computer program and provides several pieces of information First a chromatogram which is a graph of the output from the detector over time is printed A chromatogram for each sample will be printed and provided to you Second the computer is programmed to integrate the area of each peak on the chromatogram Using the HPLC protocol described in this module ascorbate separates from other components in the sample and elutes8 as a single peak with a retention time of 41 min Retention time is the elapsed time from injection until the maximum height for a single peak passing through the detector Ascorbate Measurement by Titration with 26-dichloroindophenol Note If you are only performing the HPLC measurements skip this part
Dilute the ascorbate stock in acetic acid buffer to obtain 25 mL of working standards at 500 μM and 10mM The 2 mM stock solution will also be used with this method These three concentrations (500 μM 10mM and 20mM) will make up the calibration curve Prepare three trials of all points to be used in the calibration curve Measure enough juice to make all of your dilutions and centrifuge for at least five minutes Decant the supernatant and dilute each juice sample 12 with acetic acid buffer and mix thoroughly If a precipitate forms remove it by either centrifugation or filtration Make dilutions of the resulting clear supernatant with acetic acid buffer 12 15 and 110 Make a final volume of 25 mL of each solution [Note the indophenols standard will be provided for you by the prep lab] If you were to make the indophenol standard solution yourself you would dissolve 50 mg 26-dichloroindophenol sodium salt in 50 mL water to which has been added 42 mg NaHCO3 Mix thoroughly and when the salt is dissolved dilute to 1000 mL with deionized water Filter and store in an amber bottle The solution breaks down upon exposure to light Avoid prolonged periods of exposure in clear glassware
To carry out the determination place 5 mL of standard ascorbate solution into a 125 mL Erlenmeyer flask containing 5 mL of acetic acid buffer Fill a 50 mL buret with indophenol solution Titrate with indophenol solution to an endpoint of distinct light rose color Record the amount of solution used Repeat for all solutions Total Polyphenolics Measurement Dilute the previously prepared epicatechin stock to achieve three or more standards in the range of 25 to 200 μM in ethanol Dilute the concentrated commercially prepared Folin-Ciocalteau reagent 1 part in 10 with deionized water Always prepare this fresh daily
Procedure Measure all test samples (tomato and orange juices from Part 1) and
standards in duplicate To each tube add 225 μL water (which will serve as the control) or sample or epicatechin standard Then add 15 mL of diluted Folin-Ciocalteau reagent mix thoroughly and let set at room temperature for 7 minutes Add 15 mL of 7 (wv)
8 To elute is to separate or purify by washing out
Center for Authentic Science Practice in Education Spring 2008 31
sodium carbonate solution mix thoroughly and allow to sit for 30 min Read and record absorbance in a spectrophotometer with wavelength set at 750 nm Dispose of all solutions in the waste jar provided Cuvets can go in the trash
Post-Lab Calculations and Analysis of the Results Ascorbate Measurement by HPLC
The instrument lab will provide two pieces of information from your ascorbate analysis by HPLC The first will be a profile (similar to Fig 11) showing the elution of ascorbate from the HPLC column and the resolution of the peak from surrounding peaks You can use this to verify that the peak quantified as ascorbate was correct and that the quantification of the peak was not compromised by other peaks eluting in close proximity
Figure 11 Typical HPLC profiles for ascorbate separation and quantification (Top figure) Ascorbate standards at four different concentrations (Bottom figure) Orange juice at 110 and 1100 dilution
Center for Authentic Science Practice in Education Spring 2008 32
The upper figure in Fig 11 is an overlay profile showing an example of ascorbate
standards injected sequentially from low (~25microM) to high concentration (~200microM) The x-axis is time and the y-axis is absorbance at 268nm Notice that there are two peaks which elute sequentially from the column The first set of peaks is the flow-through containing material in the sample that is not retained by the column For these injections the acid (used to dilute the standards) is providing this response The second set of peaks eluting at 417 min corresponds to the ascorbate standard Notice the symmetrical shape perfect overlap and increasing size of the peak corresponding to the greater concentrations injected These observations provide a qualitative affirmation of the success of the ascorbate standards analysis This will be verified by the quantitative analysis that you will complete in the next section (Note you will get separate chromatograms for each sample they will not be overlayed like this figure)
The lower chromatogram in Fig 11 is an example of an overlay of the orange juice analysis Notice two major peaks are observed along with several smaller peaks not present in the chromatograms of the standards Notice the first peak the flow-through exhibits a relatively constant size which suggests that the solvent containing acid contributes to this peak Other components of the sample with absorbance at 268 nm may also be contributing to this peak The peak eluting at 417 min is a symmetrical peak that exhibits a larger peak area for 110 diluted sample and a much smaller peak area for the 1100 diluted sample The peak corresponding to 11000 is too small to be visible Since this peak elutes at the same time has the same shape and does not overlap with other adjacent peaks we assume it is ascorbate and will use the quantification of the area of this peak in comparison to the standard peak areas to determine the concentration of ascorbate in the juice samples The second piece of information that will be provided is a table with areas and retention times for each peak present in the chromatogram The absorbance values measured as the eluting sample passes through the UV detector are converted to an electronic signal in units of mV The computer program used to analyze the results will integrate the area under each peak and report it The example that follows is focused on the peak identified as ascorbate Table 4 and Table 5 below summarize this information for the standards and the two juice samples Table 4 Summary of HPLC peak integration and retention times for ascorbate standard
Sample Description Concentration Dilution Peak Area Retention TimeμM min
STND1 Ascorbate Standard 26125 5711390 4167STND2 Ascorbate Standard 52250 13732536 4167STND3 Ascorbate Standard 104500 27619134 4167STND4 Ascorbate Standard 209000 55852793 4167
Center for Authentic Science Practice in Education Spring 2008 33
Table 5 Summary of HPLC peak integration and retention times for juice samples
Sample Name Description Dilution Peak Area Retention Time1x min
AP10A Apple Juice 10 51632744 4167AP10B Apple Juice 10 53506976 4167AP100A Apple Juice 100 6339594 4167AP100B Apple Juice 100 5954836 4167AP1000A Apple Juice 1000 598612 4167AP1000B Apple Juice 1000 540179 4167
OR10A Orange Juice 10 35111848 4167OR10B Orange Juice 10 34649980 4167OR100A Orange Juice 100 3890611 41330R100B Orange Juice 100 3750404 4200OR1000A Orange Juice 1000 359440 4133OR1000B Orange Juice 1000 272837 4167 Use the graph function in Excel to evaluate the fit for the standard curve The example that follows illustrates a very good fit of the data to a linear regression
You can use the trend function in Excel to calculate the concentration of each
unknown sample Choose the dilutions of juice which fall into the range of the standard curve Once this is complete calculate the concentration of ascorbate in the juice by multiplying the concentration of each sample injected by the dilution factor
Table 5 does not include the 12 initial dilution of the juice samples and this should be accounted for in the calculation Thus for sample OR10A the calculation is
[Ascorbate in OJ] = (132μM) 20 volume juice dilutions1 volume juice
= 2640μM
The first value 132 μM comes from the graph in Fig 12 and its linear regression The concentration value corresponding to peak area for sample OR10A in Table 5 is 132 μM
Standard Curve for Ascorbate
y = 272324x - 950284R2 = 09997
000E+00
100E+07
200E+07
300E+07
400E+07
500E+07
600E+07
00 500 1000 1500 2000 2500
Concentration
Peak
Are
a
Figure 12 Ascorbate standard curve
Center for Authentic Science Practice in Education Spring 2008 34
The number 20 results because the OR10A sample is a 110th dilution and there was a 12 dilution in the procedure for the juice samples such that 12 x 110 = 120
Converting this concentration to a number that can be compared to the information given on the juice nutrition information label can be done as follows
Ascorbate FW = 17613 gbullmol-1 0240 L = 1 cup
ascorbate 6111or
11160ascorbate 1
ascorbate 131761
240juice 1
ascorbate 002640
cupmg
cupgmol
gcup
LLmol
=timestimes
The standard for food labels for vitamin C is 60 mg per serving The label on a
typical orange juice container indicates that the amount per cup is 120 of the RDA What do the data indicate about the amount of vitamin C in your juice sample Discuss explanations for any possible discrepancies you find
Which HPLC dilutions of juices produced usable results If you were to take another measurement what concentration should it be If you decide to use the HPLC method in your research (Part 4 of this module) it would be useful for you to know what dilutions produce usable results Furthermore some foods have more vitamin C than others so in the context of your research project you will want to think about the relative amount of vitamin C your food product has before deciding on dilution factors
Ascorbate Concentration Measurement by Titration Construct a standard curve for ascorbate plotting concentration versus volume of indophenol titration solution Determine the concentration for samples using the best fit straight line for the standards as described above Note that this method is much less sensitive than the HPLC method Total Polyphenolics
Construct a standard curve for epicatechin plotting concentration versus absorbance at 750 nm similar to the graph in Figure 11 Determine the concentration for samples using the best fit straight line for the standards in a similar way as for ascorbate described in the previous section How do these two juice samples compare in terms of the quantity of total phenolics Does this result differ from the ascorbate results
Post-Lab Questions and Analysis of Results a What is the purpose of using 5 acetic acid as a solvent for the ascorbate solution Why is it also needed as a solvent for the orange and apple juices b Did the dilutions used in this period produce usable results If not what changes can you make in the future to your dilutions to produce results that will be more valuable
Preparation for Next Week a There is substantial reading for the next period so give yourself ample time b Prepare your own unique experimental design based on the techniques you have learned Be prepared to dicuss your design and procedures
Center for Authentic Science Practice in Education Spring 2008 35
Laboratory 4 - 6 Original Research Project
Introduction In this laboratory period you will go through the process of hypothesis testing in
antioxidant research using an example of citrus fruits which are rich in vitamin C Science is the process by which we try to understand nature by continually testing our theories and refining explanations based on observation The scientific method is the means by which we try to make this process reliable and consistent Generally there are several key components observation and description of phenomena formulation of a hypothesis to explain the phenomena performance of experiments to test the hypothesis rejection or modification of a hypothesis inconsistent with experimental results and application of a validated hypothesis to explain new observations Observations can include descriptions but also quantifiable data which are useful because comparisons can be made and trends observed A hypothesis which explains observations must be testable and constructed to address one factor at a time Testable means that the hypothesis statement is written in a way that one can determine it to be incorrect by experimentation Experiments are procedures carried out generally involving an independent variable that is purposefully manipulated and a dependent variable that is observed or measured Good experimental design attempts to minimize the effect of bias on the results Several factors must be considered to be successful here These include a representative sample accuracy precision and reproducibility A representative sample is one that truly reflects and encompasses the independent and dependent variables Accuracy is how close a measured value is to the ldquotruerdquo or ldquorealrdquo value Precision is the spread in the data of repeated measurements or trials Reproducibility indicates that the results of an experiment are the same when repeated again at a later time or by another individual or research group This lab will apply the scientific method to a question about which chemical species is responsible for the total antioxidant activity that can be measured in one particular vitamin C-rich food
Pre-Lab Requirements You will need to prepare your own unique experimental design and procedure to share with your group during lab In addition look up any pertinent information about the products you are interested in studying to see if some tests would be more telling than others and design your experiment accordingly Plan ahead for the mixing of your ABTS+ as it will need to be made at least 12 hours but not more than 10 days before your next lab period
Finally think about the products you will be using with respect to the appropriate dilution factors What did you learn about dilutions from previous experiments that could be useful in determining where to start Are there dilutions that are too dilute or too concentrated when trying to use the line of concentration versus signal from your standards It may take more than one try to get the dilutions right
Overview of this Research Activity We have described many observations concerning oxidative stress its role in
health and protection by antioxidants in this module Also we have introduced various
Center for Authentic Science Practice in Education Spring 2008 36
types of antioxidants in foods and you have learned how to measure the total amount of antioxidant activity as well as the concentration of ascorbate a key nutrient antioxidant commonly found in foods Based on these observations we can formulate a hypothesis concerning total antioxidant activity in ascorbate-rich foods A testable hypothesis could be stated as follows ldquofruit samples stored at room temperature for a week will exhibit a 50 greater loss in antioxidant activity compared to similar samples stored at 4degCrdquo The techniques that you have learned so far TEAC HPLC or ascorbate titration and polyphenolics measurements can be used to assess this hypothesis The TEAC assay assesses total antioxidant activity HPLC the ascorbate titration and the polyphenolics measurements are more specific in their assessments Each of these methods can have a place in examining this hypothesis TEAC can evaluate changes in total antioxidant capacity while HPLC the ascorbate titration and the polyphenolics measurement can assess changes in specific flavonoid classes To isolate a specific variable it is important that as many other factors as possible be kept constant between the samples For this reason this experiment will require that the samples are drawn from the same batches of solution kept in the same kinds of vials either with or without parafilm (but the same for both conditions) and with the same amount of contact with sunlight and motion An example experimental design is as follows
bull Make solutions to be tested bull Measure antioxidant activity of the samples using TEAC and HPLC bull Fill two sets of identical amber vials one for room temperature one for 4degC bull Put parafilm on the vials bull Store the room temperature vials in a drawer to minimize contact with sunlight
and risk of being knocked over store 4degC vials in the refrigerator taking precautions if there is direct sunlight
bull Note the time bull 7 days later return and remove the samples at approximately the same time from
their conditions opening them in the same way bull Measure antioxidant activity of the samples using TEAC and HPLC bull Compare antioxidant activities and changes in antioxidant activity
What is Currently Known and Unknown About Antioxidants in Foods
A search of the peer-reviewed literature reveals many papers published that measure some indicator of total antioxidant activity in food and biological samples Because our focus is on health benefits I will use the example of PubMed the main government-financed database used by researchers in the health field to survey the literature If one does a search on PubMed using the search terms that describe total antioxidant activity (TEAC ORAC amp TRAP) 275 references are obtained (See Appendix B for tips and information about reading scientific research articles ndash itrsquos not as hard as it looks) When these terms are combined with the term ldquofoodrdquo 106 references are found Many of these papers report on total antioxidant activity of commonly consumed fruits and vegetables teas spices various grains food additives wine and chocolate Also some papers report analysis of uncommon plant parts which may have a basis in traditional medicine A few papers (not many) have been published testing the effects of processing storage or digestion of fruits and vegetables on antioxidant activity A few studies have explored the effects that mixing high antioxidant and high protein
Center for Authentic Science Practice in Education Spring 2008 37
foods has on total antioxidant activity Very few published reports have tested whether antioxidant-rich foods exhibit synergy whether more highly palatable foods containing fruits or vegetables exhibit antioxidant activity whether treatments that simulate the digestive process diminish antioxidant activity or whether common cooking methods (grilling boiling sauteacuteing in butter baking deep frying etc) significantly decrease antioxidant activity
Any of these questions is a valid research question to test for this module because there is not a lot of information available yet on them so you would be doing work that could contribute to the known research in this topic HOWEVER Dr Burgess is currently working on the antioxidants in green teas and in green tea drinks that are mixed with a juice that contains ascorbate (such as lemon juice) that can be found in many supermarkets and convenience stores He is particularly interested in what effects digestion (ie processing through the human digestive tract) has on the antioxidant capacity of these teas and whether the juice makes a difference in this process You can focus your efforts on this topic for now (See Appendix A for an in-lab procedure that simulates digestion)
Design and Conduct a Research Project on Antioxidants in Food Your goal is to design an experimental procedure that actually will test a
hypothesis Review the introduction to this laboratory to remind yourself about the use of controls and about reproducibility Also think about what you plan to test and what each of the techniques you learned in weeks 1-3 actually measures Do you need to use all of them for the hypothesis you want to test If not which one or which ones will you use and why
Once a research question has been agreed upon design an experimental protocol and discuss this as a group Think about the steps you will be taking and what you will do with your samples Consider and plan for the procedures timing etc that will be necessary for you to conduct a valid research study Consult with your peer leader andor TA about the research question that your group would like to address Review the recent peer-reviewed literature to help you refine your research questionhypothesis Refine your hypothesis or procedures if necessary ndash it is OK to do this when you do research
Write up the experimental procedures and a list of supplies Keep in mind that
your supplies will be limited to those that you have already used in laboratory periods 1-3 Some additional items can be provided as long as you include them in your list of supplies These additional items include blender hot plate cutting board The food items will be limited to those provided by your instructor (ask your instructor for a list) It may be possible for you to carry out research on food items that you provide You must check with your instructor to see if this will be allowed
For Laboratory Period 4 You should come to lab with an experimental procedure already in mind In lab you will meet and discuss this with your group and with your TA to finalize a procedure that you will work on for the next 3 lab periods
Center for Authentic Science Practice in Education Spring 2008 38
Your Contribution to the Research of Dr Burgess This portion of the module will culminate with data that you can give to the researcher thus contributing your work to the body of research Keep in mind that Dr Burgess would like to be able to use your data for publication Therefore you should conduct and report your experimental procedures and results carefully For this module you will provide data that includes the following things
bull Your hypothesis for your research bull Detailed protocol of your experimental design for testing your hypothesis
including the specific food products researched and the conditions to which they were subjected
bull List of tests performed and procedures carried out bull Results of the tests such as numerical values and copies of your spectra
You will be provided with detailed instructions on how to enter your data into a web-based form that will be sent to Dr Burgess in electronic form Be sure to label your data (and all your samples) sufficiently (your group name or number will not mean much to the researcher so include information about what you studied and when the study was performed and what the data or sample is)
Most of all have fun
Center for Authentic Science Practice in Education Spring 2008 39
Appendix A Procedure to Simulate Digestion
Example of a Test Question will green tea with lemon preserve antioxidant activity of tea through simulated digestive process Ingredients Lemon Juice Freshly brewed green tea ndash two 250 mL cups Sample Preparation
a green tea as prepared (brewed) b green tea with 2 Tbsp (or around 5-6 mL) of lemon juice per cup c water with 2 Tbsp (or around 5-6 mL) of lemon juice (as a control)
Reserve 25mL in an amber bottle for TEAC and polyphenolics Samples must be tested for ascorbate immediately Each preparation must be filtered through 1μm filter diluted and put into HPLC vials
Set aside another 10mL of each treatment for BurgessFerruzzi test follow-up Label these as pre-digested or undigested samples and store in freezer Labeled boxes will be available for students to put their samples in In vitro digestion protocol (Note If tea is freshly brewed it must be cooled to room temperature to measure the pH You can cool by putting in an ice bath and monitoring the temperature as it drops)
1 30 mL of each test mixture to be tested should be transferred to an 125mL Erlenmeyer flask Wrap the flask with a single layer of aluminum foil to protect the solution from light (Consider whether you will have time for duplicates Will this help with the reproducibility of your experiment)
2 check the pH of your mixture and if it is above 25 adjust the pH to 25 by the dropwise addition of 10 M HCL
3 add 20 mL of porcine pepsin mixture (40 mgmL in 01 M HCl supplied) 4 flush the flask with nitrogen and stopper 5 transfer mixture to shaking water bath at 37oC and incubate for 15 min at 95 rpm 6 next raise the pH of mixture to 50 by the addition of 20-25 mL of 09 M sodium
bicarbonate 7 add 9 mL pancreatin enzyme mix (20 mgmL in 01 M sodium bicarbonate
supplied) and mix 8 increase pH of mixture to 65 by the addition of 1M sodium hydroxide dropwise 9 flush with nitrogen and stopper tightly 10 incubate at 37oC with shaking for 45 min 11 filter the mixture using a Buchner funnel and P5 filter paper 12 Transfer two 20 mL aliquots of the filtrate to new tubes labeled (post digestion)
Burgess lab for potential follow-up catechin quantification Transfer the remaining filtrate to a clean tube for analysis the following week Store all of these samples in the freezer
After Digestion TEAC and polyphenolic assay should be performed on each sample Compare Results of TEAC after simulated digestion versus before to determine potential impact of lemon on green tea antioxidant Dilution factor will need to be considered in beforeafter comparison
Center for Authentic Science Practice in Education Spring 2008 40
Appendix B Reading and Interpreting a Research Paper A Paper about Processing Effects on Antioxidants in Food Sources
Consider the paper cited below (published in 2005) testing the effects of fermentation and heat treatment on the antioxidant activity of cowpea flours The purpose of reviewing this paper is not to get bogged down in the details but to review the key characteristics of a study design Hopefully this will help you to develop your research question and design your own study using the tools and skills you have learned so far in this module Doblado R H Zielinski et al (2005) Effect of processing on the antioxidant vitamins and antioxidant capacity of Vigna sinensis Var Carilla J Agric Food Chem 53(4) 1215-22 Cowpea (Vigna sinensis L var Carilla) flours were obtained by fermentation with inoculum Lactobacillus plantarum (PF) or with the natural microorganisms present in the flour (NF) and subsequently heat treated in an autoclave The flours were prepared to study the effect of fermentation on the antioxidant vitamin content and on the antioxidant capacity Bacterial counts and pH values vitamins C and E carotenoids glutathione (GSH) superoxide dismutase-like activity (SOD-like activity) peroxyl radical-trapping capacity (PRTC) lipid peroxidation in unilamillar liposomes and Trolox equivalent antioxidant capacity (TEAC) were evaluated in raw and processed cowpea flours Gamma-Tocopherol and delta-tocopherol were found in raw cowpea whereas vitamin C and carotenoids were not detected An increase in the vitamin E activity was observed in PF whereas vitamin C and carotenoids were not detected in fermented cowpea flours Fermentation or heat treatment in an autoclave after fermentation produced processed cowpea flours with lower PRTC glutathione content and SOD-like activity than those of the raw seeds However those processes increased the capacity to inhibit the lipid peroxidation in unilamellar liposomes and TEAC According to the results obtained in this study the fermentation of cowpeas (naturally or with L plantarum) and fermentation and subsequent heat treatment in an autoclave are good processes to obtain functional cowpea flours having higher antioxidant capacity than the raw legume What is the main question addressed in this paper Answer What is the effect of fermentation and subsequent heat treatment on the antioxidant activity present in a bean flower (cowpea) Why is this important Answer
bull Antioxidant capacity is an aspect of food that may provide health benefits bull Cowpea a staple of many cultures especially those in the developing world bull Fermentation is believed to improve nutritional quality of processed legume food
products and several examples (soy sauce tempeh miso natto etc) are now being consumed more commonly in the West
bull Heat treatment after fermentation is used to reduce antinutritional factors derived from this legume
Center for Authentic Science Practice in Education Spring 2008 41
bull Cowpea is a type of legume which possesses many nutritional and health promoting properties but its antioxidant activity has not been characterized
What was the hypothesis that the authors tested Answer The authors did not clearly state a hypothesis but based on the extensive introductory material one could write a hypothesis statement for this research Wersquoll call this an implied hypothesis Fermentation will improve the antioxidant capacity of cow pea flour How was the research question addressed Answer
bull Measurements were taken of the sample of interest before the treatment bull Each step in the process of preparing the final product was analyzed ie raw
seeds flour fermentation (two alternatives were tested) and heat treatment by autoclaving
bull Enough replications (trials) were conducted to do statistical analysis bull Multiple tests were conducted to improve confidence in the results These
included o Measurement of the concentration of four-six different antioxidants in each
sample o Using three different methods to estimate total antioxidant capacity
bull Careful attention was paid to the completeness of the methods used An example of this is table 5 in which the authors carefully extracted the sample with multiple solvents starting by using a very hydrophilic solvent and ending with a very hydrophobic solvent Each extract was then tested for antioxidant capacity
What was the interpretation of the results Answer Fermentation of cow pea flours increased antioxidant capacity as indicated by two of the methods used but decreased this capacity as measured by a third The effect of heat treatment by autoclaving the fermented products resulted in variable effects (increase or decrease) depending on the method of measurement Both fermentation and heat treatment decreased the concentration of the known antioxidant nutrients (tocopherols and glutathione) in the cow pea flour The implication here is that other non-quantified components in the cow peas is responsible for the antioxidant activity and that some of these compounds actually increase in concentration due to fermentation and possibly heat treatment The authors of the paper discuss this idea and refer to other published work that implicates certain flavonoid species The authors conclude ldquoAccording to the results obtained in this study the fermentation of cowpeas (naturally or with L plantarum) and fermentation and subsequent heat treatment in an autoclave are good processes to obtain functional cowpea flours having higher antioxidant capacity than the raw legumerdquo
Center for Authentic Science Practice in Education Spring 2008 42
Appendix C Preparation Techniques for Different Foods
Methods for Extraction of Food Using Homogenization Precipitation and Extraction to Obtain Experimental Samples for Study Obtaining a representative sample is key to conducting a valid experiment to test a hypothesis Many food samples are quite complex mixtures of material possessing both characteristics of solutions and colloids It can be quite difficult to obtain a representative sample from a whole food Below are listed several sample preparation protocols that can help guide you in obtaining adequate representative samples for your research project The emphasis is on obtaining samples with good recovery of the more water-soluble antioxidant compounds including most of the flavonoids Although the TEAC assay has been tested on fat-soluble antioxidants its use for testing these compounds is much less common Some sample protocols follow General Supplies
bull Knife bull Cutting board bull Cheesecloth bull Syringe and syringe filters bull 5 acetic acid with 035 mM TCEP bull Ethanol 100 bull Filter paper bull Hot plates bull 5 stoppers bull Aluminum foil bull Shakeroven bull pH meter bull Nitrogen gas source
Spices and Herbs
Weigh a little more than 10g of sample and grind (even if using pre-ground) in mortar with pestle Carefully weigh 10g and dissolve in 100mL of appropriate solvent If you are unsure whether yoursquore isolating a water soluble or insoluble antioxidant or both divide the sample and dissolve 5g in 50mL of buffer and the other 5g in 50mL of ethanol Stir sample mixture with magnetic stirrer for 30-60 minutes After stirring centrifuge the sample for fifteen minutes Decant and perform syringe filtration on the supernatant Make dilutions for testing multiple dilutions over a large range will maximize the possibility that one of the dilutions will fall in the range of the standard curve Dried Frozen and Canned Fruits
Drain the fruit with cheesecloth if needed Weigh a little more than 10g of sample and cut it into small pieces as necessary Carefully weigh 10g and dissolve in 100mL of appropriate solvent If you are unsure whether youre isolating a water soluble
Center for Authentic Science Practice in Education Spring 2008 43
or insoluble antioxidant or both divide the sample and dissolve 5g in 50mL of buffer and the other 5g in 50mL of ethanol Blend in blender for 30-60 seconds Stir sample mixture with magnetic stirrer for 30-60 minutes After stirring centrifuge the sample for fifteen minutes Decant and vacuum filter supernatant Perform syringe filtration on the filtrant Make dilutions for testing multiple dilutions over a large range will maximize the possibility that one of the dilutions will fall in the range of the standard curve
Dry Solid Sample Preparation
Pulverize ~10g of sample using a mortar and pestle
If isolating water soluble antioxidantsDissolve 10g in 100 mL of acetic acid buffer
Stir with magnetic stir rod 30-60 min or until dissolve(whichever comes first)
If isolating water insoluble antioxidantsDissolve 10g in 100 mL of 100 ethanol
Stir with magnetic stir rod 30-60 min or until dissolved(whichever comes first)
Centrifuge for 15 minutes
Decant supernatant into beaker
For HPLC onlyPerform syringe filtration on supernantant
Dilute in acetic acid buffer or ethanolPerform appropriate tests
Remember to run standards for comparison
Dietary Supplements Dried Herbs and Spices
Center for Authentic Science Practice in Education Spring 2008 44
High Moisture Food Sample Preparation
Weigh 10g of sample
If isolating water soluble antioxidantsBlend sample with 110 ww acetic acid buffer
Blend for 30-60 seconds
If isolating water insoluble antioxidantsBlend sample with 110 ww 100 ethanol
Blend for 30-60 seconds
Stir sample with magnetic stir rod 30-60min
Decant and filter supernatant using vacuum filtration
Dilute filtrate with either acetic acid buffer or ethanolPerform appropriate tests
Remember to run standards for comparison
For HPLC onlyPerform syringe filtration on filtrant
Centrifuge sample for 15 minutes
Cut into small pieces as necessary
Drain food in cheesecloth if necessary
Fresh Frozen or Canned Fruits and Vegetables
Center for Authentic Science Practice in Education Spring 2008 45
Liquid Food Sample Preparation
If isolating water soluble antioxidantsDilute 11 with acetic acid buffer
Mix well
If isolating water insoluble antioxidantsDilute 11 with 100 ethanol
Mix well
If juice has large particulate matterCentrifuge 5 minutes decant
Centrifuge supernatant 15 min if not clear
If juice has small particulate matterCentrifuge 15 minutes
For HPLC onlyDecant perform vacuum filtrationPerform syringe filtration on fitrate
Dilute supernatant in acetic acid buffer or ethanolPerform appropriate tests
Remember to run standards for comparison
Juice and Tea
Center for Authentic Science Practice in Education Spring 2008 46
Acknowledgements The author would like to extend appreciation to S Messenger and J Andrade for conducting experiments and procedures to test the methods included in this module and for extensive help in preparing the initial drafts Sincere appreciation is extended to C Russell and G Weaver for extensive intellectual input into the design and construction of this module and for thorough editing of the document The author is also grateful to A Bentley and W Fornes for editing the document and providing additional information Bibliography Doblado R H Zielinski et al (2005) Effect of processing on the antioxidant vitamins and antioxidant capacity of Vigna sinensis Var Carilla J Agric Food Chem 53(4) 1215-22 Lykkesfeldt J Loft S Poulsen HE (1995) Anal Biochem Aug 10229(2)329-35 Re R N Pellegrini et al (1999) Antioxidant activity applying an improved ABTS radical cation decolorization assay Free Radic Biol Med 26(9-10) 1231-7 Silberberg (2003) Chemistry The molecular nature of matter and change 3rd Edition Wang H G Cao et al (1996) Total Antioxidant Capacity of Fruits J Agric Food Chem 44(3) 701 -705
Table of Contents Introduction 1 Essential Nutrients in Food 2 Chronic Disease and Oxidative Damage 2 How Antioxidants Prevent Oxidative Damage3 Phytochemicals as antioxidants5 Measurement of Antioxidant Activity7 What we donrsquot know and what you are going to do in this module 8 Module Calendar 9 Laboratory 1 Making Solutions and Spectral Scanning of the Trolox Equivalent Antioxidant Capacity (TEAC) Substrate10 Overview of this Laboratory Activity 10 Introduction to TEAC Assay Spectrophotometric Measurement of ABTS˙+ (the ABTS Radical Cation) 13 Pre-Lab Requirements15 Materials Available 15 Waste Disposal15 Laboratory Procedures 16 Post-Lab Calculations and Analysis of the results 18 Preparation for Next Week18 Laboratory 2 TEAC Activity of Epicatechin Quercetin and Trolox 19 Overview of This Activity19 Introduction 19 Pre-Lab Requirements20 Materials Available 20 Waste Disposal20 Laboratory Procedures 21 Post-Lab Calculations and Analysis of Results 21 Preparation for Next Week23 Laboratory Period 3 Determination of Ascorbate (Vitamin C) Concentration and Total Phenolics in Common Foods24 Introduction 24 A Primer on High Pressure Liquid Chromatography (HPLC) 25 Determination of Ascorbate Concentration by Titration 26 Measurement of the Total Polyphenolic Content of Foods 26 Overview of This Activity26 Pre-Lab Requirements27 Waste Disposal28 Procedures 28 Preparation of Ascorbate Standards and Juice Samples (for HPLC or Titration Method) 28 Post-Lab Calculations and Analysis of the Results 31 Post-Lab Questions and Analysis of Results34 Preparation for Next Week34 Laboratory 4 - 6 Original Research Project 35 Introduction 35 Pre-Lab Requirements35 Overview of this Research Activity 35 What is Currently Known and Unknown About Antioxidants in Foods 36 Design and Conduct a Research Project on Antioxidants in Food 37 Your Contribution to the Research of Dr Burgess38 Appendix A Procedure to Simulate Digestion 39 Appendix B Reading and Interpreting a Research Paper 40 Acknowledgements 46 Bibliography46
Phytochemical Antioxidants with Potential Health Benefits in Foods University of Illinois at Chicago Spring 2008
Week
(Semester Module)
Dates Lab work Module pages (read before lab)
Material collected for grading
PLTL
8 0 33-37 Distribution of materials None None Introduction to CASPiE module Keeping a lab notebook
9 1 310 ndash 314
Introductory Lab ndash Introduction to the module making solutions and spectral scanning of the Trolox Equivalent Antioxidant Capacity (TEAC) substrate
1-19 Week 1 lab work Evaluation and interpretation of data
10 2 317ndash 321
TEAC Measurement ndash Conduct the TEAC measurement with Trolox and the flavonoids epicatechin and quercetin and explore the equilibrium of the reaction
21-26 Week 1 post lab Week 2 lab work
Scientific literature
324ndash228 Spring Break 11 3 331ndash 44 Ascorbate and Total Phenolic Measurement
- Introduction to HPLC and the use of a standard curve to determine ascorbate and total phenolics concentrations in foods
27-39 Week 2 post lab Week 3 lab work
Experimental design
12 4 47ndash 411 Independent Research Project - Conduct experiments to test the chosen hypothesis and complete analysis ndash repeat tests as necessary
40-43 (also Appendix A)
Week 3 post lab Week 4 lab work
Ethical conduct in science
13 5 414ndash 418
Independent Research Project - Conduct experiments to test the chosen hypothesis and complete analysis ndash repeat tests as necessary
40-43 (also Appendix A)
Week 4 post lab Week 5 lab work
Poster preparation
14 6 421ndash 425
Independent Research Project - Conduct experiments to test the chosen hypothesis and complete analysis ndash repeat tests as necessary
40-43 (also Appendix A)
Week 5 post lab Week 6 lab work
15 7 428ndash 52 Presentations Week 6 post lab
About the Author Dr Jay Burgess is an Associate Professor in the Department of Foods and Nutrition at Purdue University His research focuses primarily on oxidative stress in mammals and the physiological results of such an accumulation of reactive oxygen species The Burgess lab has studied the role of reactive species in the pathophysiology of attention-deficithyperactivity disorder (ADHD) and has shown that some children with ADHD exhibit certain biochemical abnormalities indicative of cellular oxidative stress They have also shown in an animal model for ADHD that supplementing with antioxidants can reverse the abnormalities and improve behavior Another project the Burgess lab has been working on involves flavonoid antioxidants They have determined that such antioxidants can be helpful in reducing oxidative stress but are not sufficient to compensate for a deficiency of essential antioxidant nutrients like vitamin E From this module Dr Burgess would like to gain a greater amount of knowledge of the antioxidant activity from different food products currently on the market He is particularly interested at this time in the antioxidant characteristics of green tea and green tea mixtures with fruit juices and what happens to these during digestion Recent Publications Andrade J E and J R Burgess (2007) Effect of the citrus flavanone naringenin on oxidative stress in rats J Agric Food Chem 55(6) 2142-8 Nanua S S M Zick J E Andrade U S Sajjan J R Burgess N W Lukacs and M B Hershenson (2006) Quercetin blocks airway epithelial cell chemokine expression Am J Respir Cell Mol Biol 35(5) 602-10 Guo Q B T Richert J R Burgess D M Webel D E Orr M Blair G E Fitzner D D Hall A L Grant and D E Gerrard (2006) Effects of dietary vitamin E and fat supplementation on pork quality J Anim Sci 84(11) 3089-99 Cabo R J R Burgess and P Navas (2006) Adaptations to oxidative stress induced by vitamin E deficiency in rat liver J Bioenerg Biomembr 38(5-6) 309-17 Antalis C J L J Stevens M Campbell R Pazdro K Ericson and J R Burgess (2006) Omega-3 fatty acid status in attention-deficithyperactivity disorder Prostaglandins Leukot Essent Fatty Acids 75(4-5) 299-308
Center for Authentic Science Practice in Education Spring 2008 1
Figure 1 Label of Brocco Sprouts
Introduction
We are constantly being told to eat fruits and vegetables and that these types of plant foods contain chemicals that are good for us Now the message is that we need to eat up to nine servings a day of fruits and vegetables because this will help prevent people from getting cancer heart disease and other disorders that might afflict us as we age You may have many questions about these recommendations Why do people have to eat so many fruits and vegetables to obtain these health benefits What are the chemical components in fruits and vegetables that provide the proposed health benefits It is common practice to use vitamin and mineral supplements to replace the need to consume so many fruits and vegetables Are vitamins and minerals alone necessary to achieve the health benefits fruits and vegetables give us Is this a misconception or has our understanding changed in recent years You will explore the science that addresses some of these questions over the next six weeks The picture to the right illustrates an example of a vegetable source that is available in many of your local supermarkets Note that under the name of the product contents is the description ldquowith long lasting antioxidant activityrdquo Many would associate antioxidant activity with something good but what does this really mean As a consumer looking at this package you might wonder what would this so-called long lasting antioxidant activity do for you Is it this characteristic of the sprouts that make them good for your health Are these sprouts really better for you than the less expensive sprouts you can buy in the adjacent bin The more detailed information on the back of the package identifies a specific compound sulfurophane GS as something in these sprouts that provides ldquolong lasting antioxidant and cellular functionrdquo The sulfurophane GS is not an essential nutrient such as vitamin C which is also found in these sprouts This chemical substance is one of a multitude of substances in plants (called phytochemicals) that are thought to explain an observed association between high fruit and vegetable consumption and lower incidence of killer diseases such as cancer and heart disease Antioxidant activity is hypothesized to be one mechanism by which these chemical substances might exert this protective effect This characteristic is cited because many of these chemical substances show potent antioxidant activity in the test tube Despite these observations many questions remain concerning which chemical antioxidants in fruits and vegetables really contribute to a lower risk for chronic diseases and how the substances from multiple food sources interact with one another in a mixed food diet to provide such benefit
Center for Authentic Science Practice in Education Spring 2008 2
This introductory section describes the background information on food nutrients and antioxidants and their relationship to health A second section will describe phytochemicals and indicate the chemical characteristics that make them good antioxidants The final section will provide an overview of techniques you will use in this module and how these assessments are used to evaluate the potential health benefits of phytochemicals as antioxidants
Essential Nutrients in Food Food provides chemical substances that are required by heterotrophs1 to allow for growth reproduction and the overall maintenance of health By the first part of the twentieth century the chemical constituents in food that supported these outcomes for humans were identified and classified into groups water carbohydrates lipids proteins vitamins and minerals It was observed during this time that if one did not consume sufficient amounts of these essential nutrients that specific deficiency disorders would develop A good example is the disease scurvy which occurs as a result of insufficient consumption of vitamin C This scientific discovery process was carried out by chemists biochemists physiologists and nutritionists and eventually led to government-supported recommendations for the minimum amount of these nutrients that healthy people should consume to prevent the development of deficiency diseases Today most disorders resulting from nutritional deficiencies are uncommon in developed countries but still often occur in the developing world
You probably recognize the acronym RDA which stands for Recommended Dietary Allowance The RDAs define specific amounts for each nutrient which must be consumed to prevent deficiency in healthy people The US Dietary Guidelines2 and the Food Guide Pyramid3 are more practical tools that consumers can use to select combinations of foods to create diets that provide the RDA for all of the nutrients In recent years it has become apparent to many scientists who study human health that in addition to providing nutrients that prevent deficiency diseases consumption of certain foods appears to be associated with a lower occurrence of diseases that occur more frequently as we age These chronic diseases which generally require decades to develop include heart disease cancer diabetes hypertension and Alzheimerrsquos disease and are among the leading causes of death in the US population Fruits and vegetables are the types of foods that are most often cited as helping to protect people from developing chronic disease However the essential nutrient content of fruits and vegetables although abundant does not appear to account for all of these health benefits Thus over the past decade a great deal of research has been conducted to identify how other chemical constituents in fruits and vegetables might help prevent the development of chronic disease in people
Chronic Disease and Oxidative Damage Understanding the processes by which chronic diseases develop has led to the identification of key mechanisms underlying the development of a disease state Some of 1 Heterotrophs feed partially or exclusively off of other forms of life 2 httpwwwhealthgovdietaryguidelines 3 httpwwwnalusdagovfnicFpyrpyramidhtml
Center for Authentic Science Practice in Education Spring 2008 3
these processes include carcinogenesis the inflammatory process over stimulation of programmed cell death and oxidative stress Oxidative stress is defined as the accumulation of reactive oxygen species (ROS) in living systems to a sufficient degree to cause measurable damage to cells and tissues Reactive oxygen species are defined as partially reduced forms of oxygen that are either radical species themselves or can easily form radical species As aerobic organisms that undergo respiration humans use oxygen during the process of respiration to obtain energy from fuel sources Molecular oxygen is reduced by four electrons to produce water in the mitochondria of cells (the proton gradient resulting from this electron transfer process drives the formation of ATP) Neither the starting material oxygen nor the final product water that results from this reduction process is very reactive with large macromolecules that make up the structure of the cells But univalent (one-electron) reduction of oxygen can form species that are much more prone to react with cellular macromolecules As illustrated in the first equation below one-electron reduction of oxygen leads to the formation of superoxide
Addition of a second electron along with a source of protons can lead to the formation of hydrogen peroxide (H2O2) Two-electron reduction of H2O2 will lead to the formation of the final product water Alternatively addition of only one electron to H2O2 leads to the formation of hydroxyl radical and hydroxyl anion
Superoxide hydrogen peroxide and hydroxyl radical are considered ROS because they will either directly or indirectly react with biological macromolecules in living cells such as proteins lipids and DNA This interaction will often alter the structure of the macromolecule and destroy its function
How Antioxidants Prevent Oxidative Damage In living systems the potential sources of ROS include mitochondrial respiration enzymes such as NADPH oxidase4 and other types of oxidases and exposure to environmental chemicalstoxins such as alcohol cigarette smoke and surface ozone Transition metals such as iron and copper that donate and accept electrons easily also contribute to ROS production To prevent damage due to ROS living systems have a multitude of defense systems These systems include primary antioxidants that are 4 NADPH oxidase is nicotinamide adenine dinucleotide phosphate-oxidase
Eq 2
Eq 1
Center for Authentic Science Practice in Education Spring 2008 4
substances that directly inactivate ROS Primary antioxidants donate a neutral hydrogen atom (with one proton and one electron) to a free radical ROS thereby terminating the radical (allowing for the formation of an electron spin-pair in the outer orbital of the ROS) and preventing the molecule from causing damage Hydrogen-donating antioxidants form more stable less reactive radical species than the ROS Secondary antioxidants prevent damage due to ROS by a variety of other mechanisms including metabolism of non-radical ROS chelation5 of transition metals and repairing the damage that ROS cause to lipids protein and DNA
A good example of an interaction between an ROS cellular macromolecules and an antioxidant is observed in foods and biological systems that contain polyunsaturated fatty acids (PUFA) In living systems PUFA are important constituents of cell membranes and serve as precursors to hormones The PUFA chemical structure is characterized by a long hydrocarbon chain that contains multiple double bonds separated by methylene groups This arrangement makes the molecule susceptible to hydrogen atom removal and oxygen incorporation Interaction with an ROS can initiate oxidation of PUFA which can then lead to continual formation of more ROS as illustrated generally in Equation 3 below
A more specific example is given in Equation 4 where oleic acid forms a peroxyl radical by reaction with hydroxyl radical (step one) and then oxygen (step two) The peroxyl radical can continue to damage other molecules of oleic acid
5 Chelation is the process of reversible binding of a ligand to a metal ion forming a metal complex
Eq 4
Eq 3
Center for Authentic Science Practice in Education Spring 2008 5
O
OH
CH3
CH3
CH3
CH3
CH3
CH3CH3
CH3 Figure 2 α-Tocopherol
Eq 5
Unless an antioxidant is present to stop this continual chain reaction all the PUFA present will be modified via incorporation of oxygen which will significantly change their characteristic from being very hydrophobic to more hydrophilic If this happens in a cell membrane it will lead to cell death A good antioxidant that typically protects PUFA in foods and living systems is vitamin E which is a group of structurally similar lipophilic molecules collectively known as tocopherols Each form of tocopherol is indicated by a different Greek letter The vitamin possesses a phenolic ring structure attached to a hydrocarbon chain It can readily donate a hydrogen atom to a lipid peroxyl radical (such as the product of step 2 in Eq 4) terminating the radical and preventing the further propagation of what is referred to as the lipid peroxidation process
In biological systems chemical antioxidants such as vitamin E and vitamin C (L-ascorbic acid or just ldquoascorbaterdquo) are constantly reused because other supporting systems help to keep them in a reduced state6 These systems are mostly enzymatic and donrsquot function in foods Thus antioxidants are often added to foods that contain PUFA to prevent lipid peroxidation and to preserve the concentration of essential antioxidant nutrients In fact ascorbate can reduce vitamin E and is sometimes added to foods as a preservative
Phytochemicals as antioxidants There is a multitude of chemical substances in foods that possess antioxidant properties These fall into numerous antioxidant classes as shown in Figure 3
bullMinerals and vitamin cofactorsbullHormonesbullTerpenoids(carotenoidand non-carotenoidbullEsters
HPLC
TEAC
Total PolyhphenolicsAssay
6 The opposite of oxidation is reduction A ldquoreducing agentrdquo will counteract oxidation
Figure 3 Classes of Antioxidants The circled items are those which will be tested in this module and the technique name is shown near the circle
Center for Authentic Science Practice in Education Spring 2008 6
The various chemicals that behave as antioxidants have different properties for example some are soluble in fatsnon-polar solvents and some are soluble in waterpolar solvents In this module we will focus on a class of substances referred to as flavonoids Flavonoids all possess a basic 3-ring structure as illustrated in Figure 4
Figure 4 Basic Flavonoid StructureFigure 4 Basic Flavonoid Structure Different subclasses of flavonoids vary in the structure of the C-ring it may
include a double bond between carbons 2 and 3 a carbonyl group at carbon 4 or a hydroxyl group at carbon 3 Within each subclass the specific species vary based on the substitution of hydroxyl or O-methyl groups at positions 5 7 3rsquo 4rsquo and 5rsquo Because these are polyphenolic7 compounds they all possess some degree of antioxidant activity when evaluated in a test tube Generally those chemical species with a greater number of hydroxyl substituents on the ring possess greater activity in the test tube The flavonoid called quercetin possesses adjacent hydroxyl substituents on the B-ring at positions 3rsquo and 4rsquo A proposed scheme for how quercetin acts as an antioxidant is illustrated in Figure 5 in which two lipid radicals are reduced sequentially The single dot next to some of the O atoms indicates an unpaired electron which indicates a radical chemical species
Flavonoids are abundant in common fruits and vegetables Table 1 summarizes
which types of flavonoids are found in fruits and vegetables 7 A polyphenolic antioxidant is a compound having multiple phenols or benzene rings with ndashOH (hydroxyl) substituents
Figure 5 Flavonoid Antioxidant Mechanism
Center for Authentic Science Practice in Education Spring 2008 7
Table 1 Flavonoid subclass
Major Food Sources
Flavonols (eg quercetin)
Onions kale broccoli apples cherries berries tea red wine
Flavones Parsley thyme
Flavanones Citrus
Catechins (eg epicatechin)
Apples tea
Anthocyanidins Cherries grapes
Isoflavones Soya beans legumes
Measurement of Antioxidant Activity Several methods have been developed to measure the total amount of antioxidant
activity that a pure chemical complex mixture food or biological sample possesses All of the methods involve the generation of ROS and the termination of the ROS by the antioxidant being tested One common method for assessing total antioxidant activity in a food or biological sample like serum is the Trolox equivalent antioxidant capacity (TEAC) assay This is a method that you will use during this module This method measures the ability of a test antioxidant to reduce a radical species The radical species exhibits a characteristic absorption spectrum Therefore reduction is associated with loss of color at a specific wavelength Potential antioxidant preparations are tested at several different concentrations and compared to Trolox which is also tested at several concentrations Good antioxidants will reduce the absorbance of the radical species at lower concentrations than poor antioxidants Figure 6 illustrates the overall antioxidant activity of common fruits and vegetables observed when measuring their TEAC activities Larger values indicate greater antioxidant activity Notice the value for strawberries is more than two times greater than the value for onions
0 500 1000 1500 2000 2500 3000
Lettuce
Apple
Onions
Broccoli
Spinach
Orange
Strawberry
μM Trolox equivalents100 g food weight
0 500 1000 1500 2000 2500 3000
Lettuce
Apple
Onions
Broccoli
Spinach
Orange
Strawberry
μM Trolox equivalents100 g food weight
Figure 6 TEAC values of various foods
Center for Authentic Science Practice in Education Spring 2008 8
Another method for measuring antioxidant activity focuses on a different class of antioxidants polyphenolics This measurement uses a reagent the Folin-Ciocalteau reagent that reacts with polyphenolic antioxidants to form compounds that absorb light in the visible region As the concentration of polyphenolics increases so does the amount of light absorbed by the solution As with the TEAC assay there is a standard that is known as epicatechin Epicatechin is reacted with the Folin-Ciocalteau reagent at different concentrations to form a standard curve Then potential antioxidants are also reacted with the reagent at multiple concentrations The absorbance of the potential antioxidants is used in conjunction with the standard curve of epicatechin to find the concentration of polyphenolics in the sample
The final analysis method that you will use is L-ascorbic acid (Vitamin C) quantification via high-performance liquid chromatography (HPLC) In this analysis method you will make a standard curve of L-ascorbic acid as well as multiple concentrations of your food samples The HPLC will separate the components of your solutions both standard and sample and quantify the amount of L-ascorbic acid You can use this to determine the concentration of L-ascorbic acid in your sample solutions and calculate the amount in your dry samples
What we donrsquot know and what you are going to do in this module Although a number of studies have been conducted with pure phytochemicals and food sources of phytochemicals much is still unknown concerning the contribution of these non-nutrient compounds to health Many questions remain unanswered about how these phytochemicals interact in a complex diet both before and after we consume them Some of the questions are listed below with example hypotheses statements When these hypotheses are tested they may help answer each question bull Is the antioxidant activity of spices affected by cooking
o Hypothesis The antioxidant activity of curry powder a spice known to contain antioxidants will not be changed by heating the spice to simulate cooking
bull Are dried fruits effective for use in making antioxidant-rich foods as a substitute for fresh fruits
o Hypothesis Raisins the dried analogue of grapes which are known to be high in polyphenolics are not high in antioxidant activity
bull Does the digestive process significantly alter antioxidant activity of common foods o Hypothesis Conditions that simulate digestion such as changing pH mixing
and exposure to digestive enzymes will significantly reduce the antioxidant activity of a dried fruit or spice
In this module you will apply several of the fundamental properties of chemistry
to address a research question about antioxidant properties of food substances that may be beneficial to health Specifically you will be examining the effect of the digestion process on green teas and juicegreen tea mixtures Key chemistry topics that will be used in this module include the properties of mixtures organic compounds (the atomic properties of carbon) and chemical equilibrium During the first three lab periods you will learn how to measure total antioxidant activity (via the TEAC method) ascorbate
Center for Authentic Science Practice in Education Spring 2008 9
Table 2 Flow-chart for Module Progression
Lab 1 Introductory Lab - Introduction to the module making solutions and spectral scanning of the Trolox Equivalent Antioxidant Capacity (TEAC) substrate
Lab 3 Ascorbate and Total Phenolic Measurement - Introduction to HPLC and the use of a standard curve to determine ascorbate and total phenolics concentrations in foods
Labs 4-7 Independent Research Project - Conduct experiments to test the chosen hypothesis and complete analysis ndash repeat tests as necessary
Lab 2 TEAC Measurement ndash Conduct the TEAC measurement with Trolox and the flavonoids epicatechin and quercetin and explore the equilibrium of the reaction
concentration and total phenolic concentration in standard and food samples During lab four you will begin to plan your own research project As a means of learning how to best design your own research project you will review a very recent paper testing the effect of processing on antioxidant activity of a food substance During this lab period you will also identify the experimental question that your group would like to address and design the experiment that you will conduct during the subsequent laboratories The following table illustrates this proposed schedule
Module Calendar The three main measurements for the upcoming labs are total antioxidant activity as TEAC ascorbate concentration (using HPLC) and total polyphenolics in standard and test samples The TEAC measurement estimates total antioxidant activity contributed by both known (ascorbate and polyphenolics) and unknown chemical components for a given sample Measurement of total polyphenolics concentration is used in this module to reflect the amount of flavonoid compounds present in a test sample
You will use a few standard substrates in the TEAC assay epicatechin quercetin and Trolox Epicatechin is a common flavonoid that is found in apples and tea and it is also a component of compounds that are found in cherries and grapes Quercetin is one of the more abundant flavonoids in our food supply one of the richest sources of quercetin is fried onions Trolox is a more polar form of vitamin E lacking the long hydrocarbon side chain in α-tocopherol Ascorbate is a known essential nutrient antioxidant that functions as such in the body
Center for Authentic Science Practice in Education Spring 2008 10
Laboratory 1 Making Solutions and Spectral Scanning of the Trolox Equivalent Antioxidant Capacity (TEAC)
Substrate
Overview of this Laboratory Activity During this laboratory period you will make a variety of stock solutions that you
will be using throughout the remaining weeks of this module You will also determine the exact concentration of a solution which has been previously prepared for you by using the spectrophotometer
Introduction to Making Solutions Understanding how to make solutions and how to measure their properties is
fundamental to many kinds of research simply because so many substances that are important to life are either solutions or inhomogeneous mixtures The liquids and solids that make up living systems and foods are mixtures of two or more substances physically mixed together but not chemically combined Mixtures possess two important defining characteristics variable composition and retention of individual component properties Solutions and colloids are two common types of mixtures A solution is a homogeneous mixture with each component dispersed evenly throughout the space or phase Salt dissolved in water is an example of a solution Heterogeneous mixtures exist in separate phases A colloid is an example of a heterogeneous mixture in which one component is dispersed evenly as very small particles in the other Milk is an example of a colloid to the unaided eye it appears to be a homogeneous mixture Applying centrifugal force to a milk sample will separate the phases and reveal the colloidal nature of the food Solutions and colloids differ because the particles in solutions are individual atoms ions or molecules whereas in colloids the particles are large macromolecules or aggregates of smaller molecules that are still small enough to remain dispersed In this module you will encounter both solutions and colloids The chemical reagents that you will use to carry out the experiments in each lab are solutions whereas the foods that you will analyze may be either solutions or colloids Solutions are usually defined as one substance (solute) dissolved in another (solvent) that is more abundant The solubility of a solute is the maximum amount of the chemical that will dissolve in a particular volume of solvent usually 1 liter (Some substances will mix together in any proportion and are said to be miscible) A major factor which influences the solubility of a solute in a solvent is the relative strength of the intermolecular forces within and between solute and solvent These forces and their effects are discussed in detail in most Chemistry textbooks Here however we will discuss issues relating to making solutions of various desired concentrations
Common conventions for expressing concentration include molarity molality percent mass and percent volume
bull Molarity (M) = moles of solute volume of solution (L) bull Molality (m) = moles of solute mass of solvent (kg) bull Percent mass = mass of solute total mass of solution x 100 bull Percent volume (vv) = volume of solute total volume of solution x 100
Center for Authentic Science Practice in Education Spring 2008 11
bull Percent volume (wv) = mass of solute total volume of solution x 100 In this module we will primarily be using molarity to express concentration units but you will also see some substances described with the other units so it is important to be familiar with them and the differences between them When making a solution of a desired concentration say 25 mM for example you need to determine two things
bull Total volume of solution that you need bull Mass of solute that you must add to get the desired number of moles
An important point to remember about solutions is that the concentration of the
solution will be the same throughout the whole solution For example if you have a liter of solution with a concentration of 50 mM and you pour half of that into another container then the amount you have poured out also has a concentration of 50 mM (as well as the amount you left in the original container) This may seem like such an obvious point that it shouldnrsquot even deserve mention here However this simple point has a very practical purpose when you are making solutions in the laboratory If you need a very small amount of solution (for example 5 mL) and it will be a very dilute solution then it may be difficult or even impossible for you to weigh the proper amount of solute to make the proper concentration of solution at only 5 mL But you could instead make 100 mL of the solution at the desired concentration and simply use 5 mL of it if 100 mL is a more practical volume for weighing your solute Alternatively you could make a more concentrated solution and use what is known as a serial dilution technique to arrive at the more dilute concentration that you desire We will talk about each of these approaches In either case your own common sense is important in deciding how you will arrive at your final desired volumes and concentrations (For example if you are going to make a larger volume than you need donrsquot pick such a large volume that you would be wasting large amounts of solute ndash especially if it is an expensive solute)
Proper Technique for Weighing Solids You will be using analytical balances for weighing solids in the lab You should keep in mind that these balances are not reliable below about 10 mg ( 0010g) So if your calculations show that you need to weigh out less than this amount you should consider making a more concentrated solution and diluting to the required concentration Once yoursquove determined an amount larger than 10 mg to weigh out you still need to be careful about using proper technique so that you donrsquot waste materials or weigh your sample incorrectly (Remember many of the substances that you will be working with in this module are very expensive ndash as is often true with chemicals used in research studies) When you use the balances you should first place your weighing paper or weighing boat onto the balance and ldquotarerdquo the balance You will then place both hands into the balance one from each side of the balance In one hand you will hold the container for the solid sample you are weighing and in the other you will hold the tool (such as a spatula) with which you are scooping it onto your weighing paper or boat as shown in the image below
Center for Authentic Science Practice in Education Spring 2008 12
When you have the desired amount in your weighing paper or boat leave your sample on the scale but remove both your hands and close the doors The mass displayed with the doors closed is the correct mass for the amount of sample you have weighed out Be sure that you have not spilled any solid sample on the weighing pan outside of your weighing boat since this will give you an incorrect reading Using Dilution to Reach a Desired Concentration You can make a more concentrated solution than you need and then dilute it volumetrically to reach the concentration you desire When you are trying to achieve very specific concentrations you should always be sure to use volumetric flasks to make your solutions In particular it is very important to never fill past the line on the neck You cannot fill past the line and then remove some liquid because that will change your concentration When diluting a solution you need to keep track of the number of moles (ie amount of solute) that you are moving from one place to another Conveniently the number of moles can be calculated by multiplying concentration and volume (conc) molL x (volume) L = mol Letrsquos take an example where we will start out with a ldquostockrdquo solution that has a concentration of 250 mM (that is 250 x 10-2 M) A ldquostockrdquo solution is the solution that you start with and you usually will have a relatively large quantity of it so that you will use it repeatedly to make your other solutions For this reason it is very important that you make your stock solutions carefully and make sure they do not become contaminated
Center for Authentic Science Practice in Education Spring 2008 13
(such as by putting a dirty pipette into them) Letrsquos assume that you want to make 25 mL of a 050 mM solution starting with this stock solution This means you will transfer some small amount of your stock solution into a 25 mL volumetric flask and then carefully dilute it with the proper solvent up to the line on the next of the flask The question is ndash how much should you transfer Remember to always think about the moles A 500 mL solution of 0500 mM concentration has (500 x 10-2 L) x (500 x 10-4 molL) = 250 x 10-5 mol of solute in it So you need an amount of your stock solution that will put this many moles into your new flask You can find this by dividing this number of moles by the concentration of your stock solution
mL 100 L 10 x 100 L
mol 10 x 502mol 10 x 502 3-
2-
-5
==
Therefore you need to put 100 mL (measured in a volumetric pipette) from your stock solution into your 25 mL volumetric flask and dilute to the line Another way to arrive at this calculation is to remember the equation V1C1 = V2C2 In this equation V stands for volume and C stands for concentration If you take the volume and concentration of the solution you want as V2 and C2 and the concentration of your stock as C1 then you can rearrange the equation to find out the amount of solution that you need to transfer from the stock to the new flask
mL 100 L 10 x 100molL 10 x 250
molL) 10 x L)(500 10 x 005( 3-2-
-4-2
1
221 ====
CCVV
Notice that this yields the same answer and is in fact the same calculation all in one step You must not forget however that you are actually achieving this by making the number of moles equal on the two sides of the equation
Introduction to TEAC Assay Spectrophotometric Measurement of ABTS˙+ (the ABTS Radical Cation) One of the solutions that you will make during this lab period provides the radical substrate for the Trolox equivalent antioxidant capacity (TEAC) assay (An assay is an analysis to determine the presence absence or quantity of some component in a mixture or substance) This assay compares the total antioxidant activity in a sample to a standard Trolox Because this assay aims to quantify the total amount of antioxidant activity in a complicated test mixture of interest the substrate of choice is a radical chemical species that exhibits characteristics that can be exploited for quantification purposes The radical chemical species of the monocation 22rsquo-azinobis-(3-ethylbenzothiazoline-6-sulfonic acid) abbreviated ABTS+ is ideal for this purpose It is relatively stable is readily reduced by important antioxidant compounds and exhibits a characteristic absorption spectrum in the visible range of light This last property is one that can be used for quantification purposes The ABTS+ is synthesized prior to its use by first making separate solutions of ABTS and potassium persulfate in water Equal volumes of these two solutions are combined and the reaction (outlined in Eq 6 below) is
Center for Authentic Science Practice in Education Spring 2008 14
allowed to continue until it reaches equilibrium after about 12 hours One electron is withdrawn from each of 2 molecules of ABTS by potassium persulfate leading to the formation of potassium bisulfate and ABTS+ The product formed has characteristic absorbance at several wavelengths This type of oxidation reaction with ABTS is utilized in many common medical analyses such as enzyme-linked immunosorbent assays (ELISA) to measure the concentration of important biomolecules in blood or urine
Eq 6
Colored solutions absorb light in the visible range (400-700 nm) of the electromagnetic spectrum A compound that would absorb all wavelengths of light in this range would appear black Others which absorb only at distinct regions within this range appear as different colors The ABTS+ actually absorbs at several distinct regions in the visible light spectrum We will use this property to quantify the amount of the ABTS+ in solution using a spectrophotometer and exploiting the Beer-Lambert Law or ldquoBeerrsquos Lawrdquo This law states that the concentration (C) of a chemical compound is proportional to its absorbance (A) divided by a constant (molar extinction coefficient or absorptivity [ε]) and path length (l) as follows
C = Aεl
These websites explain this in more detail httpwwwshuacukschoolsscichemtutorialsmolspecbeers1htm httpdlclackamasccorusch105-04beershtm
pale green
deep blue-green
Center for Authentic Science Practice in Education Spring 2008 15
According to Re et Al (Free Radical Biology and Medicine Vol 26 Nos 910 pp 1231-1237 1999) for ABTS+ at a wavelength of 734 nm
ε =15x104 mol-1Lcm-1
You will use this constant to calculate the concentration of ABTS+ in substrate solutions
Pre-Lab Requirements Write an introduction and experimental section for this laboratory period Your experimental section should include a description of what you plan to do in lab in your own words such that you could follow the instructions direction out of your own lab notebook In addition to writing introduction and experimental sections for this laboratory you will also need to calculate the masses and volumes needed to make all solutions and dilutions for this procedure before coming to lab You should also research proper volumetric techniques especially those techniques involving the use of equipment not used in the previous Chem 112-114 experiments namely measuring pipets and 3-way safety bulbs
benzopyran-4-one dihydrate) bull Ethanol 100 or equivalent bull ABTS+ that has been incubated for 12 hours bull 25 mL amber vials and 250 mL bottles bull volumetric flasks in 25mL 50mL 100mL and 250mL sizes bull 5 mL measuring pipets bull 1000-200 μL and 200-10 μL auto pipets (ldquomicro pipetsrdquo) bull 3-way safety bulb bull Cuvets bull Waste Jar
Waste Disposal You should have a beaker designated for waste material on your lab bench After you have performed the determination of maximum wavelength the ABTS radical should be disposed of in this beaker All the glassware used in preparing the solutions for the TEAC assay should be rinsed with a small amount of water from your wash bottle and poured into the waste beaker You can then empty the beaker into the large waste jar found in the main hood
Center for Authentic Science Practice in Education Spring 2008 16
Laboratory Procedures Part I Spectrophotometric determination of wavelengths of maximum absorbance (λmax) for the ABTS+ substrate
Today you will measure an absorbance spectrum (sometimes called ldquoUV-Visrdquo) of a completed ABTS+ preparation
While the spectrophotometer is warming up feel free to complete some of the solution preparation parts that follow
Throughout this module you will be using a square plastic cuvet instead of the glass test tube-like cuvets that you may have used in the past These cuvets have two clear sides and two ridged sides so it is important that you insert the cuvet into the spectrophotometer with the correct orientation The cuvets have an arrow molded into the plastic to help you orient the cuvet in the spectrophotometer
An ABTS+ solution that has already been incubated for 12 hours will be provided Make 100 mL of a 1100 dilution of this solution in distilled water This will be referred to as the ABTS+ substrate Transfer 3 mL of the ABTS+ substrate into a cuvet and begin making measurements of the absorbance of this solution at 375 nm For this sample measure the absorbance at intervals of 10 nm through the 375 to 835 nm range The spectrophotometer must be calibrated for each wavelength using deionized water as the blank
(Note For spectrophotometers with scanning capability intervals of 1 nm are preferred) For future studies the position of the peak that you find closest to 735 nm will be used for your TEAC analysis Dispose of the ABTS solution in the waste jar The cuvets can be thrown away Part II Preparation of Solutions for TEAC Assay
You will make two stock solutions that are stable in the dark for several months ABTS and potassium persulfate These two solutions are combined together in equal volumes to create the working ABTS+ that has strong spectrophotometric properties in the visible range and is used in diluted form for the TEAC assay It requires over 12 hours for the formation of ABTS+ to be complete ABTS+ (radical cation) reagent
Make 25 mL of a 0014 M ABTS solution in deionized water Make this solution in a volumetric flask (A word of caution when using a volumetric flask do not fill above the line and then try to remove solvent volume You can fill almost to the line relatively rapidly but then add drop wise until the meniscus of your solution is at the line for an accurate solution concentration) Transfer the solution to an amber vial or a clear vial covered with foil to block light for storage cap tightly and store in the refrigerator Put parafilm around the cap of the vial for weekly storage to avoid solvent evaporation
Make 100 mL of 00049 M potassium persulfate K2S2O8 in deionized water also in a volumetric flask Store in a bottle This solution is not light or temperature sensitive
To make the ABTS+ reagent mix 5 mL each of the ABTS and K2S2O8 solutions you just made into a foil covered or amber vial Cap tightly parafilm and store in the
Note to UIC Students For the implementation in Spring 2008 certain procedures are omitted We have left the original module text here for the sake of completeness But you will skip any sections that are shaded in
Center for Authentic Science Practice in Education Spring 2008 17
refrigerator Label all solutions with contents your name room number date and section number This solution will be ready to use after 12 hours and is stable if kept in the dark up to an additional 10 days
Standard Antioxidants Making Stock Solutions of Trolox Epicatechin and Quercetin Make 25 mL of 25mM Trolox stock solution in ethanol in a volumetric flask Transfer the solution to an amber vial Cap tightly parafilm and store in the refrigerator Label all solutions with contents your name room number date and section number Notice that it would be very difficult to do this in one step because you would need to weigh an extremely small amount of solute (Trolox) However in a situation such as this you can make a larger volume and then extract the amount you need Yoursquoll need to look at the sizes of the volumetric glassware that you have available in order to determine what volume you will scale up to
Make 25 mL of 25 mM epicatechin and 25 mL of 10 mM quercetin in ethanol in the same way Here again you need to consider the amount of material that you need to weigh in order to make these solutions One option is to make a more concentrated solution (for which you know the exact concentration) and dilute it For example you could make a 25 mM solution of epicatechin in 25 mL and a 50 mM solution of quercitin in 100 mL Then you can dilute those to end up with the solution concentrations and quantities that you need
In general it is important to think about not only the concentration of a solute that you need but how you will work with the substance when you are making the solution ndash such as weighing it You will want to keep this in mind for lab periods 4-6 when you design your own experimental procedure
Preparation of Diluted Trolox Epicatechin and Quercetin Solutions Make dilutions of the stock solutions of Trolox
and epicatechin to 25 50 100 and 200 μM and quercetin to 20 40 80 and 160 μM (see example in figure on the next page) Be sure to use the appropriate solvent for dilutions Storage for the dilute solutions is the same as for the stocks When finished you should have twelve dilute or ldquosamplerdquo solutions Each of these will be run in a separate TEAC measurement in laboratory activity 2
UIC Spring 2008 The stock solutions of Trolox epicatechin and quercetin will be prepared for you Always check the bottle for the actual concentration of these and all other solutions
UIC Spring 2008 Your solutions will be stored in vials for use in Week 2 of the module All student groups should prepare solutions of Trolox Half of the groups will also prepare solutions of epicatechin The other half of the groups will do solutions of quercetin Check with your TA for your group assignment
Center for Authentic Science Practice in Education Spring 2008 18
Part III Preparation of reagents for the total phenolics measurement Dissolve anhydrous sodium carbonate in water to make 100 mL of a 70
solution (wv) and store in a bottle This solution is not light or temperature sensitive Label all solutions with contents your name room number date and section number All the glassware used in preparing the solutions should be rinsed with a small amount of water from your wash bottle and poured into the waste beaker The waste beaker can then by emptied into the large waste jar found in the main hood
Post-Lab Calculations and Analysis of the results a Calculate the concentration of ABTS+ in the solution that you scanned using the
absorbance that you obtained and the ε at 735 nm given earlier
b Explain based on intermolecular forces the rationale for using water to dissolve potassium persulfate ABTS and sodium carbonate rather than ethanol that was used as the solvent for Trolox epicatechin and quercetin
Preparation for Next Week
a Read next weekrsquos lab b Prepare your notebook with necessary pre-lab information to carry out the lab c Carry out any pre-lab or sample calculations that are necessary d Be prepared to hand in your post-lab from this week
Center for Authentic Science Practice in Education Spring 2008 19
Laboratory 2 TEAC Activity of Epicatechin Quercetin and Trolox
Overview of This Activity In this lab you will follow the reaction between ABTS+ and primary antioxidants
over time and estimate strength of antioxidant activity for the flavonoids quercetin and epicatechin in comparison to Trolox You will derive a value for quercitin and epicatechin known as the ldquoTrolox-equivalent antioxidant capacityrdquo or TEAC value There are two components to this analysis (1) the calculation to determine the extent of reaction for each antioxidant and (2) the comparison of the extent of reaction for each antioxidant with that of Trolox to determine antioxidant strength Introduction
The study of the extent of reactions or chemical equilibrium involves measuring the concentration of reactants and products at a point in time when no further observable change occurs For the reaction between strong primary antioxidants and ABTS+ the rate is quite fast reaching equilibrium in seconds For weaker antioxidants a much longer time period is required This reaction can be written in shorthand as Eq 7 where AH is an antioxidant capable of donating a hydrogen atom
Eq 7 The extent of the reaction in Eq 7 is measured in the TEAC assay The extent of
the reaction will be correlated with the antioxidant capacity or strength of the antioxidant being tested In the antioxidant research literature for TEAC the extent of reaction is determined based on the percentage of reactant specifically ABTS+ substrate converted to product at defined concentrations of antioxidant Measurements are taken for each test compound and compared to the extent of the reaction for Trolox the water-soluble form of the nutrient antioxidant vitamin E The first thing you will need to do is measure the extent of reaction of each antioxidant (Trolox epicatechin or quercitin) with the radical cation For this objective you will mix ABTS+ substrate with a defined concentration of each antioxidant and their solvent(s) and read the absorbance at 735 nm after 6 minutes The results of each measurement are first converted to a value of ΔAABTS+ (using absorbance units) then to the percent of ABTS+ substrate converted to product which is expressed as ldquopercent inhibitionrdquo You may wonder why the extent of reaction is represented as percent inhibition This relates to the functional role of antioxidants in foods and living systems Consider ABTS+ as a type of ROS In complex systems this ROS would interact with and potentially destroy large macromolecules Reduction of ABTS+ to ABTSH+ inactivates this ROS and prevents this damage Therefore antioxidants inhibit damage caused by ROS and representing the results as percent inhibition not only reflects the extent of the reaction but also the potential functionality of the antioxidant in biological systems Therefore a high percent inhibition implies that the antioxidant has inactivated a large amount of the ABTS+ substrate ROS
Center for Authentic Science Practice in Education Spring 2008 20
The second objective that you will accomplish is to compare the strength of the test antioxidants to Trolox This will be done by plotting the relationship between percent inhibition and concentration for each antioxidant used in the analysis From the slope of the straight line that fits this relationship you will determine the value of percent inhibition per unit concentration of the antioxidant The next step will be to divide the slope of each test antioxidant by the slope obtained for Trolox as a means to standardize the comparison of different antioxidant preparations to one another This ratio of slopes is the ldquoTEAC valuerdquo for each sample A larger TEAC value indicates greater antioxidant capacity What is the Purpose of a Control In all of the techniques you will be using in this module you will need to carefully use ldquocontrolsrdquo The purpose of a control is to ensure that your measurement is yielding the proper values for a known substance In some cases this means that you need to know what effect your solvent has on the measurement so that you can subtract it out In the first three laboratory periods you will be guided about when and how to use control measurements For your own research project you will need to carefully plan how you will incorporate controls into your measurements
Pre-Lab Requirements In addition to writing introduction and experimental sections for this laboratory as before you will also need to calculate the volumes needed to make all dilutions for the TEAC assay before coming to lab Determine if an absorbance measurement at time t=0 is necessary for every aliquot of the ABTS+ substrate
Materials Available bull Your previously prepared solutions of quercetin epicatechin Trolox and ABTS+ bull ethanol 100 bull volumetric flasks in 25mL 50mL 100mL and 250mL sizes bull 25mL amber vials bull spectrophotometer bull cuvets bull 5 mL measuring pipets bull 1000-200 μL and 200-10 μL auto pipets (ldquomicro pipetsrdquo) bull 3-way safety bulb bull Waste jar
Waste Disposal You should have a beaker designated for waste material on your lab bench After you have performed the TEAC procedure all solutions should be disposed of in this beaker All the glassware used in preparing the solutions should be rinsed with a small amount of water from your wash bottle and poured into the waste beaker The waste beaker can then be emptied into the large waste jar found in the main hood
Center for Authentic Science Practice in Education Spring 2008 21
Laboratory Procedures TEAC Procedure
Turn on the spectrophotometer and allow it to warm up for at least 30 minutes Preparation and dilution of ABTS+ (radical cation) reagent
Measure 25 mL of the ABTS+ solution into a 250mL volumetric flask and bring to volume with deionized water This solution will be referred to as the ABTS+ substrate Measurement of substrate quality
Blank the spectrophotometer using water at 735 nm Add 29 mL of ABTSsdot+ substrate to a clean cuvet Record the absorbance of the substrate at 735 nm If the absorbance of ABTSsdot+ is not above 065 then your ABTSsdot+ has gone bad You will need to borrow some for this measurement and you will need to remake your stock solution for next week
Measurement of samples
Next you will measure the absorbance of the Trolox epicatechin and quercitin dilutions that you made in Lab 1 reacting with ABTSsdot+ Add 29 mL of ABTSsdot+ and 100 μL of one sample to a clean cuvet and mix thoroughly (You can mix by putting a small piece of parafilm over the top of the cuvet putting your finger tightly over that and inverting a few times) Set aside for approximately 6 minutes and take a reading at 735 nm You will measure two trials of each of your twelve sample dilutions
You also need to run a control sample In the TEAC procedure this means
running the TEAC assay with 29 mL of ABTSsdot+ substrate and 100 μL of the solvent of the sample being tested The purpose of this measurement is to mimic the conditions of the sample measurements exactly except for the presence of the antioxidant Be sure to use the correct solvent If you are running more than one sample with the same solvent you do not need to do multiple controls
Run at least two trials of each sample and of the control
Dispose of all solutions in the waste jar provided The cuvets can be thrown in the trash Post-Lab Calculations and Analysis of Results Calculations and Graphing
To accomplish the first objective calculate the change (Δ) in [ABTS+] as represented by the change in absorbance on A735 described in Eq 10 Use the data obtained for the 6-minute time point Repeat for each antioxidant at each concentration For each sample concentration average the values of the two trials that you took Calculate Inhibition as illustrated in Eq 11
Center for Authentic Science Practice in Education Spring 2008 22
ΔAABTS+ 6 min = A735Control - A735Test at T=6 min Eq 10 A735Control = Absorbance at 735 nm of the reaction between ABTS+ and [AH]=00 A735Test = Absorbance at 735 nm of the reaction between ABTS+ and [AH]= x M inhibition = (ΔAABTS+ 6 min A735Control ) x 100 Eq 11
Table 3 is an illustration of a spreadsheet calculation in Microsoft Excelcopy for these results at Time = 6 minutes Table 3 Percent inhibition calculations
For each antioxidant make a graph of Inhibition versus antioxidant concentration using linear scales for each antioxidant Using the ldquoadd trend linerdquo feature under the chart menu in Microsoft Excelcopy fit a straight line to the data Under the options tab check ldquoset intercept = 0rdquo ldquodisplay equation on chartrdquo and ldquodisplay R-squared value on chartrdquo The R2 value obtained should be between 095 and 100 to indicate a good fit of the line to the datadagger Figure 8 illustrates a graph of quercetin data
To accomplish the second objective you will use the slope of the best-fit line printed on each graph You can see that the slope is Δ Inhibition per Δ μM antioxidant Divide the slope for the test antioxidants (quercetin epicatechin) by that for Trolox to determine the TEAC value TEAC value = (Slope sample) (Slope Trolox) Eq 12 Because the units are identical in the numerator and the denominator this value is a unitless ratio when comparing pure compounds of known concentration
dagger R2 is a fraction between 00 and 10 has no units and indicates how well you can predict the value of Y (inhibition in this case) based on a known value of X (concentration) An R2 value of 00 means that knowing X does not help you predict Y and there is no linear relationship between X and Y When R2 equals 10 all points lie exactly on a straight line with no scatter so knowing X lets you predict Y perfectly
Center for Authentic Science Practice in Education Spring 2008 23
The TEAC assay may also be used with food products To find the TEAC value for food products plot the TEAC results for TE and the food sample incubations for the 6 min reading as percent inhibition versus concentration in the reaction mixture For the food samples express this concentration in amount of food per liter of reaction (μLL) Calculate the TEAC values for the food sample incubations by dividing the slope of the regression line for each by that for Trolox Convert the units for TEAC for the food products to mM Trolox per L of food sample In some cases it may be more telling to also present the TEAC values in mM Trolox per g of food sample Analysis of the Results a Should there be variation in your control absorption values for the substrate Was there variation in your experiment Please explain b What TEAC values were obtained for quercetin and epicatechin Which is a better primary antioxidant c Why can A ABTS+ be used to represent the change in ABTS+ concentration
Preparation for Next Week a Find out which ascorbate quantification method you
will be using (HPLC or titration) and plan your procedure accordingly Find out if your instructor will provide juice samples or if you are to bring your own
b Write an introduction and experimental section in your notebook
c Carry out the pre-lab calculations before going to lab d Be prepared to turn in your post-lab from this week
Figure 8 TEAC results plot of Inhibition versus quercetin concentration
Effect of Quercetin concentration
on ABTS + Absorbance
y = 41124x
R2 = 09917
00
50
100
150
200
250
300
350
0 2 4 6 8 10
Quercetin concentration ( μM)
in
hibi
tion
UIC Spring 2008 We will only use the HPLC method not the titration method
Center for Authentic Science Practice in Education Spring 2008 24
Laboratory Period 3 Determination of Ascorbate (Vitamin C) Concentration and Total Phenolics in
Common Foods
Introduction Ascorbate (or vitamin C) is an essential nutrient that is found in a variety of plant
foods A lack of sufficient amounts of this nutrient in the diet is responsible for the disease known as ldquoscurvyrdquo Sir James Lind established the link between scurvy and an essential component of plant foods (primarily citrus) in the 1700s Lindrsquos experiments determined that limes contained a substance that would prevent the scurvy so British sailors began consuming limes during long voyages and acquired the nickname ldquolimeysrdquo This important substance was ascorbate
Most animal species can synthesize ascorbate but humans guinea pigs fish and fruit bats require dietary sources of the nutrient In the human body ascorbate serves two main functions It serves as a cofactor for reactions that lead to the maturation of collagen and vitamin C is the primary water-soluble antioxidant in the body Optimal ascorbate concentrations in the blood approach 75 μM and the requirement of up to 90 mgday is the largest of all the vitamins Vitamin C is the most common of the single-nutrient supplements and it is often added to many prepared foods to prevent oxidation Mega doses of the vitamin have been proposed to cure many diseases including the common cold and cancer Although most of these types of claims are disputable the importance of the vitamin for maintaining nutritional health is quite clear
As an antioxidant ascorbate can donate two electrons sequentially to terminate radicals the ascorbate is converted to the oxidized species dehydroascorbate
Eq 13
In living systems that utilize ascorbate as an antioxidant enzymatic reactions
catalyze the reduction of dehydroascorbate using reducing equivalents supplied by glucose oxidation This allows the vitamin to be reused multiple times - a common characteristic of essential nutrients Since ascorbate is the most abundant nutrient antioxidant in fruits and vegetables you will determine its concentration in the samples that you test as a basis for comparison Ascorbate present in foods and supplements will contribute to the overall TEAC activity Two methods are offered to quantify vitamin C content in foods The first method involves extraction of ascorbate from the food matrix followed by separation and quantification by high-pressure liquid chromatography (HPLC) The second method is a titration method using a dye compound that is reduced by vitamin C to a colorless liquid Your instructor will determine which method you will use
Center for Authentic Science Practice in Education Spring 2008 25
A Primer on High Pressure Liquid Chromatography (HPLC) HPLC is a common analytical technique that is used for many applications
including separation identification purification and quantification of various chemical species It is used in research in the fields of chemistry biochemistry biology
toxicology cosmetics and pharmaceuticals The method involves separating molecules dissolved in a solvent that is in motion (mobile phase) at high pressure over a solid
support material (stationary phase) This leads to the separation of individual chemical species based on their binding affinities to the solid matrix versus their solubility in the mobile phase A diagram of the key components of an HPLC system is shown below
The mobile phase is pumped through a column that can sustain high pressures The column is packed with support material with chemical characteristics that can be varied The material commonly used has a strong hydrophobic nature and separates molecules based on dispersion forces Other column materials have ionic characteristics and separate molecules via dipole forces This lab is written to use a hydrophobic solid support material which is silica-based but has long aliphatic 18-carbon hydrocarbon chains attached at the functional groups (C18 material) Another column material pentafluorophenylpropyl may also be used The effluent or outflow from the column passes through a detector which can be a spectrophotometer electrochemical detector or other device adapted to function with a stream of flowing solvent The choice of detection methods depends on the characteristics of the chemical species to be analyzed Ascorbate is active electrochemically and also exhibits an absorption spectrum with a λmax in the UV range at 267 nm For this lab you will prepare the samples standards and mobile phases These will be delivered to the HPLC facility where the samples will be run The data will be provided to you for analysis
Figure 9 Schematic of a typical HPLC setup
wastereservoir
solvent(mobile phase)
injection port
guard column
sample goes in here
column (contains stationary
phase)
pump
processor detector
Center for Authentic Science Practice in Education Spring 2008 26
Determination of Ascorbate Concentration by Titration This method is based on the ability of ascorbic acid to reduce the oxidation-
reduction dye indicator 26-dichloroindophenol to a colorless solution The reaction is shown in Eq 14
At the endpoint of this analysis addition of unreduced dye to the reaction mixture yields a rose pink color in acid solution Since this is a colorimetric reaction involving a non-specific dye indicator or an indicator that will react with many titrants there are certain food substances that give erroneous results Foods that contain other compounds capable of reducing the dye can result in erroneously high values Foods that contain transition metals (iron copper) that compete with the dye for oxidation of ascorbic acid can result in erroneously low ascorbate values Highly colored foods interfere with the determination of the endpoint Measurement of the Total Polyphenolic Content of Foods As indicated in the introduction to this module polyphenolic flavonoids are among the most abundant non-nutrient antioxidants in foods To estimate the contribution that these compounds make to the TEAC value you will quantify the total amount of polyphenolics in chosen samples The measurement is based on a method which was originally developed over 100 years ago was upgraded and improved during the 1960rsquos and 1970rsquos and today is commonly used in the wine industry This analysis involves the use of a spectrophotometer rather than an HPLC or titration
Overview of This Activity In this laboratory activity you will prepare tomato and orange juice samples for ascorbate concentration determination and polyphenolic measurements For either ascorbate concentration determination method you will prepare a stock solution and dilutions of ascorbate for use in generating a standard curve You will then treat and
Eq 14
Center for Authentic Science Practice in Education Spring 2008 27
dilute samples of tomato and orange juices so that they are suitable for injection into the HPLC or use in the titration method For the ascorbate analysis by HPLC the standard and test samples will be sent to the instrumentation lab for injection and the results returned to you for later analysis For the total polyphenolic measurement (and titration analysis) you will conduct the analysis on the same juice samples in the lab today
Pre-Lab Requirements In addition to writing introduction and experimental sections for this laboratory
you will also need to calculate the volumes needed to make all dilutions mentioned below Pay special attention to the volumes and dilutions described in Total Polyphenolics Measurement ndash you will need to choose the volumes for many of the solutions NOTE the balances are not reliable below about 10 mg ( 0010g) So if your calculations show that you need to weigh out less than this amount you should consider making a more concentrated solution and diluting to the required concentration
It may be useful to map out the time you will be spending on this lab to determine which parts of the procedure should be attempted first to maximize time efficiency Some parts require long incubations and should be attempted earlier in the period
Materials Available bull Professionally prepared HPLC standards bull ascorbic acid bull 5 acetic acid with 035 mM tris(2-carboxyethyl)phosphine hydrochloride
(TCEP) ndash also referred to as acetic acidTCEP solution bull Folin-Ciocalteau reagent bull 7 (wv) sodium carbonate solution ndash previously prepared bull Orange juice bull Tomato juice bull 26-dichloroindophenol bull Sodium bicarbonate bull Spectrophotometer bull HPLC autosampler vials (for HPLC analysis only) bull Centrifuge bull Cuvets bull 1 microm syringe filters bull Syringes bull 25 mL 50 mL 100 mL and 250 mL volumetric flasks bull 25 mL amber vials bull 5 mL measuring pipets bull 1000-200 μL and 200-10 μL auto pipets (ldquomicro pipetsrdquo)Filter paper bull 3-way safety bulb bull 50 mL buret (for titration method only) bull Magnetic stirrers and stir bars (for titration method only)
Center for Authentic Science Practice in Education Spring 2008 28
Waste Disposal You should have a beaker designated for waste material on your lab bench After you have performed the measurement of Total Polyphenolics all solutions should be disposed of in this beaker All the glassware used in preparing the solutions for polyphenolic measurement should be rinsed with a small amount of water from your wash bottle and poured into the waste beaker The waste beaker can then by emptied into the large waste jar found in the main hood
Procedures Preparation of Ascorbate Standards and Juice Samples (for HPLC or Titration Method)
Record the serving size of the juices as you will need this information for analysis
You will first make 25 mL of a stock solution of 10 mM ascorbate in dilute (5 vv) acetic acid in 035mM TCEP (this is known as the acetic acid buffer) NOTE the balances are not reliable below about 10 mg So if your calculations show that you need to weigh out less than this amount you should consider making a more concentrated solution and diluting to the required 10 mM This ascorbate solution will serve as the stock concentration for either the HPLC method or the titration method Store in the cold and protect from light In our experience the stock is stable under these conditions for about 10 days Note that the standards for either assay method should be prepared at the same time as the test samples (below) All ascorbate solutions prepared with 5 acetic acid035 mM TCEP are stable up to 10 days if refrigerated and protected from light Without TCEP ascorbate solutions are extremely unstable
Ascorbate Measurement by HPLC Note If you are only performing the titration method skip this part
Each group in the laboratory will be responsible for preparing one HPLC standard Your teaching assistant will assign your group a concentration There are five 25 mL standards to be made by diluting the ascorbate stock with the acetic acid buffer to obtain working standards at 25 50 100 150 and 200μM Fill an HPLC vial for each solution you will need to lightly ldquoflickrdquo the top (wide diameter section) of the HPLC vial with your finger (fingernail side) to ensure that there is no air bubble trapped in the narrow tip at the bottom of the HPLC vial Make sure to flick the vial gently so as not to break it Make sure to label your sample with sample name concentration group name section number and date (ask your instructor about sample codes for your class) Calibration standards must be prepared on the day of HPLC analysis A set of professionally prepared ascorbate standards will also be loaded for comparison with the student made standards
UIC Spring 2008 Ascorbate standards will be prepared for you
Center for Authentic Science Practice in Education Spring 2008 29
To make the HPLC test samples (i) Make a 12 dilution tomato juice solution with acetic acid-TCEP and mix
thoroughly (This means 1 part tomato juice and 1 part acetic acid-TCEP solution so that the tomato juice ends up as frac12 of the total volume of the solution) Note ndash in the next step you will be diluting this solution so you need to make sufficient quantity to work with Centrifuge this dilution for five minutes and decant the supernatant
Dilute the supernatant to 15 with acetic acid-TCEP Filter this diluted supernatant with a 1 μm syringe filter to remove fine particles To do this pull the solution into a syringe then put the filter on the tip and push the solutions through the filter into a clean container Throw away the filter and return the syringe after use Fill an HPLC vial with this solution Now make additional dilutions of the filtered supernatant with acetic acid buffer to 12 and 15 making 25 mL of each solution Fill an HPLC vial with each of these two solutions as before You should now have three HPLC vials with diluted samples Make sure they are labeled
(ii) Make a 12 dilution of orange juice with acetic acid-TCEP and mix
thoroughly (calculate the amount of orange juice needed to make all of your dilutions) Centrifuge the mixture for 5 minutes and decant then dilute the supernatant to 15 with acetic acid-TCEP and filter using a vacuum filtration apparatus shown below
Pass the filtrate through a 1 microm syringe filter to remove fine particles Fill an HPLC vial with this filtered solution and label your HPLC vial Make additional dilutions of the filtered solution to 12 and 15 with acetic acid-TCEP to a final volume of 25 mL of each solution Fill HPLC vials with these diluted solutions and label the vials
Figure 10 Vacuum filtration apparatus
Place filter paper in funnel
Rubber tubing out to vacuum or aspirator
Ring stand
Filter flask (not an Erlenmeyer flask)
3-finger clamp
Buumlchner funnel
Center for Authentic Science Practice in Education Spring 2008 30
Your HPLC vials will be delivered to the instrument for HPLC analysis The samples will be loaded into an autosampler and sequentially injected onto the HPLC column The output from the column is monitored with a UV or electrochemical detector The signal from this detector is processed with a computer program and provides several pieces of information First a chromatogram which is a graph of the output from the detector over time is printed A chromatogram for each sample will be printed and provided to you Second the computer is programmed to integrate the area of each peak on the chromatogram Using the HPLC protocol described in this module ascorbate separates from other components in the sample and elutes8 as a single peak with a retention time of 41 min Retention time is the elapsed time from injection until the maximum height for a single peak passing through the detector Ascorbate Measurement by Titration with 26-dichloroindophenol Note If you are only performing the HPLC measurements skip this part
Dilute the ascorbate stock in acetic acid buffer to obtain 25 mL of working standards at 500 μM and 10mM The 2 mM stock solution will also be used with this method These three concentrations (500 μM 10mM and 20mM) will make up the calibration curve Prepare three trials of all points to be used in the calibration curve Measure enough juice to make all of your dilutions and centrifuge for at least five minutes Decant the supernatant and dilute each juice sample 12 with acetic acid buffer and mix thoroughly If a precipitate forms remove it by either centrifugation or filtration Make dilutions of the resulting clear supernatant with acetic acid buffer 12 15 and 110 Make a final volume of 25 mL of each solution [Note the indophenols standard will be provided for you by the prep lab] If you were to make the indophenol standard solution yourself you would dissolve 50 mg 26-dichloroindophenol sodium salt in 50 mL water to which has been added 42 mg NaHCO3 Mix thoroughly and when the salt is dissolved dilute to 1000 mL with deionized water Filter and store in an amber bottle The solution breaks down upon exposure to light Avoid prolonged periods of exposure in clear glassware
To carry out the determination place 5 mL of standard ascorbate solution into a 125 mL Erlenmeyer flask containing 5 mL of acetic acid buffer Fill a 50 mL buret with indophenol solution Titrate with indophenol solution to an endpoint of distinct light rose color Record the amount of solution used Repeat for all solutions Total Polyphenolics Measurement Dilute the previously prepared epicatechin stock to achieve three or more standards in the range of 25 to 200 μM in ethanol Dilute the concentrated commercially prepared Folin-Ciocalteau reagent 1 part in 10 with deionized water Always prepare this fresh daily
Procedure Measure all test samples (tomato and orange juices from Part 1) and
standards in duplicate To each tube add 225 μL water (which will serve as the control) or sample or epicatechin standard Then add 15 mL of diluted Folin-Ciocalteau reagent mix thoroughly and let set at room temperature for 7 minutes Add 15 mL of 7 (wv)
8 To elute is to separate or purify by washing out
Center for Authentic Science Practice in Education Spring 2008 31
sodium carbonate solution mix thoroughly and allow to sit for 30 min Read and record absorbance in a spectrophotometer with wavelength set at 750 nm Dispose of all solutions in the waste jar provided Cuvets can go in the trash
Post-Lab Calculations and Analysis of the Results Ascorbate Measurement by HPLC
The instrument lab will provide two pieces of information from your ascorbate analysis by HPLC The first will be a profile (similar to Fig 11) showing the elution of ascorbate from the HPLC column and the resolution of the peak from surrounding peaks You can use this to verify that the peak quantified as ascorbate was correct and that the quantification of the peak was not compromised by other peaks eluting in close proximity
Figure 11 Typical HPLC profiles for ascorbate separation and quantification (Top figure) Ascorbate standards at four different concentrations (Bottom figure) Orange juice at 110 and 1100 dilution
Center for Authentic Science Practice in Education Spring 2008 32
The upper figure in Fig 11 is an overlay profile showing an example of ascorbate
standards injected sequentially from low (~25microM) to high concentration (~200microM) The x-axis is time and the y-axis is absorbance at 268nm Notice that there are two peaks which elute sequentially from the column The first set of peaks is the flow-through containing material in the sample that is not retained by the column For these injections the acid (used to dilute the standards) is providing this response The second set of peaks eluting at 417 min corresponds to the ascorbate standard Notice the symmetrical shape perfect overlap and increasing size of the peak corresponding to the greater concentrations injected These observations provide a qualitative affirmation of the success of the ascorbate standards analysis This will be verified by the quantitative analysis that you will complete in the next section (Note you will get separate chromatograms for each sample they will not be overlayed like this figure)
The lower chromatogram in Fig 11 is an example of an overlay of the orange juice analysis Notice two major peaks are observed along with several smaller peaks not present in the chromatograms of the standards Notice the first peak the flow-through exhibits a relatively constant size which suggests that the solvent containing acid contributes to this peak Other components of the sample with absorbance at 268 nm may also be contributing to this peak The peak eluting at 417 min is a symmetrical peak that exhibits a larger peak area for 110 diluted sample and a much smaller peak area for the 1100 diluted sample The peak corresponding to 11000 is too small to be visible Since this peak elutes at the same time has the same shape and does not overlap with other adjacent peaks we assume it is ascorbate and will use the quantification of the area of this peak in comparison to the standard peak areas to determine the concentration of ascorbate in the juice samples The second piece of information that will be provided is a table with areas and retention times for each peak present in the chromatogram The absorbance values measured as the eluting sample passes through the UV detector are converted to an electronic signal in units of mV The computer program used to analyze the results will integrate the area under each peak and report it The example that follows is focused on the peak identified as ascorbate Table 4 and Table 5 below summarize this information for the standards and the two juice samples Table 4 Summary of HPLC peak integration and retention times for ascorbate standard
Sample Description Concentration Dilution Peak Area Retention TimeμM min
STND1 Ascorbate Standard 26125 5711390 4167STND2 Ascorbate Standard 52250 13732536 4167STND3 Ascorbate Standard 104500 27619134 4167STND4 Ascorbate Standard 209000 55852793 4167
Center for Authentic Science Practice in Education Spring 2008 33
Table 5 Summary of HPLC peak integration and retention times for juice samples
Sample Name Description Dilution Peak Area Retention Time1x min
AP10A Apple Juice 10 51632744 4167AP10B Apple Juice 10 53506976 4167AP100A Apple Juice 100 6339594 4167AP100B Apple Juice 100 5954836 4167AP1000A Apple Juice 1000 598612 4167AP1000B Apple Juice 1000 540179 4167
OR10A Orange Juice 10 35111848 4167OR10B Orange Juice 10 34649980 4167OR100A Orange Juice 100 3890611 41330R100B Orange Juice 100 3750404 4200OR1000A Orange Juice 1000 359440 4133OR1000B Orange Juice 1000 272837 4167 Use the graph function in Excel to evaluate the fit for the standard curve The example that follows illustrates a very good fit of the data to a linear regression
You can use the trend function in Excel to calculate the concentration of each
unknown sample Choose the dilutions of juice which fall into the range of the standard curve Once this is complete calculate the concentration of ascorbate in the juice by multiplying the concentration of each sample injected by the dilution factor
Table 5 does not include the 12 initial dilution of the juice samples and this should be accounted for in the calculation Thus for sample OR10A the calculation is
[Ascorbate in OJ] = (132μM) 20 volume juice dilutions1 volume juice
= 2640μM
The first value 132 μM comes from the graph in Fig 12 and its linear regression The concentration value corresponding to peak area for sample OR10A in Table 5 is 132 μM
Standard Curve for Ascorbate
y = 272324x - 950284R2 = 09997
000E+00
100E+07
200E+07
300E+07
400E+07
500E+07
600E+07
00 500 1000 1500 2000 2500
Concentration
Peak
Are
a
Figure 12 Ascorbate standard curve
Center for Authentic Science Practice in Education Spring 2008 34
The number 20 results because the OR10A sample is a 110th dilution and there was a 12 dilution in the procedure for the juice samples such that 12 x 110 = 120
Converting this concentration to a number that can be compared to the information given on the juice nutrition information label can be done as follows
Ascorbate FW = 17613 gbullmol-1 0240 L = 1 cup
ascorbate 6111or
11160ascorbate 1
ascorbate 131761
240juice 1
ascorbate 002640
cupmg
cupgmol
gcup
LLmol
=timestimes
The standard for food labels for vitamin C is 60 mg per serving The label on a
typical orange juice container indicates that the amount per cup is 120 of the RDA What do the data indicate about the amount of vitamin C in your juice sample Discuss explanations for any possible discrepancies you find
Which HPLC dilutions of juices produced usable results If you were to take another measurement what concentration should it be If you decide to use the HPLC method in your research (Part 4 of this module) it would be useful for you to know what dilutions produce usable results Furthermore some foods have more vitamin C than others so in the context of your research project you will want to think about the relative amount of vitamin C your food product has before deciding on dilution factors
Ascorbate Concentration Measurement by Titration Construct a standard curve for ascorbate plotting concentration versus volume of indophenol titration solution Determine the concentration for samples using the best fit straight line for the standards as described above Note that this method is much less sensitive than the HPLC method Total Polyphenolics
Construct a standard curve for epicatechin plotting concentration versus absorbance at 750 nm similar to the graph in Figure 11 Determine the concentration for samples using the best fit straight line for the standards in a similar way as for ascorbate described in the previous section How do these two juice samples compare in terms of the quantity of total phenolics Does this result differ from the ascorbate results
Post-Lab Questions and Analysis of Results a What is the purpose of using 5 acetic acid as a solvent for the ascorbate solution Why is it also needed as a solvent for the orange and apple juices b Did the dilutions used in this period produce usable results If not what changes can you make in the future to your dilutions to produce results that will be more valuable
Preparation for Next Week a There is substantial reading for the next period so give yourself ample time b Prepare your own unique experimental design based on the techniques you have learned Be prepared to dicuss your design and procedures
Center for Authentic Science Practice in Education Spring 2008 35
Laboratory 4 - 6 Original Research Project
Introduction In this laboratory period you will go through the process of hypothesis testing in
antioxidant research using an example of citrus fruits which are rich in vitamin C Science is the process by which we try to understand nature by continually testing our theories and refining explanations based on observation The scientific method is the means by which we try to make this process reliable and consistent Generally there are several key components observation and description of phenomena formulation of a hypothesis to explain the phenomena performance of experiments to test the hypothesis rejection or modification of a hypothesis inconsistent with experimental results and application of a validated hypothesis to explain new observations Observations can include descriptions but also quantifiable data which are useful because comparisons can be made and trends observed A hypothesis which explains observations must be testable and constructed to address one factor at a time Testable means that the hypothesis statement is written in a way that one can determine it to be incorrect by experimentation Experiments are procedures carried out generally involving an independent variable that is purposefully manipulated and a dependent variable that is observed or measured Good experimental design attempts to minimize the effect of bias on the results Several factors must be considered to be successful here These include a representative sample accuracy precision and reproducibility A representative sample is one that truly reflects and encompasses the independent and dependent variables Accuracy is how close a measured value is to the ldquotruerdquo or ldquorealrdquo value Precision is the spread in the data of repeated measurements or trials Reproducibility indicates that the results of an experiment are the same when repeated again at a later time or by another individual or research group This lab will apply the scientific method to a question about which chemical species is responsible for the total antioxidant activity that can be measured in one particular vitamin C-rich food
Pre-Lab Requirements You will need to prepare your own unique experimental design and procedure to share with your group during lab In addition look up any pertinent information about the products you are interested in studying to see if some tests would be more telling than others and design your experiment accordingly Plan ahead for the mixing of your ABTS+ as it will need to be made at least 12 hours but not more than 10 days before your next lab period
Finally think about the products you will be using with respect to the appropriate dilution factors What did you learn about dilutions from previous experiments that could be useful in determining where to start Are there dilutions that are too dilute or too concentrated when trying to use the line of concentration versus signal from your standards It may take more than one try to get the dilutions right
Overview of this Research Activity We have described many observations concerning oxidative stress its role in
health and protection by antioxidants in this module Also we have introduced various
Center for Authentic Science Practice in Education Spring 2008 36
types of antioxidants in foods and you have learned how to measure the total amount of antioxidant activity as well as the concentration of ascorbate a key nutrient antioxidant commonly found in foods Based on these observations we can formulate a hypothesis concerning total antioxidant activity in ascorbate-rich foods A testable hypothesis could be stated as follows ldquofruit samples stored at room temperature for a week will exhibit a 50 greater loss in antioxidant activity compared to similar samples stored at 4degCrdquo The techniques that you have learned so far TEAC HPLC or ascorbate titration and polyphenolics measurements can be used to assess this hypothesis The TEAC assay assesses total antioxidant activity HPLC the ascorbate titration and the polyphenolics measurements are more specific in their assessments Each of these methods can have a place in examining this hypothesis TEAC can evaluate changes in total antioxidant capacity while HPLC the ascorbate titration and the polyphenolics measurement can assess changes in specific flavonoid classes To isolate a specific variable it is important that as many other factors as possible be kept constant between the samples For this reason this experiment will require that the samples are drawn from the same batches of solution kept in the same kinds of vials either with or without parafilm (but the same for both conditions) and with the same amount of contact with sunlight and motion An example experimental design is as follows
bull Make solutions to be tested bull Measure antioxidant activity of the samples using TEAC and HPLC bull Fill two sets of identical amber vials one for room temperature one for 4degC bull Put parafilm on the vials bull Store the room temperature vials in a drawer to minimize contact with sunlight
and risk of being knocked over store 4degC vials in the refrigerator taking precautions if there is direct sunlight
bull Note the time bull 7 days later return and remove the samples at approximately the same time from
their conditions opening them in the same way bull Measure antioxidant activity of the samples using TEAC and HPLC bull Compare antioxidant activities and changes in antioxidant activity
What is Currently Known and Unknown About Antioxidants in Foods
A search of the peer-reviewed literature reveals many papers published that measure some indicator of total antioxidant activity in food and biological samples Because our focus is on health benefits I will use the example of PubMed the main government-financed database used by researchers in the health field to survey the literature If one does a search on PubMed using the search terms that describe total antioxidant activity (TEAC ORAC amp TRAP) 275 references are obtained (See Appendix B for tips and information about reading scientific research articles ndash itrsquos not as hard as it looks) When these terms are combined with the term ldquofoodrdquo 106 references are found Many of these papers report on total antioxidant activity of commonly consumed fruits and vegetables teas spices various grains food additives wine and chocolate Also some papers report analysis of uncommon plant parts which may have a basis in traditional medicine A few papers (not many) have been published testing the effects of processing storage or digestion of fruits and vegetables on antioxidant activity A few studies have explored the effects that mixing high antioxidant and high protein
Center for Authentic Science Practice in Education Spring 2008 37
foods has on total antioxidant activity Very few published reports have tested whether antioxidant-rich foods exhibit synergy whether more highly palatable foods containing fruits or vegetables exhibit antioxidant activity whether treatments that simulate the digestive process diminish antioxidant activity or whether common cooking methods (grilling boiling sauteacuteing in butter baking deep frying etc) significantly decrease antioxidant activity
Any of these questions is a valid research question to test for this module because there is not a lot of information available yet on them so you would be doing work that could contribute to the known research in this topic HOWEVER Dr Burgess is currently working on the antioxidants in green teas and in green tea drinks that are mixed with a juice that contains ascorbate (such as lemon juice) that can be found in many supermarkets and convenience stores He is particularly interested in what effects digestion (ie processing through the human digestive tract) has on the antioxidant capacity of these teas and whether the juice makes a difference in this process You can focus your efforts on this topic for now (See Appendix A for an in-lab procedure that simulates digestion)
Design and Conduct a Research Project on Antioxidants in Food Your goal is to design an experimental procedure that actually will test a
hypothesis Review the introduction to this laboratory to remind yourself about the use of controls and about reproducibility Also think about what you plan to test and what each of the techniques you learned in weeks 1-3 actually measures Do you need to use all of them for the hypothesis you want to test If not which one or which ones will you use and why
Once a research question has been agreed upon design an experimental protocol and discuss this as a group Think about the steps you will be taking and what you will do with your samples Consider and plan for the procedures timing etc that will be necessary for you to conduct a valid research study Consult with your peer leader andor TA about the research question that your group would like to address Review the recent peer-reviewed literature to help you refine your research questionhypothesis Refine your hypothesis or procedures if necessary ndash it is OK to do this when you do research
Write up the experimental procedures and a list of supplies Keep in mind that
your supplies will be limited to those that you have already used in laboratory periods 1-3 Some additional items can be provided as long as you include them in your list of supplies These additional items include blender hot plate cutting board The food items will be limited to those provided by your instructor (ask your instructor for a list) It may be possible for you to carry out research on food items that you provide You must check with your instructor to see if this will be allowed
For Laboratory Period 4 You should come to lab with an experimental procedure already in mind In lab you will meet and discuss this with your group and with your TA to finalize a procedure that you will work on for the next 3 lab periods
Center for Authentic Science Practice in Education Spring 2008 38
Your Contribution to the Research of Dr Burgess This portion of the module will culminate with data that you can give to the researcher thus contributing your work to the body of research Keep in mind that Dr Burgess would like to be able to use your data for publication Therefore you should conduct and report your experimental procedures and results carefully For this module you will provide data that includes the following things
bull Your hypothesis for your research bull Detailed protocol of your experimental design for testing your hypothesis
including the specific food products researched and the conditions to which they were subjected
bull List of tests performed and procedures carried out bull Results of the tests such as numerical values and copies of your spectra
You will be provided with detailed instructions on how to enter your data into a web-based form that will be sent to Dr Burgess in electronic form Be sure to label your data (and all your samples) sufficiently (your group name or number will not mean much to the researcher so include information about what you studied and when the study was performed and what the data or sample is)
Most of all have fun
Center for Authentic Science Practice in Education Spring 2008 39
Appendix A Procedure to Simulate Digestion
Example of a Test Question will green tea with lemon preserve antioxidant activity of tea through simulated digestive process Ingredients Lemon Juice Freshly brewed green tea ndash two 250 mL cups Sample Preparation
a green tea as prepared (brewed) b green tea with 2 Tbsp (or around 5-6 mL) of lemon juice per cup c water with 2 Tbsp (or around 5-6 mL) of lemon juice (as a control)
Reserve 25mL in an amber bottle for TEAC and polyphenolics Samples must be tested for ascorbate immediately Each preparation must be filtered through 1μm filter diluted and put into HPLC vials
Set aside another 10mL of each treatment for BurgessFerruzzi test follow-up Label these as pre-digested or undigested samples and store in freezer Labeled boxes will be available for students to put their samples in In vitro digestion protocol (Note If tea is freshly brewed it must be cooled to room temperature to measure the pH You can cool by putting in an ice bath and monitoring the temperature as it drops)
1 30 mL of each test mixture to be tested should be transferred to an 125mL Erlenmeyer flask Wrap the flask with a single layer of aluminum foil to protect the solution from light (Consider whether you will have time for duplicates Will this help with the reproducibility of your experiment)
2 check the pH of your mixture and if it is above 25 adjust the pH to 25 by the dropwise addition of 10 M HCL
3 add 20 mL of porcine pepsin mixture (40 mgmL in 01 M HCl supplied) 4 flush the flask with nitrogen and stopper 5 transfer mixture to shaking water bath at 37oC and incubate for 15 min at 95 rpm 6 next raise the pH of mixture to 50 by the addition of 20-25 mL of 09 M sodium
bicarbonate 7 add 9 mL pancreatin enzyme mix (20 mgmL in 01 M sodium bicarbonate
supplied) and mix 8 increase pH of mixture to 65 by the addition of 1M sodium hydroxide dropwise 9 flush with nitrogen and stopper tightly 10 incubate at 37oC with shaking for 45 min 11 filter the mixture using a Buchner funnel and P5 filter paper 12 Transfer two 20 mL aliquots of the filtrate to new tubes labeled (post digestion)
Burgess lab for potential follow-up catechin quantification Transfer the remaining filtrate to a clean tube for analysis the following week Store all of these samples in the freezer
After Digestion TEAC and polyphenolic assay should be performed on each sample Compare Results of TEAC after simulated digestion versus before to determine potential impact of lemon on green tea antioxidant Dilution factor will need to be considered in beforeafter comparison
Center for Authentic Science Practice in Education Spring 2008 40
Appendix B Reading and Interpreting a Research Paper A Paper about Processing Effects on Antioxidants in Food Sources
Consider the paper cited below (published in 2005) testing the effects of fermentation and heat treatment on the antioxidant activity of cowpea flours The purpose of reviewing this paper is not to get bogged down in the details but to review the key characteristics of a study design Hopefully this will help you to develop your research question and design your own study using the tools and skills you have learned so far in this module Doblado R H Zielinski et al (2005) Effect of processing on the antioxidant vitamins and antioxidant capacity of Vigna sinensis Var Carilla J Agric Food Chem 53(4) 1215-22 Cowpea (Vigna sinensis L var Carilla) flours were obtained by fermentation with inoculum Lactobacillus plantarum (PF) or with the natural microorganisms present in the flour (NF) and subsequently heat treated in an autoclave The flours were prepared to study the effect of fermentation on the antioxidant vitamin content and on the antioxidant capacity Bacterial counts and pH values vitamins C and E carotenoids glutathione (GSH) superoxide dismutase-like activity (SOD-like activity) peroxyl radical-trapping capacity (PRTC) lipid peroxidation in unilamillar liposomes and Trolox equivalent antioxidant capacity (TEAC) were evaluated in raw and processed cowpea flours Gamma-Tocopherol and delta-tocopherol were found in raw cowpea whereas vitamin C and carotenoids were not detected An increase in the vitamin E activity was observed in PF whereas vitamin C and carotenoids were not detected in fermented cowpea flours Fermentation or heat treatment in an autoclave after fermentation produced processed cowpea flours with lower PRTC glutathione content and SOD-like activity than those of the raw seeds However those processes increased the capacity to inhibit the lipid peroxidation in unilamellar liposomes and TEAC According to the results obtained in this study the fermentation of cowpeas (naturally or with L plantarum) and fermentation and subsequent heat treatment in an autoclave are good processes to obtain functional cowpea flours having higher antioxidant capacity than the raw legume What is the main question addressed in this paper Answer What is the effect of fermentation and subsequent heat treatment on the antioxidant activity present in a bean flower (cowpea) Why is this important Answer
bull Antioxidant capacity is an aspect of food that may provide health benefits bull Cowpea a staple of many cultures especially those in the developing world bull Fermentation is believed to improve nutritional quality of processed legume food
products and several examples (soy sauce tempeh miso natto etc) are now being consumed more commonly in the West
bull Heat treatment after fermentation is used to reduce antinutritional factors derived from this legume
Center for Authentic Science Practice in Education Spring 2008 41
bull Cowpea is a type of legume which possesses many nutritional and health promoting properties but its antioxidant activity has not been characterized
What was the hypothesis that the authors tested Answer The authors did not clearly state a hypothesis but based on the extensive introductory material one could write a hypothesis statement for this research Wersquoll call this an implied hypothesis Fermentation will improve the antioxidant capacity of cow pea flour How was the research question addressed Answer
bull Measurements were taken of the sample of interest before the treatment bull Each step in the process of preparing the final product was analyzed ie raw
seeds flour fermentation (two alternatives were tested) and heat treatment by autoclaving
bull Enough replications (trials) were conducted to do statistical analysis bull Multiple tests were conducted to improve confidence in the results These
included o Measurement of the concentration of four-six different antioxidants in each
sample o Using three different methods to estimate total antioxidant capacity
bull Careful attention was paid to the completeness of the methods used An example of this is table 5 in which the authors carefully extracted the sample with multiple solvents starting by using a very hydrophilic solvent and ending with a very hydrophobic solvent Each extract was then tested for antioxidant capacity
What was the interpretation of the results Answer Fermentation of cow pea flours increased antioxidant capacity as indicated by two of the methods used but decreased this capacity as measured by a third The effect of heat treatment by autoclaving the fermented products resulted in variable effects (increase or decrease) depending on the method of measurement Both fermentation and heat treatment decreased the concentration of the known antioxidant nutrients (tocopherols and glutathione) in the cow pea flour The implication here is that other non-quantified components in the cow peas is responsible for the antioxidant activity and that some of these compounds actually increase in concentration due to fermentation and possibly heat treatment The authors of the paper discuss this idea and refer to other published work that implicates certain flavonoid species The authors conclude ldquoAccording to the results obtained in this study the fermentation of cowpeas (naturally or with L plantarum) and fermentation and subsequent heat treatment in an autoclave are good processes to obtain functional cowpea flours having higher antioxidant capacity than the raw legumerdquo
Center for Authentic Science Practice in Education Spring 2008 42
Appendix C Preparation Techniques for Different Foods
Methods for Extraction of Food Using Homogenization Precipitation and Extraction to Obtain Experimental Samples for Study Obtaining a representative sample is key to conducting a valid experiment to test a hypothesis Many food samples are quite complex mixtures of material possessing both characteristics of solutions and colloids It can be quite difficult to obtain a representative sample from a whole food Below are listed several sample preparation protocols that can help guide you in obtaining adequate representative samples for your research project The emphasis is on obtaining samples with good recovery of the more water-soluble antioxidant compounds including most of the flavonoids Although the TEAC assay has been tested on fat-soluble antioxidants its use for testing these compounds is much less common Some sample protocols follow General Supplies
bull Knife bull Cutting board bull Cheesecloth bull Syringe and syringe filters bull 5 acetic acid with 035 mM TCEP bull Ethanol 100 bull Filter paper bull Hot plates bull 5 stoppers bull Aluminum foil bull Shakeroven bull pH meter bull Nitrogen gas source
Spices and Herbs
Weigh a little more than 10g of sample and grind (even if using pre-ground) in mortar with pestle Carefully weigh 10g and dissolve in 100mL of appropriate solvent If you are unsure whether yoursquore isolating a water soluble or insoluble antioxidant or both divide the sample and dissolve 5g in 50mL of buffer and the other 5g in 50mL of ethanol Stir sample mixture with magnetic stirrer for 30-60 minutes After stirring centrifuge the sample for fifteen minutes Decant and perform syringe filtration on the supernatant Make dilutions for testing multiple dilutions over a large range will maximize the possibility that one of the dilutions will fall in the range of the standard curve Dried Frozen and Canned Fruits
Drain the fruit with cheesecloth if needed Weigh a little more than 10g of sample and cut it into small pieces as necessary Carefully weigh 10g and dissolve in 100mL of appropriate solvent If you are unsure whether youre isolating a water soluble
Center for Authentic Science Practice in Education Spring 2008 43
or insoluble antioxidant or both divide the sample and dissolve 5g in 50mL of buffer and the other 5g in 50mL of ethanol Blend in blender for 30-60 seconds Stir sample mixture with magnetic stirrer for 30-60 minutes After stirring centrifuge the sample for fifteen minutes Decant and vacuum filter supernatant Perform syringe filtration on the filtrant Make dilutions for testing multiple dilutions over a large range will maximize the possibility that one of the dilutions will fall in the range of the standard curve
Dry Solid Sample Preparation
Pulverize ~10g of sample using a mortar and pestle
If isolating water soluble antioxidantsDissolve 10g in 100 mL of acetic acid buffer
Stir with magnetic stir rod 30-60 min or until dissolve(whichever comes first)
If isolating water insoluble antioxidantsDissolve 10g in 100 mL of 100 ethanol
Stir with magnetic stir rod 30-60 min or until dissolved(whichever comes first)
Centrifuge for 15 minutes
Decant supernatant into beaker
For HPLC onlyPerform syringe filtration on supernantant
Dilute in acetic acid buffer or ethanolPerform appropriate tests
Remember to run standards for comparison
Dietary Supplements Dried Herbs and Spices
Center for Authentic Science Practice in Education Spring 2008 44
High Moisture Food Sample Preparation
Weigh 10g of sample
If isolating water soluble antioxidantsBlend sample with 110 ww acetic acid buffer
Blend for 30-60 seconds
If isolating water insoluble antioxidantsBlend sample with 110 ww 100 ethanol
Blend for 30-60 seconds
Stir sample with magnetic stir rod 30-60min
Decant and filter supernatant using vacuum filtration
Dilute filtrate with either acetic acid buffer or ethanolPerform appropriate tests
Remember to run standards for comparison
For HPLC onlyPerform syringe filtration on filtrant
Centrifuge sample for 15 minutes
Cut into small pieces as necessary
Drain food in cheesecloth if necessary
Fresh Frozen or Canned Fruits and Vegetables
Center for Authentic Science Practice in Education Spring 2008 45
Liquid Food Sample Preparation
If isolating water soluble antioxidantsDilute 11 with acetic acid buffer
Mix well
If isolating water insoluble antioxidantsDilute 11 with 100 ethanol
Mix well
If juice has large particulate matterCentrifuge 5 minutes decant
Centrifuge supernatant 15 min if not clear
If juice has small particulate matterCentrifuge 15 minutes
For HPLC onlyDecant perform vacuum filtrationPerform syringe filtration on fitrate
Dilute supernatant in acetic acid buffer or ethanolPerform appropriate tests
Remember to run standards for comparison
Juice and Tea
Center for Authentic Science Practice in Education Spring 2008 46
Acknowledgements The author would like to extend appreciation to S Messenger and J Andrade for conducting experiments and procedures to test the methods included in this module and for extensive help in preparing the initial drafts Sincere appreciation is extended to C Russell and G Weaver for extensive intellectual input into the design and construction of this module and for thorough editing of the document The author is also grateful to A Bentley and W Fornes for editing the document and providing additional information Bibliography Doblado R H Zielinski et al (2005) Effect of processing on the antioxidant vitamins and antioxidant capacity of Vigna sinensis Var Carilla J Agric Food Chem 53(4) 1215-22 Lykkesfeldt J Loft S Poulsen HE (1995) Anal Biochem Aug 10229(2)329-35 Re R N Pellegrini et al (1999) Antioxidant activity applying an improved ABTS radical cation decolorization assay Free Radic Biol Med 26(9-10) 1231-7 Silberberg (2003) Chemistry The molecular nature of matter and change 3rd Edition Wang H G Cao et al (1996) Total Antioxidant Capacity of Fruits J Agric Food Chem 44(3) 701 -705