PHYTOMONITORING™ in CROP GROWTH CONTROL Tomatoes Tomatoes Application of Application of the the Phytomonitoring Phytomonitoring techniques techniques for for adjustment and adjustment and validation of validation of climate and climate and irrigation irrigation regimes regimes Phytech Ltd. Phytech Ltd.
Transcript
PHYTOMONITORING™ in CROP GROWTH CONTROL
TomatoeTomatoess
Application of the Application of the Phytomonitoring Phytomonitoring
techniquestechniques for for
adjustment and adjustment and validation of validation of climate and climate and
irrigation regimesirrigation regimes
Phytech Ltd.Phytech Ltd.
PHYTOMONITORING™ in CROP GROWTH CONTROL
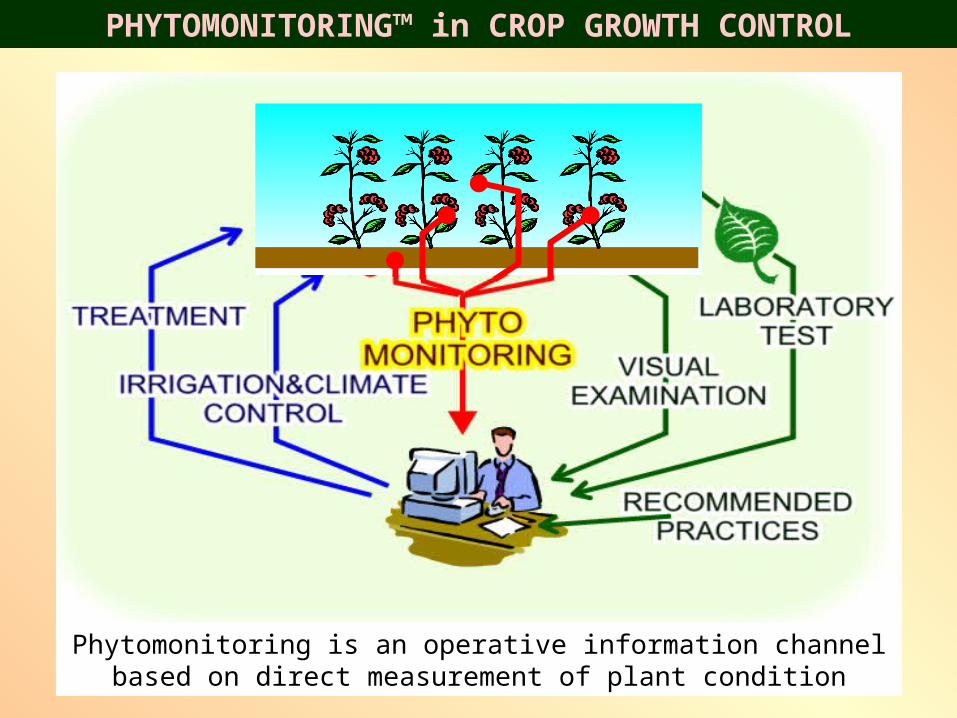
Phytomonitoring is an operative information channel based on direct measurement of plant condition
PHYTOMONITORING™ in CROP GROWTH CONTROL
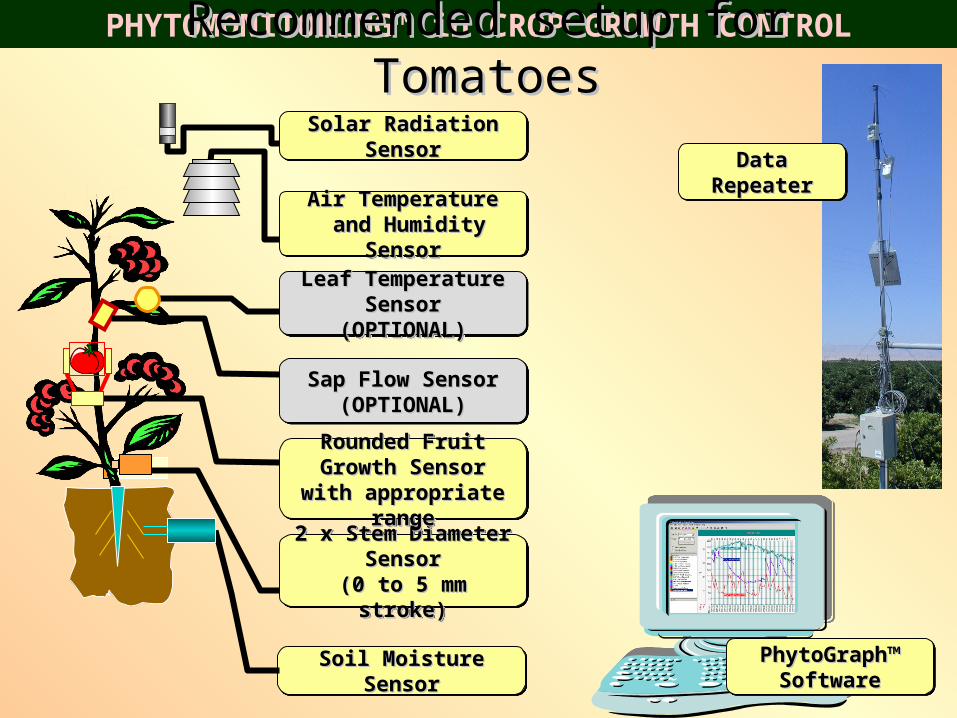
Air TemperatureAir Temperature and Humidity Sensorand Humidity Sensor
Air TemperatureAir Temperature and Humidity Sensorand Humidity Sensor
Data RepeaterData RepeaterData RepeaterData Repeater
Recommended setup for Recommended setup for TomatoesTomatoes
PhytoGraph™ PhytoGraph™ SoftwareSoftware
PhytoGraph™ PhytoGraph™ SoftwareSoftware
2 x Stem Diameter Sensor2 x Stem Diameter Sensor(0 to 5 mm stroke)(0 to 5 mm stroke)
2 x Stem Diameter Sensor2 x Stem Diameter Sensor(0 to 5 mm stroke)(0 to 5 mm stroke)
Solar Radiation SensorSolar Radiation SensorSolar Radiation SensorSolar Radiation Sensor
Sap Flow SensorSap Flow Sensor(OPTIONAL)(OPTIONAL)
Sap Flow SensorSap Flow Sensor(OPTIONAL)(OPTIONAL)
Leaf Temperature SensorLeaf Temperature Sensor(OPTIONAL)(OPTIONAL)
Leaf Temperature SensorLeaf Temperature Sensor(OPTIONAL)(OPTIONAL)
Rounded Fruit Growth Rounded Fruit Growth SensorSensor
with appropriate rangewith appropriate range
Rounded Fruit Growth Rounded Fruit Growth SensorSensor
with appropriate rangewith appropriate range
PHYTOMONITORING™ in CROP GROWTH CONTROL
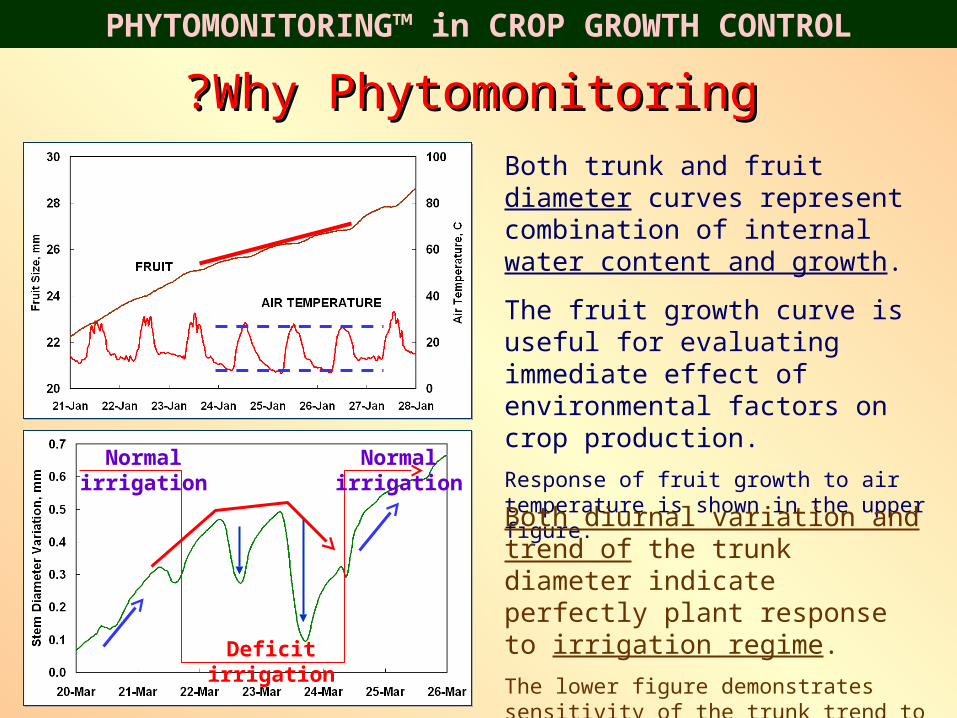
Why PhytomonitoringWhy Phytomonitoring??Both trunk and fruit diameter curves represent combination of internal water content and growth.
The fruit growth curve is useful for evaluating immediate effect of environmental factors on crop production.
Response of fruit growth to air temperature is shown in the upper figure. Both diurnal variation and trend of the trunk diameter indicate perfectly plant response to irrigation regime.
The lower figure demonstrates sensitivity of the trunk trend to the deficit irrigation.
Normal irrigation
Deficit irrigation
Normal irrigation
PHYTOMONITORING™ in CROP GROWTH CONTROL
Greenhouse Tomatoes:Greenhouse Tomatoes: The use of the phytomonitoring in climate The use of the phytomonitoring in climate
and irrigation control practice and irrigation control practice
Adjustment of the irrigation schedule Adjustment of the irrigation schedule Excess of salinity: diagnostics and Excess of salinity: diagnostics and
elimination elimination Control of growth rate by air temperature.Control of growth rate by air temperature.
PHYTOMONITORING™ in CROP GROWTH CONTROL
Adjustment of Adjustment of the the irrigation scheduleirrigation schedule ( (Example 1Example 1))
Probable cause: Lack of water
Trial action: Increased irrigation rate since March 14
Call for measures:
1. Downturn of stem diameter trend on 3rd day after watering.
2. Deceleration of fruit growth on 4th day after watering.
3. Instant response of stem diameter to the last watering
1
3
2
1
Soil moisture is not scaled
PHYTOMONITORING™ in CROP GROWTH CONTROL
Conclusion: Positive effect of new irrigation regime
1
3
2
1
Results of the trial :•Increase of soil moisture minimal level
•No downturns of stem and fruit growth curves between waterings
•No instant response of stem diameter to irrigation
Soil moisture is not scaled
Adjustment of Adjustment of the the irrigation scheduleirrigation schedule ( (Example 1Example 1))
PHYTOMONITORING™ in CROP GROWTH CONTROL
Adjustment of Adjustment of the the irrigation scheduleirrigation schedule ( (Example 2Example 2))
Probable cause: Lack of water
Trial action: Increased irrigation rate since February 1
Call for measures:• Downturn of stem diameter trend on
2nd day after watering in humid air conditions.
PHYTOMONITORING™ in CROP GROWTH CONTROL
Adjustment of Adjustment of the the irrigation scheduleirrigation schedule ( (Example 2Example 2))
Conclusion: Positive effect of new irrigation regime
Results of the trial :•Increase of soil moisture minimal level
•Uptrend of stem diameter and fruit growth
0.15 mm/day
0.29 mm/day
PHYTOMONITORING™ in CROP GROWTH CONTROL
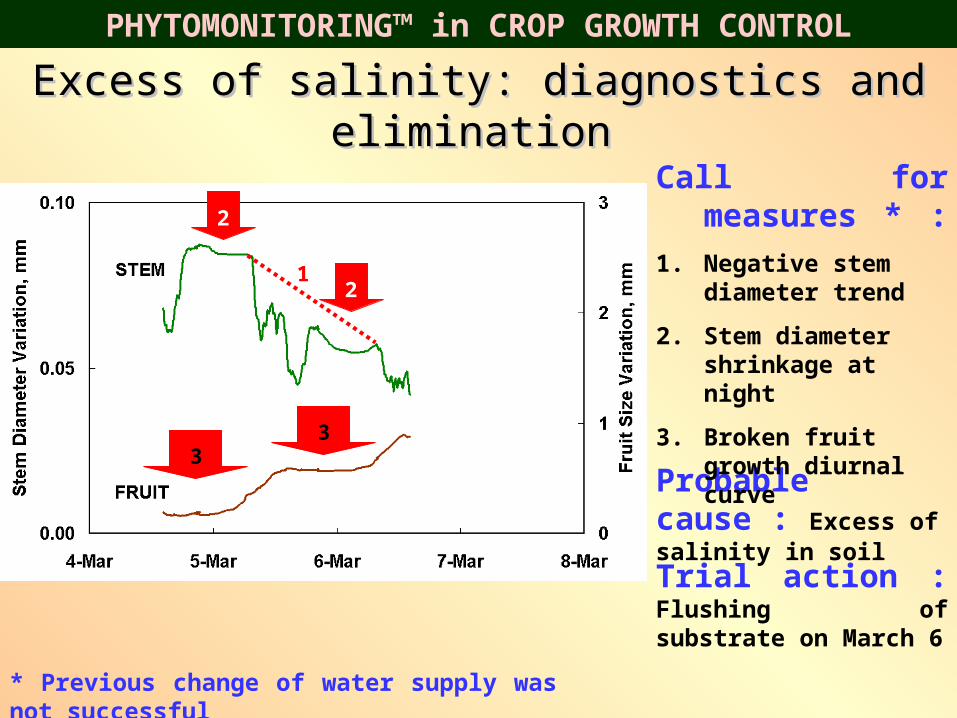
Excess of salinity: diagnostics and Excess of salinity: diagnostics and eliminationelimination
Probable cause : Excess of salinity in soil
Trial action : Flushing of substrate on March 6
Call for measures * :
1. Negative stem diameter trend
2. Stem diameter shrinkage at night
3. Broken fruit growth diurnal curve
1
2
2
33
* Previous change of water supply was not successful
PHYTOMONITORING™ in CROP GROWTH CONTROL
Excess of salinity: diagnostics and Excess of salinity: diagnostics and eliminationelimination
1
2
2
33
* Previous change of water supply was not successful
FLUSHING Results of the trial : •Uptrend of stem diameter
•Stem diameter continual growth at night
•Continual fruit growth
Conclusion : Flushing was favourable.
PHYTOMONITORING™ in CROP GROWTH CONTROL
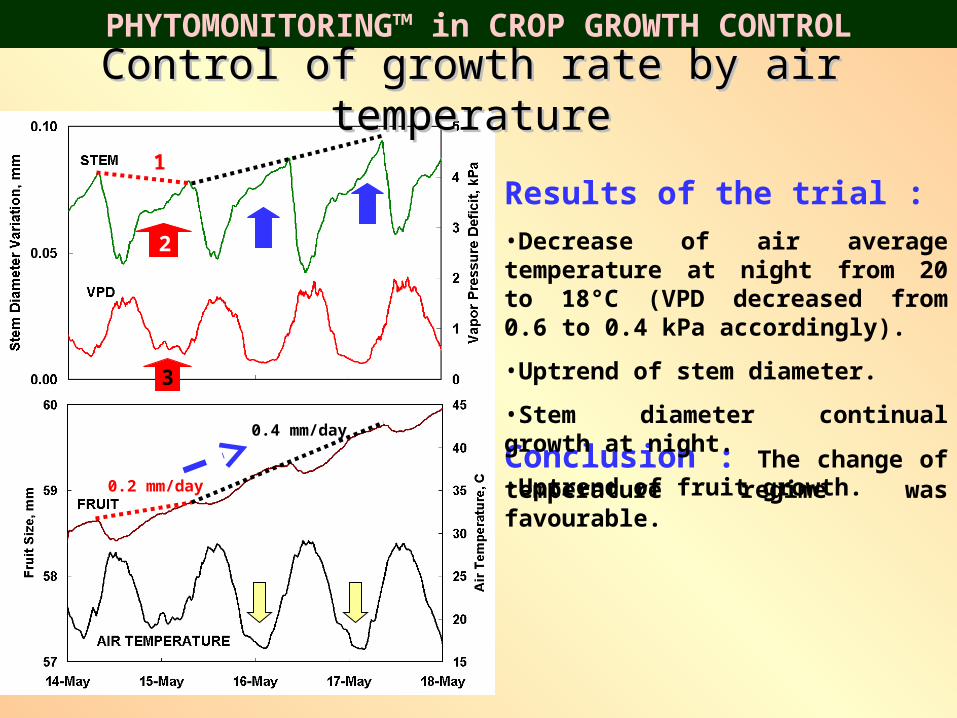
Control of growth rate by air temperatureControl of growth rate by air temperature
Probable cause : Air drought at
nighttime, probably caused by too intensive heating at night.
Trial action : Decrease of heating at night
Call for measures:
1. Negative stem diameter trend
2. Stem diameter growth depression at night
3. Dry air conditions at night
1
3
2
PHYTOMONITORING™ in CROP GROWTH CONTROL
Control of growth rate by air temperatureControl of growth rate by air temperature
3
Conclusion : The change of temperature regime was favourable.
Results of the trial : •Decrease of air average temperature at night from 20 to 18°C (VPD decreased from 0.6 to 0.4 kPa accordingly).
•Uptrend of stem diameter.
•Stem diameter continual growth at night.
•Uptrend of fruit growth.
0.2 mm/day
0.4 mm/day
1
2
PHYTOMONITORING™ in CROP GROWTH CONTROL
Summary:Summary: • The recommended PhyTalk Decision-Support unit (DSU) for greenhouse tomatoes includes the following sensors:
• 2 x Stem diameter sensors (0-5 mm stroke)• 1 x Fruit growth sensor • 1 x Leaf temperature sensor (optional)• 1 x Sap flow sensor (optional)• 1 x Solar radiation sensor• 1 x Soil moisture sensors• 1 x Air Temperature and Humidity Sensor
This DSU allows the following:
• Adjusting irrigation schedule
• Diagnostics and elimination of excess of salinity
• Control of growth rate by air temperature
PHYTOMONITORING™ in CROP GROWTH CONTROL
Economic benefits:Economic benefits:
• Yield of tomato plants strongly depend on proper irrigation regime, which can be fine-tined with the use of Phytomonitoring.
•Detection and prevention of developing salinity stress is essential for saving yield. Even moderate salinity stress (EC<5.5 dS/m) may cause a 12% loss of yield (Pasternak and De Malach, 1987)
•Direct control of plant growth rate allows to validate optimal temperature regime in greenhouse and, consequently, to provide optimal efficiency of plant growing