25
Phytoplankton and nutrient dynamics in a vortex off Western Australia Paterson, H. L. 1 , Waite, A. M. 1 , Thompson, P. 2 1 The University of Western Australia, 2 CSIRO Marine Research
Phytoplankton and nutrient dynamics in a vortex off Western AustraliaPaterson, H. L.1, Waite, A. M.1, Thompson, P. 2
1 The University of Western Australia, 2 CSIRO Marine Research
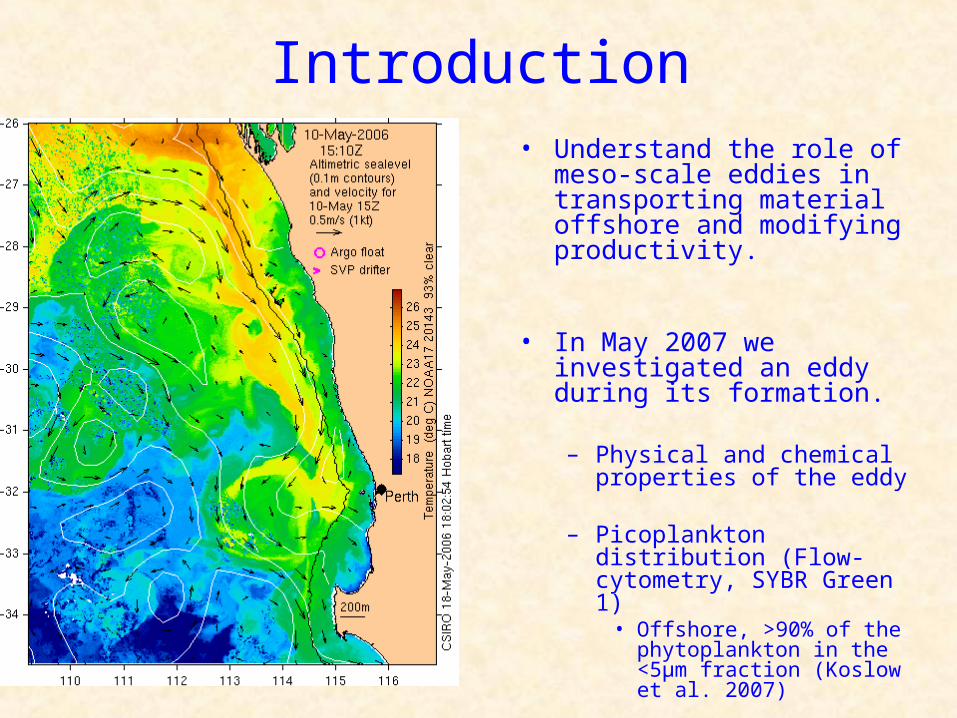
Introduction• Understand the role of meso-
scale eddies in transporting material offshore and modifying productivity.
• In May 2007 we investigated an eddy during its formation.
– Physical and chemical properties of the eddy
– Picoplankton distribution (Flow-cytometry, SYBR Green 1)
• Offshore, >90% of the phytoplankton in the <5µm fraction (Koslow et al. 2007)
Picture
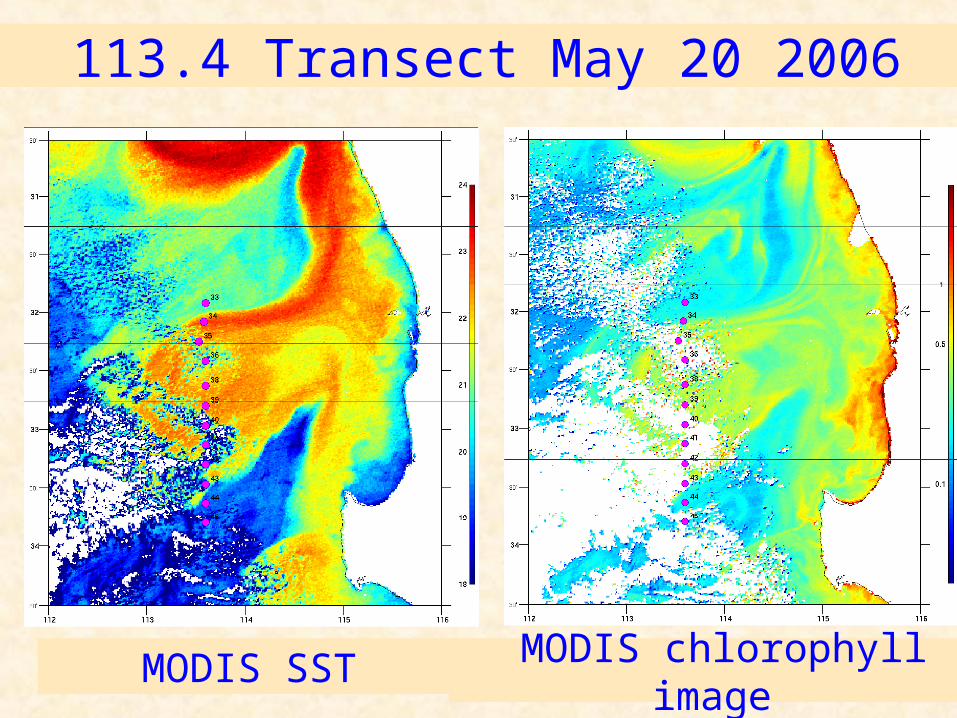
113.4 Transect May 20 2006
MODIS SST MODIS chlorophyll image
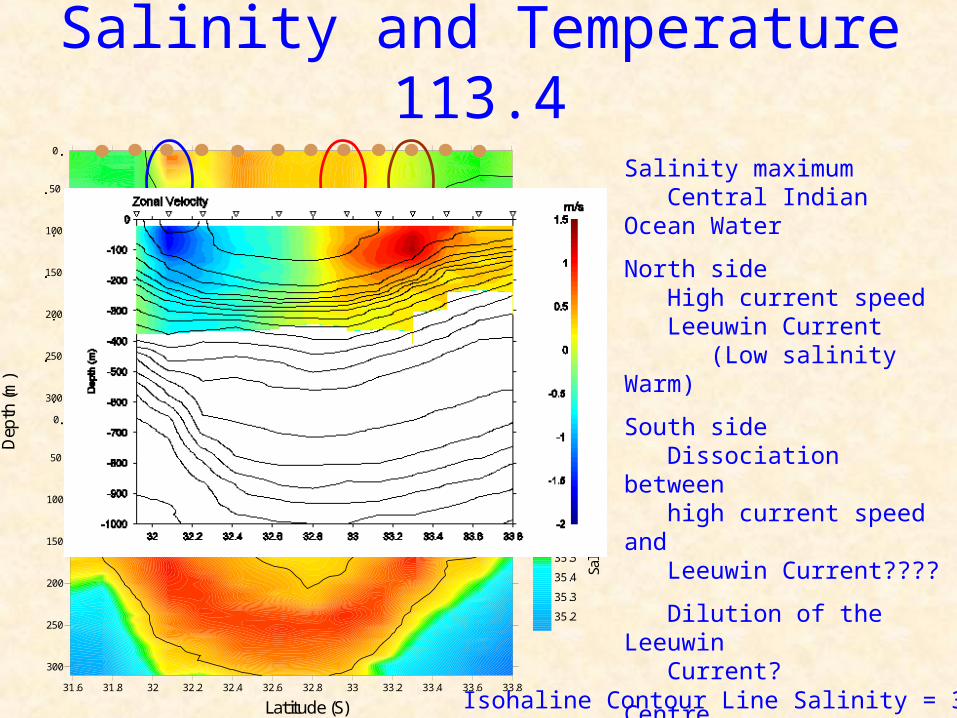
Salinity and Temperature 113.4
35.2
35.3
35.4
35.5
35.6
35.7
35.8
35.9
31.6 31.8 32 32.2 32.4 32.6 32.8 33 33.2 33.4 33.6 33.8
300
250
200
150
100
50
0
300
250
200
150
100
50
0
22
23
21
20
19
18
17
16
Dep
th (m
)
Latitude (S)
S alin
i ty
(PSU
)Te
mpe
ratu
re ̊C
Salinity maximum Central Indian Ocean Water
North side High current speed Leeuwin Current (Low salinity Warm)
South side Dissociation between high current speed and Leeuwin Current????
Dilution of the Leeuwin Current?
Centre Gradient across body of eddy
Isohaline Contour Line Salinity = 35.65
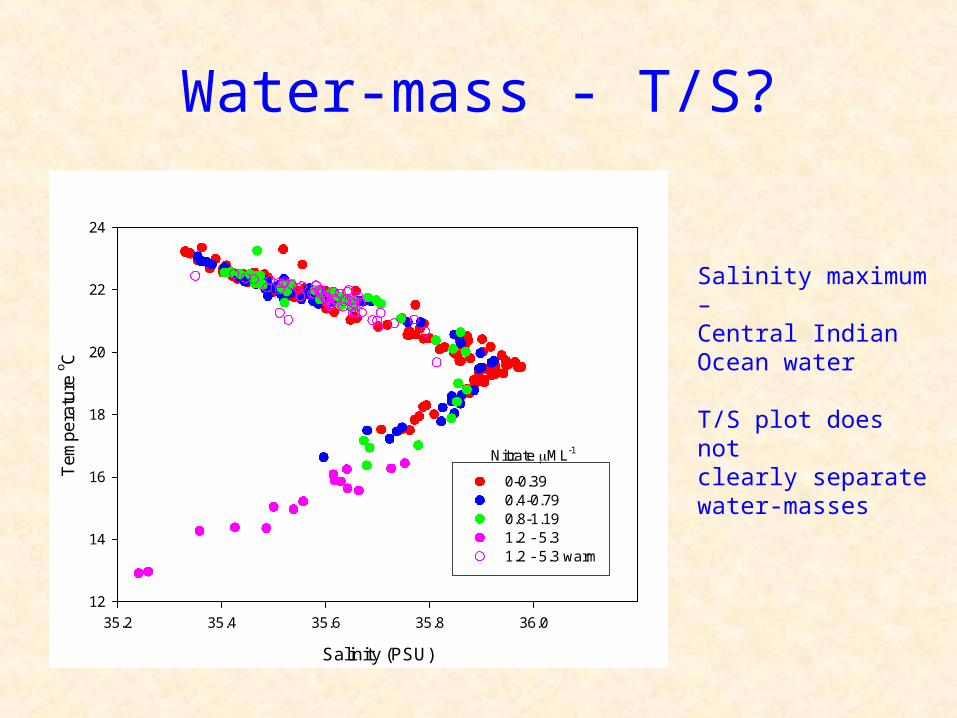
Water-mass - T/S?
Salinity (PSU)
35.2 35.4 35.6 35.8 36.0
Tem
pera
ture
o C
12
14
16
18
20
22
24
0-0.390.4-0.790.8-1.191.2 - 5.31.2 - 5.3 warm
Nitrate ML-1
Salinity maximum – Central Indian Ocean water
T/S plot does not clearly separatewater-masses
15
16
17
18
19
20
21
22
23
24
35.2 35.3 35.4 35.5 35.6 35.7 35.8 35.9 36
Salinity
Tem
per
atu
re º
C
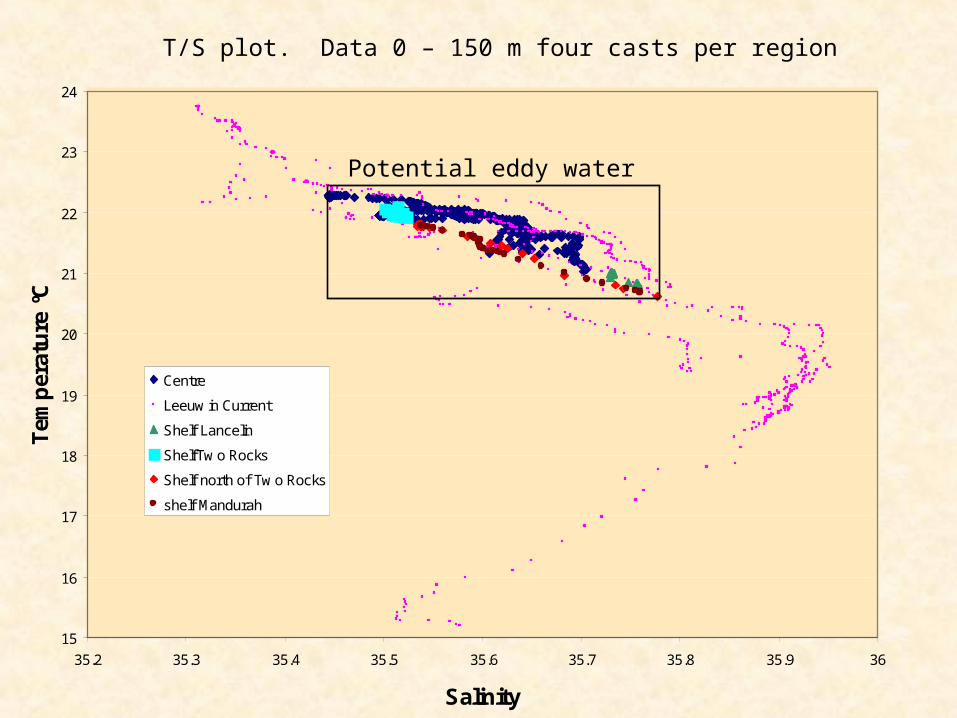
Centre
Leeuw in Current
Shelf Lancelin
ShelfTw o Rocks
Shelf north of Tw o Rocks
shelf Mandurah
Potential eddy water
T/S plot. Data 0 – 150 m four casts per region
112.5 113 113.5 114 114.5 115 115.5 116
-33.5
-33
-32.5
-32
-31.5
-31
0
0.1
0.2
0.3
0.4
0.5
0.6
0.7
0.8
0.9
1
1.1
1.2
Longitude
Latit
ude
Nitr
ate
µM L
-1
112.5 113 113.5 114 114.5 115 115.5 116
-33.5
-33
-32.5
-32
-31.5
-31
1.5
2
2.5
3
3.5
4
4.5
Longitude
Latit
ude
Silic
ate
µM L
-1
Silicate M L-1
0 1 2 3 4 5
Nitr
ate
M L
-1
0
1
2
3
4
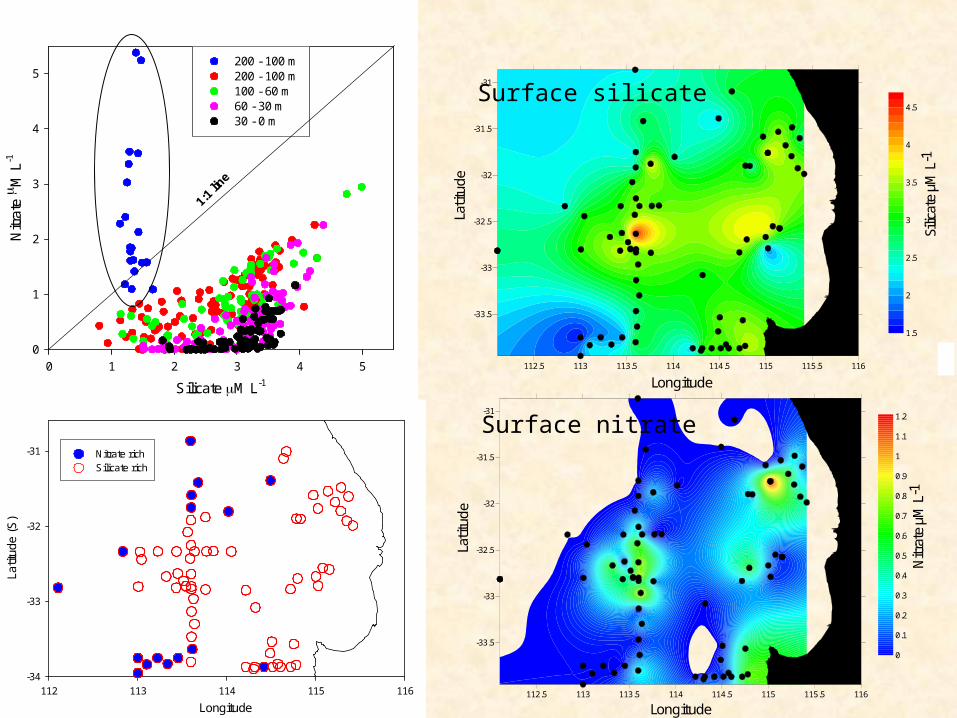
5200 - 100 m200 - 100 m 100 - 60 m 60 - 30 m 30 - 0 m
1:1
line
Longitude
112 113 114 115 116
Latit
ude
(S)
-34
-33
-32
-31 Nitrate richSilicate rich
Surface silicate
Surface nitrate
32 32.2 32.4 32.6 32.8 33 33.2 33.4 33.6
300
250
200
150
100
50
1.2
2
2.8
3.6
4.4
31.6 31.8 32 32.2 32.4 32.6 32.8 33 33.2 33.4 33.6 33.8
0
6
5
4
3
2
1
0
300
250
200
150
100
50
0
Latitude (S)
Dep
th (m
)
Nitr
ate
µmL-
1Si
licat
e µm
L
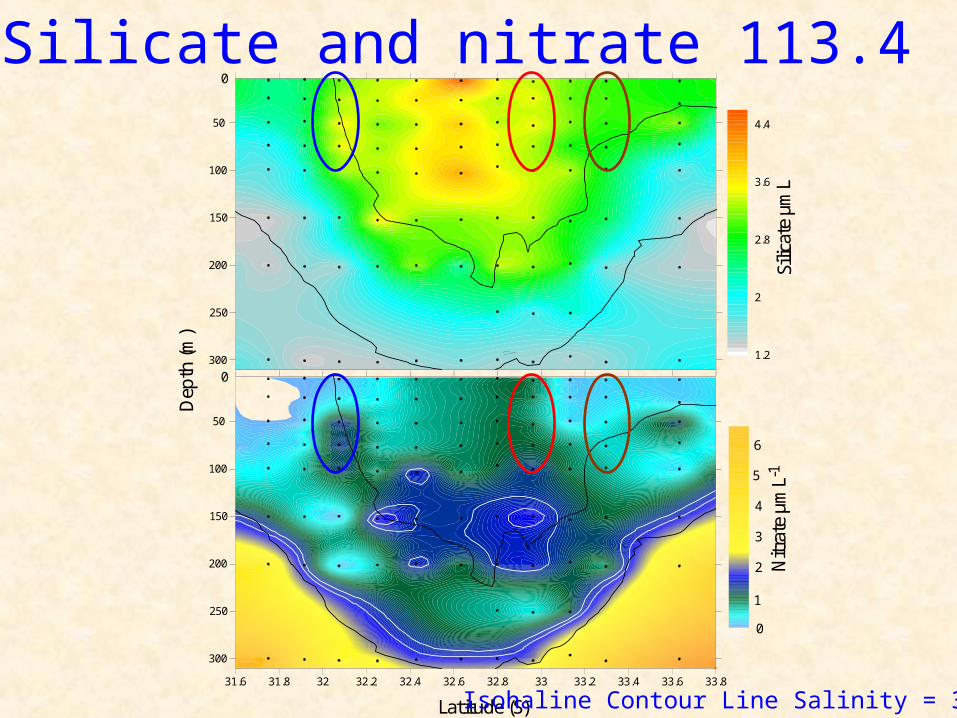
Isohaline Contour Line Salinity = 35.65
Silicate and nitrate 113.4
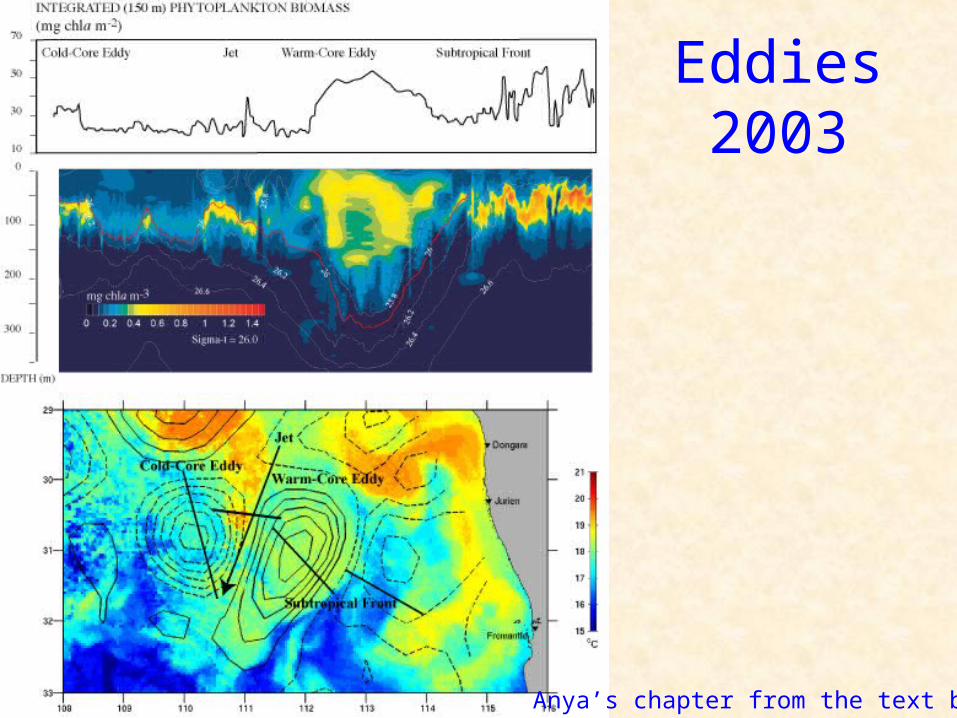
Eddies 2003
Anya’s chapter from the text book
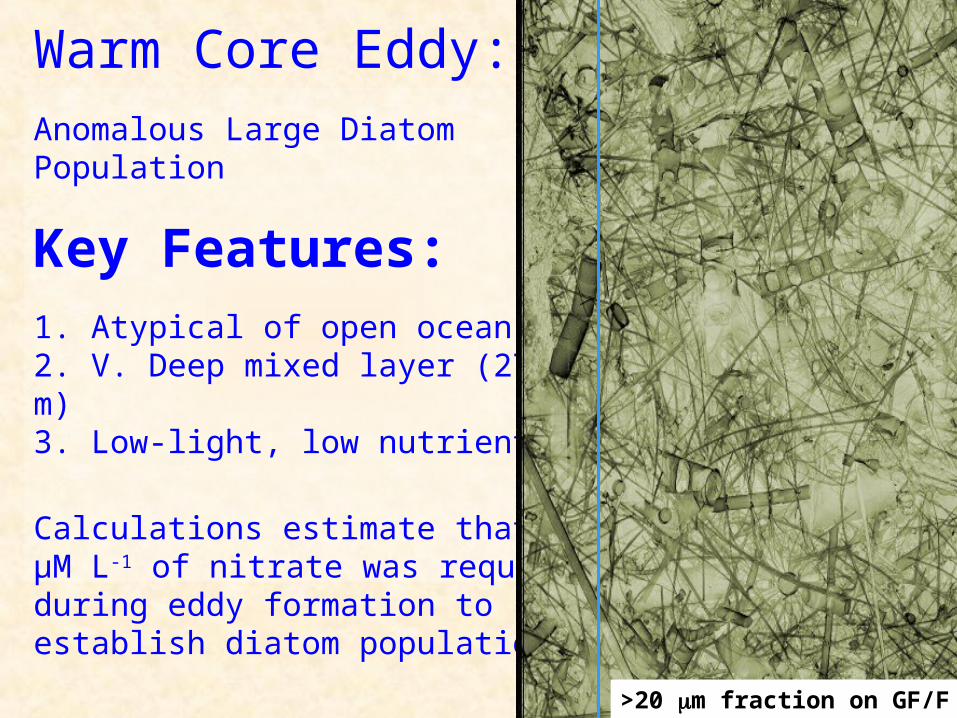
Warm Core Eddy: Anomalous Large Diatom Population
Key Features:1. Atypical of open ocean2. V. Deep mixed layer (275 m)3. Low-light, low nutrient
Calculations estimate that >1 μM L-1 of nitrate was required during eddy formation to establish diatom population
>20 m fraction on GF/F
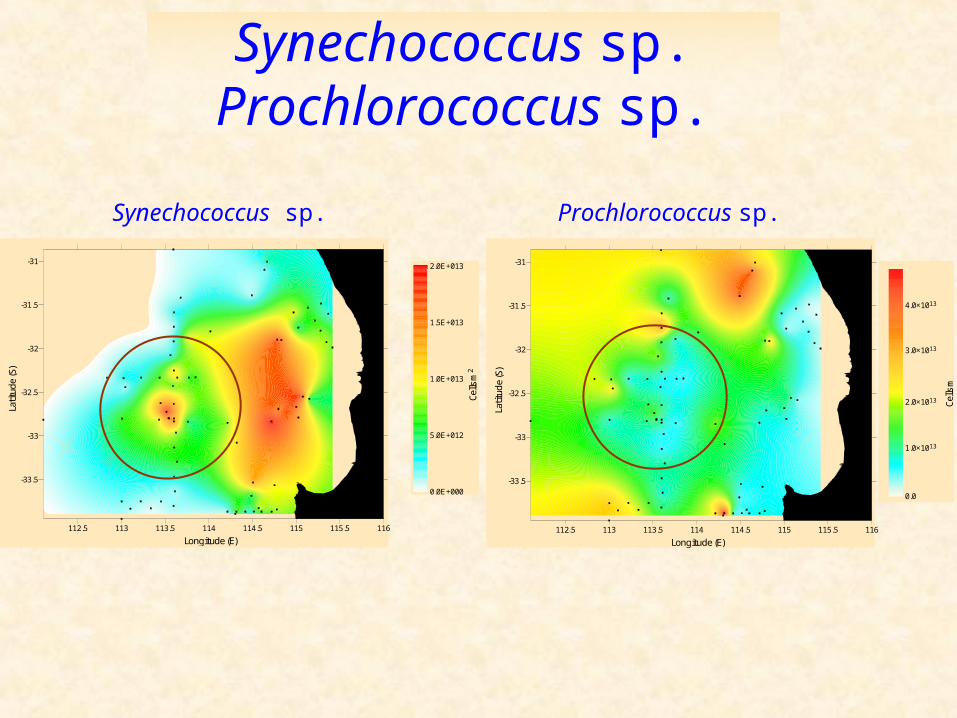
Synechococcus sp. Prochlorococcus sp.
112.5 113 113.5 114 114.5 115 115.5 116
-33.5
-33
-32.5
-32
-31.5
-31
0.0E+000
1.0E+012
2.0E+012
3.0E+012
4.0E+012
5.0E+012
6.0E+012
7.0E+012
8.0E+012
9.0E+012
1.0E+013
1.1E+013
1.2E+013
1.3E+013
1.4E+013
1.5E+013
1.6E+013
1.7E+013
1.8E+013
1.9E+013
2.0E+013
Latit
ude
(S)
Longitude (E)
Cells
m2
Synechococcus sp. Prochlorococcus sp.
112.5 113 113.5 114 114.5 115 115.5 116
-33.5
-33
-32.5
-32
-31.5
-31
0.0
1.0×10¹³
2.0×10¹³
3.0×10¹³
4.0×10¹³
L atit
ude
(S)
Longitude(E)
Cells
m
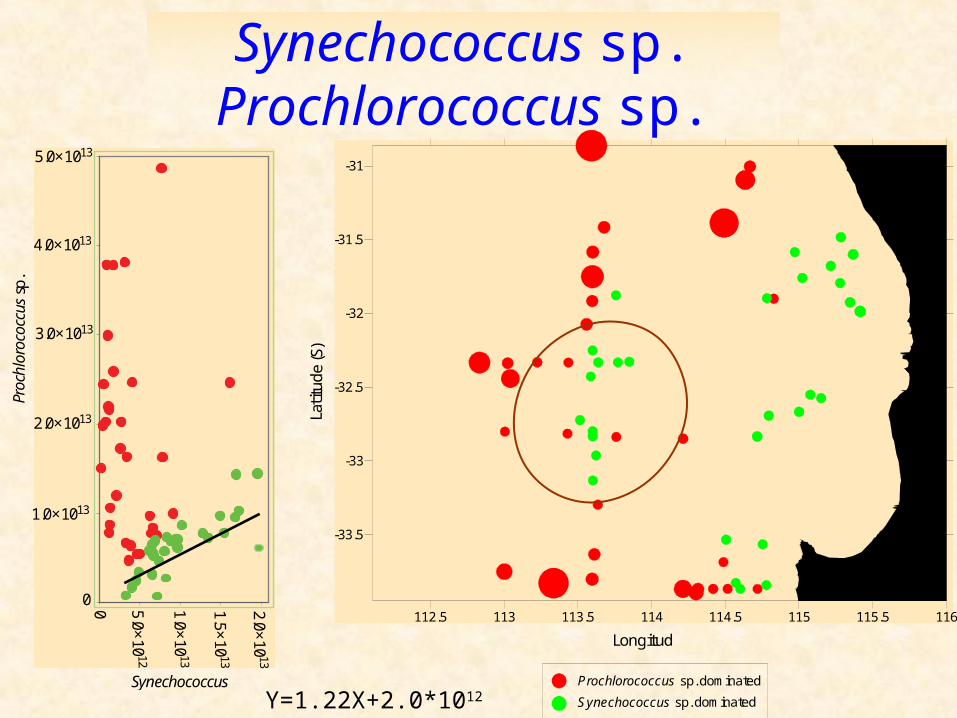
Synechococcus sp. Prochlorococcus sp.
1.0×10¹³
2.0×10¹³
3.0×10¹³
4.0×10¹³
5.0×10¹³
5.0×10
1 2
2.0×10
13
1.5×1 0
13
1 .0×10
1 3
0
0
Prochlorococcus sp
.
Synechococcus
112.5 113 113.5 114 114.5 115 115.5 116
-33.5
-33
-32.5
-32
-31.5
-31
Prochlorococcus sp. dominated
Synechococcus sp. dominated
Latit
ude
(S)
Longitud
Y=1.22X+2.0*1012
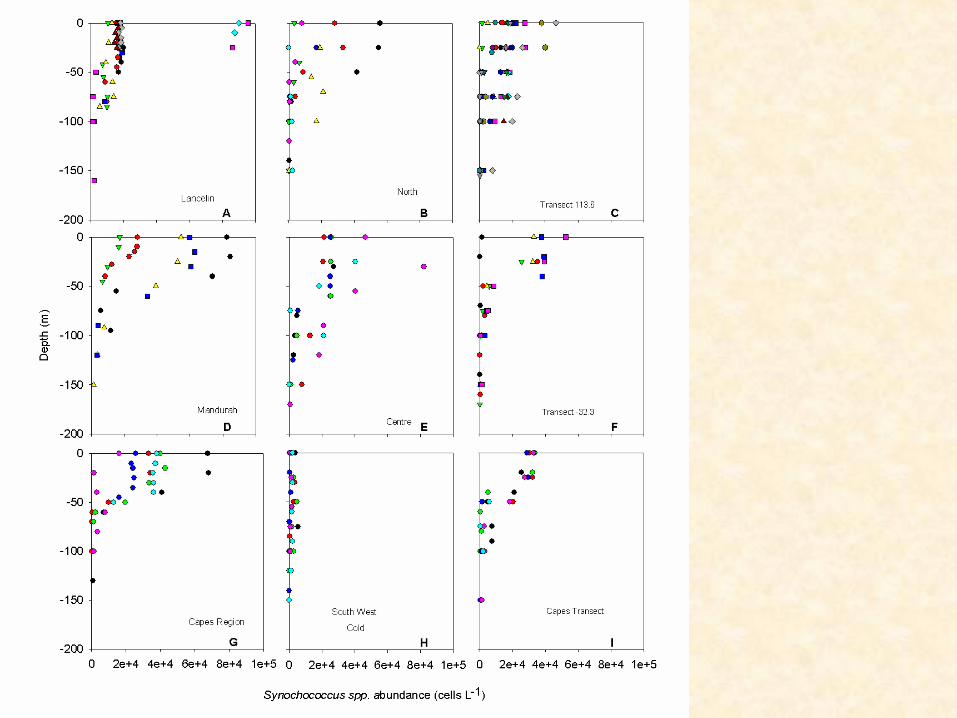
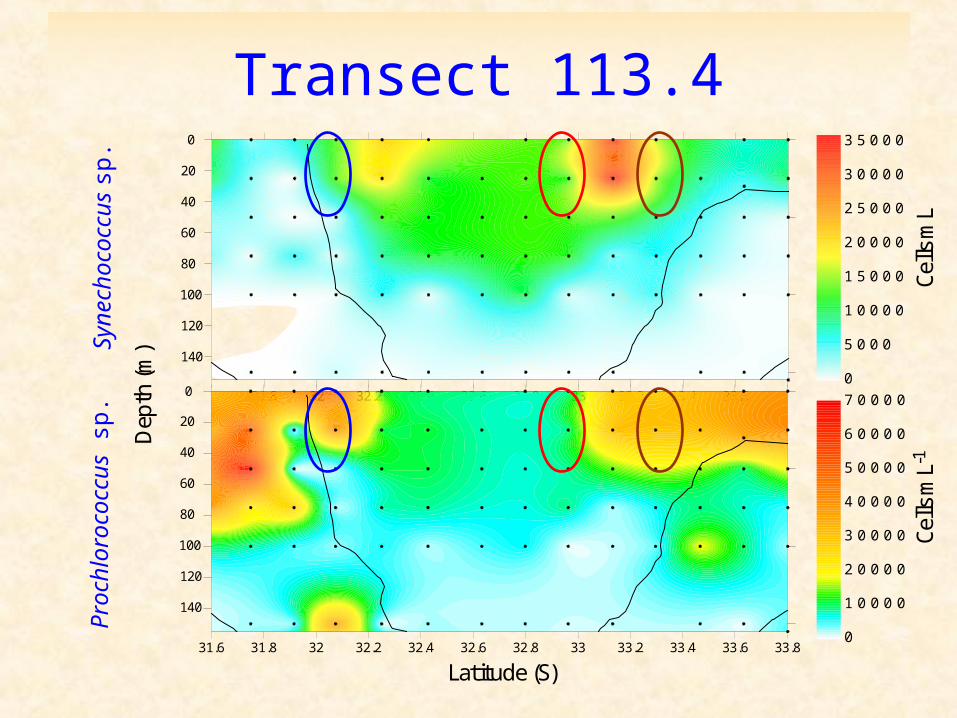
Transect 113.4S
ynec
hoco
ccus
sp.
Pro
chlo
roco
ccus
sp.
31.8 32 32.2 32.4 32.6 32.8 33 33.2 33.4 33.6
140
120
100
80
60
40
20
0
0
5 0 0 0
1 0 0 0 0
1 5 0 0 0
2 0 0 0 0
2 5 0 0 0
3 0 0 0 0
3 5 0 0 0
31.6 31.8 32 32.2 32.4 32.6 32.8 33 33.2 33.4 33.6 33.8
0
0
1 0 0 0 0
2 0 0 0 0
3 0 0 0 0
4 0 0 0 0
5 0 0 0 0
6 0 0 0 0
7 0 0 0 0
Dep
th (m
)
Latitude (S)
140
120
100
80
60
40
20
Cells
mL-
1Ce
lls m
L
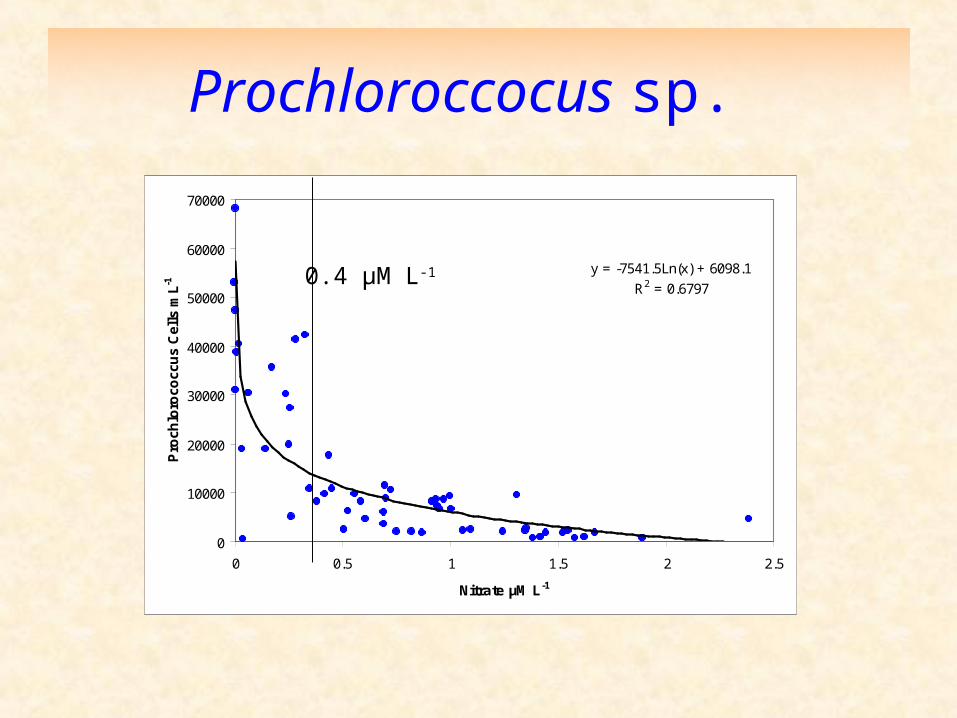
Prochloroccocus sp.
y = -7541.5Ln(x) + 6098.1
R2 = 0.6797
0
10000
20000
30000
40000
50000
60000
70000
0 0.5 1 1.5 2 2.5
Nitrate µM L-1
Pro
chlo
roco
ccu
s C
ells
mL-1 0.4 µM L-1
Transect 113.4
31.6 31.8 32 32.2 32.4 32.6 32.8 33 33.2 33.4 33.6 33.8
140
120
100
80
60
40
20
0
0
5 0 0
1 0 0 0
1 5 0 0
2 0 0 0
2 5 0 0
3 0 0 0
3 5 0 0
4 0 0 0
Dep
th (m
)
Latitude (S)
Cells
mL-1
31.6 31.8 32 32.2 32.4 32.6 32.8 33 33.2 33.4 33.6 33.8
140
120
100
80
60
40
20
0
2 0 0 0 0
6 0 0 0 0
1 0 0 0 0 0
1 4 0 0 0 0
1 8 0 0 0 0
2 2 0 0 0 0
2 6 0 0 0 0
3 0 0 0 0 0
3 4 0 0 0 0
3 8 0 0 0 0
4 2 0 0 0 0
Cells
mL-1
Latitude (S)
Dep
th (m
)
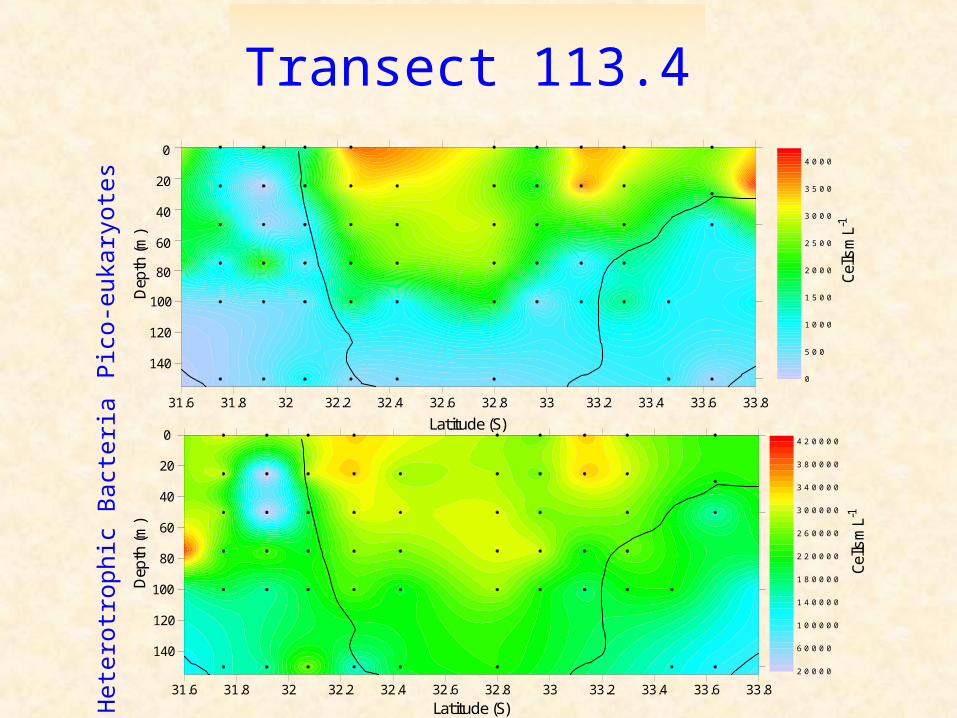
Pic
o-eu
kary
otes
Het
erot
roph
ic B
acte
ria
0
0.1
0.2
0.3
0.4
0.5
0.6
0.7
0.8
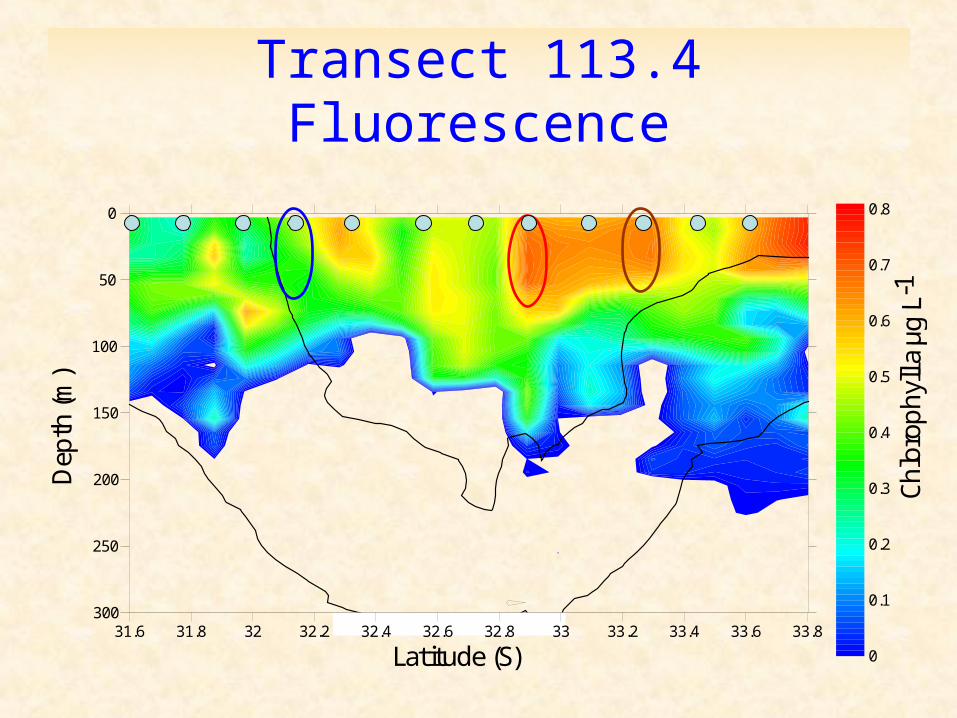
31.6 31.8 32 32.2 32.4 32.6 32.8 33 33.2 33.4 33.6 33.8300
250
200
150
100
50
0
Chlo
r oph
yll a
µg
L-1
Latitude (S)
Dep
th (m
)Transect 113.4Fluorescence
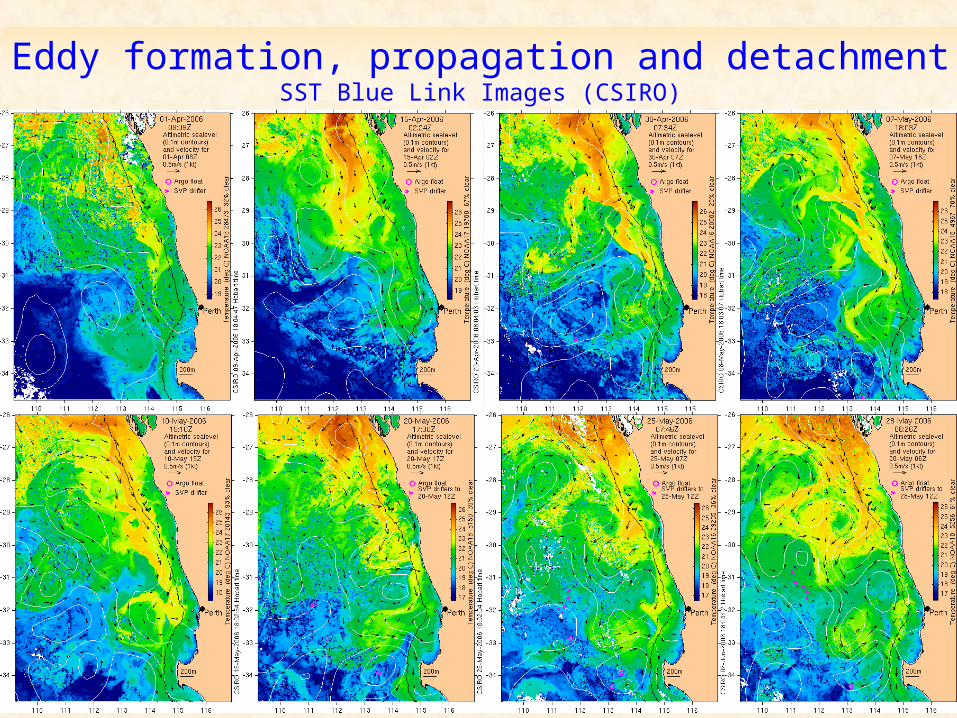
Eddy formation, propagation and detachmentSST Blue Link Images (CSIRO)
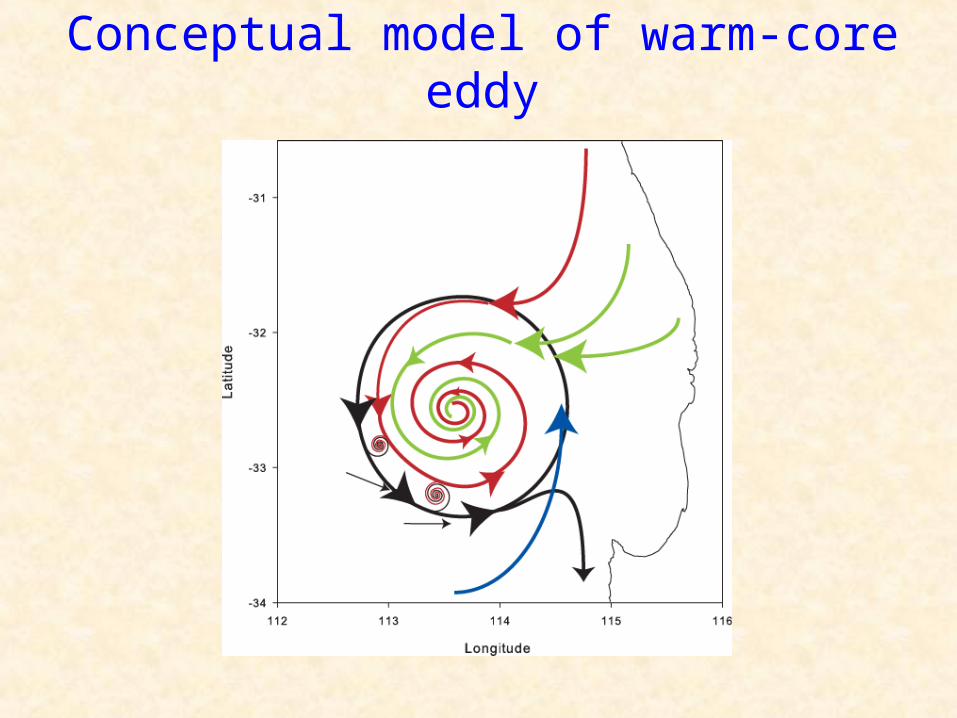
Conceptual model of warm-core eddy
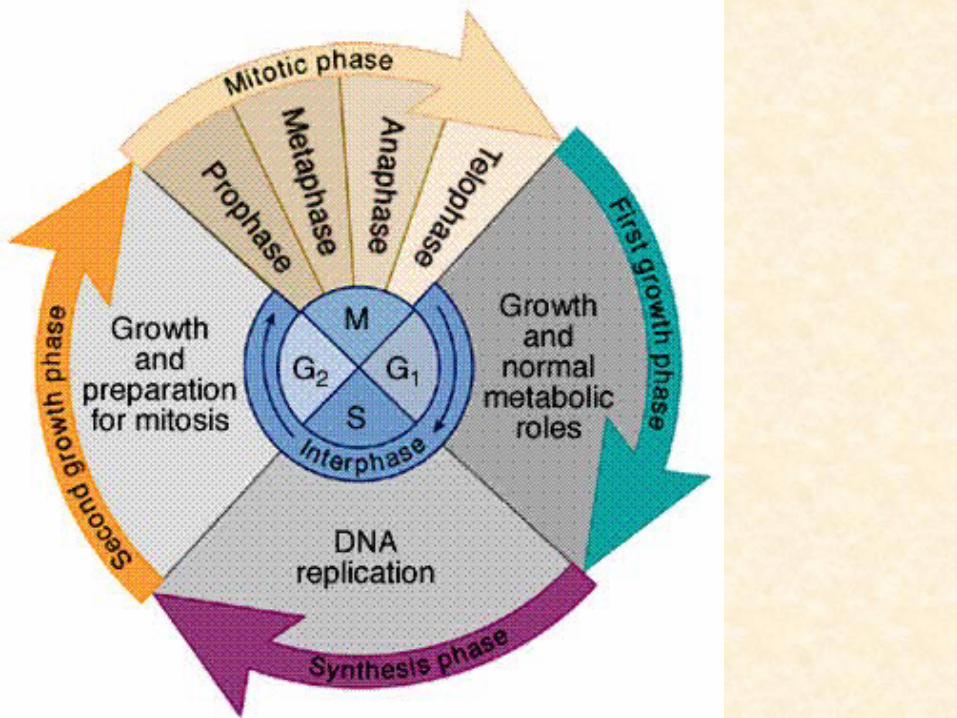
Cell cycle
• Growth of phytoplankton using cell cycle analysis
• Can be done using flow cytometry
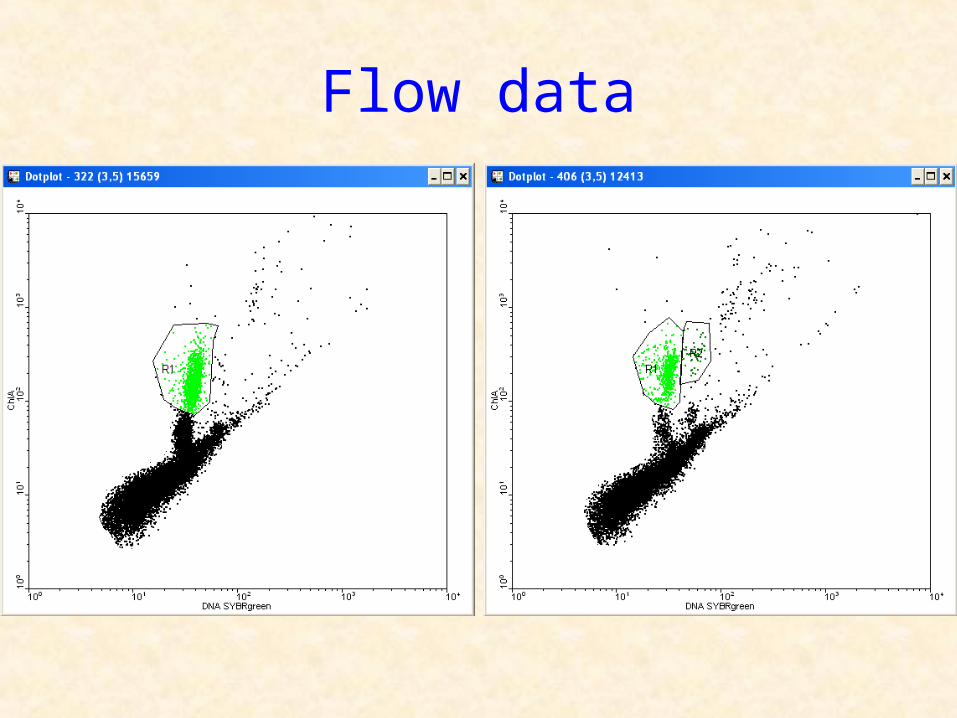
Flow data
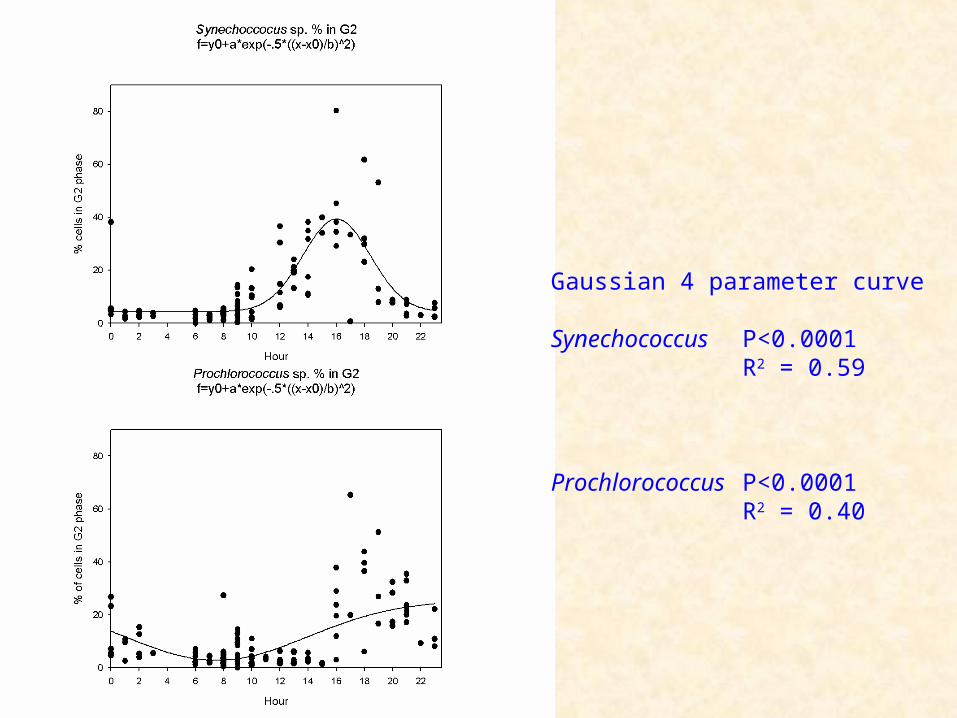
Gaussian 4 parameter curve
Synechococcus P<0.0001R2 = 0.59
Prochlorococcus P<0.0001R2 = 0.40
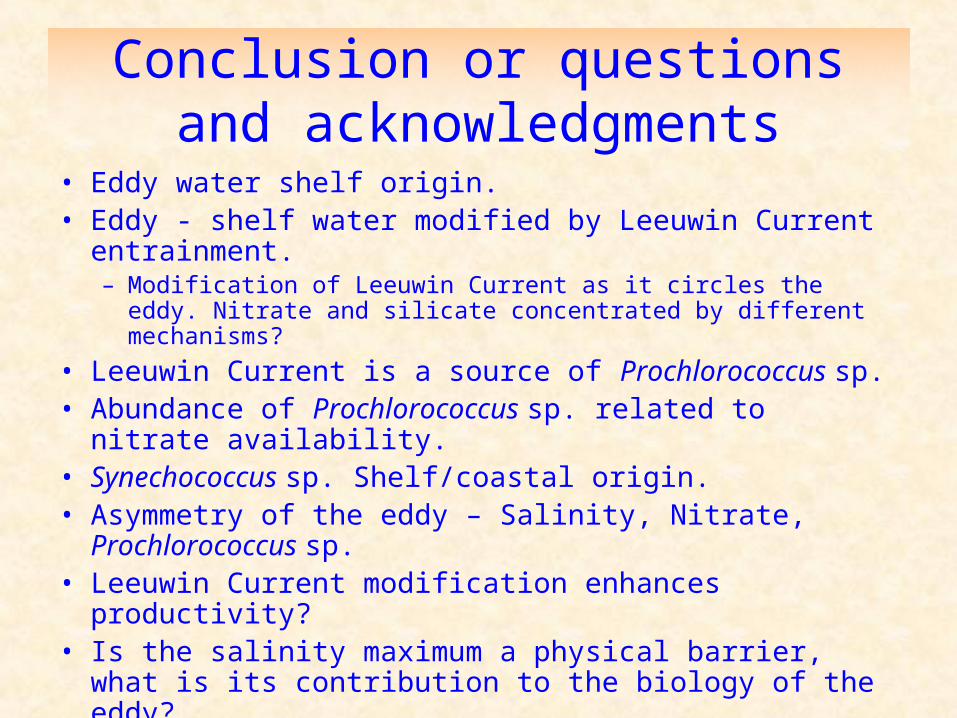
Conclusion or questions and acknowledgments
• Eddy water shelf origin.• Eddy - shelf water modified by Leeuwin Current
entrainment.– Modification of Leeuwin Current as it circles the eddy. Nitrate
and silicate concentrated by different mechanisms?
• Leeuwin Current is a source of Prochlorococcus sp.• Abundance of Prochlorococcus sp. related to nitrate
availability.• Synechococcus sp. Shelf/coastal origin.• Asymmetry of the eddy – Salinity, Nitrate,
Prochlorococcus sp.• Leeuwin Current modification enhances productivity?• Is the salinity maximum a physical barrier, what is its
contribution to the biology of the eddy?
Acknowledgments
• Waite et al., ARC discovery grant 2006 - 2008• Waite, Thompson and Twomey, SRFME
Collaborative Grant• Waite, Thompson and Beckley, Marine National
Facility Ship Time• Southern Surveyor MNF staff and crew• Ming Feng, CSIRO• Adele Pile• Kathy Heel-Miller and the Biomedical Imagine
Centre (UWA)


