Significant biogeochemical changes occur in theupper ocean waters as a typhoon passes with itscyclonic winds and intensified precipitation. In the sur-face water affected by the typhoon, nutrient concentra-tions and phytoplankton biomass often are signifi-cantly increased as winds induce vertical mixing,upwelling, or both (Lin et al. 2003, Babin et al. 2004).Wind-induced water mixing is detected as cool anom-alies within the upper thermocline. Upwelling leads tosaltier anomalies at the ocean surface. In addition towind-induced water mixing and upwelling, in coastal
waters where river discharge is significant, nutrientconcentrations and phytoplankton biomass areincreased by entrainment of waters from river runofffrom typhoon-related floods (Chen & Chen 2006). Thisis especially important in areas with numerous smallmountainous rivers (SMRs), which are the majorsource of particulate and dissolved organic carbonfluxes to the ocean (Goldsmith et al. 2008). In thisrespect, surface salinity is a convenient or even anessential parameter to quantify the effects of riverinedischarge and to distinguish between the importanceof upwelling and riverine mixing in increasing oceanproductivity when typhoons pass. Unfortunately, sur-
Phytoplankton productivity enhancement and assemblage change in the upstream
Kuroshio after typhoons
Yuh-ling Lee Chen1, 2,*, Houng-Yung Chen2, 3, Sen Jan4, Sing-how Tuo1
1Department of Marine Biotechnology and Resources, and 2Asia-Pacific Ocean Research Center, and 3Institute of Marine Biology, National Sun Yat-sen University, Kaohsiung 80424, Taiwan
4Institute of Hydrological and Oceanic Sciences, National Central University, Jung-li 32001, Taiwan
ABSTRACT: The primary production (PP), nitrate-uptake-based new production (NO3-NP), chloro-phyll a concentration, and phytoplankton assemblage in the upstream Kuroshio Current neighboringthe northern South China Sea (SCS) before and after the consecutive passage of 3 typhoons duringthe summer of 2007 were compared. The aim was to elucidate the effects of riverine mixing on phyto-plankton dynamics in the oligotrophic Kuroshio, to which northern SCS and Taiwan coastal waterspread after the typhoons. Spatial changes in surface salinity were used to differentiate the effects ofriverine mixing from wind-induced upwelling. After the typhoons, PP and NO3-NP in the Kuroshioboth were higher due to enriched nutrients from entrainment of riverine-mixed waters. Abundancesof diatoms had increased but the abundances of Trichodesmium spp., Richelia intracellularis, andunicellular potential diazotrophs that typically thrive in the summer were reduced. Specifically, olig-otrophic coccolithophores, such as Umbellosphaera tenuis and Discosphaera tubifera, were replacedby Gephyrocapsa oceanica and Emiliania huxleyi, and Prochlorococcus sp. was replaced bySynechococcus spp. The shift of the phytoplankton community from Trichodesmium spp. to diatomssuggests that the biogenic carbon enhanced by the typhoons tended to sink rather than be recycledin the upper-water food web.
KEY WORDS: Typhoon · River mixing · Production · Phytoplankton assemblages · Tricho-desmium spp. · Kuroshio · South China Sea
Resale or republication not permitted without written consent of the publisher
OPENPEN ACCESSCCESS
Mar Ecol Prog Ser 385: 111–126, 2009
face salinity is not available from remote sensing,which, with its easy availability and wide spatial cover-age, has become a preferred tool to study the effects oftyphoons.
Ocean surface temperature and chlorophyll concen-tration are widely used to study biogeochemicalresponses to typhoons via remote sensing (Lin et al.2003, Walker et al. 2005). Prolonged cloudiness alongthe typhoon’s trajectory, however, often hampers col-lection of images that reveal the most recent conditionsof the ocean surface. Primary production (PP) changesfollowing typhoons are usually estimated from satel-lite-derived chlorophyll concentrations and tempera-ture through models that describe their relationships(e.g. Lin et al. 2003). Nevertheless, many factors affectthe estimates of phytoplankton production from satel-lite-derived chlorophyll a (chl a) concentrations frombefore and after typhoons. Increased concentrations ofsurface chlorophyll within the cool wakes of a typhooncould come from the rapid growth of phytoplanktonresponding to the injection of nutrients from the deep,or from phytoplankton brought up by vertical displace-ment from the deep chlorophyll maximum layer, orboth (Babin et al. 2004). In addition, partial removal ofzooplankton after a typhoon reduces grazing on phyto-plankton (Zhang & Wang 2000). These various factorscould work singly or in combination to affect the mag-nitude of change in chlorophyll concentration. Ourunderstanding of this phenomenon is quite limited.
The biogeochemical effects of a typhoon on theupper ocean are often more pronounced if it passesthrough shallow waters rather than deep waters(Siswanto et al. 2007), or deep waters having a shallownitracline (Babin et al. 2004). Kuroshio, which is a cur-rent originating at the equator, flows mostly over bot-tom depths >3000 m. The main stream of its upstreamcurrent in the West Philippine Sea between Taiwanand the Philippines (see Fig. 1) is characterized by anitracline (73 m; Chen et al. 2008) deeper than theneighboring South China Sea (SCS, 30 to 40 m; Chen2005). The effects of a typhoon on the biogeochemicaldynamics of the upstream Kuroshio via upwelling ordeep-water mixing, although yet be studied, could beless pronounced than those in the shallow coastalwaters or deep waters with shallow nitracline. On theother hand, Chern & Wang (1998) reported that sur-face SCS water could spread to the Kuroshio in thesummer when a southwest monsoon prevails. As atyphoon is always accompanied by significant riverdischarge, the roles of riverine mixing in the Kuroshiocould be important, although whether Taiwan Straitcoastal water would reach and mix with the Kuroshiovia the northern SCS remains to be studied.
Because of their tropical origin, the surface waters ofthe Kuroshio are generally regarded as oligotrophic
and nitrogen-deficient; however, nitrogen fixationfrom Trichodesmium spp., filamentous cyanobacteriathat flourish in the Kuroshio, and perhaps from otherdiazotrophs, renders the upstream Kuroshio relativelyproductive in the summer when the nitracline deepensand nitrate-uptake-based new production (NO3-NP) islow (Chen et al. 2008). The standing crop of Tricho-desmium spp. is consistently higher in the Kuroshiothan in the SCS, which is attributed to differences inthe nitracline depth and nitrate availability (Chen et al.2008). Because the passage of a typhoon could affectthe supply of nitrogen, how that affects the dominanceof Trichodesmium spp. in the upstream Kuroshio andthe dynamics of the carbon and nitrogen pools in thewhole ecosystem are unknown. On average, 4typhoons pass through Taiwan and the Kuroshioregion every year. Their effects could be substantial inthis oligotrophic oceanic region.
In this paper, we present the evolution of PP, NO3-NP, and phytoplankton community composition beforeand after the consecutive passage of 3 typhoons in theupstream Kuroshio during the southwest monsoon sea-son of 2007. Surface salinity was used to elucidate anddifferentiate the effects of upwelling and riverine mix-ing. To our knowledge, although relevant studies havebeen conducted in lakes (James et al. 2008) and estu-aries (Paerl et al. 2006), this is the first paper reportingthe effects of typhoons on phytoplankton assemblageand new production in open ocean water.
MATERIALS AND METHODS
Cruises. Results from a pre-typhoon cruise (CR1234)during 7–10 July 2007 and a post-typhoon cruise(CR1242) during 21–25 August 2007 were com-pared. Between the 2 cruises, 3 typhoons, Pabuk(7–8 August), Wutip (8–9 August), and Sepat (17–18August) passed over the Kuroshio and the island ofTaiwan (Fig. 1). CR1234 was conducted before Pabuk,which was the first typhoon that made landfall onTaiwan during 2007. CR1242 was commenced 4 d afterSepat, a super-typhoon with a moving speed of5.44 m s–1 and a gust wind speed of 57 m s–1 beforelandfall.
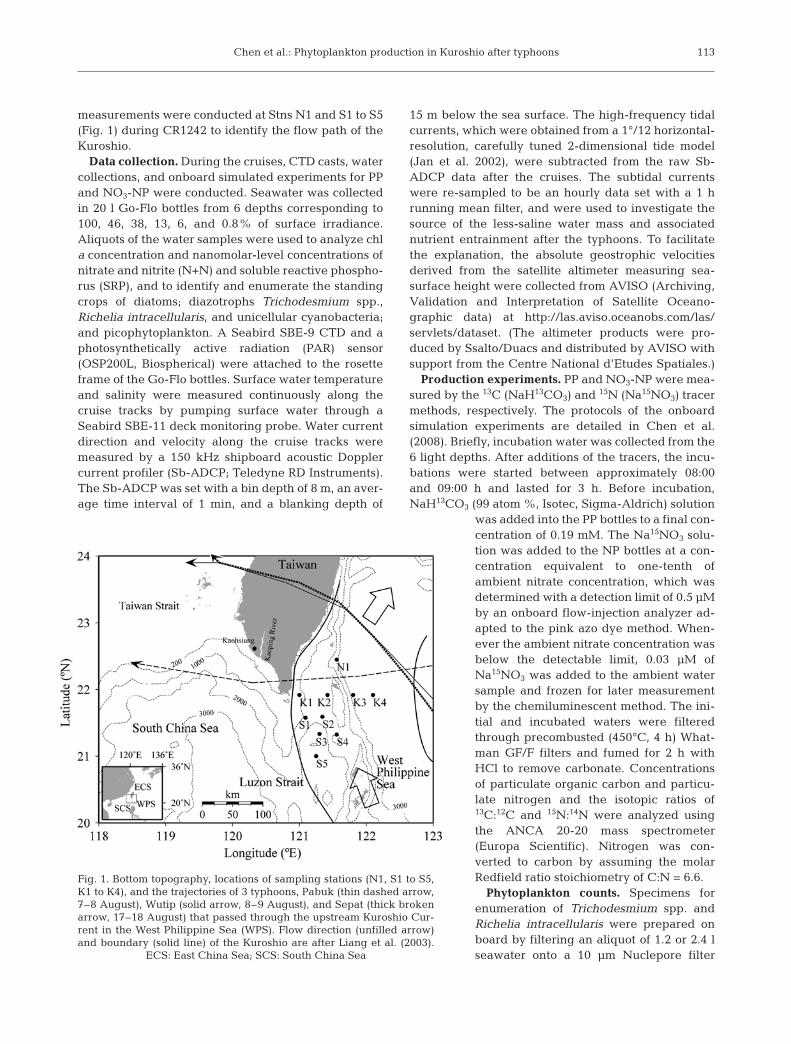
Sampling stations. Four sampling stations (K1 to K4)along Transect K (Fig. 1), which was oriented perpen-dicularly to the Kuroshio from the southern tip of Tai-wan (21° 55’ N), were surveyed during both cruises.The main axis of the upstream Kuroshio is reported tobe between 121° and 123° E along 22° N (Liang et al.2003). Transect K was located to the west of the trajec-tories of the typhoons. Stns K4 and K1 were located 63and 156 km away from the path of the center ofTyphoon Sepat, respectively (Fig. 1). In addition, CTD
112
Chen et al.: Phytoplankton production in Kuroshio after typhoons
measurements were conducted at Stns N1 and S1 to S5(Fig. 1) during CR1242 to identify the flow path of theKuroshio.
Data collection. During the cruises, CTD casts, watercollections, and onboard simulated experiments for PPand NO3-NP were conducted. Seawater was collectedin 20 l Go-Flo bottles from 6 depths corresponding to100, 46, 38, 13, 6, and 0.8% of surface irradiance.Aliquots of the water samples were used to analyze chla concentration and nanomolar-level concentrations ofnitrate and nitrite (N+N) and soluble reactive phospho-rus (SRP), and to identify and enumerate the standingcrops of diatoms; diazotrophs Trichodesmium spp.,Richelia intracellularis, and unicellular cyanobacteria;and picophytoplankton. A Seabird SBE-9 CTD and aphotosynthetically active radiation (PAR) sensor(OSP200L, Biospherical) were attached to the rosetteframe of the Go-Flo bottles. Surface water temperatureand salinity were measured continuously along thecruise tracks by pumping surface water through aSeabird SBE-11 deck monitoring probe. Water currentdirection and velocity along the cruise tracks weremeasured by a 150 kHz shipboard acoustic Dopplercurrent profiler (Sb-ADCP; Teledyne RD Instruments).The Sb-ADCP was set with a bin depth of 8 m, an aver-age time interval of 1 min, and a blanking depth of
15 m below the sea surface. The high-frequency tidalcurrents, which were obtained from a 1°/12 horizontal-resolution, carefully tuned 2-dimensional tide model(Jan et al. 2002), were subtracted from the raw Sb-ADCP data after the cruises. The subtidal currentswere re-sampled to be an hourly data set with a 1 hrunning mean filter, and were used to investigate thesource of the less-saline water mass and associatednutrient entrainment after the typhoons. To facilitatethe explanation, the absolute geostrophic velocitiesderived from the satellite altimeter measuring sea-surface height were collected from AVISO (Archiving,Validation and Interpretation of Satellite Oceano-graphic data) at http://las.aviso.oceanobs.com/las/servlets/dataset. (The altimeter products were pro-duced by Ssalto/Duacs and distributed by AVISO withsupport from the Centre National d’Etudes Spatiales.)
Production experiments. PP and NO3-NP were mea-sured by the 13C (NaH13CO3) and 15N (Na15NO3) tracermethods, respectively. The protocols of the onboardsimulation experiments are detailed in Chen et al.(2008). Briefly, incubation water was collected from the6 light depths. After additions of the tracers, the incu-bations were started between approximately 08:00and 09:00 h and lasted for 3 h. Before incubation,NaH13CO3 (99 atom %, Isotec, Sigma-Aldrich) solution
was added into the PP bottles to a final con-centration of 0.19 mM. The Na15NO3 solu-tion was added to the NP bottles at a con-centration equivalent to one-tenth ofambient nitrate concentration, which wasdetermined with a detection limit of 0.5 µMby an onboard flow-injection analyzer ad-apted to the pink azo dye method. When-ever the ambient nitrate concentration wasbelow the detectable limit, 0.03 µM ofNa15NO3 was added to the ambient watersample and frozen for later measurementby the chemiluminescent method. The ini-tial and incubated waters were filteredthrough precombusted (450°C, 4 h) What-man GF/F filters and fumed for 2 h withHCl to remove carbonate. Concentrationsof particulate organic carbon and particu-late nitrogen and the isotopic ratios of13C:12C and 15N:14N were analyzed usingthe ANCA 20-20 mass spectrometer(Europa Scientific). Nitrogen was con-verted to carbon by assuming the molarRedfield ratio stoichiometry of C:N = 6.6.
Phytoplankton counts. Specimens forenumeration of Trichodesmium spp. andRichelia intracellularis were prepared onboard by filtering an aliquot of 1.2 or 2.4 lseawater onto a 10 µm Nuclepore filter
113
Fig. 1. Bottom topography, locations of sampling stations (N1, S1 to S5,K1 to K4), and the trajectories of 3 typhoons, Pabuk (thin dashed arrow,7–8 August), Wutip (solid arrow, 8–9 August), and Sepat (thick brokenarrow, 17–18 August) that passed through the upstream Kuroshio Cur-rent in the West Philippine Sea (WPS). Flow direction (unfilled arrow)and boundary (solid line) of the Kuroshio are after Liang et al. (2003).
ECS: East China Sea; SCS: South China Sea
Mar Ecol Prog Ser 385: 111–126, 2009
(25 mm diameter). The filter paper was mounted withimmersion oil and a cover slip on a microscope slideand kept in darkness at –20°C until microscopic exam-ination. Trichomes of Trichodesmium spp. and hetero-cysts of R. intracellularis were counted on the entirefilter at a magnification of 100 to 400 × with blue exci-tation using a Zeiss epifluorescence microscope.Depth-integrated abundances were calculated bytrapezoidal integration from the surface to 100 m depthand expressed as trichomes m–2 or heterocysts m–2. A1.2 l surface water sample was reverse-filtered througha 20 µm mesh Nitex screen to remove large organismsand then filtered onto a 1 µm Nuclepore (25 mm diam-eter) to collect unicellular cyanobacteria with diame-ters between 2.5 and 10 µm, which represent potentialunicellular diazotrophs. The preparation and observa-tion of the specimens were similar to those used for theother diazotrophs except that a magnification of 1000 ×was needed. The unicellular cyanobacteria in 2 sizefractions (2.5–5 µm and 5–10 µm) were counted.Diatoms in 100 ml of formalin-preserved surface-watersamples were counted after settling in a Utermöhlchamber for 24 h. The diatoms were examined at 400 ×magnification on a Zeiss Axiovert 35 inverted micro-scope with phase contrast optics. Coccolithophores insurface-water samples from Stns K1 and K2 with 5%neutralized formalin added were filtered under a vac-uum pressure of 100 mm Hg onto 0.45 µm Nucleporepolycarbonate membrane filters (25 mm diameter).The filters were subsequently rinsed with buffered dis-tilled water (pH 8 to 9) and oven-dried at 40°C for atleast 12 h. The procedures for scanning electronmicroscopy and taxonomic identification are describedin Chen et al. (2007). Counts of coccoliths were con-verted to counts of coccospheres according to species-specific factors. Cell densities of Prochlorococcus sp.and Synechococcus spp. were examined to representthe picophytoplankton population. A 1 ml aliquot ofseawater from 6 to 9 depths to 200 m depth was pre-served with paraformaldehyde (0.2% final concentra-tion), frozen in liquid nitrogen, and stored at –80°Cbefore flow cytometric analysis (Vaulot et al. 1989). AninFlux Mariner cell sorter (Cytopeia) that wasequipped with a 200 mW laser (excitation at 488 nm)was used to enumerate the cell densities of Prochloro-coccus sp. and Synechococcus spp. following themethod of Campbell (2001).
Calculations. Chl a concentrations were determinedfluorometrically. N+N concentrations were measuredby the chemiluminescent method (Garside 1982). SRPwas determined to nanomolar levels by the modified-MAGIC method (Thomson-Bulldis & Karl 1998). Depthof the euphotic zone (Deu) was defined as the depth atwhich light intensity was 0.8% of surface irradiance.The nitracline depth Dni was defined as the depth at
which N+N equaled 0.1 µM and was used as an indexto infer nitrate availability to phytoplankton in theupper water column. Dchl-max is defined as depth of chla maximum. Depth-integrated production was calcu-lated by trapezoidal integration of the entire euphoticzone (0.8 to 100% of surface irradiance) for PP (IPP)and NO3-NP (INO3-NP), and expressed as g C m–2.Daily production rates were calculated by extrapolat-ing the rates of the 3 h incubations to 24 h rates, basedon the short-term uptake rates and photoperiod con-version factors that have been established followingthe method of Cochlan et al. (1991). Depth-integratedN+N (IN+N) and chl a (IChl) were also calculated byintegration from surface to 70 m and surface to 150 m,respectively.
RESULTS
Water properties
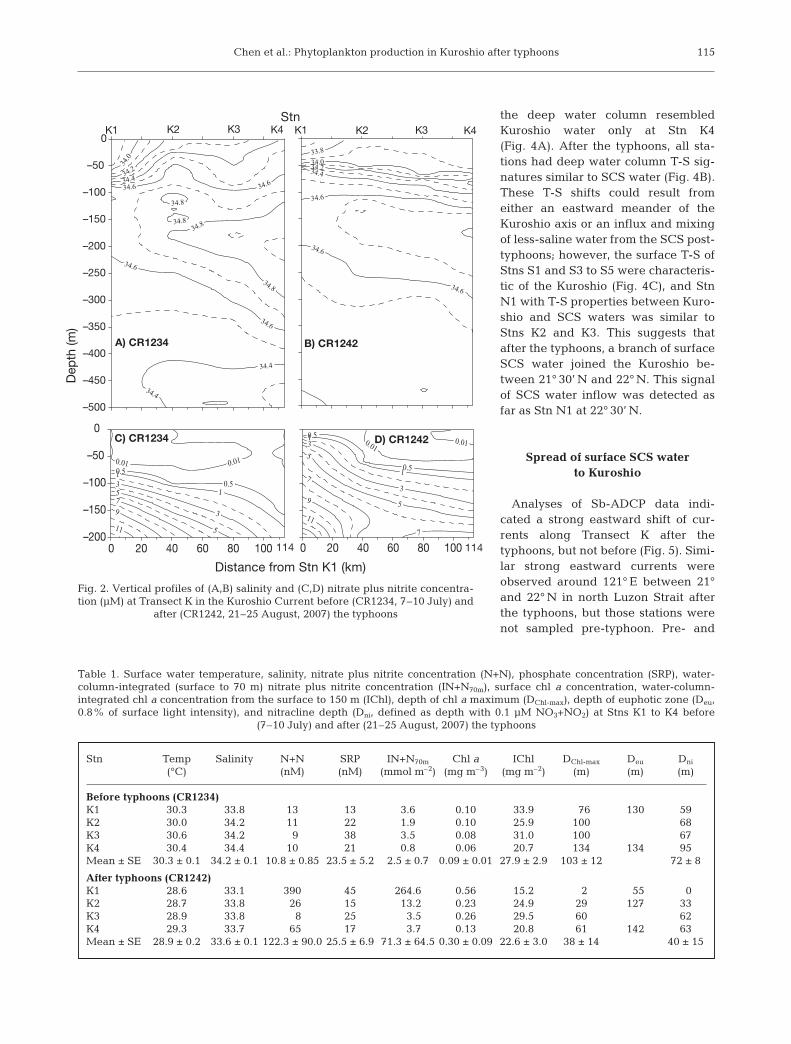
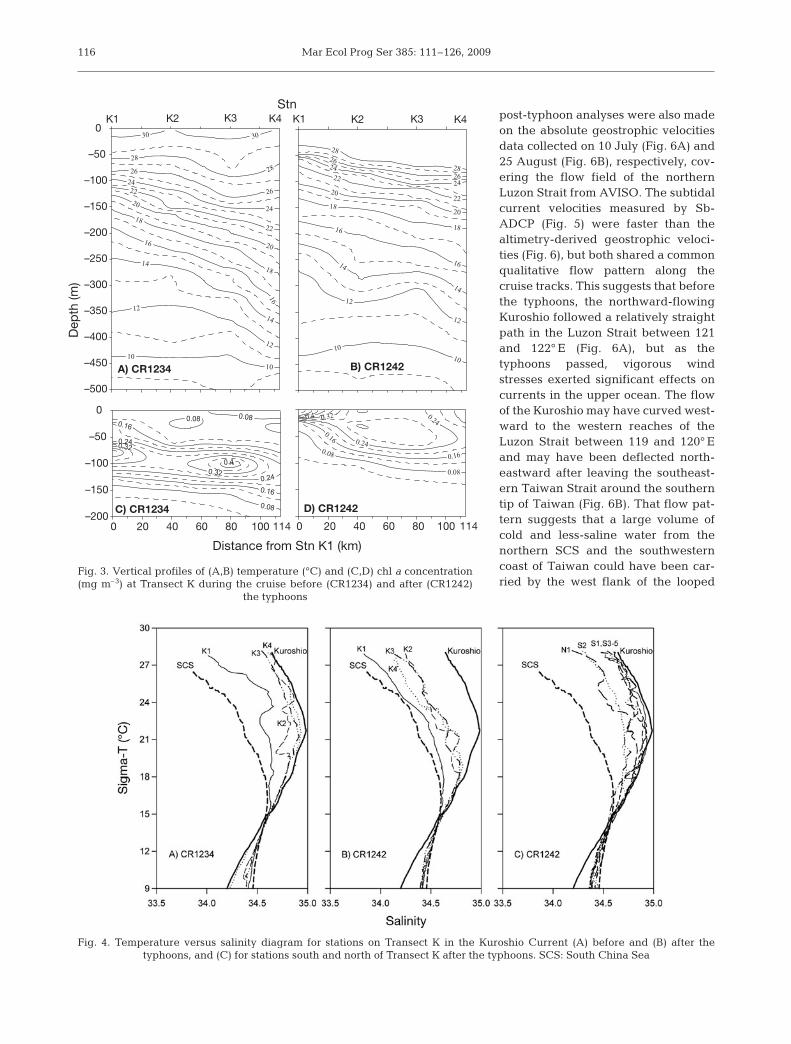
Before the typhoons, surface Kuroshio water mea-sured during CR1234 had typical salinities >34.2(Fig. 2). Along Transect K, the only station with surfacesalinity <34.0 was K1. After Typhoon Sepat, a thicklayer of less-saline water (33.1 to 33.8) was found tooccupy the upper 50 m of the water column duringCR1242 (Table 1). Stns K2 to K4 showed a typicalKuroshio subsurface salinity maximum of >34.8 atabout 200 m depth before the typhoons and disap-peared after the typhoons (Fig. 2). Similarly, watertemperature was lower throughout the upper 400 mafter the typhoons, by 1 to 2°C in the near surface(Fig. 3). The 21°C isotherm-measured pre-typhoon was210 m deep at Stn K4 and shoaled to 120 m at Stn K1;post-typhoon, it was significantly uplifted to 150 and80 m at the respective stations. Our results on surfacesalinity and current pattern suggest that this spread oflow water temperature after the typhoons was not anindication of wind-induced upwelling, but instead thesignature of influx of SCS water to the Kuroshio.
The temperature-salinity (T-S) diagrams revealed asignificant influx of less-saline water from the northernSCS to the Kuroshio after the typhoons. Before thetyphoons, the T-S diagrams for Stns K2 to K4 weretypical of the upper water column of the Kuroshio(Fig. 4A), but Stn K1 was more similar to the SCSwater. After the typhoons, the T-S diagrams of theupper water column along Transect K all resembledSCS waters (Fig. 4B). Because the minimum salinitiesin the deeper water column are lower in Kuroshio thanin the SCS, the shifted T-S plots of the 4 stations towardthose of the SCS suggests that Transect K receivedmore waters from the SCS after the typhoons thanbefore. Before the typhoons, the T-S properties in
114
Chen et al.: Phytoplankton production in Kuroshio after typhoons
the deep water column resembledKuroshio water only at Stn K4(Fig. 4A). After the typhoons, all sta-tions had deep water column T-S sig-natures similar to SCS water (Fig. 4B).These T-S shifts could result fromeither an eastward meander of theKuroshio axis or an influx and mixingof less-saline water from the SCS post-typhoons; however, the surface T-S ofStns S1 and S3 to S5 were characteris-tic of the Kuroshio (Fig. 4C), and StnN1 with T-S properties between Kuro-shio and SCS waters was similar toStns K2 and K3. This suggests thatafter the typhoons, a branch of surfaceSCS water joined the Kuroshio be-tween 21° 30’ N and 22° N. This signalof SCS water inflow was detected asfar as Stn N1 at 22° 30’ N.
Spread of surface SCS water to Kuroshio
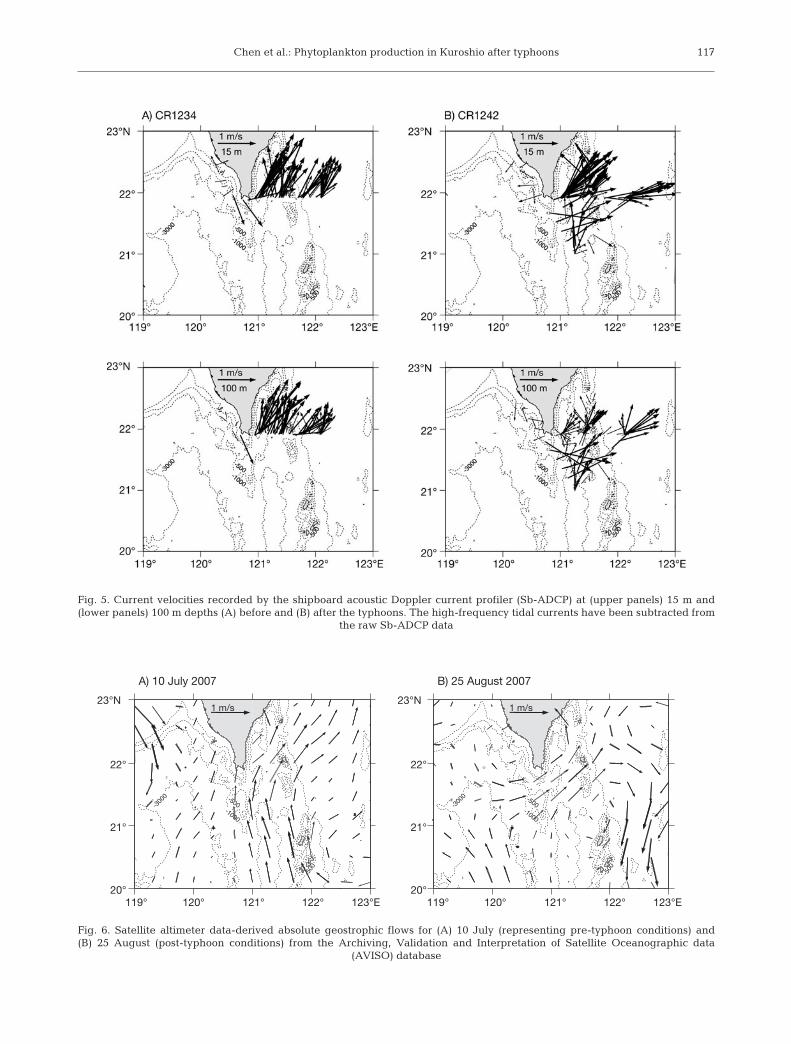
Analyses of Sb-ADCP data indi-cated a strong eastward shift of cur-rents along Transect K after thetyphoons, but not before (Fig. 5). Simi-lar strong eastward currents wereobserved around 121° E between 21°and 22° N in north Luzon Strait afterthe typhoons, but those stations werenot sampled pre-typhoon. Pre- and
115
–500
–450
–400
–350
–300
–250
–200
–150
–100
–50
0
A) CR1234
K1 K2 K4
Dep
th (m
)
B) CR1242
K1 K2 K4K3 K3
1140 20 40 60 80 100–200
–150
–100
–50
0
0 20 40 60 80 100 114
C) CR1234 D) CR1242
Stn
Distance from Stn K1 (km)
Fig. 2. Vertical profiles of (A,B) salinity and (C,D) nitrate plus nitrite concentra-tion (µM) at Transect K in the Kuroshio Current before (CR1234, 7–10 July) and
after (CR1242, 21–25 August, 2007) the typhoons
Stn Temp Salinity N+N SRP IN+N70m Chl a IChl DChl-max Deu Dni
Table 1. Surface water temperature, salinity, nitrate plus nitrite concentration (N+N), phosphate concentration (SRP), water-column-integrated (surface to 70 m) nitrate plus nitrite concentration (IN+N70m), surface chl a concentration, water-column-integrated chl a concentration from the surface to 150 m (IChl), depth of chl a maximum (DChl-max), depth of euphotic zone (Deu,0.8% of surface light intensity), and nitracline depth (Dni, defined as depth with 0.1 µM NO3+NO2) at Stns K1 to K4 before
(7–10 July) and after (21–25 August, 2007) the typhoons
Mar Ecol Prog Ser 385: 111–126, 2009
post-typhoon analyses were also madeon the absolute geostrophic velocitiesdata collected on 10 July (Fig. 6A) and25 August (Fig. 6B), respectively, cov-ering the flow field of the northernLuzon Strait from AVISO. The subtidalcurrent velocities measured by Sb-ADCP (Fig. 5) were faster than thealtimetry-derived geostrophic veloci-ties (Fig. 6), but both shared a commonqualitative flow pattern along thecruise tracks. This suggests that beforethe typhoons, the northward-flowingKuroshio followed a relatively straightpath in the Luzon Strait between 121and 122° E (Fig. 6A), but as thetyphoons passed, vigorous windstresses exerted significant effects oncurrents in the upper ocean. The flowof the Kuroshio may have curved west-ward to the western reaches of theLuzon Strait between 119 and 120° Eand may have been deflected north-eastward after leaving the southeast-ern Taiwan Strait around the southerntip of Taiwan (Fig. 6B). That flow pat-tern suggests that a large volume ofcold and less-saline water from thenorthern SCS and the southwesterncoast of Taiwan could have been car-ried by the west flank of the looped
116
Dep
th (m
)
–500
–450
–400
–350
–300
–250
–200
–150
–100
–50
0
A) CR1234 B) CR1242
K1 K2 K4 K1 K2 K4K3 K3
0 20 40 60 80 100–200
–150
–100
–50
0
114 0 20 40 60 80 100 114
C) CR1234 D) CR1242
Stn
Distance from Stn K1 (km)
Fig. 3. Vertical profiles of (A,B) temperature (°C) and (C,D) chl a concentration(mg m–3) at Transect K during the cruise before (CR1234) and after (CR1242)
the typhoons
Fig. 4. Temperature versus salinity diagram for stations on Transect K in the Kuroshio Current (A) before and (B) after the typhoons, and (C) for stations south and north of Transect K after the typhoons. SCS: South China Sea
Chen et al.: Phytoplankton production in Kuroshio after typhoons 117
Fig. 5. Current velocities recorded by the shipboard acoustic Doppler current profiler (Sb-ADCP) at (upper panels) 15 m and(lower panels) 100 m depths (A) before and (B) after the typhoons. The high-frequency tidal currents have been subtracted from
Fig. 6. Satellite altimeter data-derived absolute geostrophic flows for (A) 10 July (representing pre-typhoon conditions) and(B) 25 August (post-typhoon conditions) from the Archiving, Validation and Interpretation of Satellite Oceanographic data
(AVISO) database
Mar Ecol Prog Ser 385: 111–126, 2009
Kuroshio Current off southeastern Taiwan. Resultsfrom the ADCP data support this inferred source of thelow-temperature and less-saline water in the surfacewaters of the upstream Kuroshio observed after thetyphoons.
Source of the less-saline water
The less-saline northern SCS water could have orig-inated from Taiwan’s numerous SMRs. Increased riverdischarge from intense precipitation from typhoons
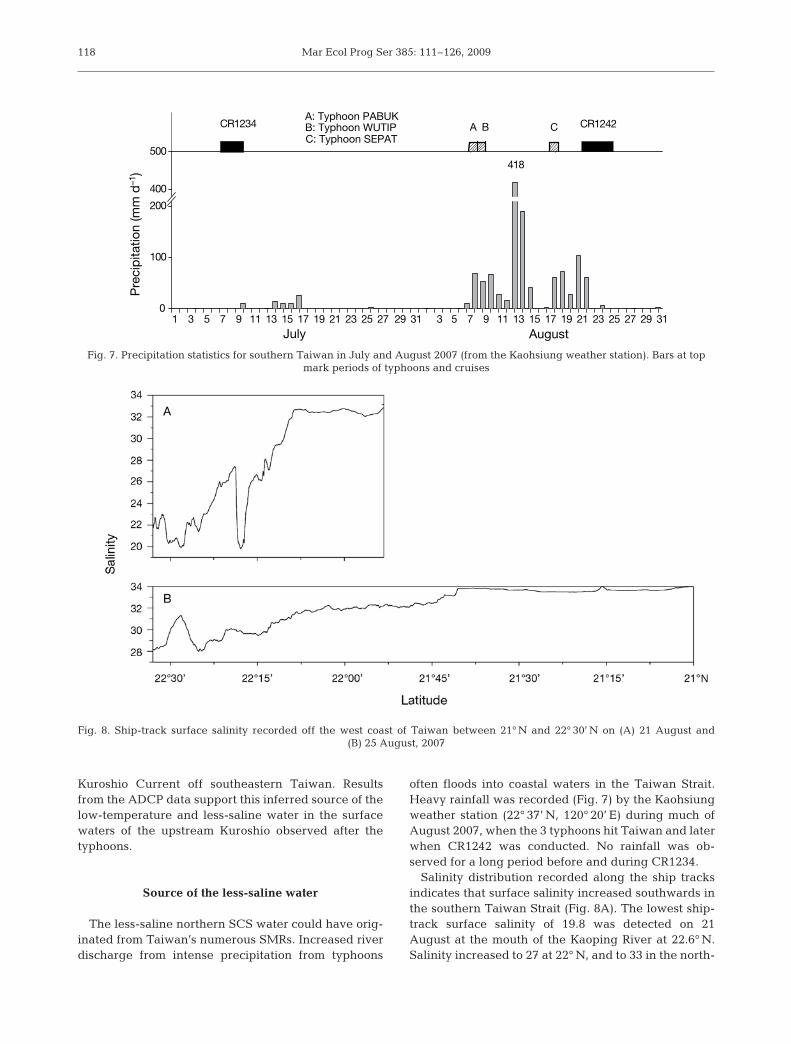
often floods into coastal waters in the Taiwan Strait.Heavy rainfall was recorded (Fig. 7) by the Kaohsiungweather station (22° 37’ N, 120° 20’ E) during much ofAugust 2007, when the 3 typhoons hit Taiwan and laterwhen CR1242 was conducted. No rainfall was ob-served for a long period before and during CR1234.
Salinity distribution recorded along the ship tracksindicates that surface salinity increased southwards inthe southern Taiwan Strait (Fig. 8A). The lowest ship-track surface salinity of 19.8 was detected on 21August at the mouth of the Kaoping River at 22.6° N.Salinity increased to 27 at 22° N, and to 33 in the north-
Fig. 7. Precipitation statistics for southern Taiwan in July and August 2007 (from the Kaohsiung weather station). Bars at topmark periods of typhoons and cruises
Fig. 8. Ship-track surface salinity recorded off the west coast of Taiwan between 21° N and 22° 30’ N on (A) 21 August and (B) 25 August, 2007
Chen et al.: Phytoplankton production in Kuroshio after typhoons
ern Luzon Strait before reaching the Kuroshio region.By 25 August, surface salinity measured at the Kao-ping River mouth was 27 (Fig. 8B). The rainfall and theship-track salinity data support the assertion that river-ine water reached the Kuroshio region.
Distribution of nutrients
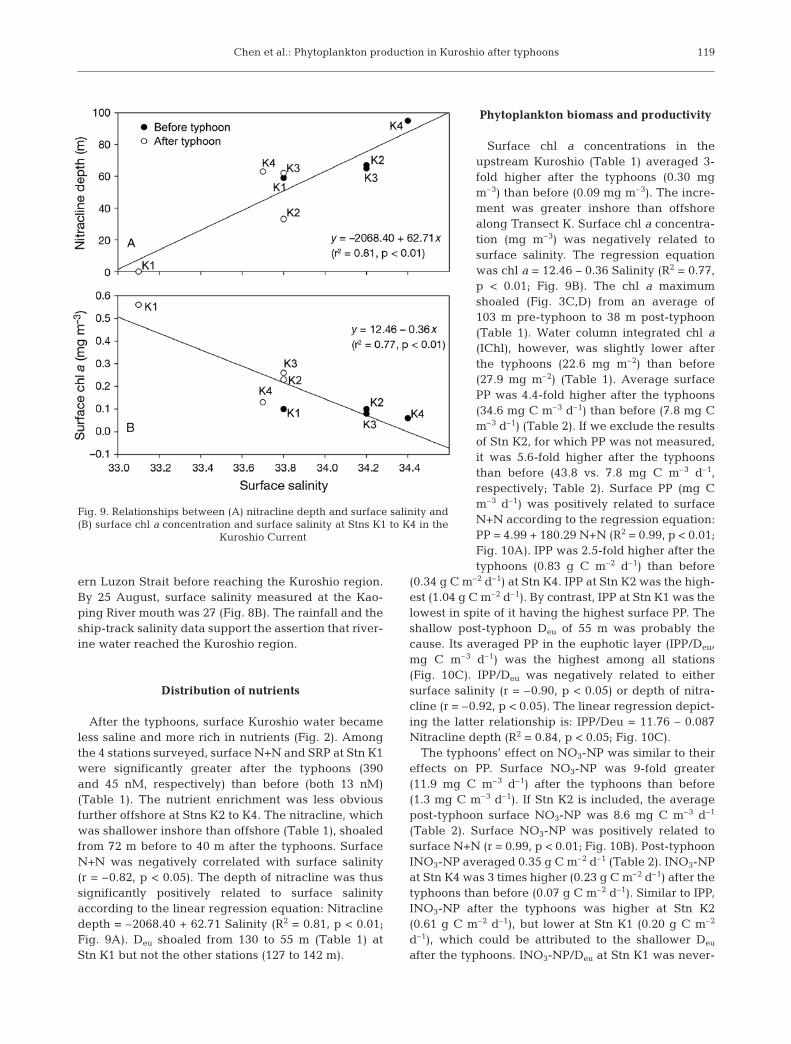
After the typhoons, surface Kuroshio water becameless saline and more rich in nutrients (Fig. 2). Amongthe 4 stations surveyed, surface N+N and SRP at Stn K1were significantly greater after the typhoons (390and 45 nM, respectively) than before (both 13 nM)(Table 1). The nutrient enrichment was less obviousfurther offshore at Stns K2 to K4. The nitracline, whichwas shallower inshore than offshore (Table 1), shoaledfrom 72 m before to 40 m after the typhoons. SurfaceN+N was negatively correlated with surface salinity(r = –0.82, p < 0.05). The depth of nitracline was thussignificantly positively related to surface salinityaccording to the linear regression equation: Nitraclinedepth = –2068.40 + 62.71 Salinity (R2 = 0.81, p < 0.01;Fig. 9A). Deu shoaled from 130 to 55 m (Table 1) atStn K1 but not the other stations (127 to 142 m).
Phytoplankton biomass and productivity
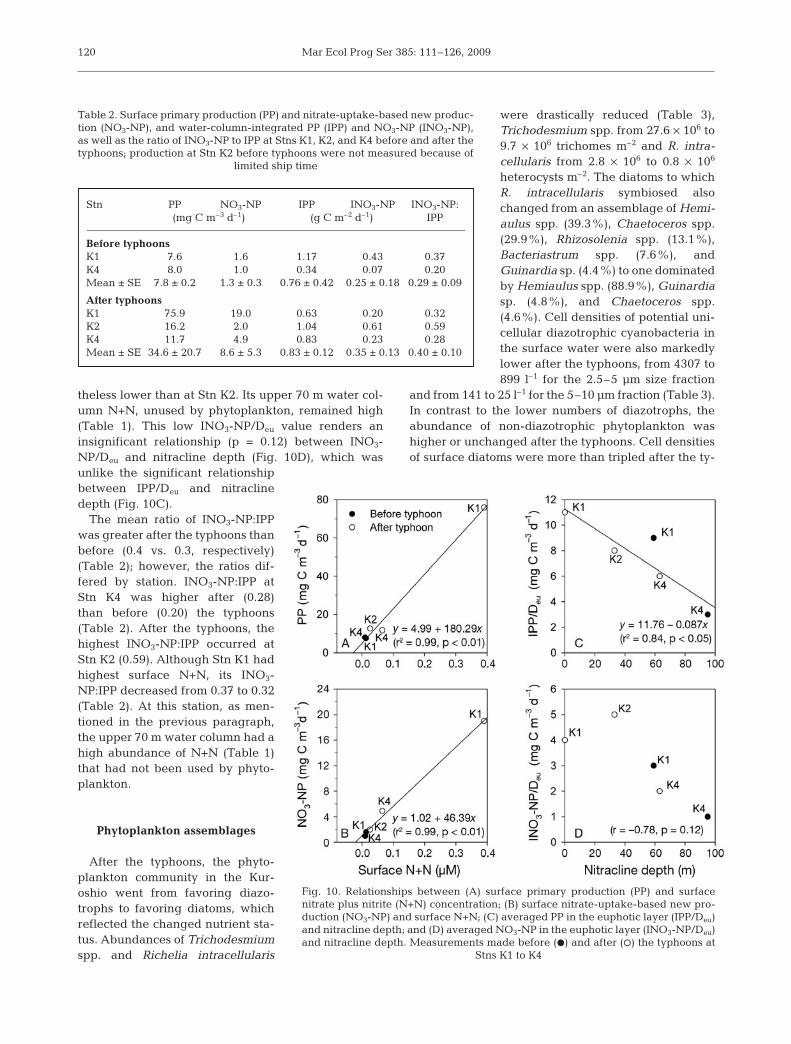
Surface chl a concentrations in theupstream Kuroshio (Table 1) averaged 3-fold higher after the typhoons (0.30 mgm–3) than before (0.09 mg m–3). The incre-ment was greater inshore than offshorealong Transect K. Surface chl a concentra-tion (mg m–3) was negatively related tosurface salinity. The regression equationwas chl a = 12.46 – 0.36 Salinity (R2 = 0.77,p < 0.01; Fig. 9B). The chl a maximumshoaled (Fig. 3C,D) from an average of103 m pre-typhoon to 38 m post-typhoon(Table 1). Water column integrated chl a(IChl), however, was slightly lower afterthe typhoons (22.6 mg m–2) than before(27.9 mg m–2) (Table 1). Average surfacePP was 4.4-fold higher after the typhoons(34.6 mg C m–3 d–1) than before (7.8 mg Cm–3 d–1) (Table 2). If we exclude the resultsof Stn K2, for which PP was not measured,it was 5.6-fold higher after the typhoonsthan before (43.8 vs. 7.8 mg C m–3 d–1,respectively; Table 2). Surface PP (mg Cm–3 d–1) was positively related to surfaceN+N according to the regression equation:PP = 4.99 + 180.29 N+N (R2 = 0.99, p < 0.01;Fig. 10A). IPP was 2.5-fold higher after thetyphoons (0.83 g C m–2 d–1) than before
(0.34 g C m–2 d–1) at Stn K4. IPP at Stn K2 was the high-est (1.04 g C m–2 d–1). By contrast, IPP at Stn K1 was thelowest in spite of it having the highest surface PP. Theshallow post-typhoon Deu of 55 m was probably thecause. Its averaged PP in the euphotic layer (IPP/Deu,mg C m–3 d–1) was the highest among all stations(Fig. 10C). IPP/Deu was negatively related to eithersurface salinity (r = –0.90, p < 0.05) or depth of nitra-cline (r = –0.92, p < 0.05). The linear regression depict-ing the latter relationship is: IPP/Deu = 11.76 – 0.087Nitracline depth (R2 = 0.84, p < 0.05; Fig. 10C).
The typhoons’ effect on NO3-NP was similar to theireffects on PP. Surface NO3-NP was 9-fold greater(11.9 mg C m–3 d–1) after the typhoons than before(1.3 mg C m–3 d–1). If Stn K2 is included, the averagepost-typhoon surface NO3-NP was 8.6 mg C m–3 d–1
(Table 2). Surface NO3-NP was positively related tosurface N+N (r = 0.99, p < 0.01; Fig. 10B). Post-typhoonINO3-NP averaged 0.35 g C m–2 d–1 (Table 2). INO3-NPat Stn K4 was 3 times higher (0.23 g C m–2 d–1) after thetyphoons than before (0.07 g C m–2 d–1). Similar to IPP,INO3-NP after the typhoons was higher at Stn K2(0.61 g C m–2 d–1), but lower at Stn K1 (0.20 g C m–2
d–1), which could be attributed to the shallower Deu
after the typhoons. INO3-NP/Deu at Stn K1 was never-
119
Fig. 9. Relationships between (A) nitracline depth and surface salinity and(B) surface chl a concentration and surface salinity at Stns K1 to K4 in the
Kuroshio Current
Mar Ecol Prog Ser 385: 111–126, 2009
theless lower than at Stn K2. Its upper 70 m water col-umn N+N, unused by phytoplankton, remained high(Table 1). This low INO3-NP/Deu value renders aninsignificant relationship (p = 0.12) between INO3-NP/Deu and nitracline depth (Fig. 10D), which wasunlike the significant relationshipbetween IPP/Deu and nitraclinedepth (Fig. 10C).
The mean ratio of INO3-NP:IPPwas greater after the typhoons thanbefore (0.4 vs. 0.3, respectively)(Table 2); however, the ratios dif-fered by station. INO3-NP:IPP atStn K4 was higher after (0.28)than before (0.20) the typhoons(Table 2). After the typhoons, thehighest INO3-NP:IPP occurred atStn K2 (0.59). Although Stn K1 hadhighest surface N+N, its INO3-NP:IPP decreased from 0.37 to 0.32(Table 2). At this station, as men-tioned in the previous paragraph,the upper 70 m water column had ahigh abundance of N+N (Table 1)that had not been used by phyto-plankton.
Phytoplankton assemblages
After the typhoons, the phyto-plankton community in the Kur-oshio went from favoring diazo-trophs to favoring diatoms, whichreflected the changed nutrient sta-tus. Abundances of Trichodesmiumspp. and Richelia intracellularis
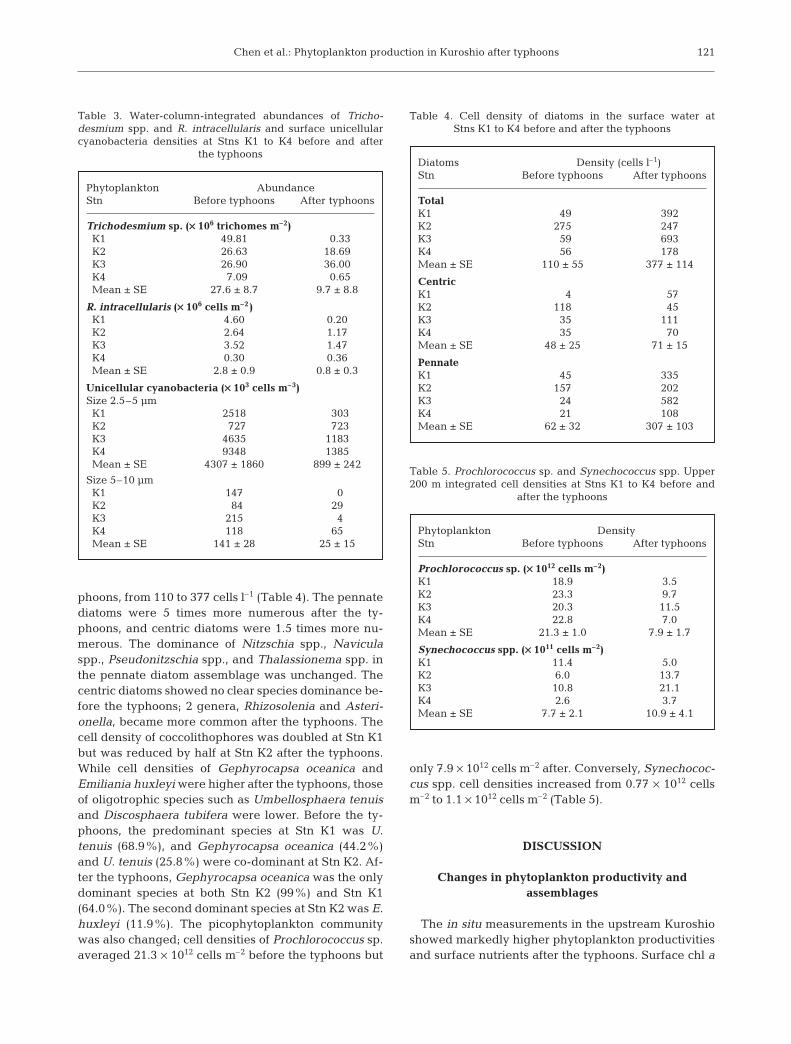
were drastically reduced (Table 3),Trichodesmium spp. from 27.6 × 10⁶ to9.7 × 106 trichomes m–2 and R. intra-cellularis from 2.8 × 10⁶ to 0.8 × 10⁶
heterocysts m–2. The diatoms to whichR. intracellularis symbiosed alsochanged from an assemblage of Hemi-aulus spp. (39.3%), Chaetoceros spp.(29.9%), Rhizosolenia spp. (13.1%),Bacteriastrum spp. (7.6%), andGuinardia sp. (4.4%) to one dominatedby Hemiaulus spp. (88.9%), Guinardiasp. (4.8%), and Chaetoceros spp.(4.6%). Cell densities of potential uni-cellular diazotrophic cyanobacteria inthe surface water were also markedlylower after the typhoons, from 4307 to899 l–1 for the 2.5–5 µm size fraction
and from 141 to 25 l–1 for the 5–10 µm fraction (Table 3).In contrast to the lower numbers of diazotrophs, theabundance of non-diazotrophic phytoplankton washigher or unchanged after the typhoons. Cell densitiesof surface diatoms were more than tripled after the ty-
120
Stn PP NO3-NP IPP INO3-NP INO3-NP:(mg C m–3 d–1) (g C m–2 d–1) IPP
Table 2. Surface primary production (PP) and nitrate-uptake-based new produc-tion (NO3-NP), and water-column-integrated PP (IPP) and NO3-NP (INO3-NP),as well as the ratio of INO3-NP to IPP at Stns K1, K2, and K4 before and after thetyphoons; production at Stn K2 before typhoons were not measured because of
limited ship time
Fig. 10. Relationships between (A) surface primary production (PP) and surfacenitrate plus nitrite (N+N) concentration; (B) surface nitrate-uptake-based new pro-duction (NO3-NP) and surface N+N; (C) averaged PP in the euphotic layer (IPP/Deu)and nitracline depth; and (D) averaged NO3-NP in the euphotic layer (INO3-NP/Deu)and nitracline depth. Measurements made before (D) and after (s) the typhoons at
Stns K1 to K4
Chen et al.: Phytoplankton production in Kuroshio after typhoons
phoons, from 110 to 377 cells l–1 (Table 4). The pennatediatoms were 5 times more numerous after the ty-phoons, and centric diatoms were 1.5 times more nu-merous. The dominance of Nitzschia spp., Naviculaspp., Pseudonitzschia spp., and Thalassionema spp. inthe pennate diatom assemblage was unchanged. Thecentric diatoms showed no clear species dominance be-fore the typhoons; 2 genera, Rhizosolenia and Asteri-onella, became more common after the typhoons. Thecell density of coccolithophores was doubled at Stn K1but was reduced by half at Stn K2 after the typhoons.While cell densities of Gephyrocapsa oceanica andEmiliania huxleyi were higher after the typhoons, thoseof oligotrophic species such as Umbellosphaera tenuisand Discosphaera tubifera were lower. Before the ty-phoons, the predominant species at Stn K1 was U.tenuis (68.9%), and Gephyrocapsa oceanica (44.2%)and U. tenuis (25.8%) were co-dominant at Stn K2. Af-ter the typhoons, Gephyrocapsa oceanica was the onlydominant species at both Stn K2 (99%) and Stn K1(64.0%). The second dominant species at Stn K2 was E.huxleyi (11.9%). The picophytoplankton communitywas also changed; cell densities of Prochlorococcus sp.averaged 21.3 × 10¹² cells m–2 before the typhoons but
only 7.9 × 10¹² cells m–2 after. Conversely, Synechococ-cus spp. cell densities increased from 0.77 × 10¹² cellsm–2 to 1.1 × 10¹² cells m–2 (Table 5).
DISCUSSION
Changes in phytoplankton productivity andassemblages
The in situ measurements in the upstream Kuroshioshowed markedly higher phytoplankton productivitiesand surface nutrients after the typhoons. Surface chl a
121
Phytoplankton AbundanceStn Before typhoons After typhoons
Table 3. Water-column-integrated abundances of Tricho-desmium spp. and R. intracellularis and surface unicellularcyanobacteria densities at Stns K1 to K4 before and after
the typhoons
Phytoplankton DensityStn Before typhoons After typhoons
Table 4. Cell density of diatoms in the surface water at Stns K1 to K4 before and after the typhoons
Mar Ecol Prog Ser 385: 111–126, 2009
concentration as well as NO3-NP and PP all wereenhanced after the typhoons. The values observedwere not only higher after the typhoons than before,but also higher than the multiyear averages measuredin the summer at the broader upstream Kuroshioregion including northern Luzon Strait (Chen et al.2008), with the values of PP being 1.6-fold higher andof NO3-NP 2.2-fold higher. Typically flourishing dia-zotrophs were quickly replaced by diatoms. The pres-ence of less-saline water in the upper water column ofthe Kuroshio indicated that the main cause of the bio-geochemical shift was mixing of surface water byriverine discharge rather than upwelling from the deepwhen the typhoons passed by. Interactions betweenocean and river discharge are especially important intropical and subtropical oceans such as Kuroshio thatare mostly stratified and oligotrophic. While nitrogeninput could be orders of magnitude greater than localinput source, similar chl a enhancement from storm-induced injection of the Mississippi River plume intothe open Gulf of Mexico was revealed in a satellitestudy (Yuan et al. 2004). Although production or chl aenhancement derived from satellite imagery tends tobe exaggerated because of increased abundance ofdissolved organic matter in near-shore waters, ourresults by direct measurements, even in the surfacewater of the most near-shore Stn K1, showed consis-tent chl a and production enhancements.
Input of SCS surface water enhanced the phytoplankton productivity in the Kuroshio
In the summer, surface SCS water spreads to near-shore Kuroshio off eastern Taiwan when the south-western monsoon prevails (Chern & Wang 1998).Before the typhoons, Stn K1 had a surface salinity of33.8, implicating strongly its origin from the SCS,which has a lower surface salinity than the Kuroshio.IPP and INP at Stn K1 were higher than at the offshoreStn K4 that was not mixed by the surface SCS water.Chen et al. (2008) reported a mean IPP of 0.51 g C m–2
d–1 and INO3-NO3-NP of 0.16 g C m–2 d–1 in theupstream Kuroshio; IPP and INO3-NP measured in thepresent study at Stn K1 before the typhoons were atleast 2-fold higher. After the typhoons, increments inphytoplankton biomass and productivity were evenhigher as the influx from surface SCS was stronger.
Factors affecting biogeochemical changes after the typhoons
In addition to enriching nutrients, a typhoon intensi-fies water turbulence and diminishes sunlight. These
abrupt changes might affect phytoplankton growthquantitatively (best reflected by productivity) and qual-itatively (by phytoplankton assemblages). Phytoplank-ton productivity at Stn K1 was likely limited by light,not by nutrients, because of the increased entrainmentof nutrients and associated suspended particles, proba-bly from riverine mixing. After the typhoons, water-column integrated productivity (IPP and INO3-NP) atStn K1 was only 50% of the pre-typhoon level. This re-duction was probably due to reduced light availabilityin the water column for phytoplankton growth. The eu-photic layer of Stn K1 was reduced from >100 m to 55 mafter the typhoons (Table 1). The discrepancy thatStn K1 had low IPP and INO3-NP but high IPP/Deu andlow INO3-NP/Deu as shown in Fig. 10 could be ex-plained by the presence of non-nitrate nitrogen such asNH4 that is usually preferred and readily used byphytoplankton (Dortch 1990). There were no measure-ments made of NH4 in the present study. A study con-ducted by Ning et al. (2001) in the estuary of the Kaop-ing River, the largest nitrogen source along southernTaiwan coast, reported an approximate NH4 concentra-tion of 125 µM in the dry season (February) and 7 µM inthe wet season (August). How much dilution would oc-cur through the riverine mixing is not known. If riverineinput is driving the production, the resulting PP fromNH4 assimilation can therefore be considered to be‘new production’. This might then affect (underesti-mate) the significance of the new production estimatecalculated using nitrate alone. The result at Stn K4 thatthe post-typhoon increase in IPP was far greater thanthat in INO3-NP (Table 2) might also be attributed toenhanced non-nitrate nitrogen assimilation after the ty-phoons. The presence of abundant N+N in the upper70 m water column after the typhoons (Table 1) indi-cates strongly that nitrogen did not limit phytoplanktongrowth.
Storm-caused shoaling of the euphotic layer has animportant implication for satellite imagery estimates ofPP. Lin et al. (2003) used satellite imagery to estimatethe effects of a typhoon on IPP in the SCS. Their IPPwas estimated using 3 variables (surface water chl aconcentration, temperature, and PAR) that were gen-erated from satellite images. They used a 7-order poly-nomial relationship between maximum carbon fixationrate within a water column and temperature, devel-oped by Behrenfeld & Falkowski (1997), to calculateIPP. Our results suggest, however, that their IPP esti-mates could deviate greatly from in situ direct mea-surements if their study had been conducted in watersprone to riverine mixing. The surface temperatures wemeasured along Transect K were up to 30.3°C, which ishigher than the temperature range (–1 to 29°C) appliedto the equation of Behrenfeld & Falkowski (1997); how-ever, the maximum carbon fixation rate in their equa-
122
Chen et al.: Phytoplankton production in Kuroshio after typhoons
tion increased as temperature decreased between 29and 20°C. If we assume that surface PAR at Stn K1 wasthe same before and after the typhoons, and ignore theeffect of temperature difference, with a surface chl aconcentration after the typhoon as high as 0.56 mg m–3,then the model would predict an IPP at least 5.6-foldhigher than that from before the typhoons when chl awas 0.10 mg m–3. In fact, our in situ measurements ofIPP revealed a 50% reduction instead. This exampleclearly demonstrates the need for caution when satel-lite images are used in estimating IPP from chl a con-centration in waters influenced by terrestrial influx.
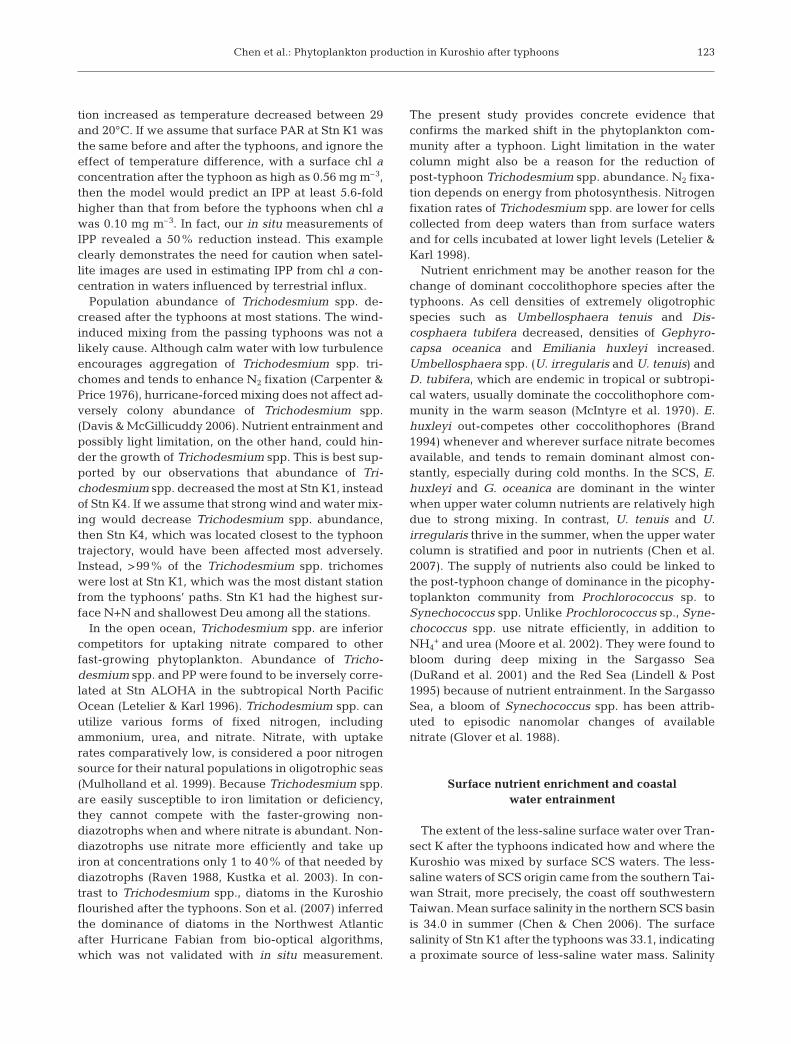
Population abundance of Trichodesmium spp. de-creased after the typhoons at most stations. The wind-induced mixing from the passing typhoons was not alikely cause. Although calm water with low turbulenceencourages aggregation of Trichodesmium spp. tri-chomes and tends to enhance N2 fixation (Carpenter &Price 1976), hurricane-forced mixing does not affect ad-versely colony abundance of Trichodesmium spp.(Davis & McGillicuddy 2006). Nutrient entrainment andpossibly light limitation, on the other hand, could hin-der the growth of Trichodesmium spp. This is best sup-ported by our observations that abundance of Tri-chodesmium spp. decreased the most at Stn K1, insteadof Stn K4. If we assume that strong wind and water mix-ing would decrease Trichodesmium spp. abundance,then Stn K4, which was located closest to the typhoontrajectory, would have been affected most adversely.Instead, >99% of the Trichodesmium spp. trichomeswere lost at Stn K1, which was the most distant stationfrom the typhoons’ paths. Stn K1 had the highest sur-face N+N and shallowest Deu among all the stations.
In the open ocean, Trichodesmium spp. are inferiorcompetitors for uptaking nitrate compared to otherfast-growing phytoplankton. Abundance of Tricho-desmium spp. and PP were found to be inversely corre-lated at Stn ALOHA in the subtropical North PacificOcean (Letelier & Karl 1996). Trichodesmium spp. canutilize various forms of fixed nitrogen, includingammonium, urea, and nitrate. Nitrate, with uptakerates comparatively low, is considered a poor nitrogensource for their natural populations in oligotrophic seas(Mulholland et al. 1999). Because Trichodesmium spp.are easily susceptible to iron limitation or deficiency,they cannot compete with the faster-growing non-diazotrophs when and where nitrate is abundant. Non-diazotrophs use nitrate more efficiently and take upiron at concentrations only 1 to 40% of that needed bydiazotrophs (Raven 1988, Kustka et al. 2003). In con-trast to Trichodesmium spp., diatoms in the Kuroshioflourished after the typhoons. Son et al. (2007) inferredthe dominance of diatoms in the Northwest Atlanticafter Hurricane Fabian from bio-optical algorithms,which was not validated with in situ measurement.
The present study provides concrete evidence thatconfirms the marked shift in the phytoplankton com-munity after a typhoon. Light limitation in the watercolumn might also be a reason for the reduction ofpost-typhoon Trichodesmium spp. abundance. N2 fixa-tion depends on energy from photosynthesis. Nitrogenfixation rates of Trichodesmium spp. are lower for cellscollected from deep waters than from surface watersand for cells incubated at lower light levels (Letelier &Karl 1998).
Nutrient enrichment may be another reason for thechange of dominant coccolithophore species after thetyphoons. As cell densities of extremely oligotrophicspecies such as Umbellosphaera tenuis and Dis-cosphaera tubifera decreased, densities of Gephyro-capsa oceanica and Emiliania huxleyi increased.Umbellosphaera spp. (U. irregularis and U. tenuis) andD. tubifera, which are endemic in tropical or subtropi-cal waters, usually dominate the coccolithophore com-munity in the warm season (McIntyre et al. 1970). E.huxleyi out-competes other coccolithophores (Brand1994) whenever and wherever surface nitrate becomesavailable, and tends to remain dominant almost con-stantly, especially during cold months. In the SCS, E.huxleyi and G. oceanica are dominant in the winterwhen upper water column nutrients are relatively highdue to strong mixing. In contrast, U. tenuis and U.irregularis thrive in the summer, when the upper watercolumn is stratified and poor in nutrients (Chen et al.2007). The supply of nutrients also could be linked tothe post-typhoon change of dominance in the picophy-toplankton community from Prochlorococcus sp. toSynechococcus spp. Unlike Prochlorococcus sp., Syne-chococcus spp. use nitrate efficiently, in addition toNH4
+ and urea (Moore et al. 2002). They were found tobloom during deep mixing in the Sargasso Sea(DuRand et al. 2001) and the Red Sea (Lindell & Post1995) because of nutrient entrainment. In the SargassoSea, a bloom of Synechococcus spp. has been attrib-uted to episodic nanomolar changes of availablenitrate (Glover et al. 1988).
Surface nutrient enrichment and coastal water entrainment
The extent of the less-saline surface water over Tran-sect K after the typhoons indicated how and where theKuroshio was mixed by surface SCS waters. The less-saline waters of SCS origin came from the southern Tai-wan Strait, more precisely, the coast off southwesternTaiwan. Mean surface salinity in the northern SCS basinis 34.0 in summer (Chen & Chen 2006). The surfacesalinity of Stn K1 after the typhoons was 33.1, indicatinga proximate source of less-saline water mass. Salinity
123
Mar Ecol Prog Ser 385: 111–126, 2009
distribution recorded along the ship track indicates thatsurface salinity dropped to as low as 19.8 at 22.6° N andincreased southwards to 27 at 22° N in the southern Tai-wan Strait (Fig. 7). The SMRs in eastern Taiwan, facingthe Kuroshio, are generally very small, and discharge atthe north side of Transect K. As surface flows near Stn K1were strongly northward (Fig. 5), any significant influ-ence from these SMRs was unlikely. The larger SMRs inwestern Taiwan that discharge into the Taiwan Strait arethus the more likely source of freshwater that dilutedwidely the waters off southern Taiwan, including theKuroshio, after the typhoons.
The patterns of nutrient distribution and light atten-uation in the Kuroshio also support this idea. After thetyphoons, the entrainment of the nutrient-laden river-ine water revealed a high surface N+N (390 nM) atStn K1, which is much higher than the mean summer-time N+N of 13 nM in the SCS basin (Chen & Chen2006). The sediment particles loaded in the riverinewater brought about a shallow euphotic layer at StnK1. The biogeochemical effects of the entrained river-ine water could be far-reaching. In addition to biologi-cal particles, lithogenic and nonlithogenic particles(Liu et al. 2006), as well as anthropogenic pollutants,such as polycyclic aromatic hydrocarbons (Fang et al.2009) that are present in the riverine water could betransported downstream to the shelf of the East ChinaSea and even to Japan as the Kuroshio flows north.
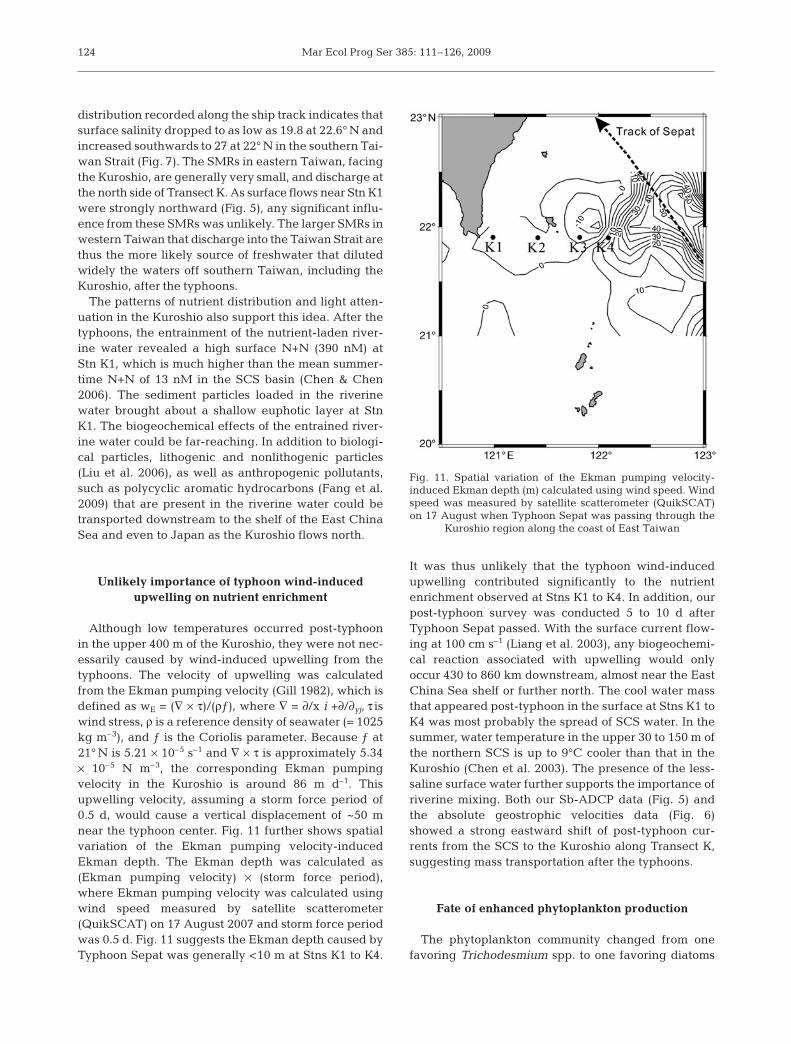
Unlikely importance of typhoon wind-inducedupwelling on nutrient enrichment
Although low temperatures occurred post-typhoonin the upper 400 m of the Kuroshio, they were not nec-essarily caused by wind-induced upwelling from thetyphoons. The velocity of upwelling was calculatedfrom the Ekman pumping velocity (Gill 1982), which isdefined as wE = (∇ × τ)/(ρƒ), where ∇ = ∂/x i +∂/∂yj, τ iswind stress, ρ is a reference density of seawater (= 1025kg m–3), and ƒ is the Coriolis parameter. Because ƒ at21° N is 5.21 × 10⁻⁵ s–1 and ∇ × τ is approximately 5.34× 10⁻⁵ N m–3, the corresponding Ekman pumpingvelocity in the Kuroshio is around 86 m d–1. Thisupwelling velocity, assuming a storm force period of0.5 d, would cause a vertical displacement of ~50 mnear the typhoon center. Fig. 11 further shows spatialvariation of the Ekman pumping velocity-inducedEkman depth. The Ekman depth was calculated as(Ekman pumping velocity) × (storm force period),where Ekman pumping velocity was calculated usingwind speed measured by satellite scatterometer(QuikSCAT) on 17 August 2007 and storm force periodwas 0.5 d. Fig. 11 suggests the Ekman depth caused byTyphoon Sepat was generally <10 m at Stns K1 to K4.
It was thus unlikely that the typhoon wind-inducedupwelling contributed significantly to the nutrientenrichment observed at Stns K1 to K4. In addition, ourpost-typhoon survey was conducted 5 to 10 d afterTyphoon Sepat passed. With the surface current flow-ing at 100 cm s–1 (Liang et al. 2003), any biogeochemi-cal reaction associated with upwelling would onlyoccur 430 to 860 km downstream, almost near the EastChina Sea shelf or further north. The cool water massthat appeared post-typhoon in the surface at Stns K1 toK4 was most probably the spread of SCS water. In thesummer, water temperature in the upper 30 to 150 m ofthe northern SCS is up to 9°C cooler than that in theKuroshio (Chen et al. 2003). The presence of the less-saline surface water further supports the importance ofriverine mixing. Both our Sb-ADCP data (Fig. 5) andthe absolute geostrophic velocities data (Fig. 6)showed a strong eastward shift of post-typhoon cur-rents from the SCS to the Kuroshio along Transect K,suggesting mass transportation after the typhoons.
Fate of enhanced phytoplankton production
The phytoplankton community changed from onefavoring Trichodesmium spp. to one favoring diatoms
124
Fig. 11. Spatial variation of the Ekman pumping velocity-induced Ekman depth (m) calculated using wind speed. Windspeed was measured by satellite scatterometer (QuikSCAT)on 17 August when Typhoon Sepat was passing through the
Kuroshio region along the coast of East Taiwan
Chen et al.: Phytoplankton production in Kuroshio after typhoons
after the typhoons, which supports the idea that moreof the enhanced biogenic carbon is exported to deepwaters (Dugdale & Wilkerson 1998) than recycled inthe shallow-water food web. Unlike diatoms, Tri-chodesmium spp. are positively buoyant and their bio-mass loss to sinking appears to be minor compared tocell lysis, extracellular release, and grazing (Mulhol-land 2007). Contrary to the traditional view thatincreased turbulence favors buoyancy and preventssinking of nonmotile organisms such as diatoms,turbulence from typhoons is a stress that increasessinking of phytoplankton cells. In an experiment with4 phytoplankton species, including 2 diatoms, Ruizet al. (2004) demonstrated that cell-sinking velocityincreased when culture water turbulence was intensi-fied. As the typhoons pass, the ensuing shift to diatomdomination and prolonged agitation of surface waterwould favor exportation over accumulation or recy-cling of biogenic carbons. The area of the region thatwould be affected by the riverine input could covermost of the near-shore waters along the coast of south-ern Taiwan. However, an estimation of additionalnew carbon that could be exportable due to thetyphoons is beyond the scope of the present study.Future studies evaluating these changes in term of car-bon, such as converting cell numbers of phytoplanktonto biovolume and then carbon concentration, couldshow the relative importance of the typhoon eventsand how they would affect the carbon cycle. Maximumpotential intensity of typhoons is projected to increaseby 12 to 20% if atmospheric CO2 concentrationsdouble (Pittock 1999). How this impacts on newproduction and sinking flux of carbon in this regionremains to be studied.
In summary, the increased riverine discharge fromthe intensified precipitation from typhoons flooded abroad area off southern Taiwan and was the source ofless-saline surface water in the upstream Kuroshio.Release from nutrient limitation by riverine mixingrather than by typhoon-induced upwelling was morethe cause of the enhanced PP and NO3-NP in theupstream Kuroshio measured days after the passage ofthe typhoons. A clear regime shift from Trichodesmiumspp. to diatom dominance supports the assertion thatthe biogenetic carbon enhanced by the typhoonstended to sink rather than be recycled in the upper-water food web.
Acknowledgements. We thank Y. H. Lin, C. C. Huang, and H.Sen for their assistance in sample collection and analyses, thecaptains and crews of RV ‘Ocean Researcher’ I and III for theircooperation, and Sea Pen Scientific Writing for editing ser-vices. This research was in part supported by the NationalScience Council of Taiwan through Grants NSC 95-2611-M110-002, NSC 95-2611-M110-004, NSC 96-2611-M110-013,and NSC 96-2628-M110-005.
Brand LE (1994) Physiological ecology of marine phytoplank-ton. In: Winter A, Siesser W (eds) Coccolithophores. Cam-bridge University Press, Cambridge, p 39–49
Campbell L (2001) Flow cytometric analysis of autotrophicpicoplankton. Methods Microbiol 30:317–343
Carpenter EJ, Price C (1976) Marine Oscillatoria (Trichodes-mium): explanation for aerobic nitrogen fixation withoutheterocysts. Science 191:1278–1280
Chen YLL (2005) Spatial and seasonal variations of nitrate-based new production and primary production in theSouth China Sea. Deep-Sea Res I 52:319–340
Chen YLL, Chen HY (2006) Seasonal dynamics of primaryand new production in the northern South China Sea: thesignificance of river discharge and nutrient advection.Deep-Sea Res I 53:971–986
Chen YLL, Chen HY, Lin YH (2003) Distribution and down-ward flux of Trichodesmium in the South China Sea asinfluenced by the transport from the Kuroshio Current.Mar Ecol Prog Ser 259:47–57
Chen YLL, Chen HY, Chung CW (2007) Seasonal variabilityof coccolithophore abundance and assemblage in thenorthern South China Sea. Deep-Sea Res II 54:1617–1633
Chen YLL, Chen HY, Tuo S, Ohki K (2008) Seasonal dynam-ics of new production from Trichodesmium N2 fixation andnitrate uptake in the upstream Kuroshio and South ChinaSea basin. Limnol Oceanogr 53:1705–1721
Chern CS, Wang J (1998) The spreading of the South ChinaSea water to the east of Taiwan during summertime. ActaOceanogr Taiwanica 36:97–109
Cochlan WP, Harrison PJ, Denman KL (1991) Diel periodicityof nitrogen uptake by marine phytoplankton in nitrate-rich environments. Limnol Oceanogr 36:1689–1700
Davis CS, McGillicuddy DJ Jr (2006) Transatlantic abundanceof the N2-fixing colonial cyanobacterium Trichodesmium.Science 312:1517–1520
Dortch Q (1990) The interaction between ammonium andnitrate uptake in phytoplankton. Mar Ecol Prog Ser 61:183–201
Dugdale RC, Wilkerson FP (1998) Silicate regulation of newproduction in the equatorial Pacific upwelling. Nature391:270–273
DuRand MD, Olson RJ, Chisholm SW (2001) Phytoplanktonpopulation dynamics at the Bermuda Atlantic time seriesstation in the Sargasso Sea. Deep-Sea Res II 48:1983–2003
Fang MD, Chang WK, Lee CL, Liu JT (2009) The use of poly-cyclic aromatic hydrocarbons as a particulate tracer in thewater column of (Gaoping) Kaoping submarine canyon.J Mar Syst 76:457–467
Garside C (1982) A chemiluminescent technique for thedetermination of nanomolar concentrations of nitrate andnitrite in seawater. Mar Chem 11:159–167
Gill AE (1982) Atmosphere–ocean dynamics. Internationalgeophysics, Vol 30. Academic Press, San Diego, CA
Glover HE, Prézelin BB, Campbell L, Wyman M, Garside C(1988) A nitrate-dependent Synechococcus bloom in sur-face Sargasso Sea water. Nature 331:161–163
Goldsmith ST, Carey AE, Lyons WB, Kao SJ, Lee TY, Chen J(2008) Extreme storm events, landscape denudation, and
James RT, Chimney MJ, Sharfstein B, Engstrom DR, SchottlerSP, East T, Jin KR (2008) Hurricane effects on a shallowlake ecosystem, Lake Okeechobee, Florida (USA). Fun-dam Appl Limnol 172:273–287
Jan S, Chern CS, Wang J (2002) Transition of tidal waves fromthe East to South China Seas over the Taiwan Strait: influ-ence of the abrupt step in the topography. J Oceanogr 58:837–850
Kustka A, Sanudo-Wilhelmy S, Carpenter EJ, Capone DG,Raven JA (2003) A revised estimate of the iron use effi-ciency of nitrogen fixation, with special reference to themarine cyanobacterium Trichodesmium spp. (Cyano-phyta). J Phycol 39:12–25
Letelier RM, Karl DM (1996) Role of Trichodesmium spp. inthe productivity of the subtropical North Pacific Ocean.Mar Ecol Prog Ser 133:263–273
Letelier RM, Karl DM (1998) Trichodesmium spp. physiologyand nutrient fluxes in the North Pacific subtropical gyre.Aquat Microb Ecol 15:265–276
Liang WD, Tang TY, Yang YJ, Ko MT, Chung WS (2003)Upper-ocean currents around Taiwan. Deep-Sea Res II50:1085–1105
Lin I, Liu WT, Wu CC, Wong GTF and others (2003) New evi-dence for enhanced ocean primary production triggeredby tropical cyclone. Geophys Res Lett 30:1718
Lindell D, Post AF (1995) Ultraphytoplankton sucession istriggered by deep winter mixing in the Gulf of Aqaba(Eilat), Red Sea. Limnol Oceanogr 40:1130–1141
Liu JT, Lin HL, Hung JJ (2006) A submarine canyon conduitunder typhoon conditions off Southern Taiwan. Deep-SeaRes I 53:223–240
McIntyre A, Bé AWH, Roche MB (1970) Modern Pacific coc-colithophorids: a paleontological thermometer. Trans NYAcad Sci 32:720–731
Moore LR, Post AF, Rocap G, Chisholm SW (2002) Utilizationof different nitrogen sources by the marine cyanobacteriaProchlorococcus and Synechococcus. Limnol Oceanogr47:989–996
Mulholland MR (2007) The fate of nitrogen fixed by dia-zotrophs in the ocean. Biogeosciences 4:37–51
Mulholland MR, Shoemaker C, Ohki K, Capone DG (1999)Utilization of combined forms of N in cultures and field
Ning SK, Chang NB, Yang L, Chen HW, Hsu HY (2001)Assessing pollution prevention program by QUAL2Esimulation analysis for the Kao-Ping River Basin, Taiwan.J Environ Manage 61:61–76
Paerl HW, Valdes LM, Peierls BL, Adolf JE, Harding LW Jr(2006) Anthropogenic and climatic influences on theeutrophication of large estuarine ecosystems. LimnolOceanogr 51:448–462
Pittock A (1999) Coral reefs and environmental change:Adaptation to what? Am Zool 39:10–29
Raven JA (1988) The iron and molybdenum use efficiencies ofplant growth with different energy, carbon and nitrogensources. New Phytol 109:279–287
Ruiz J, Macias D, Peters F (2004) Turbulence increases theaverage settling velocity of phytoplankton cells. Proc NatlAcad Sci USA 101:17720–17724
Siswanto E, Ishizaka J, Yokouchi K, Tanaka K, Tan CK (2007)Estimation of interannual and interdecadal variations oftyphoon-induced primary production: a case study for theouter shelf of the East China Sea. Geophys Res Lett 34:L03604
Son S, Platt T, Fuentes-Yaco C, Bouman H, Devred E, Wu Y,Sathyendranath S (2007) Possible biogeochemical re-sponse to the passage of Hurricane Fabian observed bysatellites. J Plankton Res 29:687–697
Thomson-Bulldis A, Karl D (1998) Application of a novelmethod for phosphorus determinations in the oligotrophicNorth Pacific Ocean. Limnol Oceanogr 43:1565–1577
Vaulot D, Courtiest C, Partensky E (1989) A simple method topreserve oceanic phytoplankton for flow cytometric analy-ses. Cytometry 10:629–635
Walker ND, Leben RR, Balasubramanian S (2005) Hurricane-forced upwelling and chlorophyll a enhancement withincold-core cyclones in the Gulf of Mexico. Geophys ResLett 32:L18610
Yuan J, Miller RL, Powell RT, Dagg MJ (2004) Storm-inducedinjection of the Mississippi River plume into the open Gulfof Mexico. Geophys Res Lett 31:L09312
Zhang W, Wang R (2000) Rapid changes in stocks of ciliatemicrozooplankton associated with a hurricane in theBohai Sea (China). Aquat Microb Ecol 23:97–101
126
Editorial responsibility: Rodney Forster,Lowestoft, UK
Submitted: January 5, 2009; Accepted: April 8, 2009Proofs received from author(s): June 8, 2008