Science Journal of Analytical Chemistry 2016; 4(5): 59-65 http://www.sciencepublishinggroup.com/j/sjac doi: 10.11648/j.sjac.20160405.11 ISSN: 2376-8045 (Print); ISSN: 2376-8053 (Online) Phytoremediation of Contaminated Soils from Challawa Industrial Estate, Kano-Nigeria U. Abdullahi 1, * , A. A. Audu 1 , Kalimullah 2 , L. Shuaibu 3 1 Department of Pure and Industrial Chemistry, Faculty of Natural and Applied Sciences, Umaru Musa Yar’Adua University, Katsina-Nigeria 2 Department of Biological Sciences, Faculty of Natural and Applied Sciences, Umaru Musa Yar’Adua University, Katsina-Nigeria 3 Department of Pure and Industrial Chemistry, Faculty of Science, Federal University Birnin Kebbi, Kebbi-Nigeria Email address: [email protected] (U. Abdullahi) * Corresponding author To cite this article: U. Abdullahi, A. A. Audu, Kalimullah, L. Shuaibu. Phytoremediation of Contaminated Soils from Challawa Industrial Estate, Kano-Nigeria. Science Journal of Analytical Chemistry. Vol. 4, No. 5, 2016, pp. 59-65. doi: 10.11648/j.sjac.20160405.11 Received: August 22, 2016; Accepted: September 5, 2016; Published: September 22, 2016 Abstract: Field studies to examine the phytoremediation potential of some plants for metals (Cd, Cr, Cu, Fe, Mn, Ni, Pb and Zn) in metals contaminated soils of Challawa industrial estate, Kano has been carried out. A total of one hundred and eighty (180) samples comprising of 80 (soils), 20 (effluents), and 80 (plant parts) of Jatropha (Jatropha curcas), Neem (Azadirachta indica) and Baobab (Adansonia digitata) were analyzed. 0.50g of the plant tissue and 1.0g of soil sample and 50mL of the effluent sample were digested using triacid digestion method and the levels of the metals were determined by the use of atomic absorption spectrophotometry. The mean levels of the metals in plants and soils from contaminated and control sites were found to be in the sequence of Fe (406.27±45.93)> Zn (137.20±8.00)> Cu (118.60±0.00)> Cd (62.57±6.86)> Mn (21.53±1.79)> Ni (14.36±2.22)> Cr (13.73±1.79)> Pb (12.80±0.00) and Fe (130.23±18.01)> Zn (65.36±4.90)> Cu (26.22±5.50)> Cd (23.08±2.43)> Ni (5.70±0.00)> Mn (4.86±2.21)> Cr (4.80±2.10)> Pb (3.03±1.50) respectively. The contamination factor (CF) of all the metals in the plants were found to be in the sequence of Cd (8.45±1.42)> Cu (2.52±1.00)> Cr (2.28±0.00)> Zn (1.80±1.19)> Fe (1.56±0.00)> Pb (1.49±0.11)> Mn (1.09±0.18)> Ni (1.00±0.06). The results showed that these plants can be used for the phytoextraction of the metals from contaminated soils. The values of bioaccumulation and translocation factors were also found to be more than one in almost all cases. From these results it could be recommended that the three plants investigated would be ideal for phytoremediation in multi-metal contaminated soils. Keywords: Phytoremediation, Contamination Factor, Bioaccumulation Factor, Translocation Factor, Heavy Metals, Contaminated Soils 1. Introduction Plant based bioremediation technologies have been collectively termed as phytoremediation, referring to the use of green plants and associated micro biota for the in-situ treatment of contaminated soil and ground water [1]. The idea of using metal accumulating plants to remove heavy metals and other compounds was firstly introduced more than 310 years ago [2]. Phytoremediation is an environmentally friendly, safe and cheap technique to remove the pollutants from the environment. Phytoremediation as a technology uses plants to clean up contaminated environment. It is a low cost, long term, environmentally and aesthetically friendly method of immobilizing/stabilizing, degrading, transferring, removing, or detoxifying contaminants, including metals, pesticides, hydrocarbons and chlorinated solvents [3, 4, 5]. Over the past three decades, it has become a highly accepted means of detoxifying contaminated water and soils [6].The development of phytoremediation is being driven primarily by the high cost of many other soil remediation methods as well as a desire to use a “green”, sustainable process. Metals contaminated soils are remediated by conventional or unconventional techniques but the in-situ (unconventional) techniques are favored over the ex-situ (conventional) techniques due to their low cost and reduced impact on the ecosystem. Conventionally, the ex-situ
Transcript
Science Journal of Analytical Chemistry 2016; 4(5): 59-65
http://www.sciencepublishinggroup.com/j/sjac
doi: 10.11648/j.sjac.20160405.11
ISSN: 2376-8045 (Print); ISSN: 2376-8053 (Online)
Phytoremediation of Contaminated Soils from Challawa Industrial Estate, Kano-Nigeria
U. Abdullahi1, *
, A. A. Audu1, Kalimullah
2, L. Shuaibu
3
1Department of Pure and Industrial Chemistry, Faculty of Natural and Applied Sciences, Umaru Musa Yar’Adua University, Katsina-Nigeria 2Department of Biological Sciences, Faculty of Natural and Applied Sciences, Umaru Musa Yar’Adua University, Katsina-Nigeria 3Department of Pure and Industrial Chemistry, Faculty of Science, Federal University Birnin Kebbi, Kebbi-Nigeria
To cite this article: U. Abdullahi, A. A. Audu, Kalimullah, L. Shuaibu. Phytoremediation of Contaminated Soils from Challawa Industrial Estate, Kano-Nigeria.
Science Journal of Analytical Chemistry. Vol. 4, No. 5, 2016, pp. 59-65. doi: 10.11648/j.sjac.20160405.11
Received: August 22, 2016; Accepted: September 5, 2016; Published: September 22, 2016
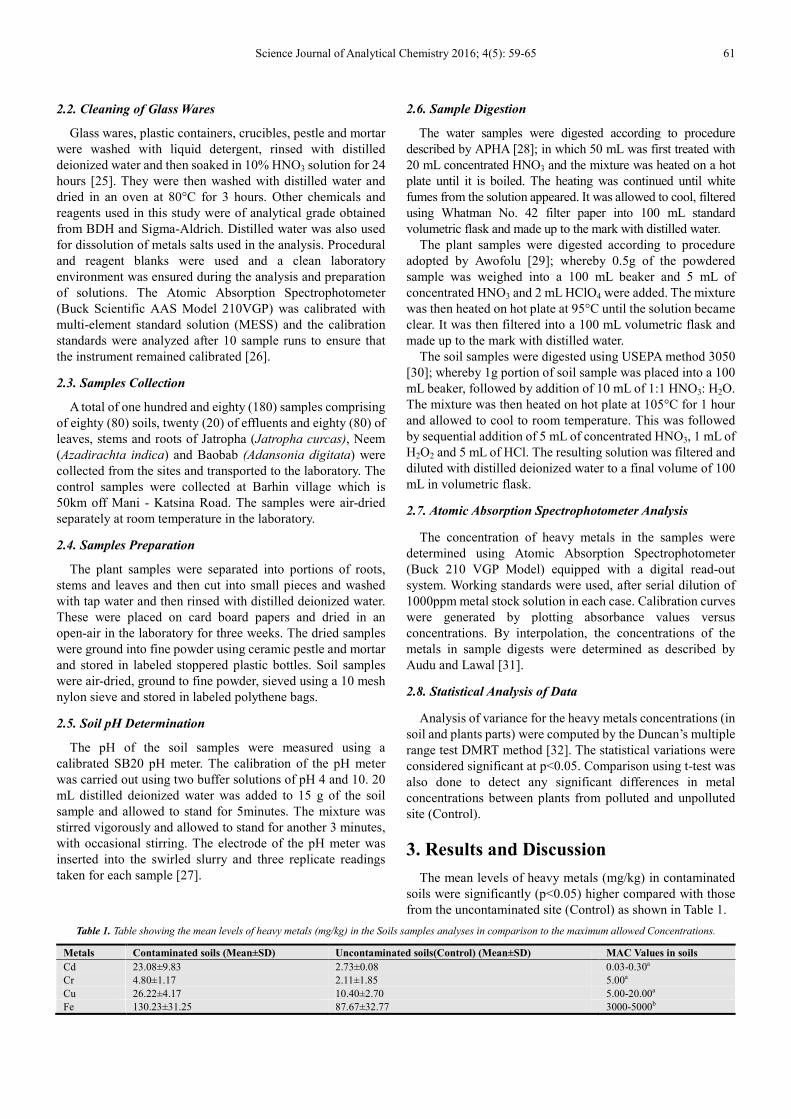
Abstract: Field studies to examine the phytoremediation potential of some plants for metals (Cd, Cr, Cu, Fe, Mn, Ni, Pb and Zn)
in metals contaminated soils of Challawa industrial estate, Kano has been carried out. A total of one hundred and eighty (180)
samples comprising of 80 (soils), 20 (effluents), and 80 (plant parts) of Jatropha (Jatropha curcas), Neem (Azadirachta indica)
and Baobab (Adansonia digitata) were analyzed. 0.50g of the plant tissue and 1.0g of soil sample and 50mL of the effluent sample
were digested using triacid digestion method and the levels of the metals were determined by the use of atomic absorption
spectrophotometry. The mean levels of the metals in plants and soils from contaminated and control sites were found to be in the
sequence of Fe (406.27±45.93)> Zn (137.20±8.00)> Cu (118.60±0.00)> Cd (62.57±6.86)> Mn (21.53±1.79)> Ni (14.36±2.22)>
Cr (13.73±1.79)> Pb (12.80±0.00) and Fe (130.23±18.01)> Zn (65.36±4.90)> Cu (26.22±5.50)> Cd (23.08±2.43)> Ni
(5.70±0.00)> Mn (4.86±2.21)> Cr (4.80±2.10)> Pb (3.03±1.50) respectively. The contamination factor (CF) of all the metals in
the plants were found to be in the sequence of Cd (8.45±1.42)> Cu (2.52±1.00)> Cr (2.28±0.00)> Zn (1.80±1.19)> Fe (1.56±0.00)>
Pb (1.49±0.11)> Mn (1.09±0.18)> Ni (1.00±0.06). The results showed that these plants can be used for the phytoextraction of the
metals from contaminated soils. The values of bioaccumulation and translocation factors were also found to be more than one in
almost all cases. From these results it could be recommended that the three plants investigated would be ideal for
phytoremediation in multi-metal contaminated soils.
Keywords: Phytoremediation, Contamination Factor, Bioaccumulation Factor, Translocation Factor, Heavy Metals,
Contaminated Soils
1. Introduction
Plant based bioremediation technologies have been
collectively termed as phytoremediation, referring to the use
of green plants and associated micro biota for the in-situ
treatment of contaminated soil and ground water [1]. The idea
of using metal accumulating plants to remove heavy metals
and other compounds was firstly introduced more than 310
years ago [2]. Phytoremediation is an environmentally
friendly, safe and cheap technique to remove the pollutants
from the environment. Phytoremediation as a technology uses
plants to clean up contaminated environment. It is a low cost,
long term, environmentally and aesthetically friendly method
of immobilizing/stabilizing, degrading, transferring, removing,
or detoxifying contaminants, including metals, pesticides,
hydrocarbons and chlorinated solvents [3, 4, 5].
Over the past three decades, it has become a highly
accepted means of detoxifying contaminated water and soils
[6].The development of phytoremediation is being driven
primarily by the high cost of many other soil remediation
methods as well as a desire to use a “green”, sustainable
process. Metals contaminated soils are remediated by
conventional or unconventional techniques but the in-situ
(unconventional) techniques are favored over the ex-situ
(conventional) techniques due to their low cost and reduced
impact on the ecosystem. Conventionally, the ex-situ
60 U. Abdullahi et al.: Phytoremediation of Contaminated Soils from Challawa Industrial Estate, Kano-Nigeria
technique is to excavate soils contaminated with heavy metals
and their burial in landfill sites [7, 8]. The offsite burial is not
an appropriate option as it merely shifts the contamination
problem elsewhere [8] and also because of the hazard
associated with the transportation of contaminated soils [9].
Most of the conventional remediation technologies are costly
to implement and cause further disturbances to the already
The results revealed that the translocation factors of all the metals in the plants tissues were greater than one except for Cr and
Ni in Neem (Azadirachta indica) and Mn in Baobab (Adansonia digitata) (Table 3).
Table 3. Translocation of Metals (mg/kg) from Roots to Shoots of Plant Samples in Polluted Area.
Plant Sample Cd Cr Cu Fe Mn Ni Pb Zn
Jatropha 1.86 1.64 1.09 1.04 1.15 1.15 3.03 1.00
Neem 1.98 0.71 1.21 1.18 1.00 0.99 1.19 1.24
Baobab 1.30 1.11 1.58 2.58 0.77 1.82 1.47 1.15
These values indicated higher availability and distribution
of metals in soils contaminated with heavy metals in the three
plant species which can be labeled as translocators of Cd, Cr,
Cu, Fe, Mn, Ni, Pb and Zn based on TF>1. Heavy metal
tolerance with high TF value have been suggested for
phytoaccumulator of contaminated soils [42, 43] and therefore
these plant species can be used as phytoremediators for
multi-metal contaminated soils.
Also the results revealed high bioaccumulation factors (BAF)
of all the metals examined in the tissues. All the BAF values were
greater than one, except for Zn (0.96) , Cd (0.76) and Ni (0.84) in
Jatropha (Jatropha curcas) leaves and stems respectively; Cr
(0.90), Fe (0.96) and Zn (0.70) in leaves and Cr (0.63), Ni (0.89)
and Zn (0.97) in stems of Neem (Azadirachta indica); Ni (0.99)
and Zn (0.92) in the leaves of Baobab (Adansonia digitata)
(Table 4). The bioaccumulation of the metals indicates a great
performance of these plant species for metals phytoextraction
and could be labeled as accumulator plants [44].
64 U. Abdullahi et al.: Phytoremediation of Contaminated Soils from Challawa Industrial Estate, Kano-Nigeria
Table 4. Bioaccumulation Coefficient (BAC) Values for Heavy Metals in the Tissues of Plants.
Plant Plant Parts Bioaccumulation Coefficient (BAC)
Cd Cr Cu Fe Mn Ni Pb Zn
Jatropha
Leaves 2.43 2.00 1.42 1.74 1.75 1.13 4.22 0.96
Stems 0.76 2.49 2.37 1.37 2.00 0.84 2.38 1.41
Roots 1.71 2.75 3.45 3.00 3.25 1.72 2.18 2.37
Neem
Leaves 3.09 0.90 2.10 0.96 3.33 1.34 2.77 0.70
Stems 1.79 0.63 3.04 1.64 2.33 0.89 2.31 0.97
Roots 2.45 2.23 4.27 2.20 5.67 2.24 4.26 1.35
Baobab
Leaves 2.09 1.97 1.29 2.52 1.11 0.99 1.73 0.92
Stems 1.09 1.65 1.75 1.06 1.11 1.75 1.90 1.11
Roots 2.47 3.28 1.93 1.39 2.89 1.51 2.48 1.76
4. Conclusion and Recommendations
The results obtained showed that Jatropha (Jatropha
curcas), Neem (Azadirachta indica) and Baobab (Adansonia
digitata) can accumulate heavy metals from contaminated
soils. The bioaccumulation and translocation factors were
found to be greater than one except in few cases; indicating
that all the three plant species are potentially useful for
remediating heavy metals contaminated soils for these metals
(Cd, Cr, Cu, Fe, Mn, Ni, Pb and Zn). It is recommended that
these plants: Jatropha (Jatropha curcas), Neem (Azadirachta
indica) and Baobab (Adansonia digitata) can be ideal option
for the phytoremediation in multi-heavy metal contaminated
soils. These plants if massively planted in and around the
industrial estate would reduce these metals in the soil and
would also in the long run help to prevent the ground water
contamination by heavy metals in the industrial effluents.
References
[1] Sadowskyy MJ (1999) In Phytoremediation: Past promises and future practices. Proceedings of the 8th International symposium on Microbial Ecology. Halifex, Canada: 1-7.
[2] Henry JR (2000) In An Overview of phytoremediation of Lead and Mercury. NNEMS Reports, Washington DC: 3-9.
[3] Susarta S, Medina VF, McCutcheon SC (2008) Phytoremediation: An ecological solution to organic chemical contamination. Ecological Engineering 18(5): 647-658.
[4] Jadia CD, Fulekar MH (2009) Phytoremediation of heavy metals: Recent Techniques. African Journal 7(5): 547-558.
[5] Zhang BY, Zhen JS, Sharp RG (2010) Phytoremediation in engineered wetlands: Mechanism and applications. Procedia Environmental Science 2: 1315-1325.
[6] US-EPA (2001) Lead, identification of dangerous levels, final rule. Code of Fed. Reg., 66: 1206-1240.
[7] McNeil KR, Waring S (1992) In Contaminated land treatment technologies (ed. Rees J. F.). Society of Chemical Industry. Elsevier Applied Sciences: 143-159.
[8] Smith B (1993) Remediation updates funding the remedy. Waste Management Environment 4: 24-30.
[9] Williams GM (1998) Land disposal of hazardous waste. Engineering and Environmental Issues: 37-48.
[10] McBride HB (1994) Environmental chemistry of soils. Oxford University Press, New York.
[11] Alloway BJ, Jackson AP (1991) The behavior of heavy metals in sewage-sludge amended soils. Science Total Environment 100: 151-176.
[12] Khan AG (2005) Role of soil microbes in the rhizosphere of plant growing on trace metal contaminated soils in phytoremediation. Journal of Trace Element and Medical Biology 18: 3556-3564.
[13] Ward OP, Singh A (2004) Soil bioremediation and phytoremediation- An overview. In Applied bioremediation and phytoremediation 1: 1-11.
[14] Bichi MH, Anyata BU (1999) Industrial waste pollution in the Kano river basin. Environmental Management and Health 10 (2): 112-116.
[15] Akan JC, Moses EA, Ogugbuaja VO, Abah J (2007) Assessment of tannery industrial effluent from Kano metropolis, Kano State, Nigeria. Journal of Applied Sciences 7 (19): 2788-2793.
[16] WHO (1984) International standards for drinking water quality. World Health Organization, Geneva.
[17] Akan JC, Abdulrahman FI, Ogugbuaja VO, Reuben KD (2009) Study of the physico-chemical pollutants in Kano industrial areas, Kano State, Nigeria. Journal of Applied Sciences in Environmental Sanitation 4(2):89-102.
[18] Mu’azu AU, Kabir JA, Issa BR, Ndamitso MM (2010) Assessment of some heavy metals in lettuce, sesame and okra irrigation from Challawa River Kano, Nigeria. Oriental Journal of Chemistry 26(4): 1299-1308
[19] Gupta, S. Nayek, R. N. Saha and Satpti, S (2008) Assessment of heavy Metal accumulation in macrphyte, agricultural soil and crop plants adjacent to discharge zone of sponge iron factory. Environ. Geol., 55: 731-739
[20] Hakanson L (1980) An ecological risk index for aquatic pollution controls. A Sedimentological approach. Water Resources 14: 975-1001.
[21] Baker, AJM. Brooks RR (1989) Terrestrial higher plants which hyperaccumulate metallic element a review of their distribution, ecology and phytochemistry. Biorecovery 1:81-126.
[22] Ma LQ, Komar KM, Tu C, Zhang W, Cai Y, Kanelly ED (2001) A Fern that hyper-accumulates arsenic. Nature 42(1): 291-301.
Science Journal of Analytical Chemistry 2016; 4(5): 59-65 65
[23] Zyad A, Gowthaman S, Terry N (1998) Phytoaccumulation of trace elements by wetland plants; Duckweed. Journal of Environmental Quality 27: 715-721
[24] Huang JW, Chen J, Berti WR, Cunningham SD (1997) Phytoremediation of lead-contaminated soil: role of synthetic chelaatesvin lead phytoextraction. Environ. Sci. Technol., 31:800-805.
[25] Todorovic Z, Poli P, Djordjeri D, Antonijevi S (2001) Lead distribution in water and its association with sediment constituents of the “Barje” lake (Leskovac, Yugoslavia). Journal of the Serbian Chemical Society 66(10): 697-708.
[26] Nnaji JC, Omotugba S (2014) Physico-chemical quality of drinking water in New Bussa, Niger State, Nigeria. International Research Journal of Pure and Applied Chemistry 4(4): 437-446.
[27] Tuzen M (2003) Determination of heavy metals in soil, mushroom and plant samples by atomic absorption spectrometry. Microchemical Journal 74(3): 289-297.
[28] APHA, AWWA, WPCF (1985) Standard methods for the examination of water and wastewater. American Public Health Association, Washington DC.
[29] Awofolu OR (2005) A survey of trace metals in vegetation, soil and lower animals along some selected major roads in metropolitan city, Lagos. Environmental monitoring and assessment 105:431-449.
[30] US-EPA. Methods 3050, 7130, 7420 (1986) Test methods for evaluating solid waste. Laboratory manual-physical/chemical method SW-846, 3rd Ed. Washington DC.
[31] Audu, A A and Lawal, A O (2006) Variation in metal contents of plants in vegetable Garden sites in Kano Metropolis. Appl. Sci. Environmental Mgt., 10 (2): 105-109
[32] Steel RCH, Dickey DA (1996) Principles and procedures of statistics. McGraw Hill, New York, USA: 234-256.
[33] Bowen HJM (1997) Environmental chemistry of elements. Academic Press Incorporation, London Ltd.:7.
[34] Awokunmi EE, Asaolu SS, Ipinmoroti KO (2010) Effect of leaching on heavy metal concentration of soil in some dumpsites. African Journal of Environmental Science and Technology 4(8): 495-499.
[35] ATSDR. Toxicological profile for Manganese (update) (2000) US Department of Health and Human Services, Public Health Service, Agency for Toxic Substance and Diseases.
[36] Malik RN, Hussein SZ, Nasir I (2010) Heavy metals contamination and accumulation in soil, wild plants species from industries area of Islamabad, Pakistan. Pakistan Journal of Botany 42 (1): 291-301.
[37] Qihang W, Wang S, Thangavel P, Qingfei L, Zheng H, Ju B, Qui R (2011) Phytostabilisation of Jatropha Curcas L. in polymetallic acid mine tailings. International Journal of phytoremediation 13: 788-804.
[38] Islam MM, Nik M, Majid M, Yamarnis R (2012) Heavy metal uptake and translocation by Jatropha Curcas L. in saw dust sludge contaminated soil. Australian Journal of crop Science AJCS6 (%): 891-898.
[39] Barma SC, Sahu RK, Bhargava SK, Chatterjee C (2000) Distribution of heavy metals in wheat, mustard and weed grains irrigated with industrial effluents. Bull Environmental Contamination Toxicology 64: 489-496.
[40] Sun Y, Zhou Q, Wang L, Liu W (2009) Cadmium tolerance and accumulation characteristics of Bidens pilosa L. as a potential Cd-hyperaccumulator. Journal of Hazard Material 161 (23): 808-814.
[41] Lehoezky E, Szabo L, Horvath S (1998) Cadmium uptake by plants in different soils. Commun., Soil Sci. Plant Anal., 29: 1903-1912.
[42] Yoon J, Cao XD, Zhou QX, Ma LQ (2006) Accumulation of Pb, Cu and Zn in native plants growing on a contaminated Florida site. Science Total Environment 368: 456-484.
[43] Waziri M, Abdullahi U, Audu A A, Kalimullah (2016) Phytoremediation potentials of selected plants in industrially contaminated soils. International Journal of Environmental Science and Development 7 (10): 757-762.
[44] Scragg, A (2005) Environmental Biotechnology. Oxford University Press, New York: 31-45.