The Survey of Adult Skills PIAAC 2 0 1 2 Basic skills of Finnish adults one of the best in the OECD countries J A N S T R A N D S T R Ö M / F O L I O B I L D B Y R Å
The Programme for International Assessment of Adult
Competencies (PIAAC 2012) assesses the basic level and use
of competencies of people aged between 16 and 65. The key
elements required for processing and managing information are
proficiency in literacy, numeracy and problem-solving in technology-rich
environments. Besides comparative international data, the survey also
provides new information on the use of these skills in the workplace
and everyday life, and how well the skills match the needs of the job.
Finnish adults have excellent literacy skills
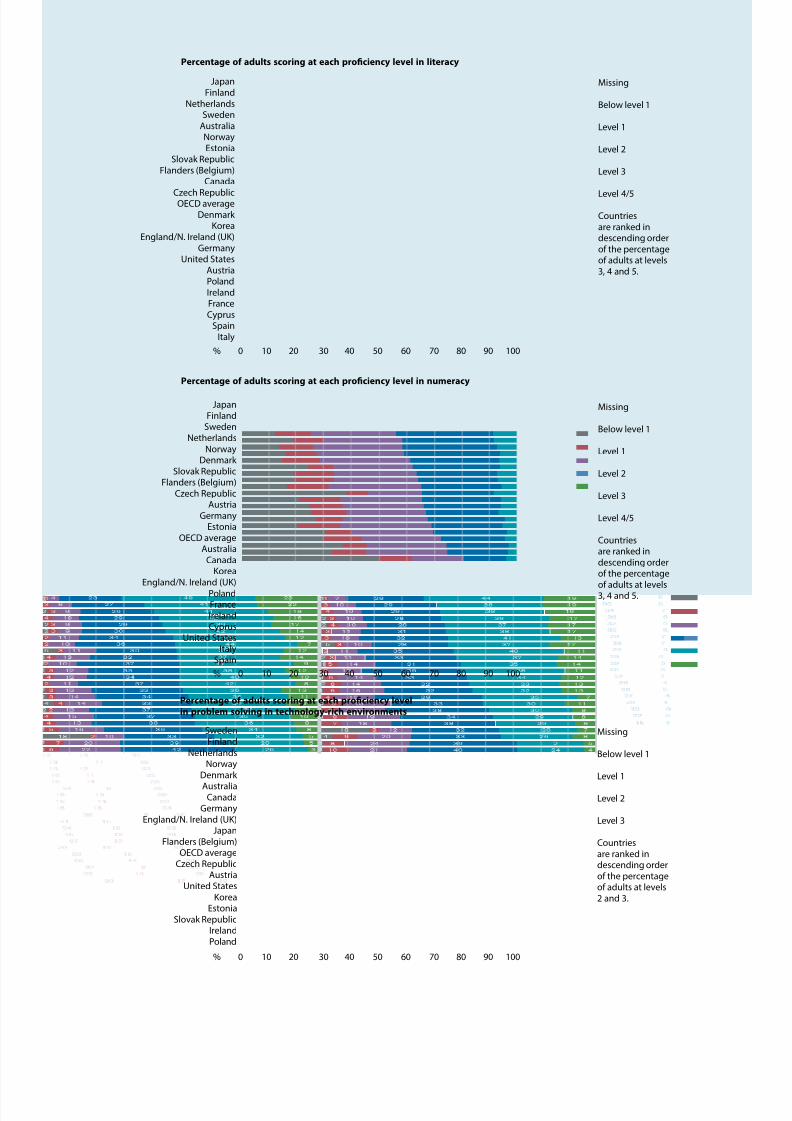
The mean literacy rate of Finnish adults is excellent by international standards. Finland’s mean
score for literacy was 288 points, which is significantly better than the average score for the
OECD countries (273 points). The only country to score higher was Japan, where also the distri-
bution in the score points was the smallest across the OECD countries. Finland had the highest
distribution in score points among the participating countries.
Two thirds of the adult population in Finland are either good or excellent readers. This is
much better than the average for the OECD countries, which is 50%. In Finland, 11% of thoseaged between 16 and 65 are poor readers, in other words about 370,000 people. In Japan the
percentage of poor readers is a mere 5%. By contrast, in Spain and Italy the equivalent percent-
ages are between 27% and 28%.
Top-rate numeracy skills too
Mean proficiency in numeracy in Finland is one of the best in the survey. The mean score (282
points) is substantially higher than the OECD average (269 points). Japan was the only country
that exceeded Finland in proficiency in numeracy (288 points). Differences in numeracy skills
within the Finnish population are at the average international level. Over one half of all adult
Finns (57%) have either good or excellent skills in numeracy. At the same time, though, 13% of
the adult population experiences great difficulties with basic mathematical content. This figure
is smaller than the OECD average (19%), but there are nonetheless about 450,000 people in
the Finnish adult population with poor skills in numeracy. Spain and Italy are at the tail end in
the survey in numeracy too, with nearly one third of the working-age population being poor
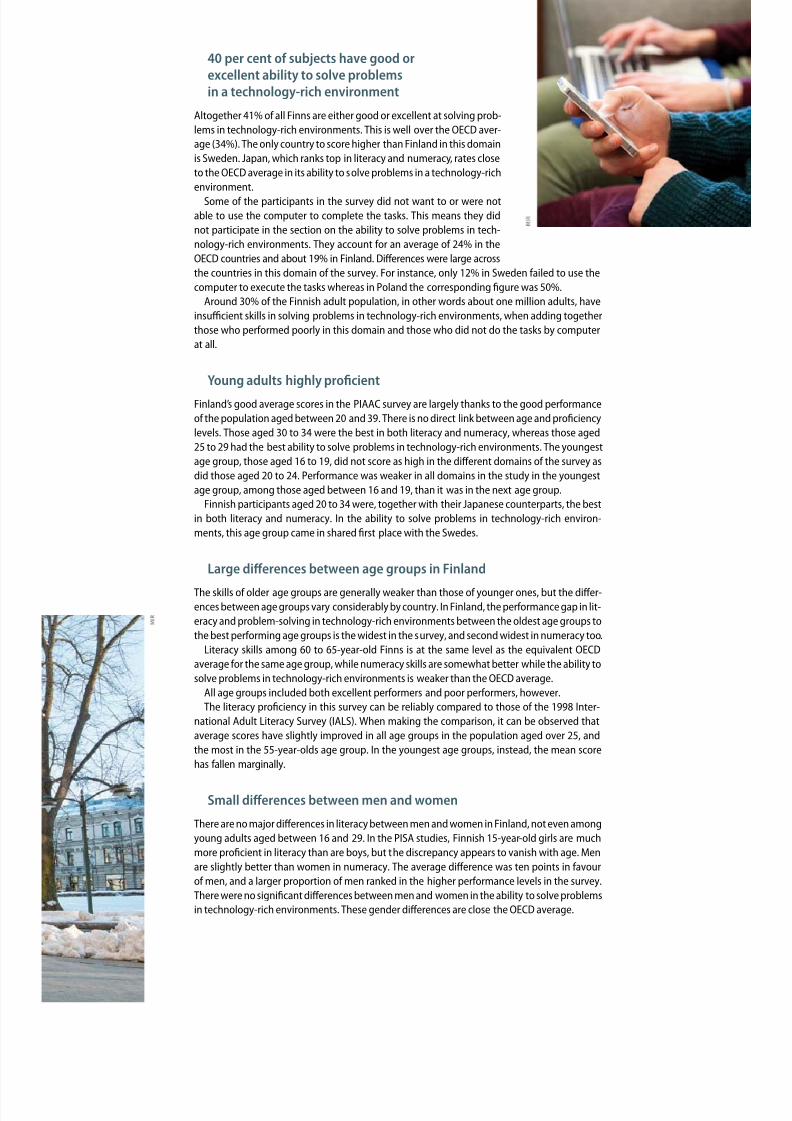
40 per cent of subjects have good orexcellent ability to solve problemsin a technology-rich environment
Altogether 41% of all Finns are either good or excellent at solving prob-
lems in technology-rich environments. This is well over the OECD aver-
age (34%). The only country to score higher than Finland in this domain
is Sweden. Japan, which ranks top in literacy and numeracy, rates close
to the OECD average in its ability to solve problems in a technology-richenvironment.
Some of the participants in the survey did not want to or were not
able to use the computer to complete the tasks. This means they did
not participate in the section on the ability to solve problems in tech-
nology-rich environments. They account for an average of 24% in the
OECD countries and about 19% in Finland. Differences were large across
the countries in this domain of the survey. For instance, only 12% in Sweden failed to use the
computer to execute the tasks whereas in Poland the corresponding figure was 50%.
Around 30% of the Finnish adult population, in other words about one million adults, have
insufficient skills in solving problems in technology-rich environments, when adding together
those who performed poorly in this domain and those who did not do the tasks by computer
at all.
Young adults highly proficient
Finland’s good average scores in the PIAAC survey are largely thanks to the good performance
of the population aged between 20 and 39. There is no direct link between age and proficiency
levels. Those aged 30 to 34 were the best in both literacy and numeracy, whereas those aged
25 to 29 had the best ability to solve problems in technology-rich environments. The youngest
age group, those aged 16 to 19, did not score as high in the different domains of the survey as
did those aged 20 to 24. Performance was weaker in all domains in the study in the youngest
age group, among those aged between 16 and 19, than it was in the next age group.
Finnish participants aged 20 to 34 were, together with their Japanese counterparts, the best
in both literacy and numeracy. In the ability to solve problems in technology-rich environ-
ments, this age group came in shared first place with the Swedes.
Large differences between age groups in Finland
The skills of older age groups are generally weaker than those of younger ones, but the differ-
ences between age groups vary considerably by country. In Finland, the performance gap in lit-
eracy and problem-solving in technology-rich environments between the oldest age groups to
the best performing age groups is the widest in the survey, and second widest in numeracy too.
Literacy skills among 60 to 65-year-old Finns is at the same level as the equivalent OECD
average for the same age group, while numeracy skills are somewhat better while the ability to
solve problems in technology-rich environments is weaker than the OECD average.
All age groups included both excellent performers and poor performers, however.
The literacy proficiency in this survey can be reliably compared to those of the 1998 Inter-national Adult Literacy Survey (IALS). When making the comparison, it can be observed that
average scores have slightly improved in all age groups in the population aged over 25, and
the most in the 55-year-olds age group. In the youngest age groups, instead, the mean score
has fallen marginally.
Small differences between men and women
There are no major differences in literacy between men and women in Finland, not even among
young adults aged between 16 and 29. In the PISA studies, Finnish 15-year-old girls are much
more proficient in literacy than are boys, but the discrepancy appears to vanish with age. Men
are slightly better than women in numeracy. The average difference was ten points in favour
of men, and a larger proportion of men ranked in the higher performance levels in the survey.There were no significant differences between men and women in the ability to solve problems
in technology-rich environments. These gender differences are close the OECD average.
Strong link between educational level and proficiency,parents’ educational background has a bearing too
Education is strongly connected to skills proficiency. Skills proficiency is linked not only the
subjects’ own educational attainment and the educational background of parents but also to
participation on education and training in adult life too. These are all strongly interrelated. The
educational level of parents is connected to their children’s educational attainment while the
subjects’ own educational attainment affects access to jobs that involve opportunities for fur-
ther learning and training. Proficiency in foundation skills is strongly connected to educationalbackground in all countries in the survey. Finland is no exception in the OECD average.
In Finland, nearly half of all those with tertiary level education are either good or excellent
in literacy (levels 4/5), whereas of those with only lower secondary level education only 9%
reached the higher ranges in literacy. For those whose highest educational level was upper sec-
ondary or post-secondary level education, average scores were good too. However, for those
with vocational qualifications, the average score was weaker and closer to the scores of those
with lower secondary education in all domains of the survey. There are differences between the
groups in ways other than education too. For instance, the average age in the groups varies.
Those who have completed vocational education were on average ten years older than those
who had an upper secondary level qualification. By international standards, young Finnish
adults (ages 16 to 29) with vocational qualifications had excellent scores in literacy, with only
their Japanese counterparts being more proficient.The educational background of parents is reflected in the competencies of adult subjects.
Among the participants in the study, those with one parent with tertiary education, 40% rank
in the highest ranges (4/5) in literacy pro-
ficiency and 34% in numeracy proficiency.
Where both parents had lower secondary
level education or lower, the correspond-
ing percentage was one tenth. The connec-
tion to the parents’ educational attainment
is clear also in the case of problem-solving
skills in technology-rich environments. The
link between parents’ educational level and
proficiency in foundation skills is slightly
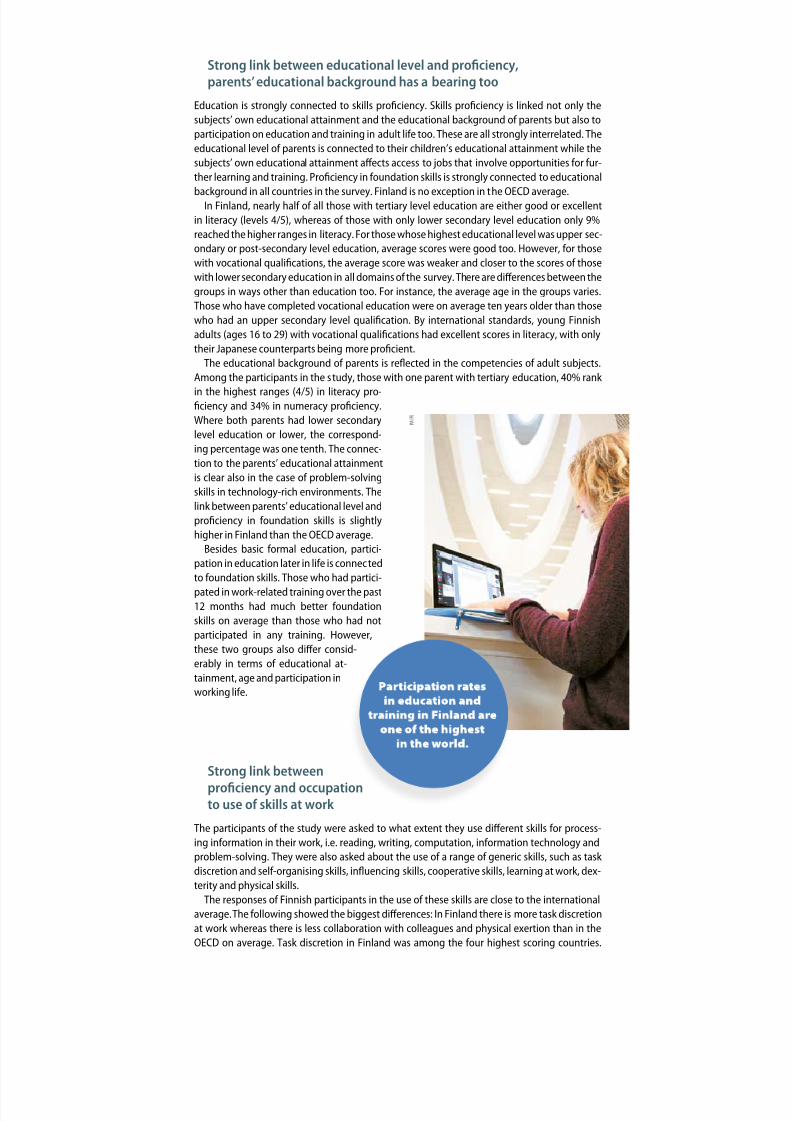
higher in Finland than the OECD average.Besides basic formal education, partici-
pation in education later in life is connected
to foundation skills. Those who had partici-
pated in work-related training over the past
12 months had much better foundation
skills on average than those who had not
participated in any training. However,
these two groups also differ consid-
erably in terms of educational at-
tainment, age and participation in
working life.
Strong link betweenproficiency and occupationto use of skills at work
The participants of the study were asked to what extent they use different skills for process-
ing information in their work, i.e. reading, writing, computation, information technology and
problem-solving. They were also asked about the use of a range of generic skills, such as task
discretion and self-organising skills, influencing skills, cooperative skills, learning at work, dex-
terity and physical skills.The responses of Finnish participants in the use of these skills are close to the international
average. The following showed the biggest differences: In Finland there is more task discretion
at work whereas there is less collaboration with colleagues and physical exertion than in the
OECD on average. Task discretion in Finland was among the four highest scoring countries.
The proficiency level and use of information-processing tasks are closely related to occupation
and its requirements. The better the basic competencies, the more they are also used at work.
Those with good basic competencies are involved in information-processing tasks more often
in their work – they read, write and compute, resolve complex problems and use information
technology. They are typically also more self-organising at work and their job involves influenc-
ing others. By contrast, those with weaker foundation skills need dexterity and physical skills
more often in their jobs.
There are no significant differences in learning at work or cooperative skills, instead, between
the different proficiency levels.
Those aged under 25 or over 55 are involved in information-processing tasks in their work
less than the other age groups. For young adults, the gap is wide relative to the rest of the age
groups while for those aged 55 or over it is smaller. However, the differences between age
groups are much smaller in terms of information-processing tasks than it is in proficiency in
foundation skills. In the case of generic skills, the oldest age group have jobs that require dex-
terity. Jobs that require physical skills are predominant among the youngest age group (ages
16 to 24). They also have much less task discretion and influencing of others. The most active
age group in the category of influencing others is those aged between 35 and 44.
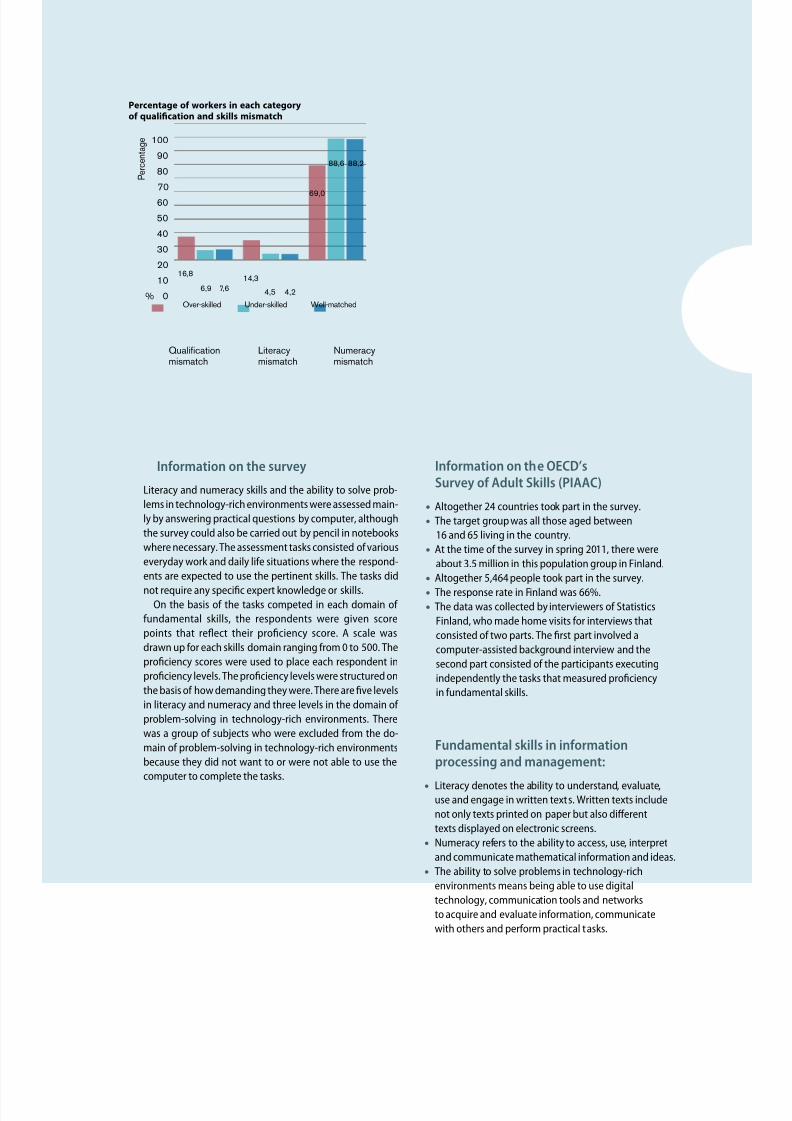
Qualifications meet requirements at work
In Finland, the qualifications of employees and the self-reported qualifications required fortheir work was appropriate in 69% of the cases. This is a slightly higher figure than for the
OECD countries on average (66%). Proficiency acquired through education was under-used
among 17% of the participants, which is slightly less than the OECD average (21%). Only five
participating countries showed a lower proportion than Finland, with Italy having the lowest
figure (13%). In Japan, instead, nearly one third of employees (31%) had qualifications that
were under-used at work.
Altogether 14% of the Finnish participants had lower qualifications than their self-reported
job requirement was. This is close to the same figure as for the OECD countries on average
(13%). The highest qualification deficit is in Italy (22%) and Sweden (21%).
On the basis of the score points reported for job requirements, the survey also examined how
well literacy and numeracy matched job requirements. In Finland, literacy and numeracy meets
job requirements better than formal education. Less than 5% of employees had shortages inthese skills in terms of their job requirements. About 7% were not using all their full potential
in skills at work. The skills deficit in Finland is close to the average for the OECD countries, while
the under-use of foundation skills is below average. Germany has the most employees whose
literacy and numeracy skills are not used to their full potential (19%).