Biotechnol. J. 2011, 6, 165–176 DOI 10.1002/biot.201000324 www.biotechnology-journal.com
1 Introduction
With the continued drive to create fast, low-costmethods for sequencing DNA [1], there is a trendtoward ever smaller devices [2–4].The use of small-er devices, commonly microfluidic devices, signifi-cantly reduces the necessary amount of reagents,one of the main contributors to the overall cost ofDNA sequencing. However, as the number of pos-sible sequencing applications emerge, so too doesthe number of possible technologies, each of whichhas different requirements for throughput, speed,sensitivity, accuracy, robustness, operational skill,and other operational variables.
Pyrosequencing is a sequencing method, origi-nally introduced in the late 1980s [5], that makesuse of the side products of sequential nucleotide
addition to initiate a series of reactions that ulti-mately produce a chemiluminescent signal when acorrect nucleotide is introduced. The nucleotidesare individually added to a primed template strandand cycled as the sequencing progresses [6]. As acorrect base is added to the DNA strand of inter-est, pyrophosphate (PPi) is released into solution:
(1)
The released pyrophosphate is then converted toadenosine triphosphate (ATP) via a reaction withadenosine 5�-phosphosulfate (APS) and ATP sul-furylase:
(2)
after which the ATP reacts with firefly luciferase,luciferin and oxygen to produce light:
(3)
The intensity of the light produced is closely relat-ed to the amount of ATP present, and it can be used
ATP Luciferin O AMPLuciferase+ + +2 ⎯ →⎯⎯⎯⎯+ + +2PPi Oxyluciferin CO Light
PPi APS ATP SOATPSulfurylase+ + 42–⎯ →⎯⎯⎯⎯⎯⎯
DNA dNTP DNA dNP PPiPolymerase+ – +⎯ →⎯⎯⎯⎯
Research Article
Picoliter DNA sequencing chemistry on an electrowetting-baseddigital microfluidic platform
Erin R. Ferguson Welch, Yan-You Lin, Andrew Madison and Richard B. Fair
Department of Electrical and Computer Engineering, Duke University, Durham, NC, USA
The results of investigations into performing DNA sequencing chemistry on a picoliter-scale elec-trowetting digital microfluidic platform are reported. Pyrosequencing utilizes pyrophosphate pro-duced during nucleotide base addition to initiate a process ending with detection through a chemi-luminescence reaction using firefly luciferase. The intensity of light produced during the reaction canbe quantified to determine the number of bases added to the DNA strand. The logic-based controland discrete fluid droplets of a digital microfluidic device lend themselves well to the pyrosequenc-ing process. Bead-bound DNA is magnetically held in a single location, and wash or reagent dropletsadded or split from it to circumvent product dilution. Here we discuss the dispensing, control, andmagnetic manipulation of the paramagnetic beads used to hold target DNA. We also demonstrateand characterize the picoliter-scale reaction of luciferase with adenosine triphosphate to representthe detection steps of pyrosequencing and all necessary alterations for working on this scale.
Keywords: Digital microfluidics · Electrowetting · DNA sequencing · Picoliter reactions · Pyrosequencing
Correspondence: Dr. Erin R. Ferguson Welch, Department of Electricaland Computer Engineering, CIEMAS 3587A, Duke University, Durham,NC 27708, USAE-mail: [email protected]: +1-919-660-5293
to quantitatively determine the number of a partic-ular nucleotide added to the strand. Since its intro-duction, pyrosequencing has been used in a num-ber of applications [7–10], ranging from analyzingsingle nucleotide polymorphisms [11, 12] and de-tecting rare mutations [13] to full genome or ribo-somal analysis [14–16].
Several examples of microfluidics-based py-rosequencing have been introduced. Zhou et al.[17] introduced a pyrosequencing device whichmakes use of a series of capillaries to dispense nu-cleotides to a microchamber containing the DNA tobe sequenced. However, the read length on this de-vice was very limited due to successive dilution,and reading of relatively long homopolymer nu-cleotide additions was unreliable. Russom et al. [18,19] have described a microfluidic flow-throughdevice in which DNA is bound to microbeads thatare then trapped in a microfabricated filter struc-ture within a nanoliter-scale reaction chamber.Reagents are continuously supplied to the capturedbeads and any luminescence signal is observed forreal-time sequencing. While the flow-through de-vice itself was relatively simple, it required a fairlycomplex reagent injection system. Margulies et al.[20] introduced a massively parallel system thatmakes use of an array of microfabricated picoliter-scale wells. The device demonstrated high accura-cy and throughput, but again required the use oflarge and cumbersome pumping systems to supplyreagents to the flow chamber holding the picowellarray.
Unlike continuous-flow style microfluidics, dig-ital microfluidics produces discrete fluid dropletsthat can be directed and controlled to a greater de-gree. These droplets can in turn act as micro-,nano-, or even picoliter-sized reactors, with thenecessary reagents delivered as needed. Theprocess of electrowetting is based on the principleof electrocapillarity, in which an electric field isused to induce a change in the effective surface en-ergy at a solid insulator-liquid interface [21]. On anelectrowetting digital microfluidic device, voltage isapplied to such an interface where the liquid in-volved is polarizable or conductive. Often, the de-vice is enclosed and filled with oil to prevent evap-oration of the aqueous fluid.As the applied electricfield alters the internal charge of the fluid, it exertsa force on the fluid relative to the surface of the de-vice. Combined with the change in contact angledue to the altered surface energy, this force de-forms the fluid and causes it to increase the surfacecontact area between the two phases [21–23].Whenusing electrowetting to manipulate droplets on adigital microfluidic device, the forward and reverseprocesses are combined to translocate the droplet
[21]. During actuation of a droplet, individually op-erated electrodes are successively activated anddeactivated in series. As the previous electrode isdeactivated and releases voltage-induced forces,the next is activated and applies the forces to pullthe droplet forward. Variations in how the elec-trodes are activated can be used to combine, mix,split, or dispense droplets from a large fluid reser-voir [24–26]. Combined with programmable controlunits, these devices can be adapted to countless ap-plications, including polymerase chain reaction(PCR) [27], clinical diagnostics [28], proteomicsample preparation [29], simple separations [30],and other complex biochemical techniques [31, 32],and they have been integrated with a number ofdetection and analysis techniques [29, 33, 34].
Previous work has been done to perform py-rosequencing on an electrowetting digital mi-crofluidic device capable of producing dropletsseveral hundred nanoliters in volume (P. K. Thwar,et al., unpublished). To initiate sequencing on thisdevice, the target DNA is bound to paramagneticbeads, which are dispensed and directed to a mag-netic region. By magnetically holding the DNA inone location [35–37], reagents can be added and ex-cess split away without loss of the DNA, therebyeliminating all difficulties caused by dilution. TheDNA beads can also be rinsed with a few successivedroplets of buffer to prevent cross-contamination.Steps for nucleotide addition and detection can beseparated to obtain more quantitative signal read-ings than those observed in flow-through systems,providing more accuracy for longer homopolymeradditions. While the entire process has been rela-tively slow to date, reagent consumption has beenreduced to a few hundred microliters for each indi-vidual solution, and the device and controller areeasily transportable, making the system ideal foruse in point of care or other field situations. Scalingsimilar devices to produce droplets of tens of pico-liters has been demonstrated [23].The reduction insize produces a device that requires only a few mi-croliters of reagent volume and can be run on as lit-tle power as a 9 V battery. In this article, we explorethe logistics of paramagnetic bead manipulationand characterize the behavior of the luciferase re-action to provide the groundwork for performing apyrosequencing process similar to that alreadydone on larger electrowetting devices but on a pi-coliter-scale electrowetting digital microfluidic de-vice.
All materials were used as provided by their re-spective suppliers. Tris(hydroxymethyl)amino-methane (Tris), ethylenediaminetetraacetic acid(EDTA), magnesium acetate, dithiothreitol (DTT),adenosine triphosphate (ATP), pyrophosphate(PPi), Tween 20, Triton X-15, and high conductivi-ty grade poly(3,4-ethylenedioxythiophene) poly-(styrenesulfonate) (PEDOT:PSS or PEDOT) wereobtained from Sigma-Aldrich. Luciferin and ade-nosine 5�-phosphosulfate sodium salt (APS) wereacquired from Santa Cruz Biotechnology, Inc. (San-ta Cruz, CA). QuantiLum recombinant firefly lu-ciferase was obtained from Promega Corporation,(Madison,WI), and ATP sulfurylase was purchasedfrom New England Biolabs, Inc. (Ipswich, MA).Beads for statistical dispensing studies were ob-tained from Polysciences, Inc. (Warrington, PA) andInvitrogen Corp. (Carlsbad, CA). Norland opticaladhesives NOA65 and NOA68 UV were purchasedfrom ThorLabs (Newton, NJ). SU8 2015 was ac-quired from MicroChem (Newton, MA) and CYTOPfluorinated polymer from Bellex InternationalCorp. (Wilmington, DE). Silicon wafers for the elec-trowetting substrate were purchased from SiliconQuest International, Inc. (Santa Clara, CA), and the1-mm-thick polycarbonate sheeting for top plateswas purchased from McMaster-Carr (Elmhurst,IL).
2.2 Chip fabrication
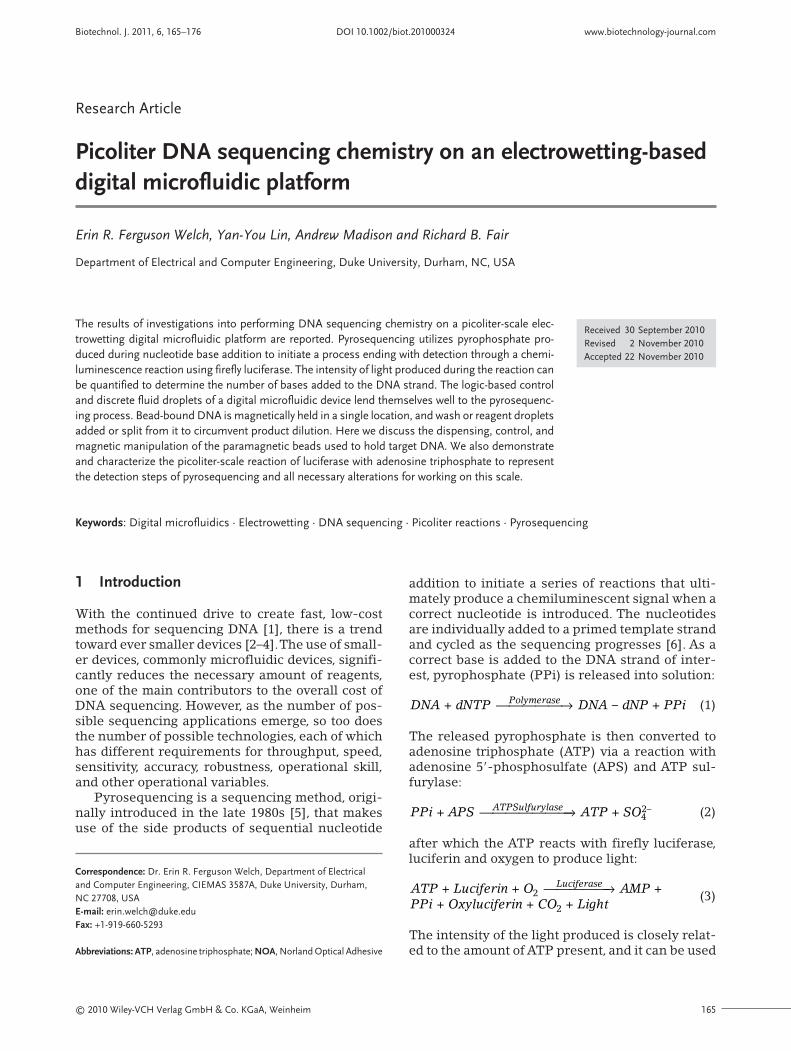
A diagram of the composition of the device used isshown in Fig. 1. For this device, a silicon wafer, pre-coated with 1 μm of thermal oxide, was diced intofour to six pieces.The electrodes were patterned byfirst laying down 100 nm of chromium, applyingand developing the design with positive photore-sist, and removing the excess metal using chromi-um etchant.The dielectric for the devices consistedof a layer of tantalum pentoxide (Ta2O5) and a lay-er of Parylene C. As the SU8 used to form the gas-ket does not adhere well to the Parylene, the Ta2O5was applied first, followed by SU8, which was thenpatterned, the substrate diced, and the Parylene Capplied. A continuous film of Parylene C over theentire chip sealed the underlying layers. A layer ofCYTOP was spin-coated onto the surface to pro-vide the hydrophobicity necessary for electrowet-ting.This device, while somewhat limited in designflexibility, is very robust and is ideal for the simple,repetitive procedures used in the experiments de-scribed.
The substrate for all of the top plates used inthese devices was a 1-mm-thick piece of polycar-bonate milled with a Roland MDX-20 mill (Irvine,CA) with a 1/32” bit. To allow multiple uses of thedevice, the chip was not bonded, and the top platewas held in place with pins. However, slight irregu-larities in the surface height of the SU8 gasket ma-terial can create gaps between the substrates anddisrupt device operation.To achieve a better seal, alayer of Norland Optical Adhesive (NOA) 65 or 68was applied to the polycarbonate substrate, spin-coated to a thickness of 50–100 μm [38]. The curedoptical adhesive is relatively flexible and will de-form around most imperfections in the SU8 with-out impinging on the reservoir or channels. A150-nm layer of conductive PEDOT was applied tothe top plate for grounding of the electrodes, fol-lowed by a layer of CYTOP as the hydrophobic lay-er. The new top plate composition has been deter-mined to be nearly as robust as the polycarbonate-ITO-CYTOP composition used in the past, with nodiscernable loss of conductivity despite deforma-tion of the chip-side layers. A diagram of the layersof this type of top plate is shown in Fig. 1.
2.3 Feature geometry
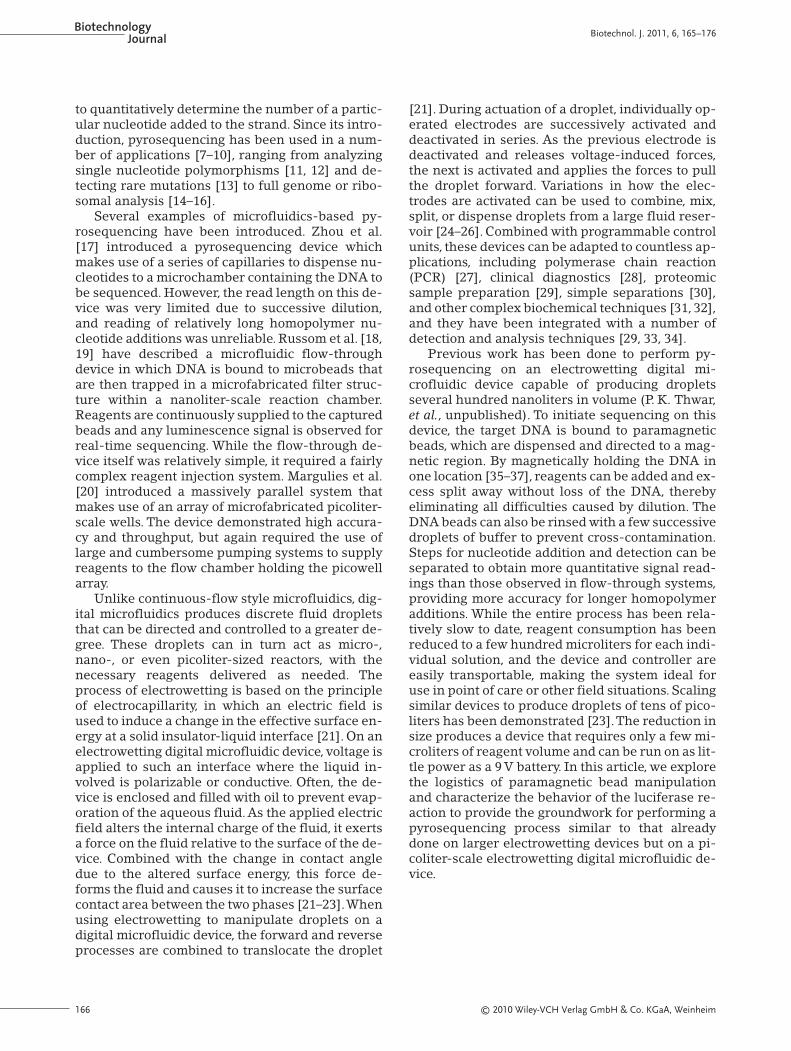
An image of the reservoir, gasket, and electrodegeometry is shown in Fig. 2. In this device, the pri-mary reservoir electrode is 2.5 mm wide and the in-ternal reservoir electrode is 1 mm. Both are utilizedduring dispensing from the 140-nL reservoir. Theindividual actuation electrodes consist of a body100 μm2 with two rounded protrusions extending30 μm at each side.The interlocking protrusions fa-cilitate electrowetting and droplet movement byproviding extra contact with droplets on neighbor-ing electrodes.A gap of 5 μm separates the individ-ual electrodes. This particular device is a single-level metal device with 10-μm wire connections foreach electrode. The SU8 gasket is spin-coated to athickness of 20 μm and provides boundaries for the
Biotechnol. J. 2011, 6, 165–176 www.biotechnology-journal.com
Figure 1. Cross-section of the electrowetting digital microfluidic device.
BiotechnologyJournal Biotechnol. J. 2011, 6, 165–176
reservoir and channels surrounding the electrodes.Channel widths defined by the gasket are approxi-mately 250 μm wide and offset to cover the connec-tion wires. The reservoir neck opening is approxi-mately 100 μm wide, and the gasket tapers to apoint on either side to facilitate “pinching” of theaqueous phase during dispensing. These featurescreate a droplet volume of approximately 300 pL.
2.4 Device control and detection
Contact to the electrowetting chips was made by a22-pin clip connected to a 32-channel relay controlboard (National Control Devices, LLC). The relayboard was connected via USB to a computer andcontrolled by a custom program. Electrode controlcan be performed both manually and automatical-ly by simple text programs. Input voltage was sup-plied by an Agilent 33250A function generator (Ag-ilent Technologies, Santa Clara, CA) amplified by aFLC F10A 10× voltage amplifier (FLC Electronics,Göteborg, Sweden).The grounding plane of the topplate was connected to the negative output of theamplifier with a mini alligator clip.All devices wereoperated at 20–30 Vpp. Observation for full-lighttests was done with a Basler avA1000-120kc CCDcamera (Basler Electronic, Highland, IL) mountedon an Optem Zoom 125 microscope lens with 10×objective (Qioptic, Paris, France). Low-light obser-vations are performed with a Photometrics ES2
cooled CCD camera (Tucson, AZ) equipped with a10× objective lens with 1-cm focal distance.
3 Results and discussion
3.1 Bead dispensing
In the experimental outline for pyrosequencing ona large-scale electrowetting device, the target DNAis bound to paramagnetic beads and magnets areused to manipulate the bead behavior. In largerscale devices, the volume of fluid in the beaddroplets relative to the bead size means that slightvariations in the number of beads per droplet, andtherefore the amount of DNA present, have littleimpact on the intensity of light produced during theluciferase reaction. However, at the picoliter scale,variations in the bead content per droplet can havea significant effect on the recorded intensity. Tobetter understand the consequences of variationsin bead concentration in a droplet-by-droplet ba-sis, a series of experiments were performed usingsolutions with varying sizes and concentrations ofbeads. The beads used in these tests were Poly-sciences Fluoresbrite 2 μm and Polybead 10 μmcarboxyl-functionalized polystyrene spheres andInvitrogen Dynabeads M-270 2.8 μm streptavidin-functionalized paramagnetic beads. Droplets of thebead suspensions were dispensed and the numberof beads per droplet tabulated.
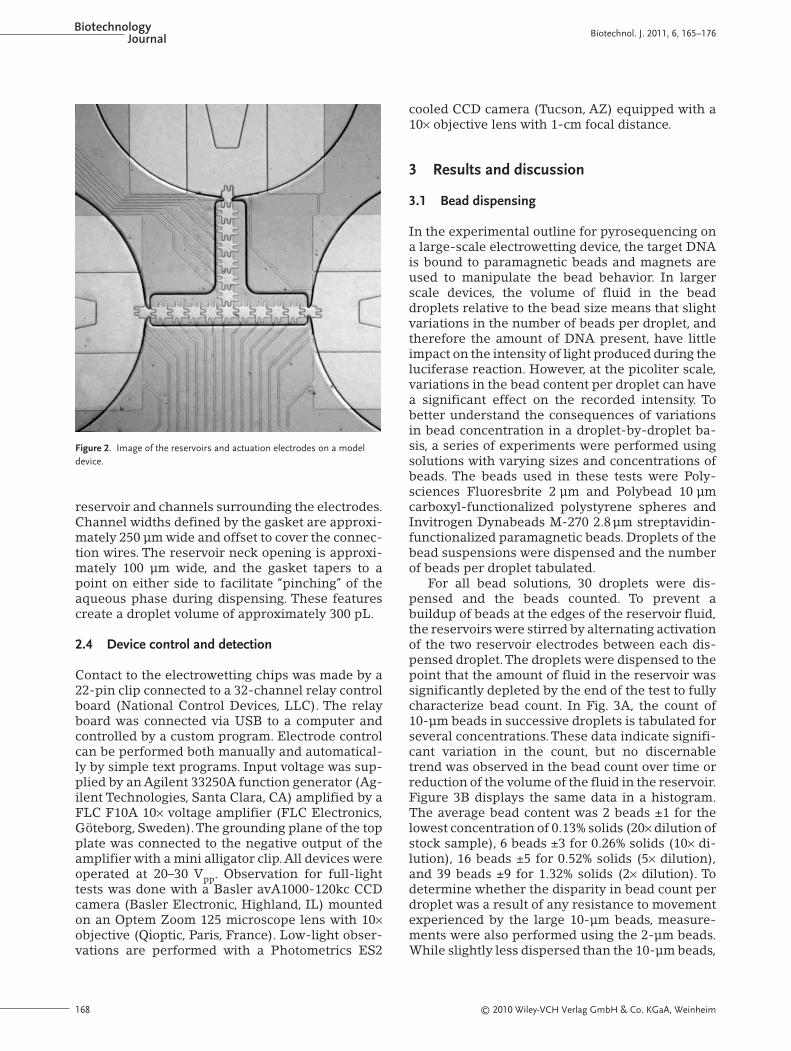
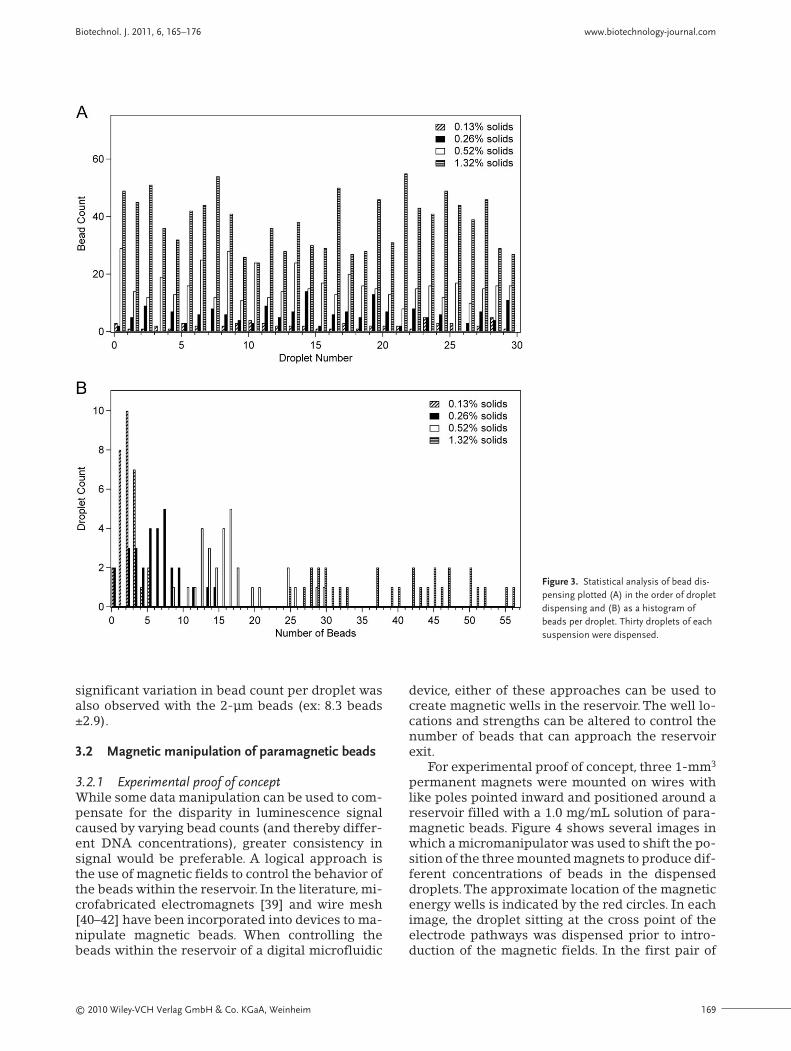
For all bead solutions, 30 droplets were dis-pensed and the beads counted. To prevent abuildup of beads at the edges of the reservoir fluid,the reservoirs were stirred by alternating activationof the two reservoir electrodes between each dis-pensed droplet.The droplets were dispensed to thepoint that the amount of fluid in the reservoir wassignificantly depleted by the end of the test to fullycharacterize bead count. In Fig. 3A, the count of10-μm beads in successive droplets is tabulated forseveral concentrations.These data indicate signifi-cant variation in the count, but no discernabletrend was observed in the bead count over time orreduction of the volume of the fluid in the reservoir.Figure 3B displays the same data in a histogram.The average bead content was 2 beads ±1 for thelowest concentration of 0.13% solids (20× dilution ofstock sample), 6 beads ±3 for 0.26% solids (10× di-lution), 16 beads ±5 for 0.52% solids (5× dilution),and 39 beads ±9 for 1.32% solids (2× dilution). Todetermine whether the disparity in bead count perdroplet was a result of any resistance to movementexperienced by the large 10-μm beads, measure-ments were also performed using the 2-μm beads.While slightly less dispersed than the 10-μm beads,
Figure 2. Image of the reservoirs and actuation electrodes on a modeldevice.
significant variation in bead count per droplet wasalso observed with the 2-μm beads (ex: 8.3 beads±2.9).
3.2 Magnetic manipulation of paramagnetic beads
3.2.1 Experimental proof of conceptWhile some data manipulation can be used to com-pensate for the disparity in luminescence signalcaused by varying bead counts (and thereby differ-ent DNA concentrations), greater consistency insignal would be preferable. A logical approach isthe use of magnetic fields to control the behavior ofthe beads within the reservoir. In the literature, mi-crofabricated electromagnets [39] and wire mesh[40–42] have been incorporated into devices to ma-nipulate magnetic beads. When controlling thebeads within the reservoir of a digital microfluidic
device, either of these approaches can be used tocreate magnetic wells in the reservoir. The well lo-cations and strengths can be altered to control thenumber of beads that can approach the reservoirexit.
For experimental proof of concept, three 1-mm3
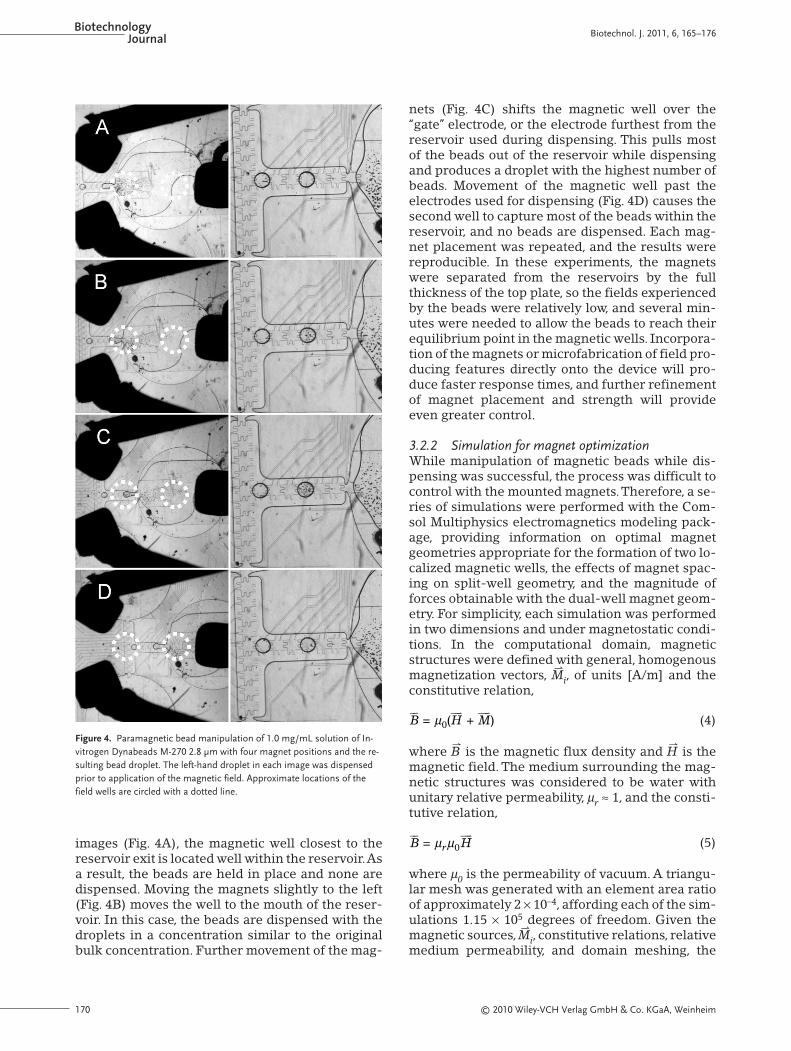
permanent magnets were mounted on wires withlike poles pointed inward and positioned around areservoir filled with a 1.0 mg/mL solution of para-magnetic beads. Figure 4 shows several images inwhich a micromanipulator was used to shift the po-sition of the three mounted magnets to produce dif-ferent concentrations of beads in the dispenseddroplets.The approximate location of the magneticenergy wells is indicated by the red circles. In eachimage, the droplet sitting at the cross point of theelectrode pathways was dispensed prior to intro-duction of the magnetic fields. In the first pair of
Biotechnol. J. 2011, 6, 165–176 www.biotechnology-journal.com
Figure 3. Statistical analysis of bead dis-pensing plotted (A) in the order of dropletdispensing and (B) as a histogram ofbeads per droplet. Thirty droplets of eachsuspension were dispensed.
BiotechnologyJournal Biotechnol. J. 2011, 6, 165–176
images (Fig. 4A), the magnetic well closest to thereservoir exit is located well within the reservoir.Asa result, the beads are held in place and none aredispensed. Moving the magnets slightly to the left(Fig. 4B) moves the well to the mouth of the reser-voir. In this case, the beads are dispensed with thedroplets in a concentration similar to the originalbulk concentration. Further movement of the mag-
nets (Fig. 4C) shifts the magnetic well over the“gate” electrode, or the electrode furthest from thereservoir used during dispensing. This pulls mostof the beads out of the reservoir while dispensingand produces a droplet with the highest number ofbeads. Movement of the magnetic well past theelectrodes used for dispensing (Fig. 4D) causes thesecond well to capture most of the beads within thereservoir, and no beads are dispensed. Each mag-net placement was repeated, and the results werereproducible. In these experiments, the magnetswere separated from the reservoirs by the fullthickness of the top plate, so the fields experiencedby the beads were relatively low, and several min-utes were needed to allow the beads to reach theirequilibrium point in the magnetic wells. Incorpora-tion of the magnets or microfabrication of field pro-ducing features directly onto the device will pro-duce faster response times, and further refinementof magnet placement and strength will provideeven greater control.
3.2.2 Simulation for magnet optimizationWhile manipulation of magnetic beads while dis-pensing was successful, the process was difficult tocontrol with the mounted magnets.Therefore, a se-ries of simulations were performed with the Com-sol Multiphysics electromagnetics modeling pack-age, providing information on optimal magnetgeometries appropriate for the formation of two lo-calized magnetic wells, the effects of magnet spac-ing on split-well geometry, and the magnitude offorces obtainable with the dual-well magnet geom-etry. For simplicity, each simulation was performedin two dimensions and under magnetostatic condi-tions. In the computational domain, magneticstructures were defined with general, homogenousmagnetization vectors, Mui, of units [A/m] and theconstitutive relation,
(4)
where Bu is the magnetic flux density and Hu is themagnetic field. The medium surrounding the mag-netic structures was considered to be water withunitary relative permeability, μr ≈ 1, and the consti-tutive relation,
(5)
where μ0 is the permeability of vacuum. A triangu-lar mesh was generated with an element area ratioof approximately 2 × 10⁻⁴, affording each of the sim-ulations 1.15 × 10⁵ degrees of freedom. Given themagnetic sources, Mui, constitutive relations, relativemedium permeability, and domain meshing, the
B Hr
�� ���= 0μ μ
B H M�� ��� � ��
= ( + )μ0Figure 4. Paramagnetic bead manipulation of 1.0 mg/mL solution of In-vitrogen Dynabeads M-270 2.8 μm with four magnet positions and the re-sulting bead droplet. The left-hand droplet in each image was dispensedprior to application of the magnetic field. Approximate locations of thefield wells are circled with a dotted line.
magnetic vector potential field was computed ineach simulation.
With the magnetic vector potential known, themagnetic flux intensity, Bu, was calculated and usedto determine the force applied to a magnetic beadwithin the computed field. Electromagnetic fieldtheory states that the force experienced by a para-magnetic bead in a magnetic field opposes the po-tential energy gradient of the field, but is also pro-portional to the magnetic moment of the bead, mu,and the gradient of the magnetic field,
(6)
The superparamagnetic nature of micrometer-sized beads requires that mu be proportional the ap-plied magnetic field according to the equation,
(7)
where V is the volume of the bead, χ is the magnet-ic susceptibility of the bead.Thus, the force impart-ed by the field generated by the magnetic struc-tures in each simulation can be defined as
(8)
Magnetic force calculations were based on beadsmeasuring 2.8 μm in diameter with magnetic sus-ceptibility of 0.165.
A three-magnet geometry was used to producethe desired field wells. The configuration utilizespaired triangular magnets juxtaposed at 120° with
F V Bmag��
= / 02χ μ ∇
m V B���
= / 02χ μ ∇
F U m Bmag�� � �� ��
= – = ·∇ ∇
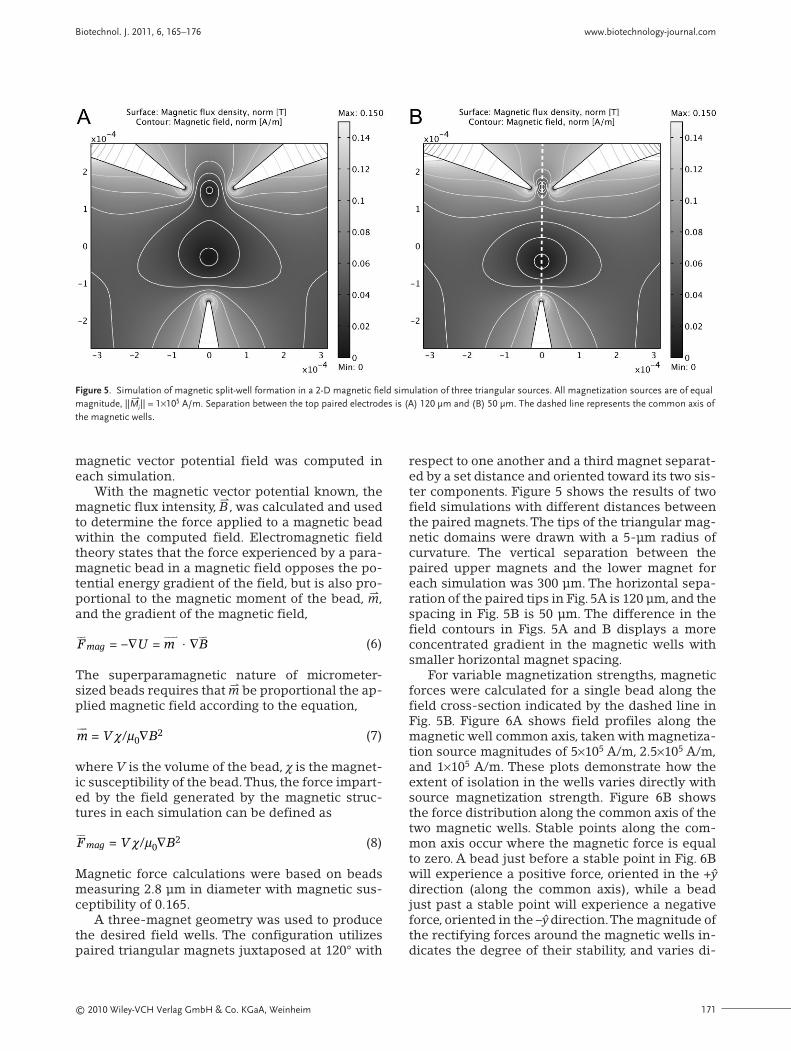
respect to one another and a third magnet separat-ed by a set distance and oriented toward its two sis-ter components. Figure 5 shows the results of twofield simulations with different distances betweenthe paired magnets.The tips of the triangular mag-netic domains were drawn with a 5-μm radius ofcurvature. The vertical separation between thepaired upper magnets and the lower magnet foreach simulation was 300 μm. The horizontal sepa-ration of the paired tips in Fig. 5A is 120 μm, and thespacing in Fig. 5B is 50 μm. The difference in thefield contours in Figs. 5A and B displays a moreconcentrated gradient in the magnetic wells withsmaller horizontal magnet spacing.
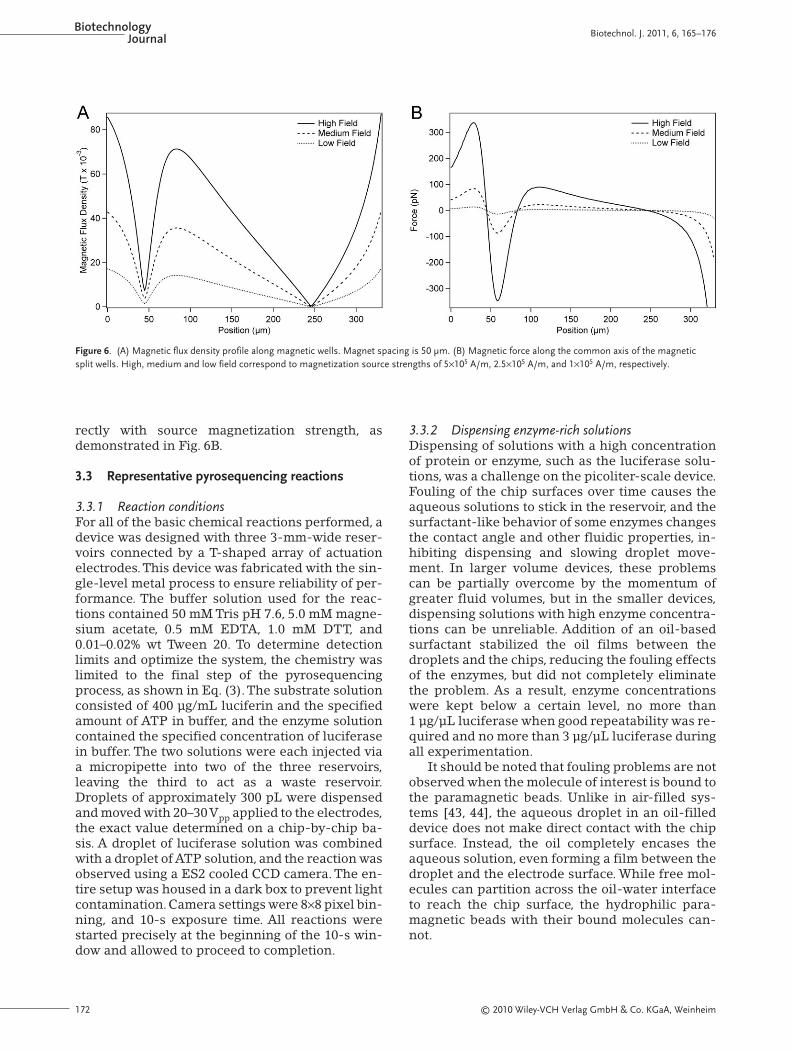
For variable magnetization strengths, magneticforces were calculated for a single bead along thefield cross-section indicated by the dashed line inFig. 5B. Figure 6A shows field profiles along themagnetic well common axis, taken with magnetiza-tion source magnitudes of 5×10⁵ A/m, 2.5×10⁵ A/m,and 1×10⁵ A/m. These plots demonstrate how theextent of isolation in the wells varies directly withsource magnetization strength. Figure 6B showsthe force distribution along the common axis of thetwo magnetic wells. Stable points along the com-mon axis occur where the magnetic force is equalto zero. A bead just before a stable point in Fig. 6Bwill experience a positive force, oriented in the +ydirection (along the common axis), while a beadjust past a stable point will experience a negativeforce, oriented in the –y direction.The magnitude ofthe rectifying forces around the magnetic wells in-dicates the degree of their stability, and varies di-
Biotechnol. J. 2011, 6, 165–176 www.biotechnology-journal.com
Figure 5. Simulation of magnetic split-well formation in a 2-D magnetic field simulation of three triangular sources. All magnetization sources are of equalmagnitude, ||Mui|| = 1×10⁵ A/m. Separation between the top paired electrodes is (A) 120 μm and (B) 50 μm. The dashed line represents the common axis ofthe magnetic wells.
BiotechnologyJournal Biotechnol. J. 2011, 6, 165–176
rectly with source magnetization strength, asdemonstrated in Fig. 6B.
3.3 Representative pyrosequencing reactions
3.3.1 Reaction conditionsFor all of the basic chemical reactions performed, adevice was designed with three 3-mm-wide reser-voirs connected by a T-shaped array of actuationelectrodes.This device was fabricated with the sin-gle-level metal process to ensure reliability of per-formance. The buffer solution used for the reac-tions contained 50 mM Tris pH 7.6, 5.0 mM magne-sium acetate, 0.5 mM EDTA, 1.0 mM DTT, and0.01–0.02% wt Tween 20. To determine detectionlimits and optimize the system, the chemistry waslimited to the final step of the pyrosequencingprocess, as shown in Eq. (3).The substrate solutionconsisted of 400 μg/mL luciferin and the specifiedamount of ATP in buffer, and the enzyme solutioncontained the specified concentration of luciferasein buffer. The two solutions were each injected viaa micropipette into two of the three reservoirs,leaving the third to act as a waste reservoir.Droplets of approximately 300 pL were dispensedand moved with 20–30Vpp applied to the electrodes,the exact value determined on a chip-by-chip ba-sis. A droplet of luciferase solution was combinedwith a droplet of ATP solution, and the reaction wasobserved using a ES2 cooled CCD camera. The en-tire setup was housed in a dark box to prevent lightcontamination. Camera settings were 8×8 pixel bin-ning, and 10-s exposure time. All reactions werestarted precisely at the beginning of the 10-s win-dow and allowed to proceed to completion.
3.3.2 Dispensing enzyme-rich solutionsDispensing of solutions with a high concentrationof protein or enzyme, such as the luciferase solu-tions, was a challenge on the picoliter-scale device.Fouling of the chip surfaces over time causes theaqueous solutions to stick in the reservoir, and thesurfactant-like behavior of some enzymes changesthe contact angle and other fluidic properties, in-hibiting dispensing and slowing droplet move-ment. In larger volume devices, these problemscan be partially overcome by the momentum ofgreater fluid volumes, but in the smaller devices,dispensing solutions with high enzyme concentra-tions can be unreliable. Addition of an oil-basedsurfactant stabilized the oil films between thedroplets and the chips, reducing the fouling effectsof the enzymes, but did not completely eliminatethe problem. As a result, enzyme concentrationswere kept below a certain level, no more than1 μg/μL luciferase when good repeatability was re-quired and no more than 3 μg/μL luciferase duringall experimentation.
It should be noted that fouling problems are notobserved when the molecule of interest is bound tothe paramagnetic beads. Unlike in air-filled sys-tems [43, 44], the aqueous droplet in an oil-filleddevice does not make direct contact with the chipsurface. Instead, the oil completely encases theaqueous solution, even forming a film between thedroplet and the electrode surface. While free mol-ecules can partition across the oil-water interfaceto reach the chip surface, the hydrophilic para-magnetic beads with their bound molecules can-not.
Figure 6. (A) Magnetic flux density profile along magnetic wells. Magnet spacing is 50 μm. (B) Magnetic force along the common axis of the magneticsplit wells. High, medium and low field correspond to magnetization source strengths of 5×10⁵ A/m, 2.5×10⁵ A/m, and 1×10⁵ A/m, respectively.
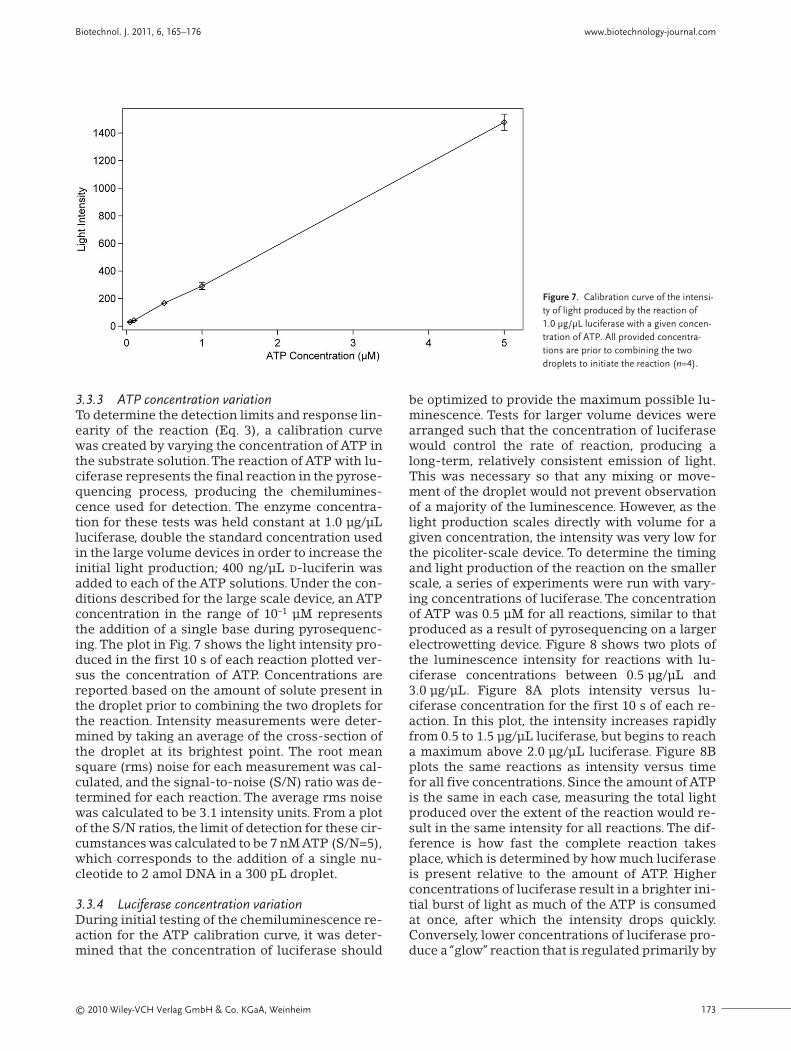
3.3.3 ATP concentration variationTo determine the detection limits and response lin-earity of the reaction (Eq. 3), a calibration curvewas created by varying the concentration of ATP inthe substrate solution.The reaction of ATP with lu-ciferase represents the final reaction in the pyrose-quencing process, producing the chemilumines-cence used for detection. The enzyme concentra-tion for these tests was held constant at 1.0 μg/μLluciferase, double the standard concentration usedin the large volume devices in order to increase theinitial light production; 400 ng/μL D-luciferin wasadded to each of the ATP solutions. Under the con-ditions described for the large scale device, an ATPconcentration in the range of 10–1 μM representsthe addition of a single base during pyrosequenc-ing.The plot in Fig. 7 shows the light intensity pro-duced in the first 10 s of each reaction plotted ver-sus the concentration of ATP. Concentrations arereported based on the amount of solute present inthe droplet prior to combining the two droplets forthe reaction. Intensity measurements were deter-mined by taking an average of the cross-section ofthe droplet at its brightest point. The root meansquare (rms) noise for each measurement was cal-culated, and the signal-to-noise (S/N) ratio was de-termined for each reaction. The average rms noisewas calculated to be 3.1 intensity units. From a plotof the S/N ratios, the limit of detection for these cir-cumstances was calculated to be 7 nM ATP (S/N=5),which corresponds to the addition of a single nu-cleotide to 2 amol DNA in a 300 pL droplet.
3.3.4 Luciferase concentration variationDuring initial testing of the chemiluminescence re-action for the ATP calibration curve, it was deter-mined that the concentration of luciferase should
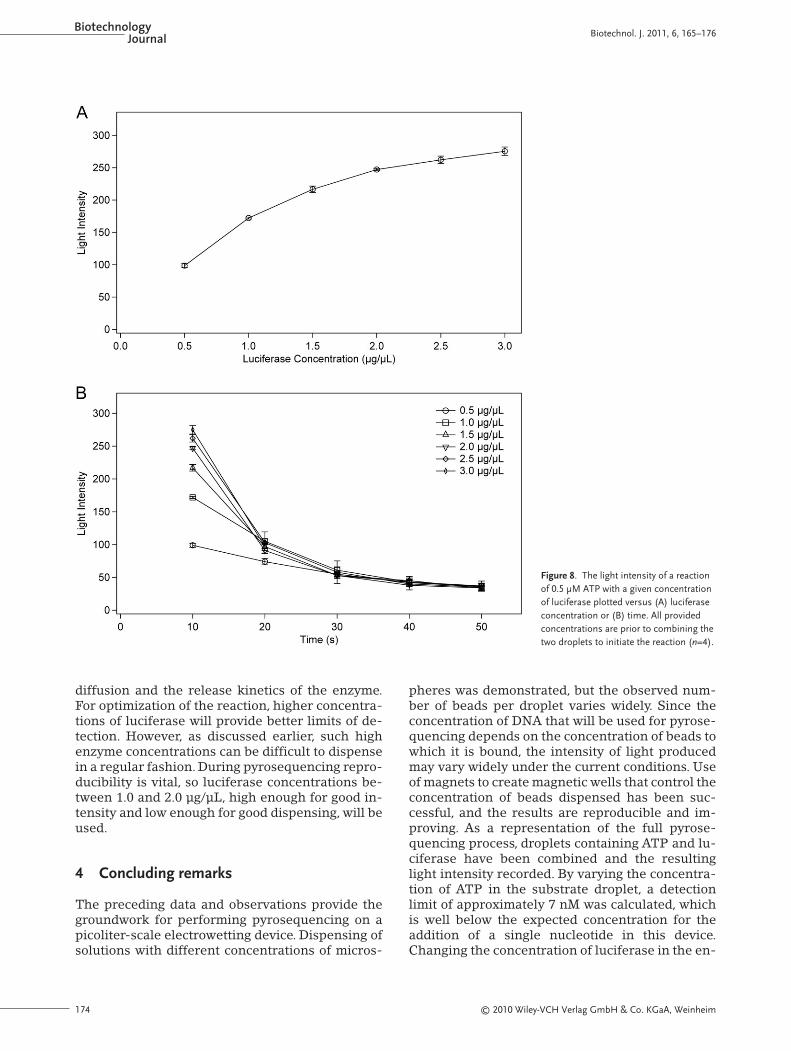
be optimized to provide the maximum possible lu-minescence. Tests for larger volume devices werearranged such that the concentration of luciferasewould control the rate of reaction, producing along-term, relatively consistent emission of light.This was necessary so that any mixing or move-ment of the droplet would not prevent observationof a majority of the luminescence. However, as thelight production scales directly with volume for agiven concentration, the intensity was very low forthe picoliter-scale device. To determine the timingand light production of the reaction on the smallerscale, a series of experiments were run with vary-ing concentrations of luciferase.The concentrationof ATP was 0.5 μM for all reactions, similar to thatproduced as a result of pyrosequencing on a largerelectrowetting device. Figure 8 shows two plots ofthe luminescence intensity for reactions with lu-ciferase concentrations between 0.5 μg/μL and3.0 μg/μL. Figure 8A plots intensity versus lu-ciferase concentration for the first 10 s of each re-action. In this plot, the intensity increases rapidlyfrom 0.5 to 1.5 μg/μL luciferase, but begins to reacha maximum above 2.0 μg/μL luciferase. Figure 8Bplots the same reactions as intensity versus timefor all five concentrations. Since the amount of ATPis the same in each case, measuring the total lightproduced over the extent of the reaction would re-sult in the same intensity for all reactions. The dif-ference is how fast the complete reaction takesplace, which is determined by how much luciferaseis present relative to the amount of ATP. Higherconcentrations of luciferase result in a brighter ini-tial burst of light as much of the ATP is consumedat once, after which the intensity drops quickly.Conversely, lower concentrations of luciferase pro-duce a “glow” reaction that is regulated primarily by
Biotechnol. J. 2011, 6, 165–176 www.biotechnology-journal.com
Figure 7. Calibration curve of the intensi-ty of light produced by the reaction of1.0 μg/μL luciferase with a given concen-tration of ATP. All provided concentra-tions are prior to combining the twodroplets to initiate the reaction (n=4).
BiotechnologyJournal Biotechnol. J. 2011, 6, 165–176
diffusion and the release kinetics of the enzyme.For optimization of the reaction, higher concentra-tions of luciferase will provide better limits of de-tection. However, as discussed earlier, such highenzyme concentrations can be difficult to dispensein a regular fashion. During pyrosequencing repro-ducibility is vital, so luciferase concentrations be-tween 1.0 and 2.0 μg/μL, high enough for good in-tensity and low enough for good dispensing, will beused.
4 Concluding remarks
The preceding data and observations provide thegroundwork for performing pyrosequencing on apicoliter-scale electrowetting device. Dispensing ofsolutions with different concentrations of micros-
pheres was demonstrated, but the observed num-ber of beads per droplet varies widely. Since theconcentration of DNA that will be used for pyrose-quencing depends on the concentration of beads towhich it is bound, the intensity of light producedmay vary widely under the current conditions. Useof magnets to create magnetic wells that control theconcentration of beads dispensed has been suc-cessful, and the results are reproducible and im-proving. As a representation of the full pyrose-quencing process, droplets containing ATP and lu-ciferase have been combined and the resultinglight intensity recorded. By varying the concentra-tion of ATP in the substrate droplet, a detectionlimit of approximately 7 nM was calculated, whichis well below the expected concentration for theaddition of a single nucleotide in this device.Changing the concentration of luciferase in the en-
Figure 8. The light intensity of a reactionof 0.5 μM ATP with a given concentrationof luciferase plotted versus (A) luciferaseconcentration or (B) time. All providedconcentrations are prior to combining thetwo droplets to initiate the reaction (n=4).
zyme droplet was also useful in optimizing the re-action conditions. Higher concentrations of lu-ciferase than those used in larger-scale devices re-sulted in a brighter signal, which is helpful in thepicoliter-scale devices that inherently producelower light levels. With these results and furtherdevelopments in the immediate future, pyrose-quencing of DNA on a picoliter-scale digital elec-trowetting device is well within sight.
This research was supported by grant # R01HG004354-01 from the National Institutes of Health.
The authors have declared no conflict of interest.
5 References
[1] Metzker, M. L., Sequencing technologies – the next genera-tion. Nat. Rev. Genet. 2009, 11, 31–46.
[2] Leamon, J. H., Rothberg, J. M., Cramming more sequencingreactions onto microreactor chips. Chem. Rev. 2007, 107,3367–3376.
[3] Voelkerding, K. V., Dames, S. A., Durtschi, J. D., Next-gener-ation sequencing: from basic research to diagnostics. Clin.Chem. 2009, 55, 641–658.
[4] Wheeler, D.A., Srinivasan, M., Egholm, M., Shen,Y. et al.,Thecomplete genome of an individual by massively parallelDNA sequencing. Nature 2008, 452, 872–877.
[5] Hyman, E. D., A new method of sequencing DNA. Anal.Biochem. 1988, 174, 423–436.
[6] Ronaghi, M., Karamohamed, S., Pettersson, B., Uhlen, M.,Nyren, P., Real-time DNA sequencing using detection of py-rophosphate release. Anal. Biochem. 1996, 242, 84–89.
[7] Ahmadian, A., Ehn, M., Hober, S., Pyrosequencing: history,biochemistry and future. Clin. Chim. Acta 2006, 363, 83–94.
[8] Diggle, M.A., Clarke, S. C., Pyrosequencing, sequence typingat the speed of light. Mol. Biotechnol. 2004, 28, 129–137.
[9] Huse, S. M., Huber, J.A., Morrison, H. G., Sogin, M. L.,Welch,D. M., Accuracy and quality of massively parallel DNA py-rosequencing. Genome Biol. 2007, 8, R143.
[10] Ronaghi, M., Pyrosequencing sheds light on DNA sequenc-ing. Genome Res. 2001, 11, 3–11.
[11] Ahmadian, A., Gharizadeh, B., Gustafsson, A. C., Sterky, F. etal., Single-nucleotide polymorphism analysis by pyrose-quencing. Anal. Biochem. 2000, 280, 103–110.
[12] Fakhrai-Rad, H., Pourmand, N., Ronaghi, M., Pyrosequenc-ing: An accurate detection platform for single nucleotidepolymorphisms. Hum. Mutat. 2002, 19, 479–485.
[13] Thomas, R. K., Nickerson, E., Simons, J. F., Janne, P. A. et al.,Sensitive mutation detection in heterogeneous cancer spec-imens by massively parallel picoliter reactor sequencing.Nat. Med. 2006, 12, 852–855.
[14] Dowd, S. E., Sun, Y., Secor, P. R., Rhoads, D. D. et al., Surveyof bacterial diversity in chronic wounds using pyrose-quencing, DGGE, and full ribosome shotgun sequencing.BMC Microbiol. 2008, 8, 43.
[15] Gabriel, C., Danzer, M., Hackl, C., Kopal, G. et al., Rapid high-throughput human leukocyte antigen typing by massively
[16] Vera, J. C., Wheat, C. W., Fescemyer, H. W., Frilander, M. J. etal., Rapid transcriptome characterization for a nonmodelorganism using 454 pyrosequencing. Mol. Ecol. 2008, 17,1636–1647.
[17] Zhou, G., Kamahori, M., Okano, K., Harada, K., Kambara, H.,Miniaturized pyrosequencer for DNA analysis with capil-laries to deliver deoxynucleotides. Electrophoresis 2001, 22,3497–3504.
[18] Russom,A.,Tooke, N.,Andersson, H., Stemme, G., Single nu-cleotide polymorphism analysis by allele-specific primerextension with real-time bioluminescence detection in amicrofluidic device. J. Chromatogr. A 2003, 1014, 37–45.
[19] Russom, A., Tooke, N., Andersson, H., Stemme, G., Pyrose-quencing in a microfluidic flow-through device. Anal. Chem.2005, 77, 7505–7511.
[20] Margulies, M., Egholm, M., Altman, W. E., Attiya, S. et al.,Genome sequencing in microfabricated high-density picol-itre reactors. Nature 2005, 437, 376–380.
[21] Pollack, M. G., Fair, R. B., Electrowetting-based actuation ofliquid droplets for microfluidic applications. Appl. Phys.Lett. 2000, 77, 1725–1726.
[22] Fair, R. B., Digital microfluidics: is a true lab-on-a-chip pos-sible? Microfluid Nanofluid 2007, 3, 245–281.
[23] Lin,Y.-Y., Evans, R. D., Welch, E., Hsu, B.-N. et al., Low volt-age electrowetting-on-dielectric platform using multi-layerinsulators. Sens. Actuators B 2010, 105, 465–470.
[24] Ren, H., Fair, R. B., Pollack, M. G.,Automated on-chip dropletdispensing with volume control by electro-wetting actua-tion and capacitance metering. Sens. Actuators B 2004, 98,319–327.
[25] Paik, P., Pamula, V. K., Fair, R. B., Rapid droplet mixers fordigital microfluidic systems. Lab Chip 2003, 3, 253–259.
[26] Cho, S. K., Moon, H., C. J. Kim, Creating, transporting, cut-ting, and merging liquid droplets by electrowetting-basedactuation for digital microfluidiccircuits. J. Microelectro-mech. Syst. 2003, 12, 70–80.
[27] Zhang, T., Chakrabarty, K., Fair, R. B., Behavioral modelingand performance evaluation of microelectrofluidics-basedPCR systems using SystemC. IEEE Trans Comput Aided DesIntegr Circuits Syst 2004, 23, 843–858.
[28] Srinivasan,V., Pamula,V. K., Fair, R. B., An integrated digitalmicrofluidic lab-on-a-chip for clinical diagnostics on hu-man physiological fluids. Lab Chip 2004, 4, 310–315.
[29] Moon, H., Wheeler, A. R., Garrell, R. L., Loo, J. A., Kim, C.-J.C., An integrated digital microfluidic chip for multiplexedproteomic sample preparation and analysis by MALDI-MS.Lab Chip 2006, 6, 1213–1219.
[30] Cho, S. K., Zhao, Y., Kim, C.-J. C., Concentration and binaryseparation of micro particles for droplet-based digital mi-crofluidics. Lab Chip 2007, 7, 490–498.
[31] Su, F., Chakrabarty, K., Fair, R. B., Microfluidics-basedbiochips:Technology issues, implementation platforms, anddesign-automation challenges. IEEE Trans Comput AidedDes Integr Circuits Syst 2006, 25, 211–223.
[32] Fair, R. B., Khlystov,A.,Tailor,T. D., Ivanov,V. et al., Chemicaland biological applications of digital-microfluidic devices.IEEE Des Test Comput 2007, 10–24.
[33] Luan, L., Evans, R. D., Jokerst, N. M., Fair, R. B., Integratedoptical sensor in a digital microfluidic platform. IEEE SensJ 2008, 8, 628–635.
[34] Shah, G. J., Ohta,A.T., Chiou, E. P.-Y.,Wu, M. C., Kim, C.-J. C.,EWOD-driven droplet microfluidic device integrated with
Biotechnol. J. 2011, 6, 165–176 www.biotechnology-journal.com
BiotechnologyJournal Biotechnol. J. 2011, 6, 165–176
optoelectronic tweezers as an automated platform for cellu-lar isolation and analysis. Lab Chip 2009, 9, 1732–1739.
[35] Sista, R. S., Eckhardt,A. E., Srinivasan,V., Pollack, M. G. et al.,Heterogeneous immunoassays using magnetic beads on adigital microfluidic platform. Lab Chip 2008, 8, 2188–2196.
[36] Beyor, N., Seo, T. S., Liu, P., Mathies, R. A., Immunomagneticbead-based cell concentration microdevice for dilutepathogen detection. Biomed. Microdevices 2008, 10, 909–917.
[37] Huang, H., Zheng, X. L., Zheng, J. S., Pan, J., Pu, X. Y., Rapidanalysis of alpha-fetoprotein by chemiluminescence mi-crofluidic immunoassay system based on super-paramag-netic microbeads. Biomed. Microdevices 2009, 11, 213–216.
[38] Dupont, E. P., Luisier, R., Gijs, M.A. M., NOA 63 as a UV-cur-able material for fabrication of microfluidic channels withnative hydrophilicity. Microelectron. Eng. 2010, 87, 1253–1255.
[39] Rong, R., Choi, J.-W., Ahn, C. H., An on-chip magnetic beadseparator for biocell sorting. J. Micromech. Microeng. 2006,16, 2783–2790.
[40] Lee, H., Purdon,A. M.,Westervelt, R. M., Manipulation of bi-ological cells using a microelectromagnet matrix. Appl.Phys. Lett. 2004, 85, 1063–1065.
[41] Lee, H., Purdon, A. M., Chu,V., Westervelt, R. M., Controlledassembly of magnetic nanoparticles from magnetotacticbacteria using microelectromagnets arrays. Nano Lett. 2004,4, 995–998.
[42] Lee, H., Liu, Y., Hamb, D., Westervelt, R. M., Integrated cellmanipulation system—CMOS/microfluidic hybrid. Lab Chip2007, 7, 331–337.
[43] Shah, G. J., Kim, C.-J. C., Meniscus-assisted high-efficiencymagnetic collection and separation for EWOD droplet mi-crofluidics. J. Microelectromech. Syst. 2009, 18, 363–375.
[44] Wang,Y., Zhao,Y., Cho, S. K., Efficient in-droplet separationof magnetic particles for digital microfluidics. J. Micromech.Microeng. 2007, 17, 2148–2156.