28
India Semiconductor Association (ISA) The India ESDM Story November 2012
| Date post: | 04-Feb-2018 |
| Category: |
Documents |
| Upload: | anil-kumar-singh |
| View: | 217 times |
| Download: | 0 times |
7/21/2019 Pictures & Graphs
http://slidepdf.com/reader/full/pictures-graphs 1/28
India Semiconductor Association (ISA)
The India ESDM Story
November 2012
7/21/2019 Pictures & Graphs
http://slidepdf.com/reader/full/pictures-graphs 2/28
Contents
India Semiconductor Association (ISA)
ESDM Industry Overview
Role of Innovation in Development and Importance of Made
in India Products
Skill Development and its Availability
Government Policies and Initiatives
Opportunity Segments
7/21/2019 Pictures & Graphs
http://slidepdf.com/reader/full/pictures-graphs 3/28
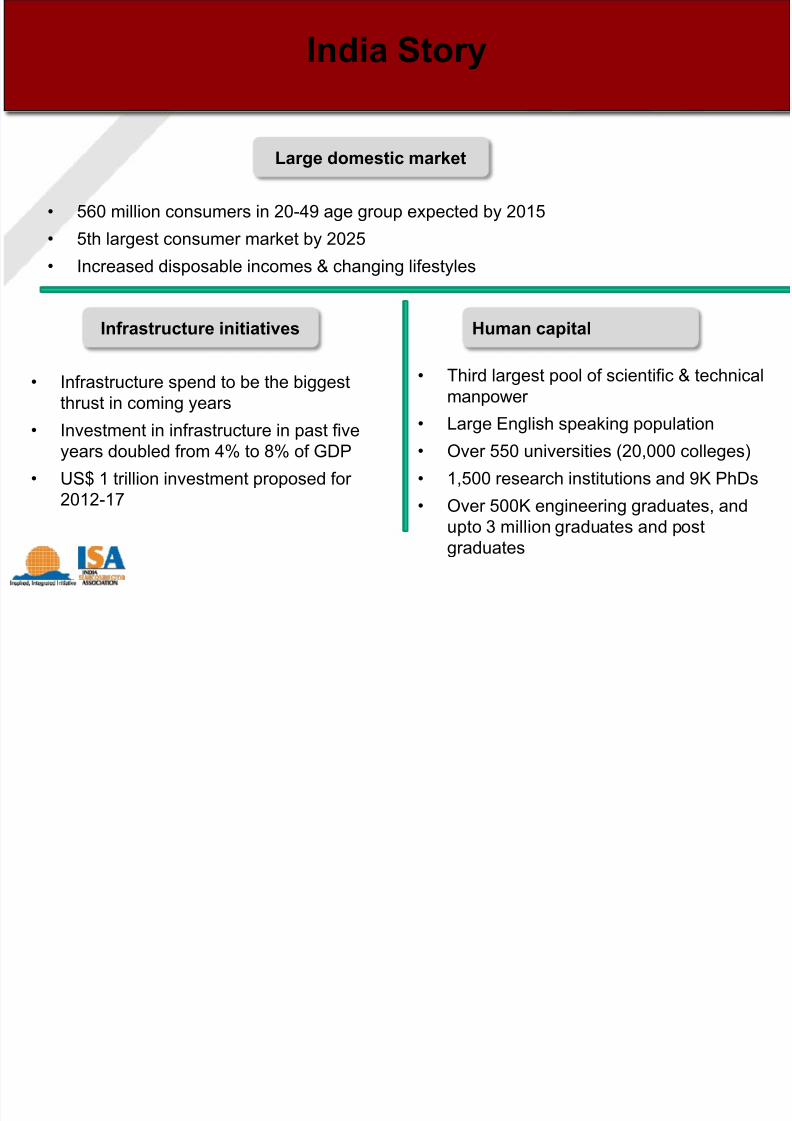
India Story
• 560 million consumers in 20-49 age group expected by 2015
• 5th largest consumer market by 2025
• Increased disposable incomes & changing lifestyles
• Third largest pool of scientific & technicalmanpower
• Large English speaking population
• Over 550 universities (20,000 colleges)
• 1,500 research institutions and 9K PhDs
• Over 500K engineering graduates, andupto 3 million graduates and post
graduates
• Infrastructure spend to be the biggestthrust in coming years
• Investment in infrastructure in past fiveyears doubled from 4% to 8% of GDP
• US$ 1 trillion investment proposed for2012-17
Infrastructure initiatives
Large domestic market
Human capital

7/21/2019 Pictures & Graphs
http://slidepdf.com/reader/full/pictures-graphs 4/28
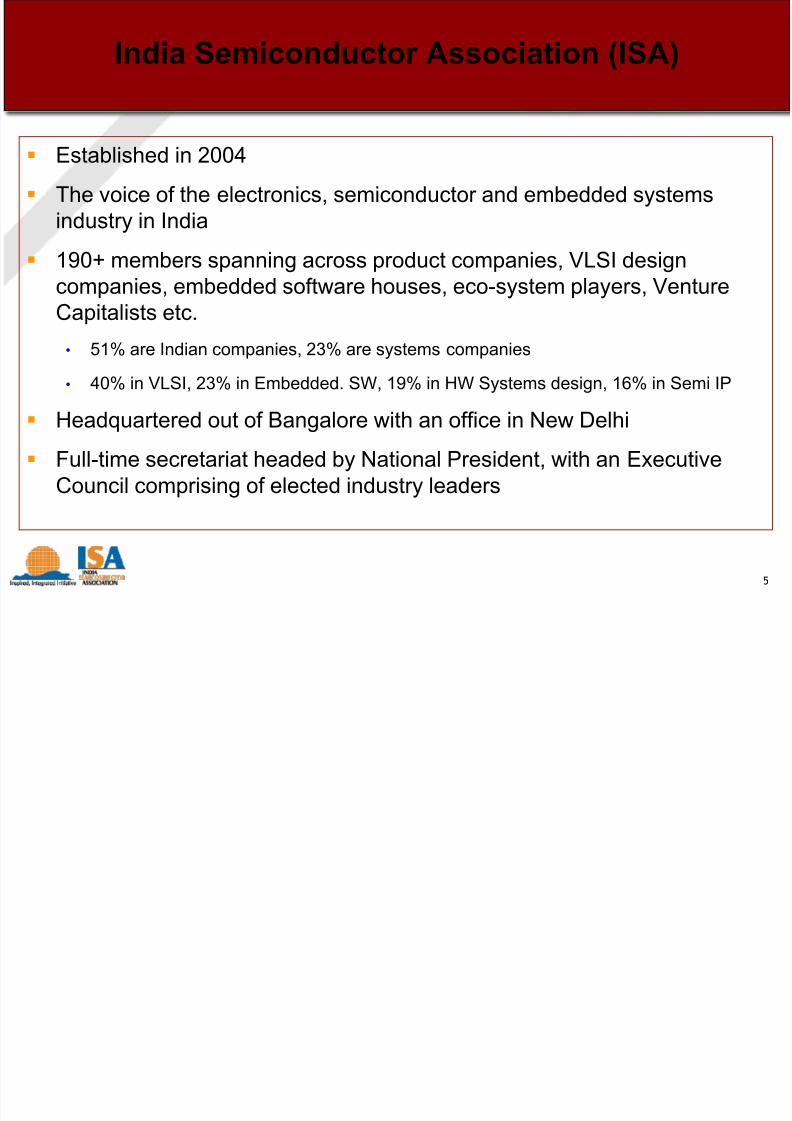
India Semiconductor Association (ISA)
7/21/2019 Pictures & Graphs
http://slidepdf.com/reader/full/pictures-graphs 5/28
7/21/2019 Pictures & Graphs
http://slidepdf.com/reader/full/pictures-graphs 6/28
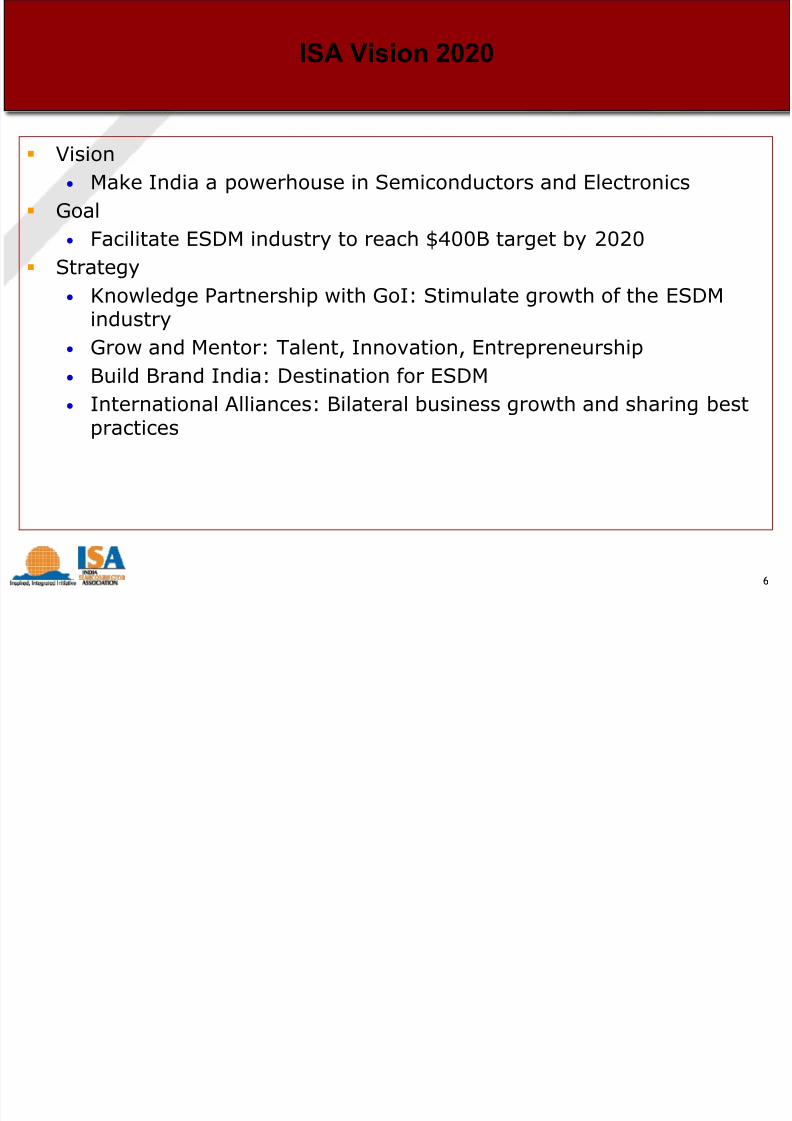
ISA Vision 2020
Vision
• Make India a powerhouse in Semiconductors and Electronics
Goal
• Facilitate ESDM industry to reach $400B target by 2020
Strategy• Knowledge Partnership with GoI: Stimulate growth of the ESDM
industry
• Grow and Mentor: Talent, Innovation, Entrepreneurship
• Build Brand India: Destination for ESDM
•
International Alliances: Bilateral business growth and sharing bestpractices
6
7/21/2019 Pictures & Graphs
http://slidepdf.com/reader/full/pictures-graphs 7/28
ISA Confidential May 2011 7
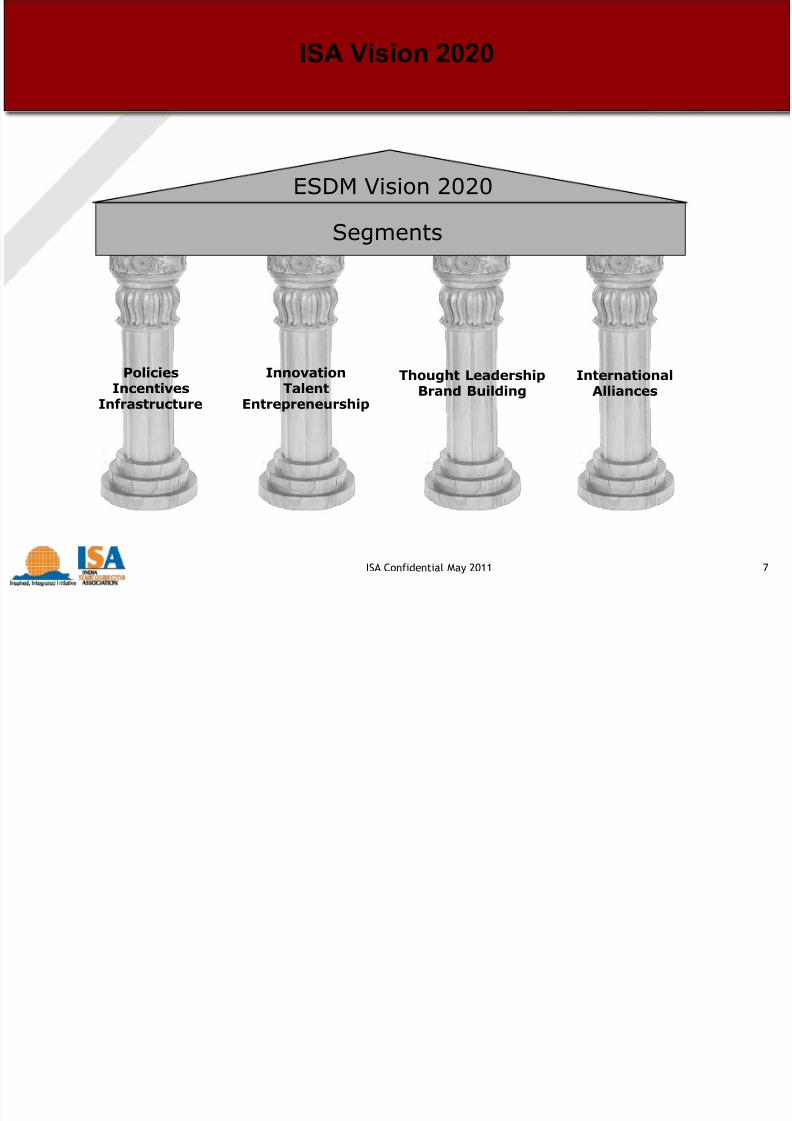
PoliciesIncentives
Infrastructure
ESDM Vision 2020
Segments
InnovationTalent
Entrepreneurship
Thought LeadershipBrand Building
InternationalAlliances
ISA Vision 2020
7/21/2019 Pictures & Graphs
http://slidepdf.com/reader/full/pictures-graphs 8/28
ESDM Industry Overview
7/21/2019 Pictures & Graphs
http://slidepdf.com/reader/full/pictures-graphs 9/28
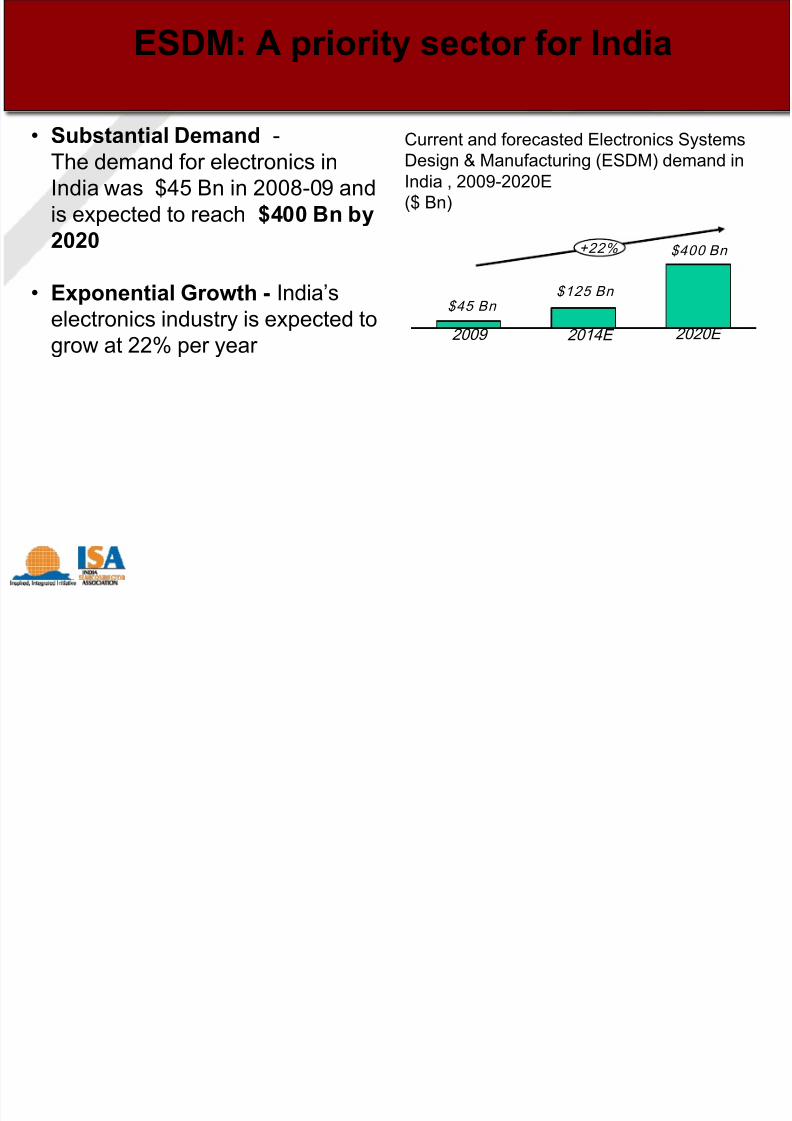
ESDM: A priority sector for India
• Substantial Demand -The demand for electronics inIndia was $45 Bn in 2008-09 andis expected to reach $400 Bn by2020
• Exponential Growth - India’s
electronics industry is expected togrow at 22% per year
Current and forecasted Electronics SystemsDesign & Manufacturing (ESDM) demand inIndia , 2009-2020E($ Bn)
$45 Bn
+22% $400 Bn
$125 Bn
2009 2014E 2020E
7/21/2019 Pictures & Graphs
http://slidepdf.com/reader/full/pictures-graphs 10/28
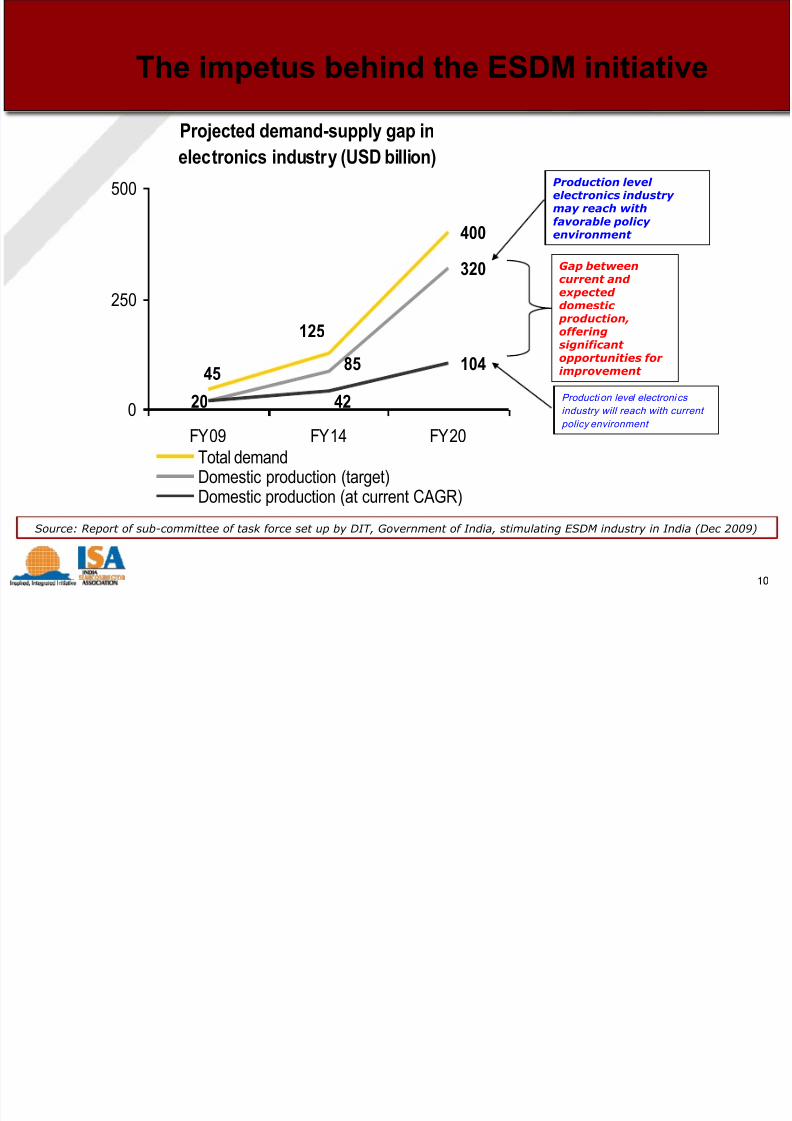
Projected demand-supply gap inelectronics industry (USD billion)
400
10445
125
85
320
20 420
250
500
FY09 FY14 FY20
Total demandDomestic production (target)Domestic production (at current CAGR)
Production levelelectronics industrymay reach withfavorable policyenvironment
Producti on level electroni cs
industry will reach with currentpolicy environment
Gap between
current andexpecteddomestic production,offering significantopportunities forimprovement
Source: Report of sub-committee of task force set up by DIT, Government of India, stimulating ESDM industry in India (Dec 2009)
The impetus behind the ESDM initiative
10
7/21/2019 Pictures & Graphs
http://slidepdf.com/reader/full/pictures-graphs 11/28
11
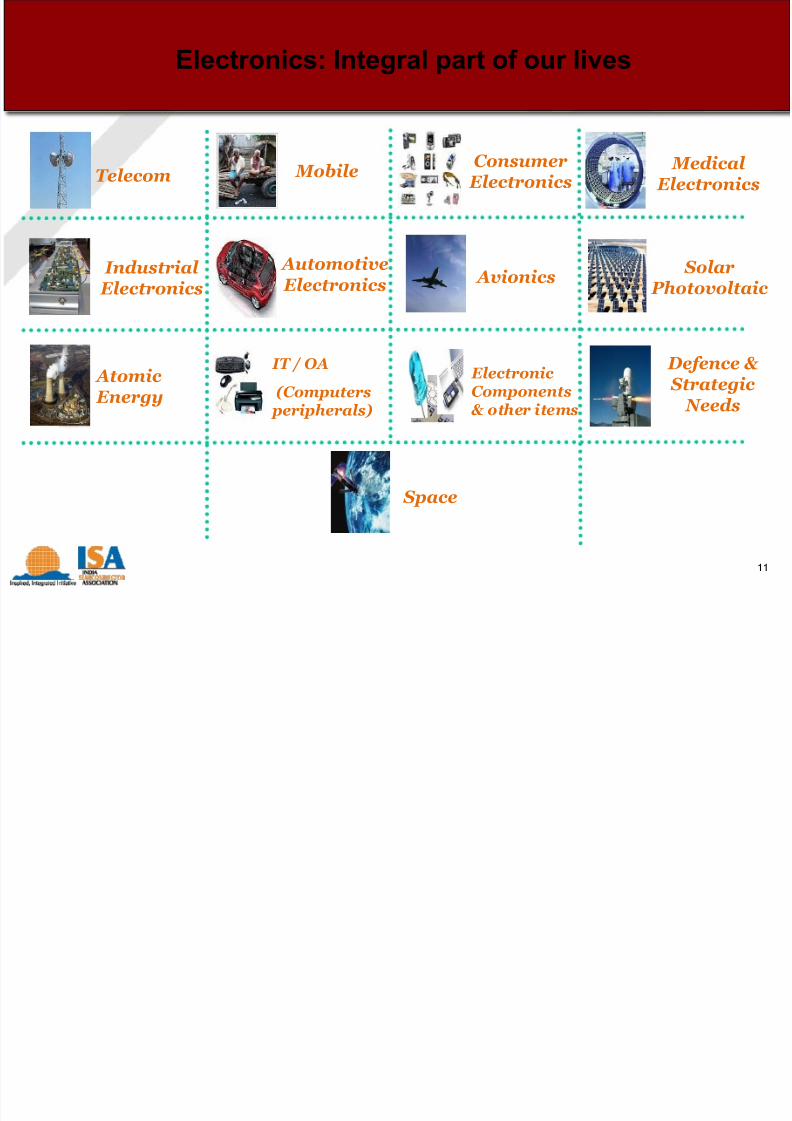
Telecom Mobile
Industrial Electronics
Consumer Electronics
IT / OA
(Computers
peripherals)
ElectronicComponents
& other items
Medical Electronics
Automotive Electronics
Solar Photovoltaic
Atomic Energy
Space
Defence & Strategic
Needs
Avionics
Electronics: Integral part of our lives
7/21/2019 Pictures & Graphs
http://slidepdf.com/reader/full/pictures-graphs 12/28
7/21/2019 Pictures & Graphs
http://slidepdf.com/reader/full/pictures-graphs 13/28
13
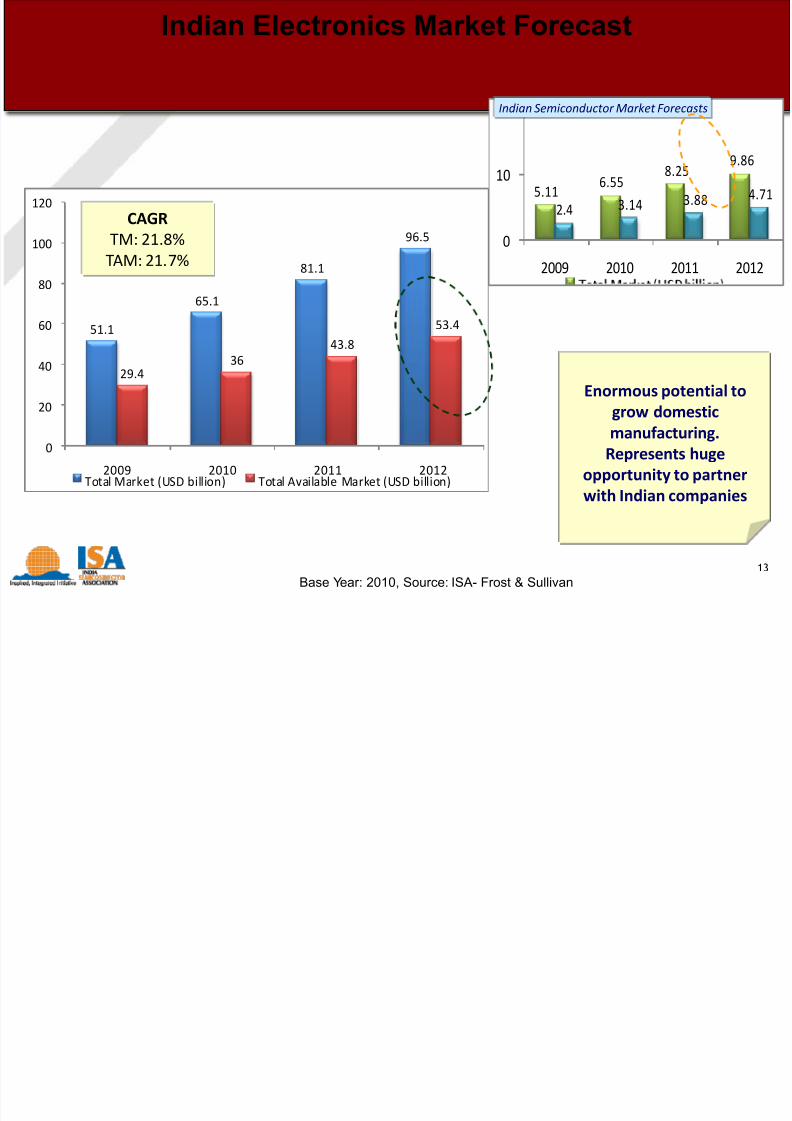
Indian Electronics Market Forecast
Base Year: 2010, Source: ISA- Frost & Sullivan
51.1
65.1
81.1
96.5
29.436
43.8
53.4
0
20
40
60
80
100
120
2009 2010 2011 2012Total Market (USD billion) Total Available Market (USD billion)
CAGR
TM: 21.8%
TAM: 21.7%
5.116.55
8.259.86
2.4 3.14 3.88 4.71
0
10
20
2009 2010 2011 2012
Indian Semiconductor Market Forecasts
Enormous potential to
grow domesticmanufacturing.
Represents huge
opportunity to partner
with Indian companies
7/21/2019 Pictures & Graphs
http://slidepdf.com/reader/full/pictures-graphs 14/28
14
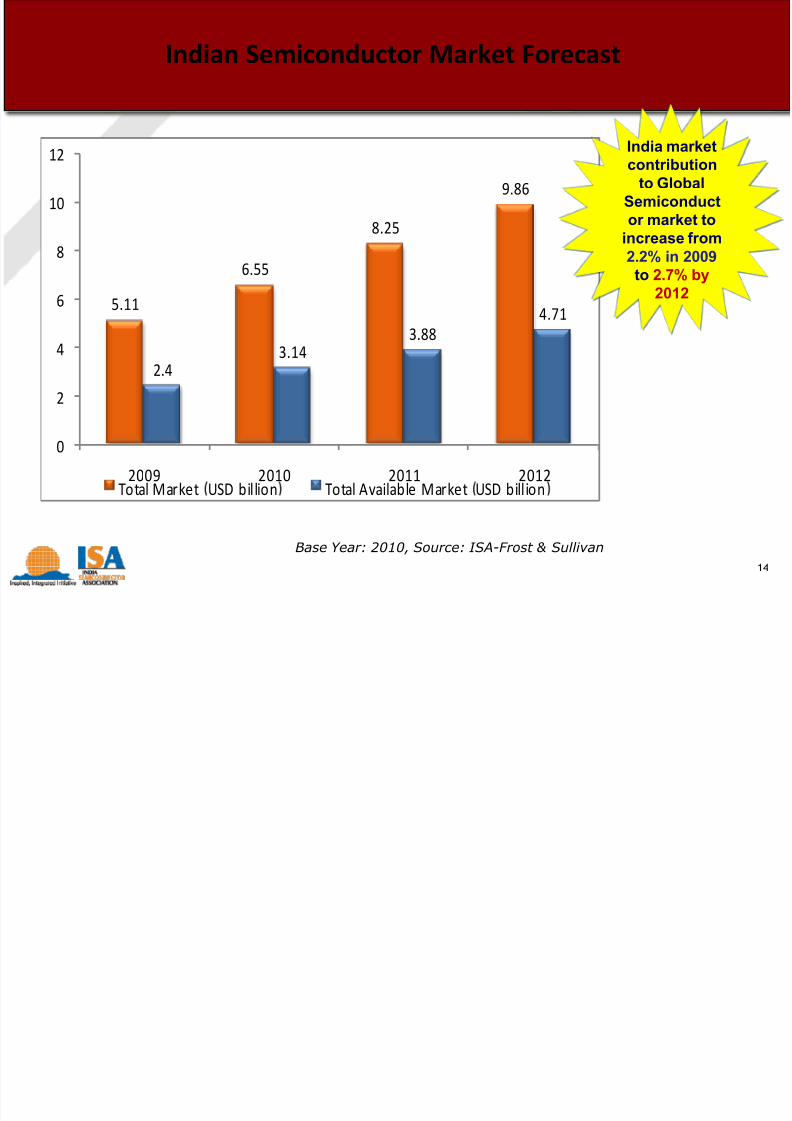
Indian Semiconductor Market Forecast
Base Year: 2010, Source: ISA-Frost & Sullivan
5.11
6.55
8.25
9.86
2.43.14
3.88
4.71
0
2
4
6
8
10
12
2009 2010 2011 2012Total Market USD billion Total Available Market USD billion
India marketcontribution
to GlobalSemiconductor market to
increase from2.2% in 2009
to 2.7% by2012
7/21/2019 Pictures & Graphs
http://slidepdf.com/reader/full/pictures-graphs 15/28
15
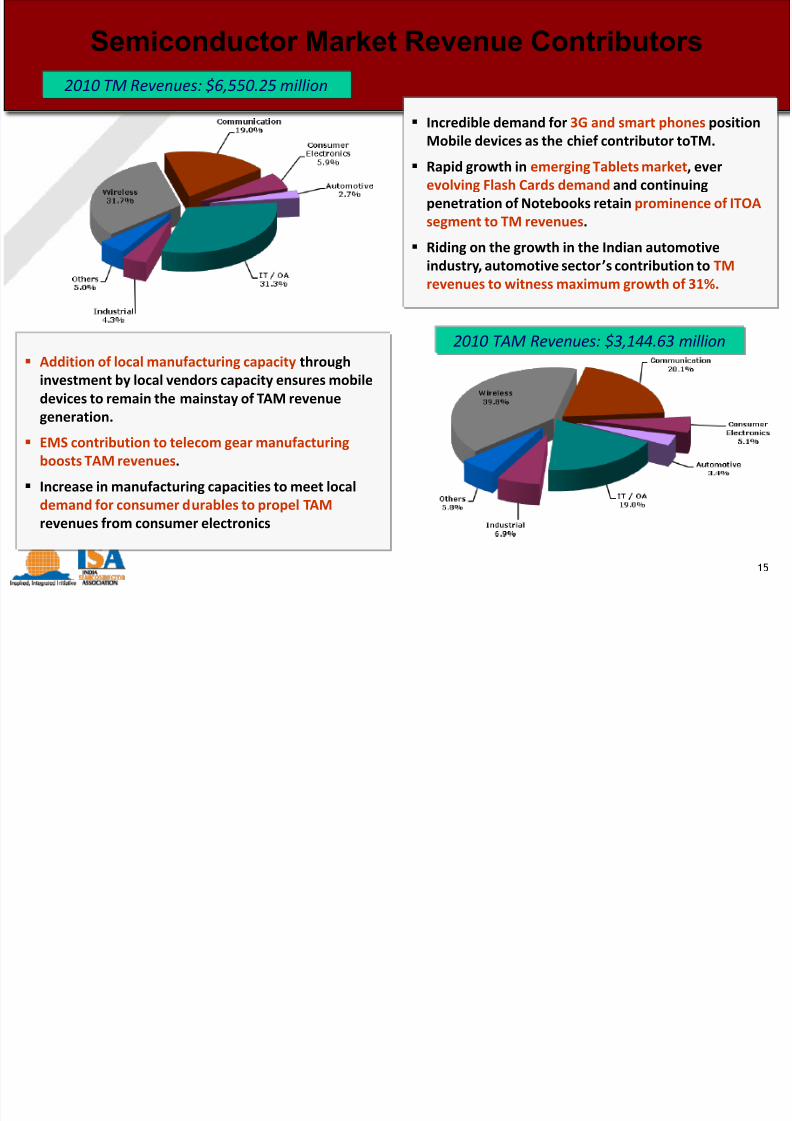
2010 TAM Revenues: $3,144.63 million
2010 TM Revenues: $6,550.25 million
Incredible demand for 3G and smart phones position
Mobile devices as the chief contributor toTM.
Rapid growth in emerging Tablets market, ever
evolving Flash Cards demand and continuing
penetration of Notebooks retain prominence of ITOA
segment to TM revenues.
Riding on the growth in the Indian automotive
industry, automotive sector’s contribution to TM
revenues to witness maximum growth of 31%.
Addition of local manufacturing capacity through
investment by local vendors capacity ensures mobile
devices to remain the mainstay of TAM revenue
generation.
EMS contribution to telecom gear manufacturing
boosts TAM revenues.
Increase in manufacturing capacities to meet local
demand for consumer durables to propel TAM
revenues from consumer electronics
Semiconductor Market Revenue Contributors

7/21/2019 Pictures & Graphs
http://slidepdf.com/reader/full/pictures-graphs 16/28
Skill Development and its Availability
7/21/2019 Pictures & Graphs
http://slidepdf.com/reader/full/pictures-graphs 17/28
Importance of skill development for ESDM industry
The industry is presently characterized by high level of imports and lowdomestic content, which is beginning to change with the Government’spro-active policy initiatives to encourage higher domestic value additionin Electronic Systems Design & Manufacturing (ESDM).
These initiatives will create significant opportunities and requirements for
skilled personnel. As the electronics industry is technology intensive, theworkforce would need to be continuously trained.
Availability of large pool of skilled workforce is necessary to attract FDI.
Hence, skill development finds a very important place in growth of thedomestic ESDM industry and progress of the country.
7/21/2019 Pictures & Graphs
http://slidepdf.com/reader/full/pictures-graphs 18/28
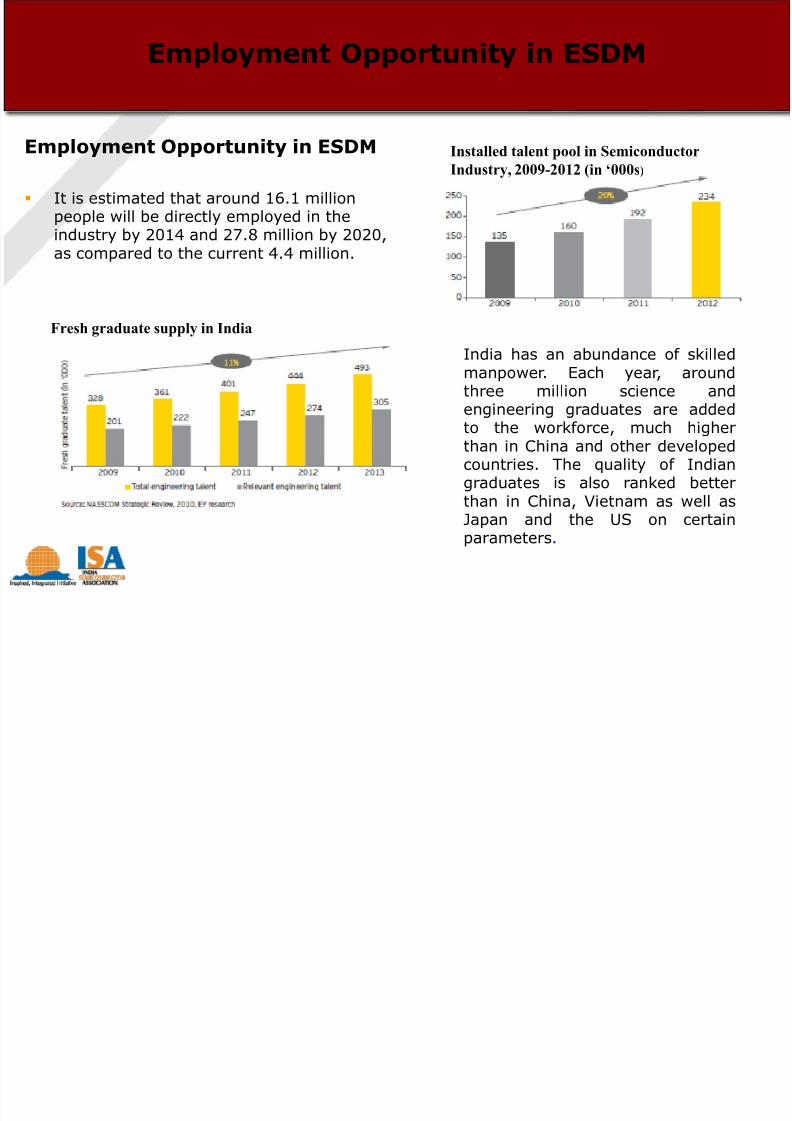
Employment Opportunity in ESDM
Employment Opportunity in ESDM
It is estimated that around 16.1 millionpeople will be directly employed in theindustry by 2014 and 27.8 million by 2020,as compared to the current 4.4 million.
Installed talent pool in Semiconductor
Industry, 2009-2012 (in ‘000s)
India has an abundance of skilledmanpower. Each year, aroundthree million science and
engineering graduates are addedto the workforce, much higherthan in China and other developedcountries. The quality of Indiangraduates is also ranked betterthan in China, Vietnam as well asJapan and the US on certainparameters.
Fresh graduate supply in India

7/21/2019 Pictures & Graphs
http://slidepdf.com/reader/full/pictures-graphs 19/28
Role of Electronics Sector Skills Council (ESSC)
ESSC will undertake pilot projects in the initial period of 1 year or so in thefunctions/occupations like Production, Service Support, Semiconductor design /R&D
Around 5000-6000 workforce will be imparted skills and certified during the pilotphase
Steady growth planned in the number of persons to be imparted skills to reacharound 6.5 lakh persons yearly by 2020
On a cumulative basis, 2 million workforce proposed to be trained and certifiedby 2020
28 trades proposed to be covered in the skill development plan

7/21/2019 Pictures & Graphs
http://slidepdf.com/reader/full/pictures-graphs 20/28
Government Policies and Initiatives
7/21/2019 Pictures & Graphs
http://slidepdf.com/reader/full/pictures-graphs 21/28
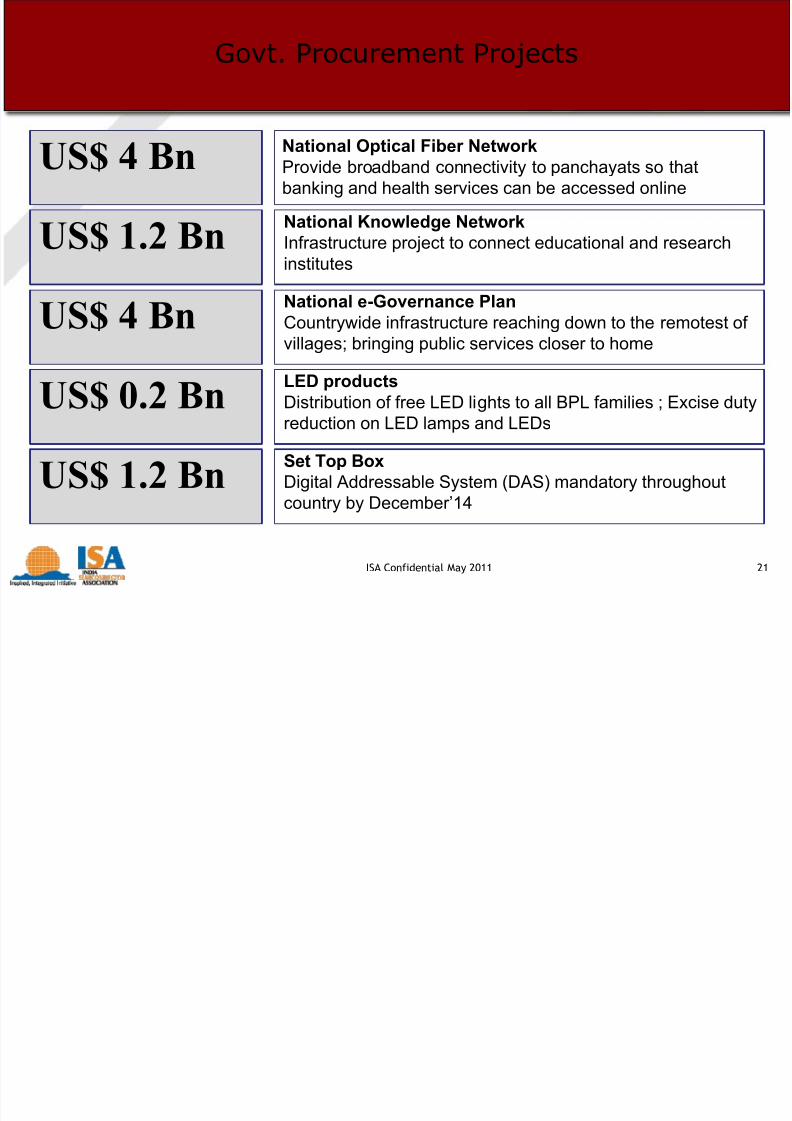
Govt. Procurement Projects
ISA Confidential May 2011 21
National Optical Fiber NetworkProvide broadband connectivity to panchayats so thatbanking and health services can be accessed online
US$ 4 Bn
US$ 1.2 Bn
US$ 4 Bn
National Knowledge NetworkInfrastructure project to connect educational and researchinstitutes
National e-Governance PlanCountrywide infrastructure reaching down to the remotest ofvillages; bringing public services closer to home
US$ 1.2 BnSet Top BoxDigital Addressable System (DAS) mandatory throughoutcountry by December’14
US$ 0.2 BnLED productsDistribution of free LED lights to all BPL families ; Excise duty
reduction on LED lamps and LEDs
7/21/2019 Pictures & Graphs
http://slidepdf.com/reader/full/pictures-graphs 22/28
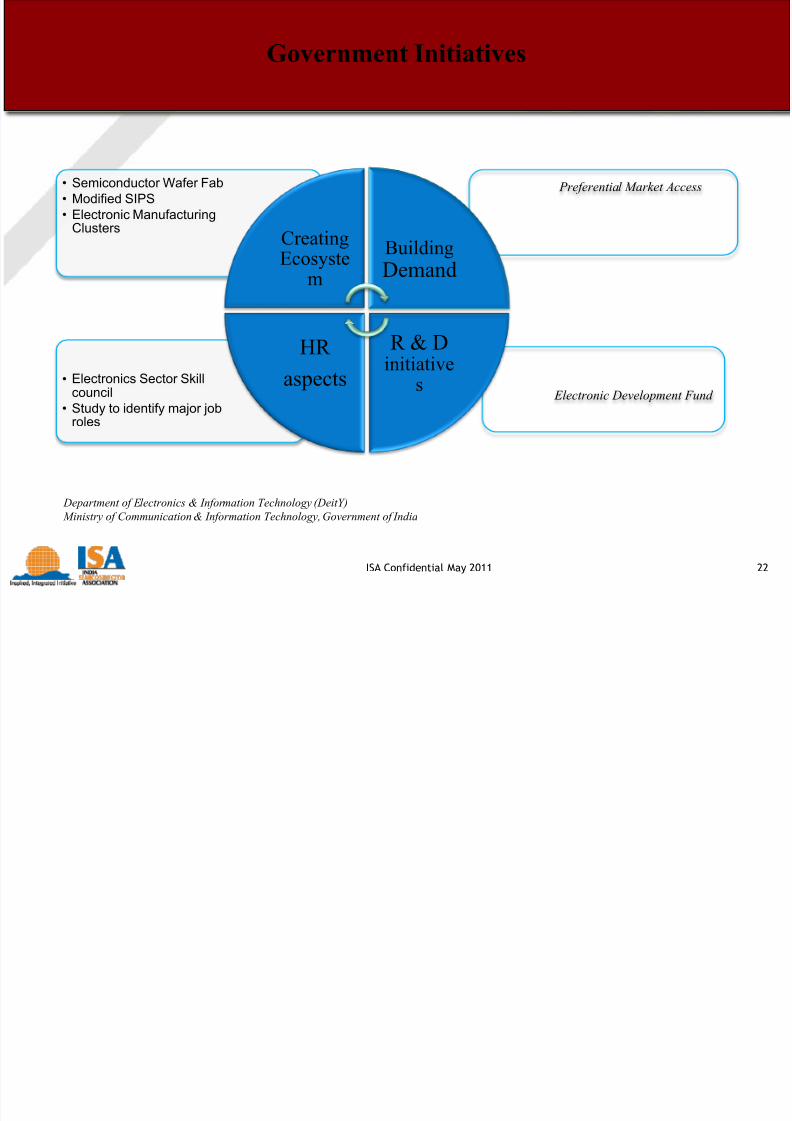
Preferential Market Access
Electronic Development Fund
• Electronics Sector Skillcouncil
• Study to identify major jobroles
• Semiconductor Wafer Fab• Modified SIPS• Electronic Manufacturing
ClustersCreatingEcosyste
m
Building
Demand
R & Dinitiative
s
HR
aspects
Government Initiatives
ISA Confidential May 2011 22
Department of Electronics & Information Technology (DeitY)
Ministry of Communication & Information Technology, Government of India
7/21/2019 Pictures & Graphs
http://slidepdf.com/reader/full/pictures-graphs 23/28
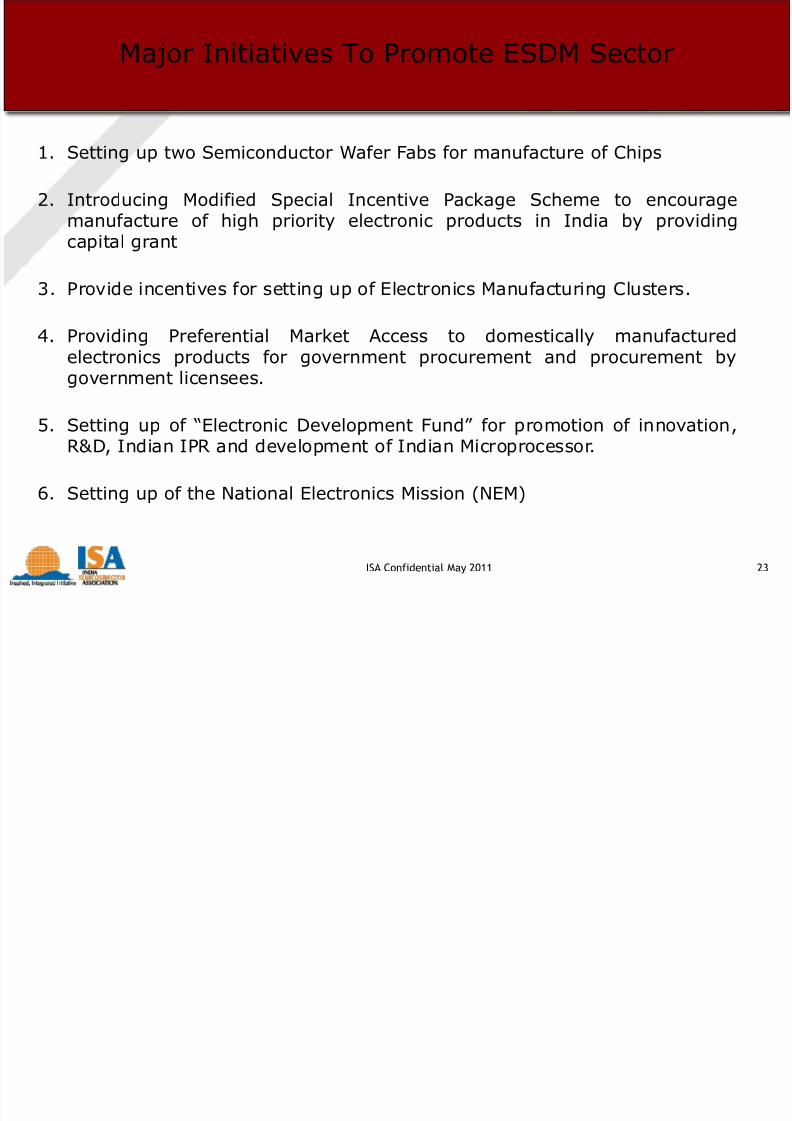
Major Initiatives To Promote ESDM Sector
ISA Confidential May 2011 23
1. Setting up two Semiconductor Wafer Fabs for manufacture of Chips
2. Introducing Modified Special Incentive Package Scheme to encouragemanufacture of high priority electronic products in India by providingcapital grant
3. Provide incentives for setting up of Electronics Manufacturing Clusters.
4. Providing Preferential Market Access to domestically manufacturedelectronics products for government procurement and procurement bygovernment licensees.
5. Setting up of “Electronic Development Fund” for promotion of innovation,R&D, Indian IPR and development of Indian Microprocessor.
6. Setting up of the National Electronics Mission (NEM)

7/21/2019 Pictures & Graphs
http://slidepdf.com/reader/full/pictures-graphs 24/28
Opportunity Segments
7/21/2019 Pictures & Graphs
http://slidepdf.com/reader/full/pictures-graphs 25/28
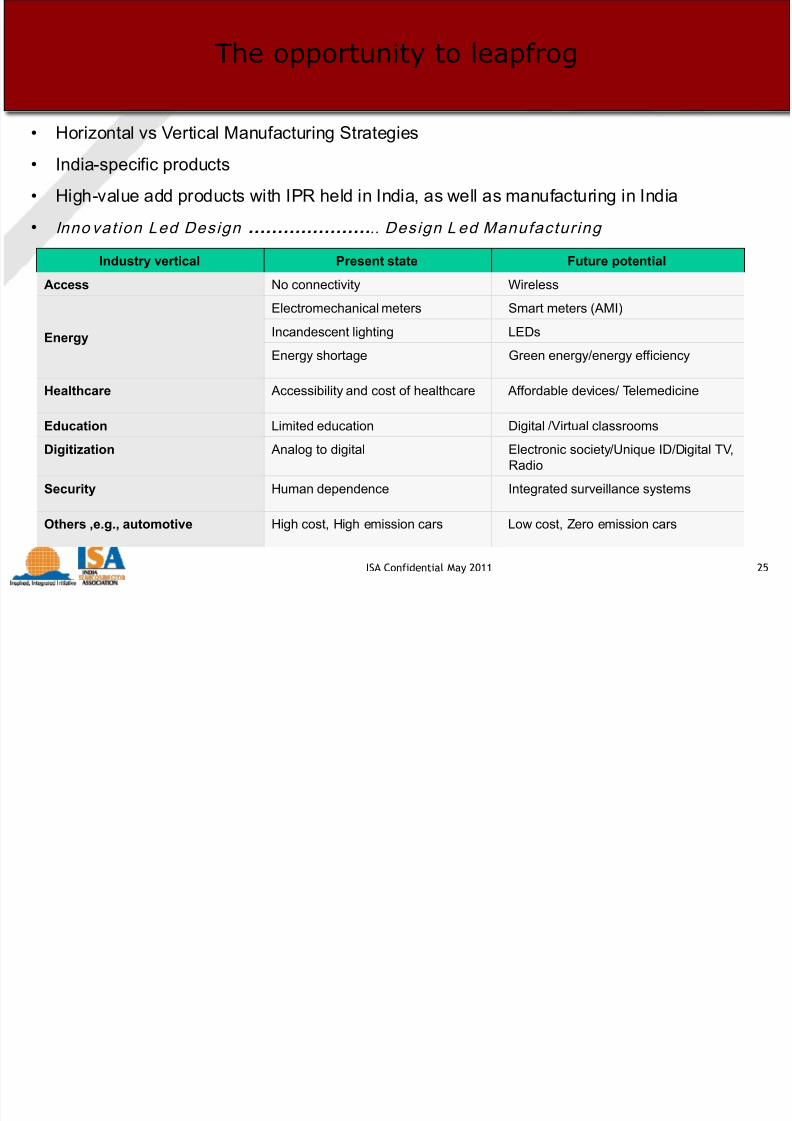
The opportunity to leapfrog
ISA Confidential May 2011 25
Industry vertical Present state Future potential
Access No connectivity Wireless
Energy
Electromechanical meters Smart meters (AMI)
Incandescent lighting LEDs
Energy shortage Green energy/energy efficiency
Healthcare Accessibility and cost of healthcare Affordable devices/ Telemedicine
Education Limited education Digital /Virtual classrooms
Digitization Analog to digital Electronic society/Unique ID/Digital TV,Radio
Security Human dependence Integrated surveillance systems
Others ,e.g., automotive High cost, High emission cars Low cost, Zero emission cars
• Horizontal vs Vertical Manufacturing Strategies• India-specific products
• High-value add products with IPR held in India, as well as manufacturing in India
• In n o v a t i o n L e d D e s i g n ………………….. D e s i g n L e d M a n u f a c t u r i n g
7/21/2019 Pictures & Graphs
http://slidepdf.com/reader/full/pictures-graphs 26/28
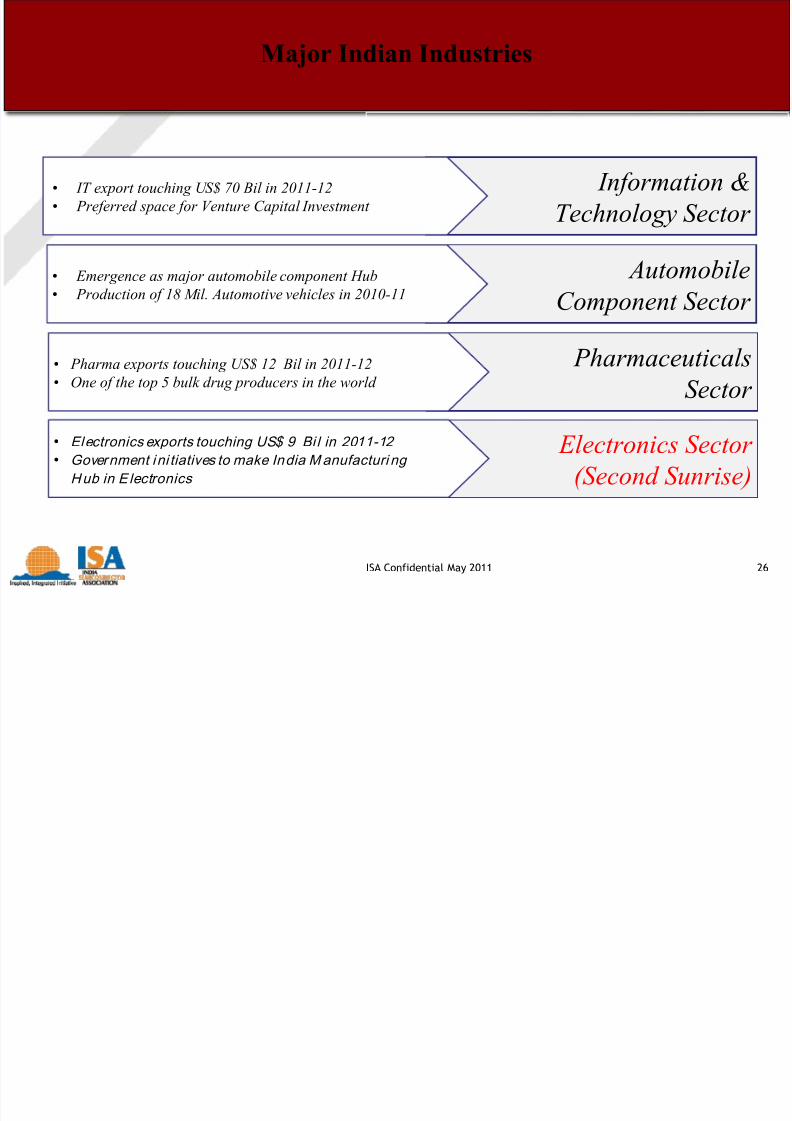
Major Indian Industries
ISA Confidential May 2011 26
Information &
Technology Sector • IT export touching US$ 70 Bil in 2011-12
• Preferred space for Venture Capital Investment
AutomobileComponent Sector •
Emergence as major automobile component Hub• Production of 18 Mil. Automotive vehicles in 2010-11
Pharmaceuticals
Sector • Pharma exports touching US$ 12 Bil in 2011-12
• One of the top 5 bulk drug producers in the world
Electronics Sector
(Second Sunrise)
• Electronics exports touching US$ 9 Bi l in 2011-12
• Government ini tiatives to make India Manufacturi ng
Hub in E lectronics
7/21/2019 Pictures & Graphs
http://slidepdf.com/reader/full/pictures-graphs 27/28
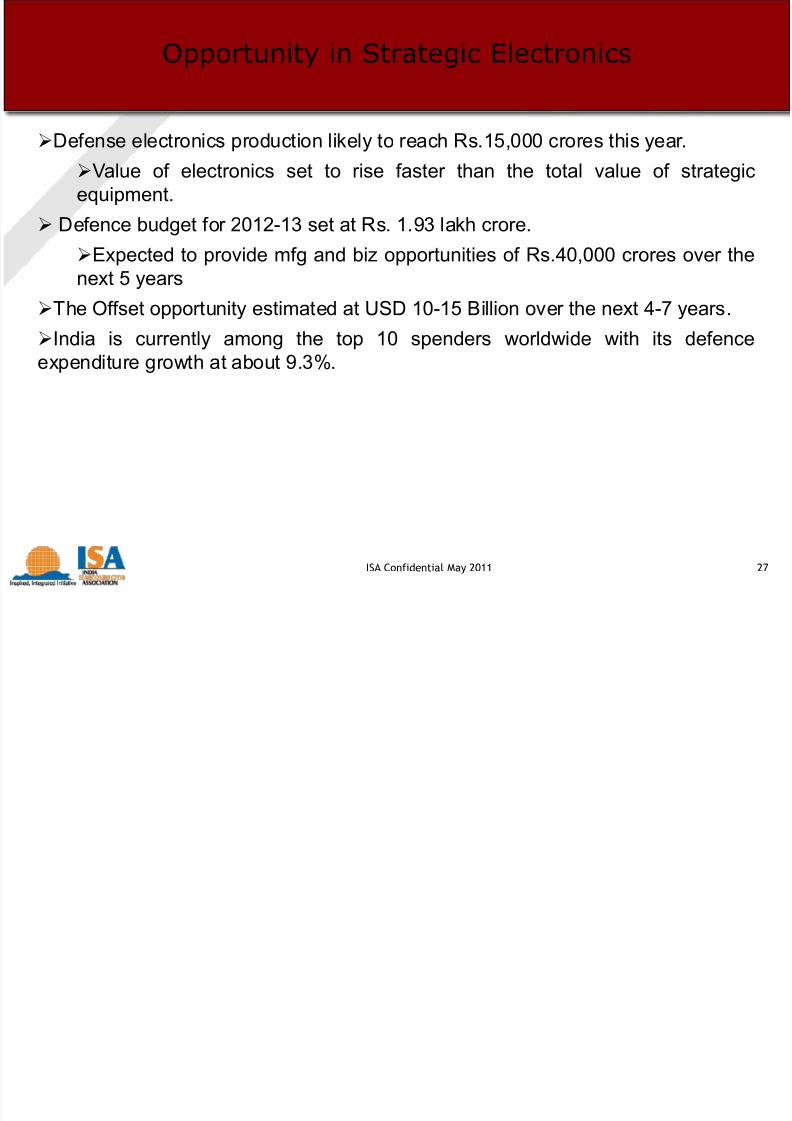
Opportunity in Strategic Electronics
ISA Confidential May 2011 27
Defense electronics production likely to reach Rs.15,000 crores this year.Value of electronics set to rise faster than the total value of strategicequipment.
Defence budget for 2012-13 set at Rs. 1.93 lakh crore.
Expected to provide mfg and biz opportunities of Rs.40,000 crores over the
next 5 yearsThe Offset opportunity estimated at USD 10-15 Billion over the next 4-7 years.
India is currently among the top 10 spenders worldwide with its defenceexpenditure growth at about 9.3%.

7/21/2019 Pictures & Graphs
http://slidepdf.com/reader/full/pictures-graphs 28/28
For More information
www.isaonline.org
[email protected]@isaonline.org


