23
White Paper March 2009 Picturing performance: IBM Cognos dashboards and scorecards
White PaperMarch 2009
Picturing performance: IBM Cognos dashboards and scorecards
Picturing performance: IBM Cognos dashboards and scorecards2
Contents
5 Business problems
5 Business drivers
8 The solution Dashboarding and scorecarding
with IBM
Dashboards, scorecards, and performance management
Software, services and best practices
Five things to consider
23 Conclusion Learn more
Abstract
Organizations are increasingly using dashboards to provide at-a-glance views
of current business performance and decision-making. But not all dashboards
are the same, so companies must be careful to adopt dashboard strategies that
provide each user group with information that is appropriate to their role, gets
updated on a schedule that meets their needs, and is shared consistently across
the entire enterprise. A series of disconnected dashboards is of no value, so IT
must accommodate these factors, and others, to ensure a successful dashboard
deployment.
Overview
In his TDWI Best Practices Report Deploying Dashboards and Scorecards (July
2006), Wayne Eckerson provides a helpful definition of an oft-misunderstood term:
“Dashboards and scorecards are multilayered performance management systems, built on a business intelligence and data integration infrastructure, that enable organizations to measure, monitor, and manage business activity using both financial and non-financial measures.”1
Dashboards and scorecards share three basic characteristics, or, what Eckerson
calls “The three threes.” These characteristics are: applications, layers, and types.
Let’s look at these in more detail:
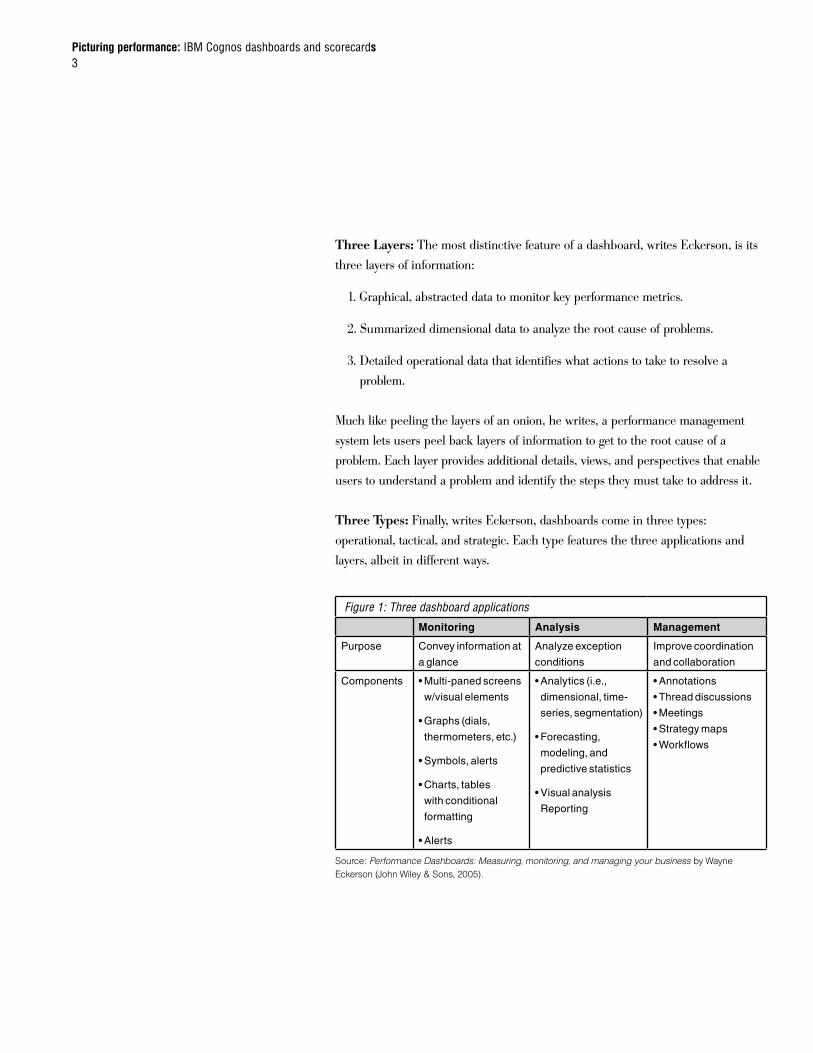
Three Applications: Every dashboard contains these three applications:
monitoring, analysis, and reporting, Eckerson writes. These sets of related
functionalities are woven together seamlessly and built on an information
infrastructure designed to fulfill user needs. (see Figure 1)
Picturing performance: IBM Cognos dashboards and scorecards3
Three Layers: The most distinctive feature of a dashboard, writes Eckerson, is its
three layers of information:
1. Graphical, abstracted data to monitor key performance metrics.
2. Summarized dimensional data to analyze the root cause of problems.
3. Detailed operational data that identifies what actions to take to resolve a
problem.
Much like peeling the layers of an onion, he writes, a performance management
system lets users peel back layers of information to get to the root cause of a
problem. Each layer provides additional details, views, and perspectives that enable
users to understand a problem and identify the steps they must take to address it.
Three Types: Finally, writes Eckerson, dashboards come in three types:
operational, tactical, and strategic. Each type features the three applications and
layers, albeit in different ways.
Figure 1: Three dashboard applications
Monitoring Analysis Management
Purpose Convey information at
a glance
Analyze exception
conditions
Improve coordination
and collaboration
Components • Multi-paned screens
w/visual elements
• Graphs (dials,
thermometers, etc.)
• Symbols, alerts
• Charts, tables
with conditional
formatting
• Alerts
• Analytics (i.e.,
dimensional, time-
series, segmentation)
• Forecasting,
modeling, and
predictive statistics
• Visual analysis
Reporting
• Annotations
• Thread discussions
• Meetings
• Strategy maps
• Workflows
Source: Performance Dashboards: Measuring, monitoring, and managing your business by Wayne Eckerson (John Wiley & Sons, 2005).
Operational dashboards track core operational processes and often display
real-time data. These dashboards emphasize monitoring more than analysis or
management.
Tactical dashboards track departmental processes and projects and emphasize
analysis more than monitoring or management. They are often implemented using
portals and run against data marts or data warehouses.
Strategic dashboards (or Scorecards) monitor the execution of corporate strategic
objectives at each level of the organization and emphasize management more
than monitoring or analysis. They are often implemented to support a Balanced
Scorecard methodology.
Any organization can and should deploy multiple versions of each type of
dashboard, writes Eckerson, as each employee is responsible for different aspects
of corporate performance. The critical aspect to remember is that companies build
each dashboard on a single data infrastructure and application platform to deliver
consistent information to every user.
Picturing performance: IBM Cognos dashboards and scorecards4
Why do you use a dashboard or scorecard?
For the same reason that car companies build cars with fuel gauges and
speedometers, companies deploy dashboards to give their employees an easy-to-
understand view of the numbers that matter most, so they can make decisions to
keep their businesses running smoothly and at peak performance.
In the automotive industry, dashboarding has always been a simple and necessary
component: low fuel = buy fuel; high speed = slow down or get speeding ticket.
In business, however, dashboards have repeatedly fallen in and out of favor,
their successes and failures as much attributable to immature technologies as to
uncertainties about the goals they were meant to achieve. To help you decide the
right dashboard deployment for you, let’s look further into Eckerson’s categories.
Picturing performance: IBM Cognos dashboards and scorecards5
Business problems
Business drivers
Operational dashboards: Focus on monitoring
Operational dashboards enable front-line workers and supervisors to track core
operational processes (see Figure 2). Monitoring is their key capability. These
dashboards provide operational managers and staff immediate visibility into KPI
performance, allowing them to make quick decisions or take corrective action as
soon as a problem or opportunity arises. Typically, operational dashboards also
generate alerts that notify users of exception conditions in the processes being
monitored.
Picturing performance: IBM Cognos dashboards and scorecards6
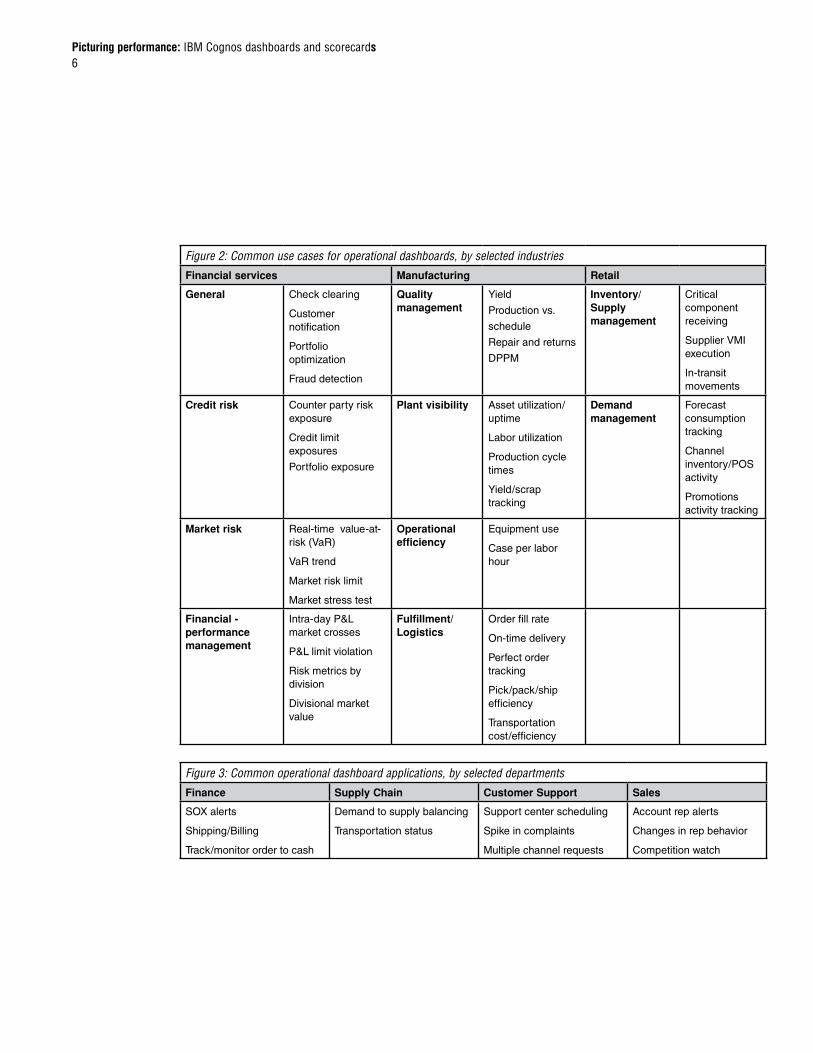
Figure 2: Common use cases for operational dashboards, by selected industries
Financial services Manufacturing Retail
General Check clearing
Customer notification
Portfolio optimization
Fraud detection
Quality management
Yield
Production vs.
schedule
Repair and returns
DPPM
Inventory/ Supply management
Critical component receiving
Supplier VMI execution
In-transit movements
Credit risk Counter party risk exposure
Credit limit exposures
Portfolio exposure
Plant visibility Asset utilization/ uptime
Labor utilization
Production cycle times
Yield/scrap tracking
Demand management
Forecast consumption tracking
Channel inventory/POS activity
Promotions activity tracking
Market risk Real-time value-at-risk (VaR)
VaR trend
Market risk limit
Market stress test
Operational efficiency
Equipment use
Case per labor hour
Financial -performance management
Intra-day P&L market crosses
P&L limit violation
Risk metrics by division
Divisional market value
Fulfillment/ Logistics
Order fill rate
On-time delivery
Perfect order tracking
Pick/pack/ship efficiency
Transportation cost/efficiency
Figure 3: Common operational dashboard applications, by selected departments
Finance Supply Chain Customer Support Sales
SOX alerts
Shipping/Billing
Track/monitor order to cash
Demand to supply balancing
Transportation status
Support center scheduling
Spike in complaints
Multiple channel requests
Account rep alerts
Changes in rep behavior
Competition watch
Picturing performance: IBM Cognos dashboards and scorecards7
Tactical Dashboards: Emphasis on analysis
Tactical dashboards help managers and analysts track and analyze departmental
activities, processes and projects. Analysis is their key strength. They display
at-a-glance results in a BI portal or professionally authored report format that
contains charts and tables that users need to monitor the projects or processes
for which they are accountable. Users can drill down or through the data using
multidimensional (OLAP) analysis and advanced reporting to pinpoint the causes
of trends or issues.
Scorecards: Managing strategy
Scorecards let executives and senior staff chart their progress against strategic
objectives. A Scorecard is a strategy management application that helps
organizations measure and align the strategic and tactical aspects of their
businesses, processes and individuals via goals and targets. Because of their role in
executive decision-making, Scorecards demand a more structured approach and
framework than operational and tactical dashboards and as such, often make use a
methodology such as The Balanced Scorecard, TQM, or Six Sigma.
Dashboard demos: Beware these “quickie” sins“Most dashboards that are used in business today fail, writes data visualization
educator and expert Stephen Few in his 2007 article, Why Most Dashboards Fail. “At
best they deliver only a fraction of the insight that is needed to monitor the business .
. .Beyond the hype and sizzle lives a unique and effective solution to a very real need
for information. This is the dashboard that deserves to live on your screen.”
In his report, Deploying Dashboards and Scorecards, Wayne Eckerson also warns
against what he calls “quickie” dashboards that may look good in a demo but quickly
reveal their limitations. These sins include being:
Too flat: limited drill-down capability or interactivity with source data.
Too manual: require intensive IT expertise and time to maintain and modify.
Too isolated: quickie dashboards constitute data silos that undermine a company’s
ability to create single view of performance across units, products, and customers.
Too inaccurate: merging data from disparate systems requires the combined
expertise of IT and business users. Don’t underestimate this task or assume
technology can easily solve it.
Too cool: attractive displays that are perceptually ineffective. Beware of 3-D look
and feel, chrome-plated gizmos, and so on. The dashboard must show the data
dimensions necessary to make a decision, clearly and accurately.
Picturing performance: IBM Cognos dashboards and scorecards8
IBM offers the full range of dashboards— operational, tactical, and strategic — to
help organizations monitor, measure, and manage their performance. IBM Cognos®
dashboards provide an at-a-glance view of all important operational, tactical, and
strategic information to meet the needs of the complete range of business users
within an organization. What’s more, you can pursue a dashboard deployment with
IBM knowing that the data, metrics, and thresholds are all integrated and share a
common data source.
For example: if a manufacturer bases its competitive strategy on providing higher-
quality goods, the CEO can monitor overall quality as easily as can the plant
managers and those on the assembly line or in the factory, with data feeding all
three kinds of dashboards simultaneously, with each user seeing the data at the
right level of granularity and refreshed at user-appropriate intervals.
The result of all this integration? Simple: business users at every level receive
precisely the information they need to make better decisions that improve business
performance. Let’s look at how IBM Cognos solutions address these issues.
IBM Cognos Now! operational dashboards
Delivered as a hardware appliance or through the software-as-a-service (SaaS)
model, IBM Cognos Now! operational dashboards provide continuous monitoring
for business operations. They enable operations managers and/or teams to
proactively respond to continually changing business conditions or processes with
patent-pending streaming technology that ensures continually up-to-date metrics.
The solution
Dashboarding and scorecarding with IBM
IBM Cognos Now! operational dashboards feature:
• Intra-day/hourupdates
• Continuousmonitoringofoperationalprocesses
• Self-servicecreatingandeditingcapabilities
• User-definedalerts
Picturing performance: IBM Cognos dashboards and scorecards9
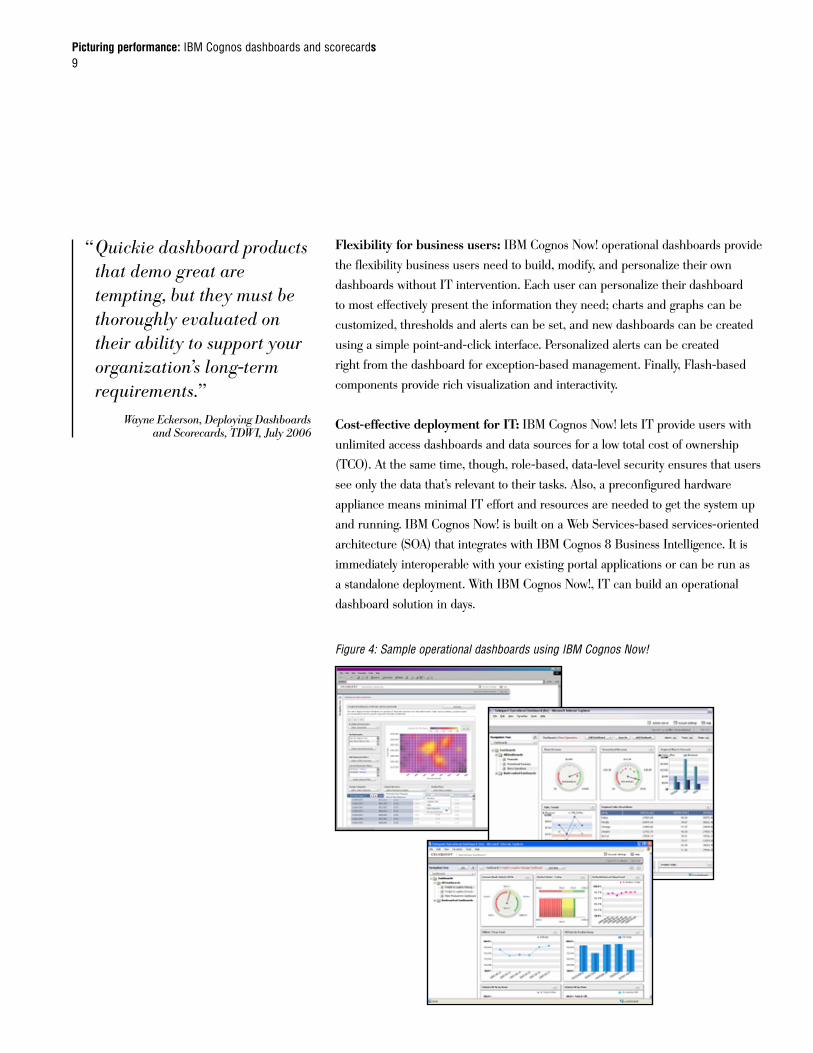
Flexibility for business users: IBM Cognos Now! operational dashboards provide
the flexibility business users need to build, modify, and personalize their own
dashboards without IT intervention. Each user can personalize their dashboard
to most effectively present the information they need; charts and graphs can be
customized, thresholds and alerts can be set, and new dashboards can be created
using a simple point-and-click interface. Personalized alerts can be created
right from the dashboard for exception-based management. Finally, Flash-based
components provide rich visualization and interactivity.
Cost-effective deployment for IT: IBM Cognos Now! lets IT provide users with
unlimited access dashboards and data sources for a low total cost of ownership
(TCO). At the same time, though, role-based, data-level security ensures that users
see only the data that’s relevant to their tasks. Also, a preconfigured hardware
appliance means minimal IT effort and resources are needed to get the system up
and running. IBM Cognos Now! is built on a Web Services-based services-oriented
architecture (SOA) that integrates with IBM Cognos 8 Business Intelligence. It is
immediately interoperable with your existing portal applications or can be run as
a standalone deployment. With IBM Cognos Now!, IT can build an operational
dashboard solution in days.
Figure 4: Sample operational dashboards using IBM Cognos Now!
“ Quickie dashboard products that demo great are tempting, but they must be thoroughly evaluated on their ability to support your organization’s long-term requirements.”
Wayne Eckerson, Deploying Dashboards
and Scorecards, TDWI, July 2006
Picturing performance: IBM Cognos dashboards and scorecards10
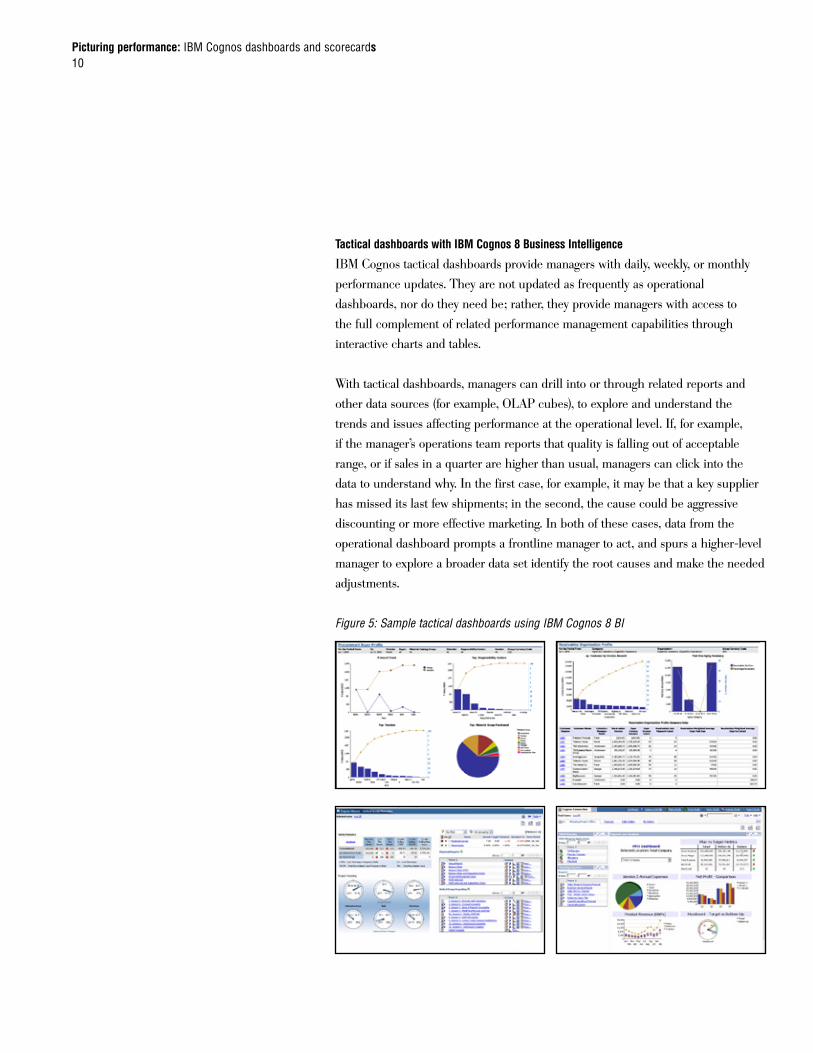
Tactical dashboards with IBM Cognos 8 Business Intelligence
IBM Cognos tactical dashboards provide managers with daily, weekly, or monthly
performance updates. They are not updated as frequently as operational
dashboards, nor do they need be; rather, they provide managers with access to
the full complement of related performance management capabilities through
interactive charts and tables.
With tactical dashboards, managers can drill into or through related reports and
other data sources (for example, OLAP cubes), to explore and understand the
trends and issues affecting performance at the operational level. If, for example,
if the manager’s operations team reports that quality is falling out of acceptable
range, or if sales in a quarter are higher than usual, managers can click into the
data to understand why. In the first case, for example, it may be that a key supplier
has missed its last few shipments; in the second, the cause could be aggressive
discounting or more effective marketing. In both of these cases, data from the
operational dashboard prompts a frontline manager to act, and spurs a higher-level
manager to explore a broader data set identify the root causes and make the needed
adjustments.
Figure 5: Sample tactical dashboards using IBM Cognos 8 BI
Picturing performance: IBM Cognos dashboards and scorecards11
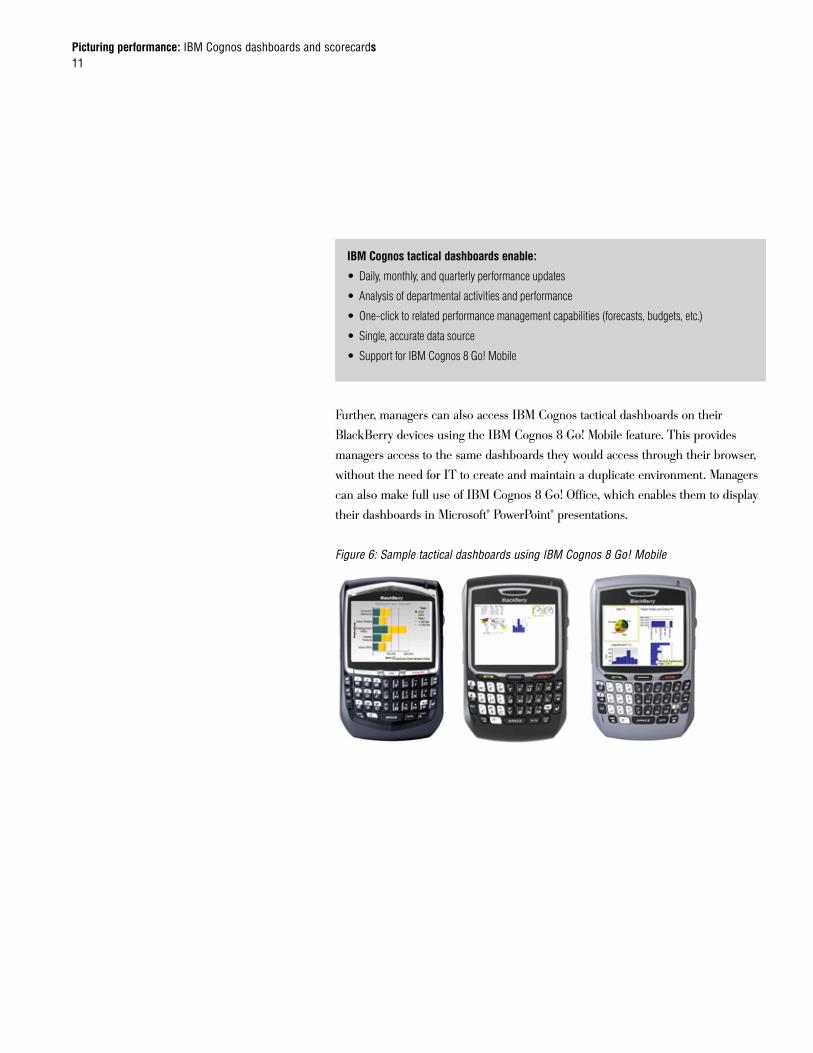
Further, managers can also access IBM Cognos tactical dashboards on their
BlackBerry devices using the IBM Cognos 8 Go! Mobile feature. This provides
managers access to the same dashboards they would access through their browser,
without the need for IT to create and maintain a duplicate environment. Managers
can also make full use of IBM Cognos 8 Go! Office, which enables them to display
their dashboards in Microsoft® PowerPoint® presentations.
Figure 6: Sample tactical dashboards using IBM Cognos 8 Go! Mobile
IBM Cognos tactical dashboards enable:
• Daily,monthly,andquarterlyperformanceupdates
• Analysisofdepartmentalactivitiesandperformance
• One-clicktorelatedperformancemanagementcapabilities(forecasts,budgets,etc.)
• Single,accuratedatasource
• SupportforIBMCognos8Go!Mobile
Picturing performance: IBM Cognos dashboards and scorecards12
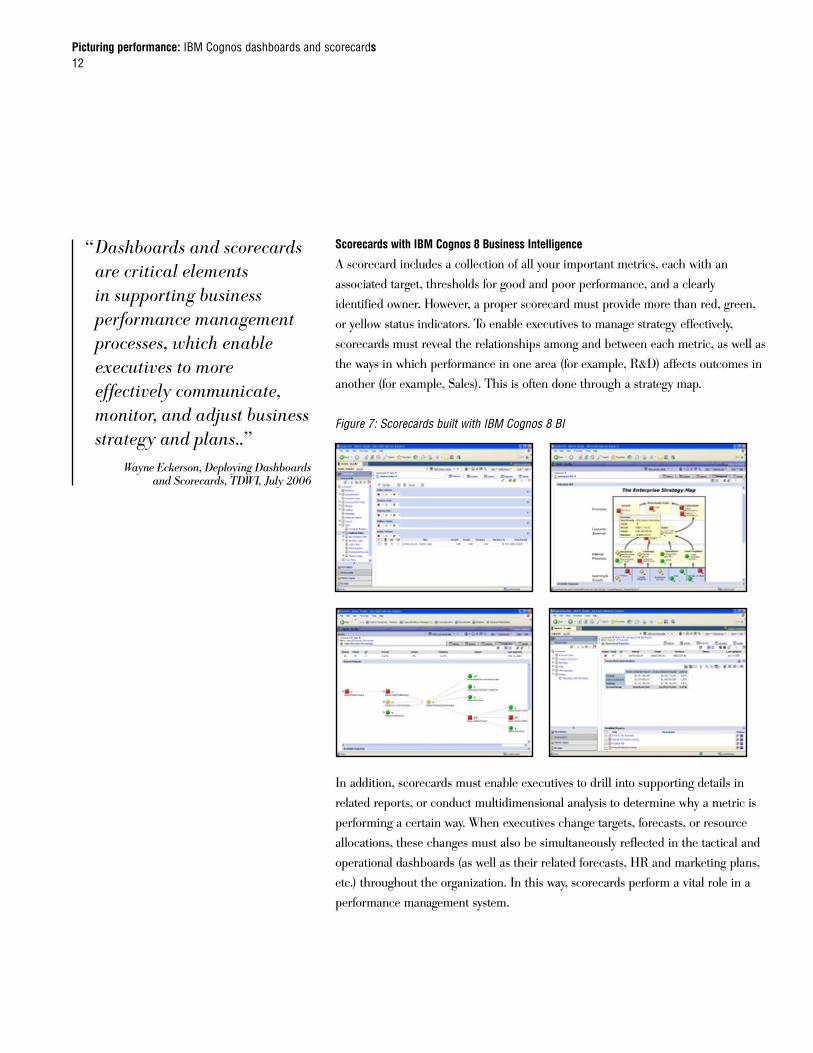
Scorecards with IBM Cognos 8 Business Intelligence
A scorecard includes a collection of all your important metrics, each with an
associated target, thresholds for good and poor performance, and a clearly
identified owner. However, a proper scorecard must provide more than red, green,
or yellow status indicators. To enable executives to manage strategy effectively,
scorecards must reveal the relationships among and between each metric, as well as
the ways in which performance in one area (for example, R&D) affects outcomes in
another (for example, Sales). This is often done through a strategy map.
Figure 7: Scorecards built with IBM Cognos 8 BI
In addition, scorecards must enable executives to drill into supporting details in
related reports, or conduct multidimensional analysis to determine why a metric is
performing a certain way. When executives change targets, forecasts, or resource
allocations, these changes must also be simultaneously reflected in the tactical and
operational dashboards (as well as their related forecasts, HR and marketing plans,
etc.) throughout the organization. In this way, scorecards perform a vital role in a
performance management system.
“ Dashboards and scorecards are critical elements in supporting business performance management processes, which enable executives to more effectively communicate, monitor, and adjust business strategy and plans..”
Wayne Eckerson, Deploying Dashboards
and Scorecards, TDWI, July 2006
Picturing performance: IBM Cognos dashboards and scorecards13
Dashboards provide such critical information in a single display (often a single
computer screen). Therein lies their appeal, and the reason why companies
often deploy them as a “front door” to their performance management initiatives.
A successful performance management solution, however, comprises other
management functions—analysis, reporting, budgeting, forecasting, decision-
making — operating as part of a dynamic, fluid and integrated whole. Therein lies
the value of the IBM Cognos solution.
The value and components of a full PM system offered by IBM
Many factors influence your company’s performance. But few areas under your
management are more important than your organization’s decision-making ability.
Getting answers and acting on them means integrating reporting and analysis,
planning, and measuring and monitoring — across your organization. This
integrated approach is the IBM Cognos performance management system.
By integrating information, technology, and people, your decision-makers can
become performance managers. Performance managers look at metrics, plans, and
reports in their functional area to make the best possible decisions. They also use
this same approach to connect with others. For example, if Marketing decisions
improve demand, then Sales and Operations needs to know to ensure the supply is
ready. In this way, your good decisions cause other good decisions. The end result is
better alignment, accountability, and performance.
Dashboards, scorecards, and performance
management
IBM Cognos scorecards enable:
• Monthlyandquarterlyperformanceupdates
• Performanceagainstpre-settargetsandthresholds
• One-clicktorelatedperformancemanagementcapabilities(forecasts,budgets,etc.)
• Strategymaps&impactdiagrams
Picturing performance: IBM Cognos dashboards and scorecards14
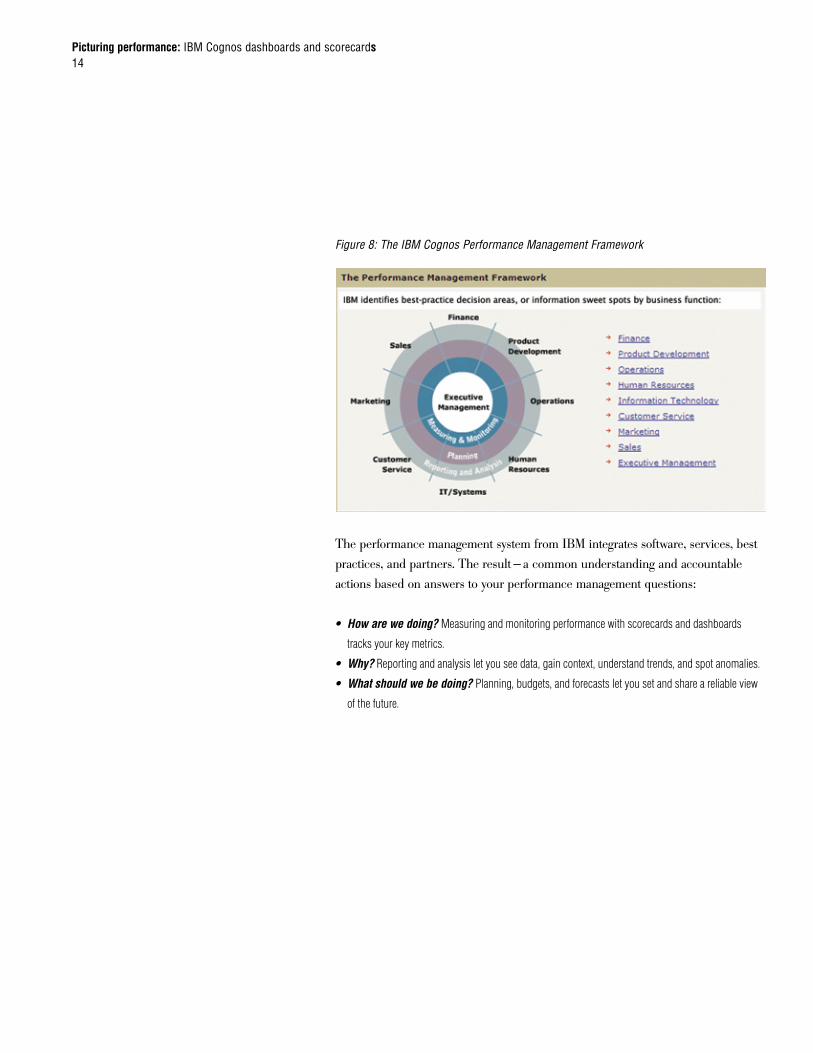
Figure 8: The IBM Cognos Performance Management Framework
The performance management system from IBM integrates software, services, best
practices, and partners. The result —a common understanding and accountable
actions based on answers to your performance management questions:
• Howarewedoing?Measuringandmonitoringperformancewithscorecardsanddashboards
tracksyourkeymetrics.
• Why?Reportingandanalysisletyouseedata,gaincontext,understandtrends,andspotanomalies.
• Whatshouldwebedoing?Planning,budgets,andforecastsletyousetandshareareliableview
ofthefuture.
Picturing performance: IBM Cognos dashboards and scorecards15
Software for performance management
IBM provides an integrated performance management software platform— reporting
and analysis, planning, or measuring and monitoring — for any area of your
organization. Our software capabilities include:
Reporting and analysis
Integrated reporting and analysis software delivers user-friendly information from
all of your data sources so you can:
• Aligntheorganizationwithashared,singleversionofthetruth.
• Placeinformationincontext,findtrends,andspotvariations,risks,andopportunities.
• Understandthewhy?behindyourresultsandtrends
Planning and consolidation
Finance and other department managers with cost or revenue generation
responsibilities use integrated planning, budgeting, and forecasting software to:
• Createplansandbudgetsthatconnect,unlikespreadsheet-basedsystems.
• Adaptplansorganization-wideasbusinessconditionschange.
• EngagedepartmentsoutsideofFinanceintheplanningprocessforgreateraccuracyandbuy-in.
Measuring and monitoring
Integrated software for scorecards, dashboards, and financial consolidation draws
on information from all of your data sources so you can:
• Measurehowyouperformagainsttargetsandholdpeopleaccountableforthem.
• Seetrendsandchangesinoperationalandfinancialmetrics.
• ComplywithregulationssuchasIFRSandSarbanes-Oxley.
Software, services and best practices
Picturing performance: IBM Cognos dashboards and scorecards16
IBM Cognos Software Services: Consulting, education and support
Software is only part of a performance management solution. Many dashboard
projects fail if companies fail to understand what they want the dashboards to do.
This is where companies can benefit from a strong team of consultants to bridge
the gap between the IT and business user.
IBM Cognos Software Services brings the full range of our personnel, resources,
and expertise to your deployment to help you achieve the next level of performance.
Whether you are new to IBM Cognos solutions or a longtime customer, IBM
Cognos education and consulting services has the resources and a proven, results-
based methodology to help you ensure successful deployment.
IBM Cognos Software Services can:
• Buildabest-practices-baseddeploymentthroughourIBMCognosSolutionsImplementation
Methodology(SIM).
• BuildyourorganizationalknowledgeandinternalcapacitytousetheIBMCognossolution.
• Expandyourdeploymentwithnewcapabilitiesoranexpandeduserbase.
• Providesolutionsandresolveissuesquicklywithouraward-winningonlinesupport.
• DesignanddeployaBusinessIntelligenceCompetencyCenter(BICC).
• Accelerateyourdeploymentandpromoteuseradoption.
Picturing performance: IBM Cognos dashboards and scorecards17
Best practices for performance management: Accelerate your return and value
Adapting industry best practices for your organization delivers
more value, faster for your performance management system.
IBM offers several best practices sources for prospects and
customers, including:
The Performance Manager decision areas: Based on
extensive and wide-ranging research of the most successful
performance management deployments, IBM has identified 42 information sweet
spots, or decision areas, where applying reports, metrics, and plans can make a
tremendous difference to your organization’s performance.
IBM Cognos Innovation Center for Performance Management: The IBM
Cognos Innovation Center brings together technology experts, finance professionals,
and industry thought leaders to share techniques, technologies and best practices in
performance management. Its resources include:
• IBMCognosPerformanceBlueprints:pre-defineddata,processandpolicymodelsthathelporgani-
zationsspeedtheirsoftwaredeploymentsanddrivefasterROI.Organizedbyindustryandfunction.
• Resources&publications:On-demandWebseminars,whitepapers,exclusiveroundtablediscussion
events,andnewsletters.
Picturing performance: IBM Cognos dashboards and scorecards18
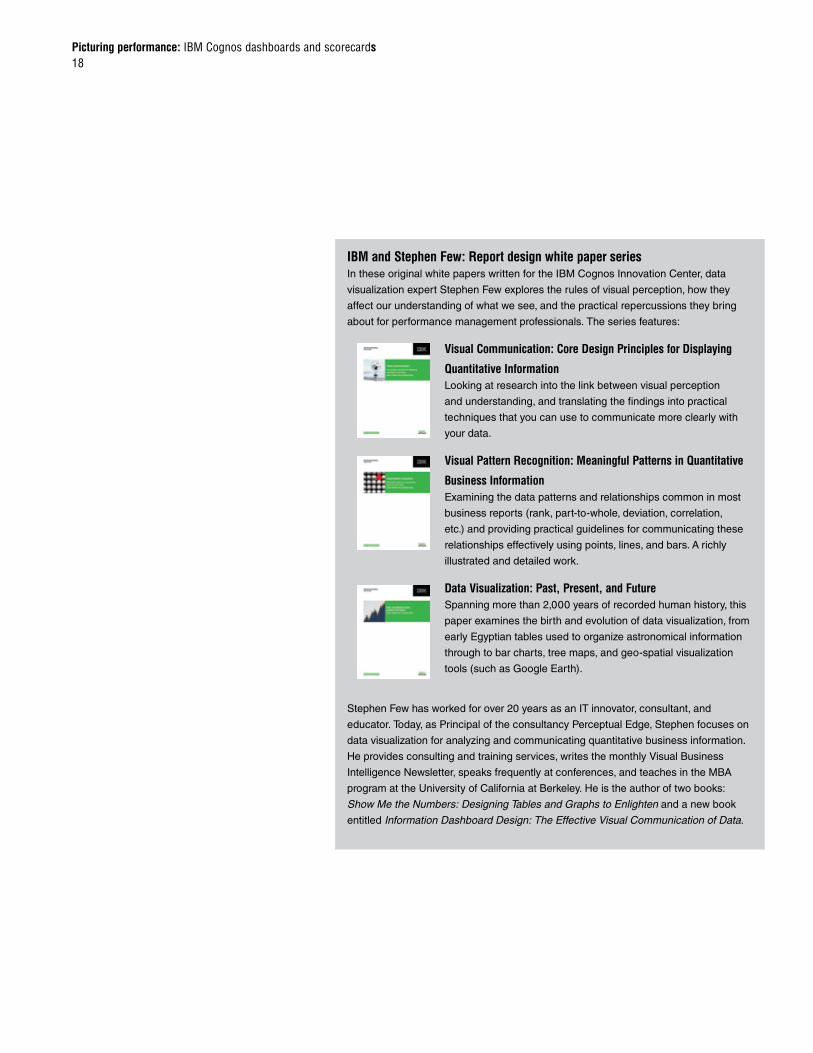
IBM and Stephen Few: Report design white paper seriesIn these original white papers written for the IBM Cognos Innovation Center, data
visualization expert Stephen Few explores the rules of visual perception, how they
affect our understanding of what we see, and the practical repercussions they bring
about for performance management professionals. The series features:
Visual Communication: Core Design Principles for Displaying
Quantitative InformationLooking at research into the link between visual perception
and understanding, and translating the findings into practical
techniques that you can use to communicate more clearly with
your data.
Visual Pattern Recognition: Meaningful Patterns in Quantitative
Business InformationExamining the data patterns and relationships common in most
business reports (rank, part-to-whole, deviation, correlation,
etc.) and providing practical guidelines for communicating these
relationships effectively using points, lines, and bars. A richly
illustrated and detailed work.
Data Visualization: Past, Present, and FutureSpanning more than 2,000 years of recorded human history, this
paper examines the birth and evolution of data visualization, from
early Egyptian tables used to organize astronomical information
through to bar charts, tree maps, and geo-spatial visualization
tools (such as Google Earth).
Stephen Few has worked for over 20 years as an IT innovator, consultant, and
educator. Today, as Principal of the consultancy Perceptual Edge, Stephen focuses on
data visualization for analyzing and communicating quantitative business information.
He provides consulting and training services, writes the monthly Visual Business
Intelligence Newsletter, speaks frequently at conferences, and teaches in the MBA
program at the University of California at Berkeley. He is the author of two books:
Show Me the Numbers: Designing Tables and Graphs to Enlighten and a new book
entitled Information Dashboard Design: The Effective Visual Communication of Data.
Picturing performance: IBM Cognos dashboards and scorecards19
IBM Cognos TechTalk & TechTalk Insider
For customers, our TechTalk Insider portal delivers valuable, practical insights from
IBM Cognos experts through a full library of Proven Practice documents as well as
live and archived Customer Information Series Web seminars.
If you’re still evaluating IBM Cognos solutions, you can access a rich store of
archived, on-demand Web seminars and product demos, as well as attend live
events to hear directly from successful IBM Cognos customers, partners, and
product experts.
Powered by IBM Cognos Software and other partner opportunities
“Powered by IBM Cognos Software” partners offer performance management
solutions that combine IBM Cognos technology with their deep domain expertise.
Get solutions using IBM Cognos technologies and focused on key business areas
and/or industries. The result: faster, predictable results for you.
Our broad range of partnerships help you purchase, deploy, and service your
business intelligence and performance management requirements.
‘Powered by IBM Cognos Software’ partners have extensive expertise in
industries including:
• Banking&Insurance •Higher&K-12Education
• HealthCare&LifeSciences •Retail&Wholesale
• Manufacturing •Travel&Hospitality
• Federal&CivilianGovernments •Oil&Gas
Eckerson concludes his paper with five key considerations for IT teams to apply to
their dashboarding initiatives. Let’s look at how IBM Cognos solutions meet these
considerations:
1. You get what you pay for: You can deploy an inexpensive dashboard today,
writes Eckerson; however, you will eventually need to replace them as word
spreads about the success of your solution and you need to scale it up without
compromising performance and response times.
The IBM Cognos view: IBM offers dashboards that feature both low total cost of
ownership (TCO) and scalability to large user and data volumes. IBM Cognos Now!
includes a license for unlimited users, data sources, and dashboards per appliance.
You can deploy a single, integrated operational dashboard quickly, with minimal
ongoing maintenance. Tactical and strategic dashboards are built using IBM Cognos
8 BI, enterprise software proven to scale to the largest and most complex IT
infrastructures.
2. Plan for the long haul: Word about successful dashboard solutions spreads like
wildfire. If you’ve delivered a successful solution, you’ll be bombarded with requests
to deliver them to other departments. The number of users may grow rapidly,
placing undue burden on your IT infrastructure. If you’re not careful, response
times will plummet, along with your reputation.
The IBM Cognos view: All IBM Cognos dashboards are proven to scale to
thousands of users accessing large and constantly changing data stores. IBM
Cognos Now! streams operational data from disparate sources into a patent-
pending 64-bit memory-based streaming data flow engine that caches data and
analytical information in memory, ensuring uniform query response times as
more users are added. Tactical and strategic dashboards are built using IBM
Cognos 8 BI, enterprise software proven to scale to the largest and most complex
IT infrastructures. Further, IBM Cognos Software Services can help you plan your
dashboard deployment in a way that ensures a smooth and gradual roll-out to your
user base.
Picturing performance: IBM Cognos dashboards and scorecards20
Five things to consider
Picturing performance: IBM Cognos dashboards and scorecards21
3. Plan for real time: A performance management system populated with more
timely data lets executives and managers proactively optimize performance. So
even if your users don’t ask for more than daily updates, be prepared to deliver
them. Select dashboard solutions that support event-driven processing and can
prove their scalability across users, sources, and data volumes.
The IBM Cognos view: IBM Cognos Now! features an event-driven architecture
that enables a continuous stream of business data, providing fresh views of key
metrics for constant measuring and monitoring of business operations. The 64-
bit, patent-pending data streaming engine consistently delivers information in a
few seconds, regardless of query volume or number of users.
4. Develop on a single platform: It’s very easy for managers to build or buy their
own solutions independent of each other. These dashboard silos eventually
compete with each other for resources, and undermine an organization’s ability
to get a single picture of performance.
The IBM Cognos view: Building dashboards with IBM means drawing data
from a centralized, integrated and secure data source that everyone can use and
trust. Regardless of the type of dashboard or the capability in use (drilling down,
analysis, IBM Cognos 8 Go! Mobile, etc.), all functions are performed against this
store, ensuring consistent results across divisions and departments. Further, IBM
now offers data quality software from Informatica, further strengthening IT’s
ability to provide consistently clean, accurate data.
5. Develop effective metrics: Among the many best practices in this area,
Eckerson advises companies to avoid cluttering dashboards with more metrics
than a user can understand or act on. If you have more than seven, writes
Eckerson, you should create hierarchies using folders, tabs, or drill-downs to
preserve the clarity and simplicity of the display.
Picturing performance: IBM Cognos dashboards and scorecards22
The IBM Cognos view: In the new business book, The Performance Manager,
IBM identifies 42 “sweet spots” of information— key decision areas— in core
business functions such as Sales, Marketing, Finance, and Customer Service.
Based on extensive research of the most successful performance management
deployments to-date, the book outlines the key metrics that managers need to
monitor on their dashboards. In addition, IBM Cognos dashboards provide the
flexibility users need to build the hierarchy system that Eckerson recommends.
Finally, the IBM Cognos Innovation Center for Performance Management
provides a wealth of best practices expertise, IBM Cognos Performance
Blueprints, and professional development opportunities with a host of world
renowned experts in performance management who can help you design and
deploy the metrics you need to monitor most.
Conclusion
High-performing organizations need information that will improve their decision-
making in a way that drives better performance. And more often than not, they
need it in an easy-to-understand, at-a-glance format that leads them to making
those decisions. Increasingly, this format is the dashboard.
However, not all dashboards are created equal; nor are all dashboards the same.
Companies pursuing a dashboard strategy must ensure that each user receives
information that is specific to their role and task, and that is refreshed according to
the frequency of their decisions. Operational managers need information that moves
as quickly as they receive orders from their Web site. Executives, on the other hand,
may only need to see updated results every month.
Dashboards must be easy to use, provide the right level of interactivity, and enable
users to drill down into the results. Also, the dashboards must be integrated across
the organization and share a common data source. Finally — and most important —
dashboards must deployed within the context of a performance management
strategy, with metrics, thresholds, and targets all tied to commonly understood
and shared business goals. To build a successful dashboard deployment, IT must
take into account these and many other considerations in their user base. In a
performance management system, disconnected dashboards that do none of the
above are of little value to anyone.
About IBM Cognos BI and Performance Management
IBM Cognos business intelligence (BI) and performance management solutions
deliver world-leading enterprise planning, consolidation and BI software, support and
services to help companies plan, understand and manage financial and operational
performance. IBM Cognos solutions bring together technology, analytical applications,
best practices, and a broad network of partners to give customers an open, adaptive
and complete performance solution. Over 23,000 customers in more than 135
countries around the world choose IBM Cognos solutions.
For further information or to reach a representative: www.ibm.com/cognos
Request a call
To request a call or to ask a question, go to www.ibm.com/cognos/contactus. An
IBM Cognos representative will respond to your enquiry within two business days.
© Copyright IBM Corporation 2009
IBM Canada 3755 Riverside Drive Ottawa, ON, Canada K1G 4K9
Produced in Canada March 2009 All Rights Reserved.
IBM, the IBM logo and ibm.com are trademarks or registered trademarks of International Business Machines Corporation in the United States, other countries, or both. If these and other IBM trademarked terms are marked on their first occurrence in this information with a trademark symbol (® or ™), these symbols indicate U.S. registered or common law trademarks owned by IBM at the time this information was published. Such trademarks may also be registered or common law trademarks in other countries. A current list of IBM trademarks is available on the Web at “Copyright and trademark infor-mation” at www.ibm.com/legal/copytrade.shtml.
Microsoft, Windows, Windows NT, and the Windows logo are trademarks of Microsoft Corporation in the United States, other countries, or both.
References in this publication to IBM products or services do not imply that IBM intends to make them available in all countries in which IBM operates.
Any reference in this information to non-IBM Web sites are provided for convenience only and do not in any manner serve as an endorsement of those Web sites. The materials at those Web sites are not part of the materials for this IBM product and use of those Web sites is at your own risk.
Endnotes
1 Wayne W. Eckerson, Deploying Dashboards and Scorecards, TDWI Best Practices Report, July 2006.
IMW14170CAEN


