23
BITS Pilani Pilani Campus Traffic Flow Modelling on Delhi-Gurgaon Expressway Balaji Ponnu, Ravikiran Puvvala and Shriniwas Arkatkar
BITS PilaniPilani Campus
Traffic Flow Modelling on Delhi-Gurgaon Expressway
Balaji Ponnu, Ravikiran Puvvala and Shriniwas Arkatkar

BITS Pilani, Pilani Campus
Objective
• To study the nature of traffic flow on a 8-lane divided urban expressway – The Delhi Gurgaon Expressway
• The objective is achieved through studying the temporal variations in parameters such as Flow, Speeds and Occupancies and studying the fundamental relationships
• The traffic flow at a point on the road has been simulated for further investigations

BITS Pilani, Pilani Campus
Background
• Urban Expressways in India have been relatively unexplored in spite of their differences in geometry, driving speeds and traffic composition from other type of roads
• Many of these roads exist: Delhi-Gurgaon and Western Express Highways in Mumbai and more are being built: Yamuna and Kundli-Manesar-Palwal Expressways
• Hence understanding the nature of traffic in these facilities assumes high importance

BITS Pilani, Pilani Campus
Delhi Gurgaon Expressway
Deserves a special attention due to a) The car composition being about 70-75% b) 2-wheeler composition of the order of 20-25% c)With higher driving speeds and partial access control d)With a higher degree of lane-discipline than other type of Indian roads

BITS Pilani, Pilani Campus
Study Location on the Expressway
Towards Gurgaon Towards Delhi

BITS Pilani, Pilani Campus
Observed Traffic Characteristics
Vehicle
Type
Compo
sition
(%)
Free-flow speeds,
km/h
Vehicle
Dimensions,
m
Lat. clear.
share, m
Max. Min. Mean SD Length Width Min. Max.
Car 70.80 103 78 90 4.00 4.4 1.75 0.40 0.60
Two-
wheeler
22.50 87 33 58 8.33 1.8 0.60 0.10 0.30
Three-
wheeler
3.30 63 38 50 4.00 2.6 1.4 0.30 0.40
Bus 2.20 93 64 79 5.00 10.3 2.5 0.40 0.60
LCV 0.70 80 63 73 3.33 5.0 1.9 0.40 0.60
Truck 0.50 69 48 60 4.00 7.5 2.5 0.40 0.60

BITS Pilani, Pilani Campus
A note on Area Occupancy
• Chunchu and Rao(2006) proposed the concept of Area Occupancy as a surrogate for density suited to Indian Traffic Conditions
• It takes into account the undercounting and over-counting issues caused due to parallel arrivals and lack of lane discipline in Indian traffic conditions respectively
• Does it by applying a non-lane, area-based correction factor to time occupancy

BITS Pilani, Pilani Campus
A note on Area Occupancy
• Arasan and Dhivya (2010) formulated
• They found that Area Occupancy is a surrogate for density for heterogeneous traffic and is not affected by detection zone length
• Has a great potential for being used in inductive loop detectors in Indian conditions
BITS Pilani, Pilani Campus
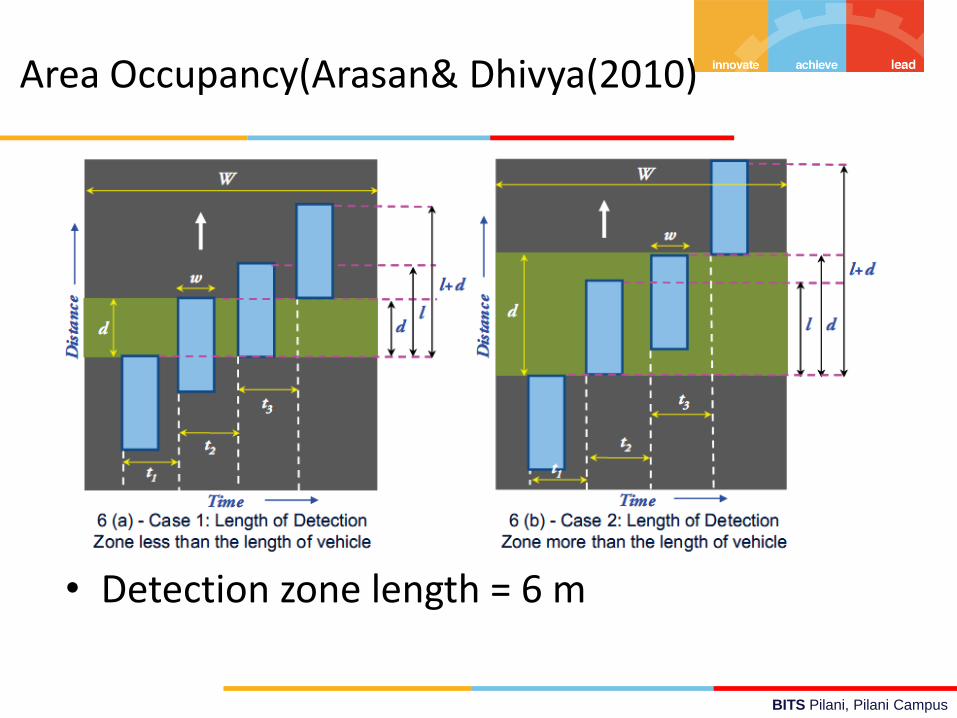
Area Occupancy(Arasan& Dhivya(2010)
• Detection zone length = 6 m

BITS Pilani, Pilani Campus
Acceleration Parameters Used (Singh, Ponnu and Arkatkar (2012))
Vehicle
Type
0-30 km/hr.
(m/s2)
30-60 km/hr.
(m/s2)
Above 60 km/hr.
(m/s2)
Car 2.15 1.80 1.10
Two-
wheeler
1.10 0.70 0.45
Three-
wheeler
0.80 0.30 0.25
Bus 1.40 1.00 0.45
LCV 1.30 0.80 0.55
Truck 1.00 0.62 0.46

BITS Pilani, Pilani Campus
Simulation Screenshots

BITS Pilani, Pilani Campus
Simulation Screenshots

BITS Pilani, Pilani Campus
Simulation Screenshots(Anand,Ramadurai and Vanajakshi(2012))

BITS Pilani, Pilani Campus
Simulation Screenshots(Anand,Ramadurai and Vanajakshi(2012))

BITS Pilani, Pilani Campus
Simulation Screenshots(Anand,Ramadurai and Vanajakshi(2012))

BITS Pilani, Pilani Campus
Temporal Validation
0%
1%
2%
3%
4%
5%
6%
7%
8%
9%
16:12 16:48 17:24 18:00 18:36
Are
a O
ccu
pan
cy,
%
Time of the Day
Empirical Simulated
0
2000
4000
6000
8000
10000
12000
16:12 16:48 17:24 18:00 18:36
Flo
w, v
ph
Time of the Day
Empirical Simulated

BITS Pilani, Pilani Campus
Temporal Validation(contd..)
0
10
20
30
40
50
60
70
80
16:12 16:48 17:24 18:00 18:36
Spe
ed
, km
ph
Time of the Day
Empirical Simulated
BITS Pilani, Pilani Campus
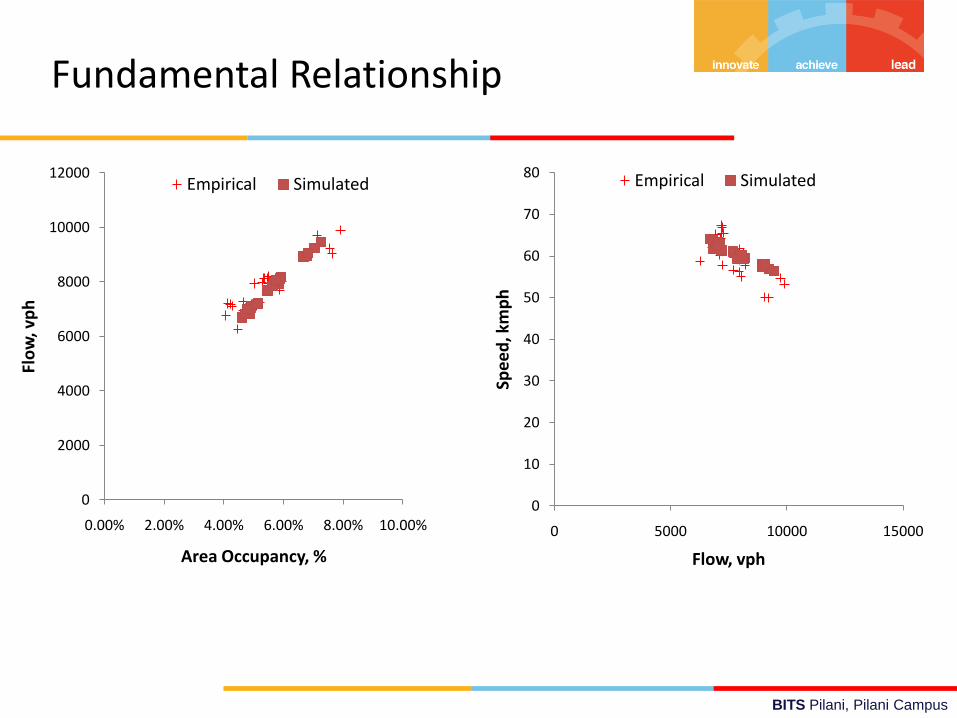
Fundamental Relationship
0
2000
4000
6000
8000
10000
12000
0.00% 2.00% 4.00% 6.00% 8.00% 10.00%
Flo
w, v
ph
Area Occupancy, %
Empirical Simulated
0
10
20
30
40
50
60
70
80
0 5000 10000 15000
Spe
ed
, km
ph
Flow, vph
Empirical Simulated

BITS Pilani, Pilani Campus
Fundamental Relationship(contd..)
0
10
20
30
40
50
60
70
80
0.00% 2.00% 4.00% 6.00% 8.00% 10.00%
Spe
ed
, km
ph
Area Occupancy, %
Empirical Simulated

BITS Pilani, Pilani Campus
t-test statistics and MAPE
Parameter D.O.F t-statistic t-critical MAPE
Flow 23 -2.050 ±2.074 3.87%
Speed 23 -0.401 ±2.074 4.88%
Area Occupancy 23 -0.975 ±2.074 10.18%
• H0: The samples are different• H1: The samples are not different
• Thus the null hypothesis can be rejected for all the three parameters

BITS Pilani, Pilani Campus
Future Scope
• As the field conditions have been simulated with statistical significance, the capacity of the facility can be estimated through simulation
• The driver behaviour parameters can be optimized using techniques such as genetic algorithm
• As the simulation model has been validated with reference to a point, it can be further extended to a segment of the facility

BITS Pilani, Pilani Campus
QUESTIONS?

BITS Pilani, Pilani Campus
THANK YOU


