Pile Setup in Cohesive Soil. I: Experimental InvestigationKam W. Ng, A.M.ASCE1; Matthew Roling2; Sherif S. AbdelSalam3;Muhannad T. Suleiman, M.ASCE4; and Sri Sritharan, M.ASCE5
Author keywords: Pile setup; Load tests; Cohesive soil; Coefficient of consolidation; Undrained shear strength; Standard penetration test(SPT) N-value.
Introduction
Many researchers and practitioners have recognized the increase inresistance (or capacity) of driven piles embedded in cohesive soilsover time, a phenomenon referred to as pile setup. Pile setup occursbecause of the healing of remolded cohesive soils, an increase inlateral stresses, and dissipation of pore-water pressure (Soderberg1962; Randolph et al. 1979). When accounted for accurately, theintegration of pile setup in the pile design process can lead to a morecost-effective design, because it reduces the number and length ofpiles. Unfortunately, experimental data combinedwith a dependablemethod to account for pile setup is rarely available.
Static or dynamic tests can be performed to evaluate pile setup;however, it is not feasible in practice to perform these tests over aperiod of time, as acknowledged by AASHTO (2010). Empiricalmethods to estimate pile setup have been proposed by several re-searchers, such as Pei and Wang (1986), Skov and Denver (1988),and Svinkin and Skov (2000). However, these methods have severalshortcomings. For instance, Pei and Wang’s (1986) method waspurely empirical, specifically developed for Shanghai Soil, and
lacked generalization in terms of soil properties. The methods ofSkov and Denver (1988) and Svinkin and Skov (2000) requiredsite-specific calibration of pile setup factors with restrike data,because the factors were not correlated with soil properties. Becauseof insufficient experimental data, these methods have not beensubstantially validated for accurate practical applications. For thesereasons, empirical methods to account for pile setup were not beenincluded as part of the AASHTO (2010) LRFD specifications.
To account for pile setup, the following information is needed forcommonly used foundation types: (1) sufficient and detailed dynamicand static field test data as a function of time for accurate setupevaluation; and (2) detailed subsurface investigations and monitoringof soil stresses to develop methods to quantify setup (Komurka et al.2003). A literature review by the authors concluded that publishedinformation on pile setup lacks detailed dynamic and static fieldtest data as a function of time for both small-displacement piles(i.e., H-piles and open-ended pipe piles) and large-displacement piles(closed-end pipe piles and precast concrete piles). In particular, qualitysetup data on small-displacement piles is relatively scarce according tothe published data of pile setup reported by Long et al. (1999) andKomurka et al. (2003). Furthermore, despite the fact that pile setup isinfluenced by properties of the soil surrounding the pile and pore-waterpressure, the necessary data to quantitatively describe the relationshipbetween pile setup, surrounding soil properties, and dissipation ofpore-water pressure is not available. If the influence of surroundingsoils on pile setup is significant, then the dependency of pile setup onsurrounding soil properties and pore-water pressure needs to bestudied. Given that a recent survey of more than 30 state DOTsconducted by AbdelSalam et al. (2010) revealed that the steel H-pile isthe most common foundation type used for bridges in the UnitedStates, the setup investigation reported herein focuses on this pile type.
Background
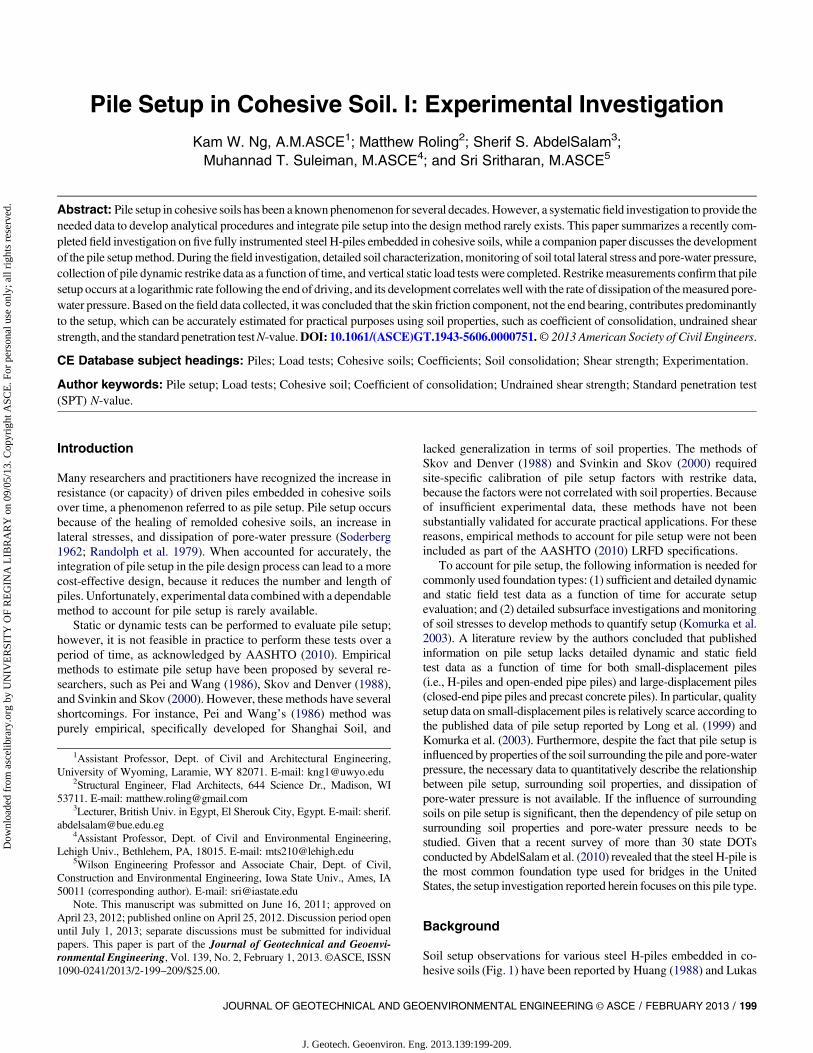
Soil setup observations for various steel H-piles embedded in co-hesive soils (Fig. 1) have been reported by Huang (1988) and Lukas
1Assistant Professor, Dept. of Civil and Architectural Engineering,University of Wyoming, Laramie, WY 82071. E-mail: [email protected]
3Lecturer, British Univ. in Egypt, El Sherouk City, Egypt. E-mail: [email protected]
4Assistant Professor, Dept. of Civil and Environmental Engineering,Lehigh Univ., Bethlehem, PA, 18015. E-mail: [email protected]
5Wilson Engineering Professor and Associate Chair, Dept. of Civil,Construction and Environmental Engineering, Iowa State Univ., Ames, IA50011 (corresponding author). E-mail: [email protected]
and Bushell (1989), and more recently by Long et al. (2002) andFellenius (2002). Fig. 1 summarizes the pile setup reported in theliterature for steel H-piles in terms of a resistance ratio defined asthe total pile resistance at any time after end of driving (EOD) (Rt)divided by the reference total pile resistance at EOD (REOD). Thetotal pile resistances (Rt) were determined either from a static loadtest or based on pile driving analyzer (PDA) measurements inconjunction with CAse Pile Wave Analysis Program (CAPWAP)analysis at different times of restrike. The reference pile resistancesat EOD (REOD) were based on CAPWAP analysis. For comparativepurposes, a predominant soil type along the pile shaft and aweightedaverage standard penetration test (SPT) N-value (Na) were de-termined for each data source. Fig. 1 shows that pile resistancesincrease immediately after EOD, with the rate of increase decreasingover time. The extent of the setup, however, varies between sites.Generally, it can be observed that piles embedded in a soil profilewith a relatively small Na value exhibited a higher resistance ratio(Rt=REOD), indicating a higher pile setup. However, the test pilereported by Lukas and Bushell (1989) exhibited a higher resistanceratio than that of Fellenius (2002), despite similarNa values for bothsites, confirming that setup is also influenced by other soil pa-rameters. Although the mechanisms of pile setup are related to theincrease in lateral stresses and dissipation of pore-water pressure,there were no consolidation test results, in situ lateral stresses, orpore-water pressure measurements reported by the authors. Rec-ognizing the difficulty in understanding pile setup based solely onthe data available in the literature, the current study focused oncollecting sufficient quality soil data for performing pile setup eval-uations, including SPT N-values, Piezocone penetration test (CPT)data, horizontal coefficient of consolidation (Ch), andAtterberg limits.
Field Investigation
Test Locations
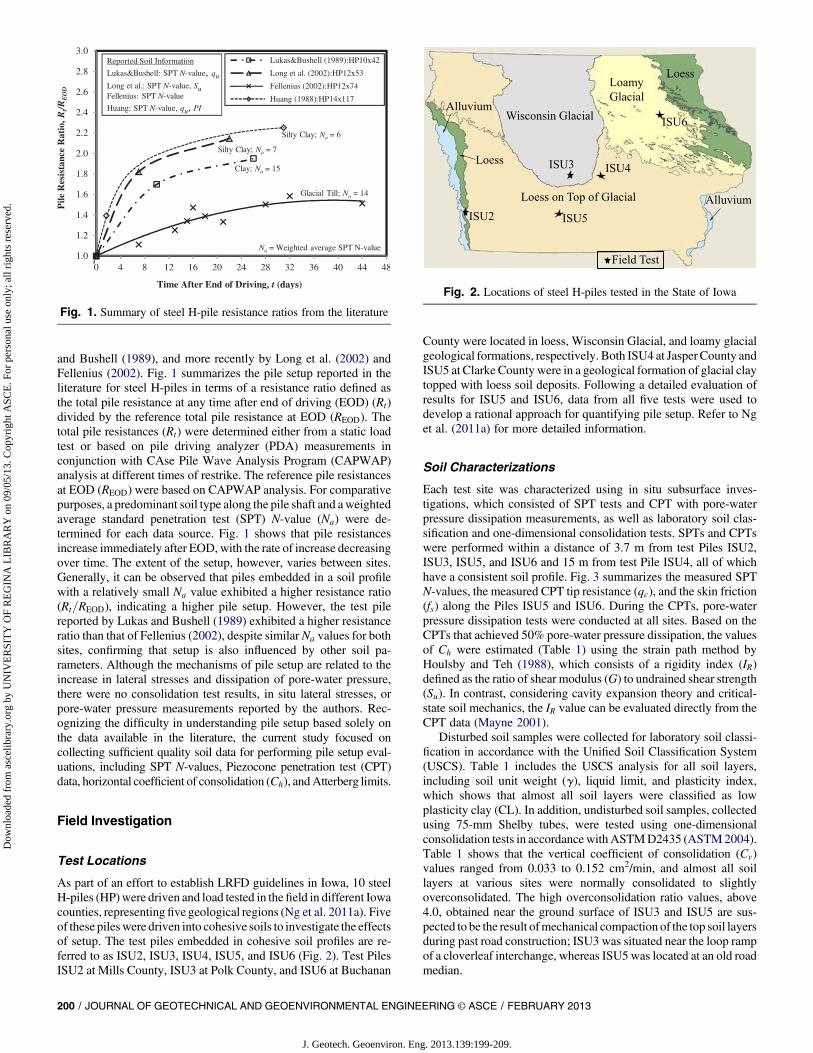
As part of an effort to establish LRFD guidelines in Iowa, 10 steelH-piles (HP)were driven and load tested in thefield in different Iowacounties, representingfive geological regions (Ng et al. 2011a). Fiveof these pileswere driven into cohesive soils to investigate the effectsof setup. The test piles embedded in cohesive soil profiles are re-ferred to as ISU2, ISU3, ISU4, ISU5, and ISU6 (Fig. 2). Test PilesISU2 at Mills County, ISU3 at Polk County, and ISU6 at Buchanan
County were located in loess, Wisconsin Glacial, and loamy glacialgeological formations, respectively. Both ISU4 at Jasper County andISU5 at Clarke County were in a geological formation of glacial claytopped with loess soil deposits. Following a detailed evaluation ofresults for ISU5 and ISU6, data from all five tests were used todevelop a rational approach for quantifying pile setup. Refer to Nget al. (2011a) for more detailed information.
Soil Characterizations
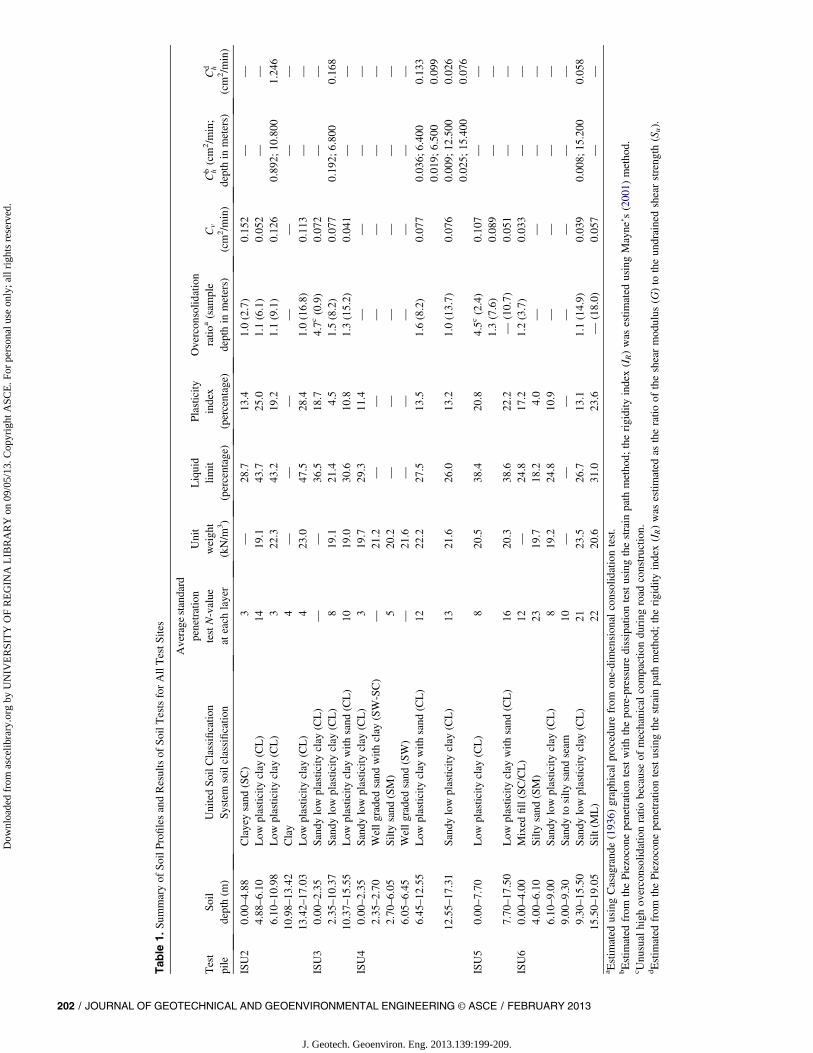
Each test site was characterized using in situ subsurface inves-tigations, which consisted of SPT tests and CPT with pore-waterpressure dissipation measurements, as well as laboratory soil clas-sification and one-dimensional consolidation tests. SPTs and CPTswere performed within a distance of 3.7 m from test Piles ISU2,ISU3, ISU5, and ISU6 and 15 m from test Pile ISU4, all of whichhave a consistent soil profile. Fig. 3 summarizes the measured SPTN-values, the measured CPT tip resistance (qc), and the skin friction(fs) along the Piles ISU5 and ISU6. During the CPTs, pore-waterpressure dissipation tests were conducted at all sites. Based on theCPTs that achieved 50% pore-water pressure dissipation, the valuesof Ch were estimated (Table 1) using the strain path method byHoulsby and Teh (1988), which consists of a rigidity index (IR)defined as the ratio of shear modulus (G) to undrained shear strength(Su). In contrast, considering cavity expansion theory and critical-state soil mechanics, the IR value can be evaluated directly from theCPT data (Mayne 2001).
Disturbed soil samples were collected for laboratory soil classi-fication in accordance with the Unified Soil Classification System(USCS). Table 1 includes the USCS analysis for all soil layers,including soil unit weight (g), liquid limit, and plasticity index,which shows that almost all soil layers were classified as lowplasticity clay (CL). In addition, undisturbed soil samples, collectedusing 75-mm Shelby tubes, were tested using one-dimensionalconsolidation tests in accordancewithASTMD2435 (ASTM2004).Table 1 shows that the vertical coefficient of consolidation (Cv)values ranged from 0.033 to 0.152 cm2/min, and almost all soillayers at various sites were normally consolidated to slightlyoverconsolidated. The high overconsolidation ratio values, above4.0, obtained near the ground surface of ISU3 and ISU5 are sus-pected to be the result ofmechanical compaction of the top soil layersduring past road construction; ISU3 was situated near the loop rampof a cloverleaf interchange, whereas ISU5 was located at an old roadmedian.
Fig. 1. Summary of steel H-pile resistance ratios from the literature
Fig. 2. Locations of steel H-piles tested in the State of Iowa
For ISU5, the 7.6-m thick top low plasticity clay (CL) layer withloess origin underlays a glacial till layer classified as low plasticityclay with sand (CL). The groundwater table (GWT) was locatedapproximately 11 m below the ground surface. The 7.6 m-thick lowplasticity top layer was found to have an average SPT N-value of 8overlaying sandy low plasticity clay with an average SPTN-value of16. The Cv values ranged from 0.051 to 0.107 cm2/min. For ISU6,which was situated in an outwash loamy glacial region, the soilprofile was divided into four layers, consisting of 4 m of a mixed fillof clayey sand and low plasticity clay (SC and CL, respectively)overlaying 2.1 m of silty sand (SM), 9.05 m of sandy low plasticityclay (CL) with a 0.35 m silty sand seam (SM), and approximately3.55 m of low plasticity silt (ML). The GWT was locatedapproximately 4.6 m below the ground surface. The SPT N-valuesranged from 8 to 23with the softest layer of sandy low plasticity clayat a depth of 6.1–8.95m. TheCh value at the 15.2-m depthwas 0.008cm2/min, and the Cv values ranged from 0.033 to 0.057 cm2/min.
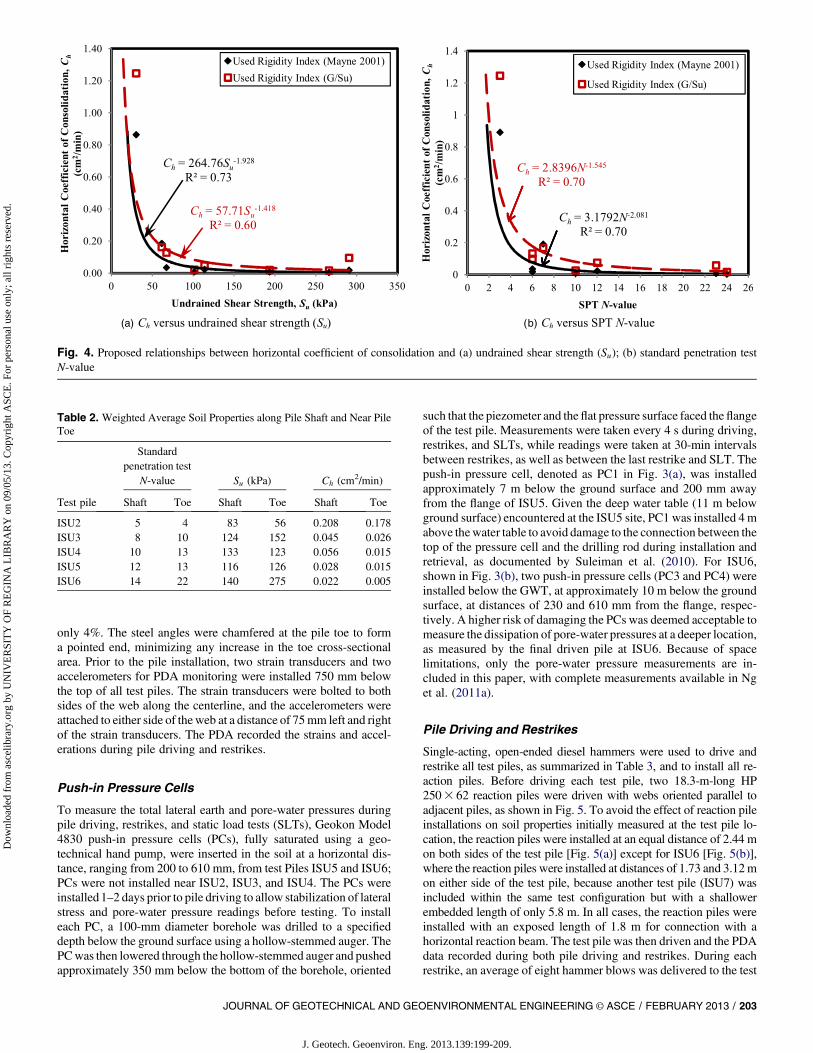
Because the Piezocone penetration dissipation test was notconducted for all soil layers at each site, because it requires an ex-cessively long waiting time to achieve 50% pore-water pressuredissipation during a CPT for a Ch estimation, the relationship be-tweenCh and Su was established in Fig. 4(a) based on the tests wherethis data were acquired. Many researchers, such as Long et al.(1999), reported that driven piles embedded in soft clays experiencemore setup than in stiff clays, as observed in Fig. 1 based on the SPTN-value. Because the qc value defined based on Su has a relationshipwith the SPT N-value, and the soil types were mostly CL soils witha relative small variation in mean grain size (Robertson et al. 1983),
a compatible relationship between Ch and the most commonlyused SPT N-value was established in Fig. 4(b). For estimatingconservative pile setup resistance, Mayne’s (2001) approach ofestimating the IR value, which yields a smallerCh, is recommended.Using this relationship, the Ch values were estimated for cohesivelayers where the dissipation test was not performed. As a result oflimited measured soil data, this relationship should be used withengineering judgment, especially for Su smaller than 50 kPa andan SPT N-value smaller than 5. Table 2 lists the weighted averageSPT N, Su, and Ch values along each pile shaft. These weightedaverage values were calculated by weighting the measured soilproperty for the cohesive soil layer by a layer-thickness-to-total-pile-length ratio for all cohesive layers located along the embeddedpile length.
Instrumentation
All HP 2503 62 test piles were instrumented with weldable vi-brating strain gauges in pairs on either side of the web along thecenterline of the embedded pile length, as shown in Fig. 3, with thelowest gauges installed within 150 mm of the toe. All strain gaugeswere covered with a black flexible rubber membrane and aluminumtape to protect them from welding sparks, heat, and moisture. Thestrain gauge cables were also wrapped with aluminum foil. Thegauges and cables were covered with 503 503 5 mm steel angleswelded to thewebs of the pile to prevent damage caused by direct soilcontact during pile installation. Despite the addition of the two steelangles, the shaft surface area in contact with the soil increased by
Fig. 3. Soil profiles, soil test results, and test pile instrumentation schematics for (a) ISU5; (b) ISU6
only 4%. The steel angles were chamfered at the pile toe to forma pointed end, minimizing any increase in the toe cross-sectionalarea. Prior to the pile installation, two strain transducers and twoaccelerometers for PDA monitoring were installed 750 mm belowthe top of all test piles. The strain transducers were bolted to bothsides of the web along the centerline, and the accelerometers wereattached to either side of theweb at a distance of 75mm left and rightof the strain transducers. The PDA recorded the strains and accel-erations during pile driving and restrikes.
Push-in Pressure Cells
To measure the total lateral earth and pore-water pressures duringpile driving, restrikes, and static load tests (SLTs), Geokon Model4830 push-in pressure cells (PCs), fully saturated using a geo-technical hand pump, were inserted in the soil at a horizontal dis-tance, ranging from 200 to 610 mm, from test Piles ISU5 and ISU6;PCs were not installed near ISU2, ISU3, and ISU4. The PCs wereinstalled1–2 days prior to pile driving to allow stabilization of lateralstress and pore-water pressure readings before testing. To installeach PC, a 100-mm diameter borehole was drilled to a specifieddepth below the ground surface using a hollow-stemmed auger. ThePCwas then lowered through the hollow-stemmed auger and pushedapproximately 350 mm below the bottom of the borehole, oriented
such that the piezometer and theflat pressure surface faced the flangeof the test pile. Measurements were taken every 4 s during driving,restrikes, and SLTs, while readings were taken at 30-min intervalsbetween restrikes, as well as between the last restrike and SLT. Thepush-in pressure cell, denoted as PC1 in Fig. 3(a), was installedapproximately 7 m below the ground surface and 200 mm awayfrom the flange of ISU5. Given the deep water table (11 m belowground surface) encountered at the ISU5 site, PC1 was installed 4mabove thewater table to avoid damage to the connection between thetop of the pressure cell and the drilling rod during installation andretrieval, as documented by Suleiman et al. (2010). For ISU6,shown in Fig. 3(b), two push-in pressure cells (PC3 and PC4) wereinstalled below the GWT, at approximately 10 m below the groundsurface, at distances of 230 and 610 mm from the flange, respec-tively. A higher risk of damaging the PCs was deemed acceptable tomeasure the dissipation of pore-water pressures at a deeper location,as measured by the final driven pile at ISU6. Because of spacelimitations, only the pore-water pressure measurements are in-cluded in this paper, with complete measurements available in Nget al. (2011a).
Pile Driving and Restrikes
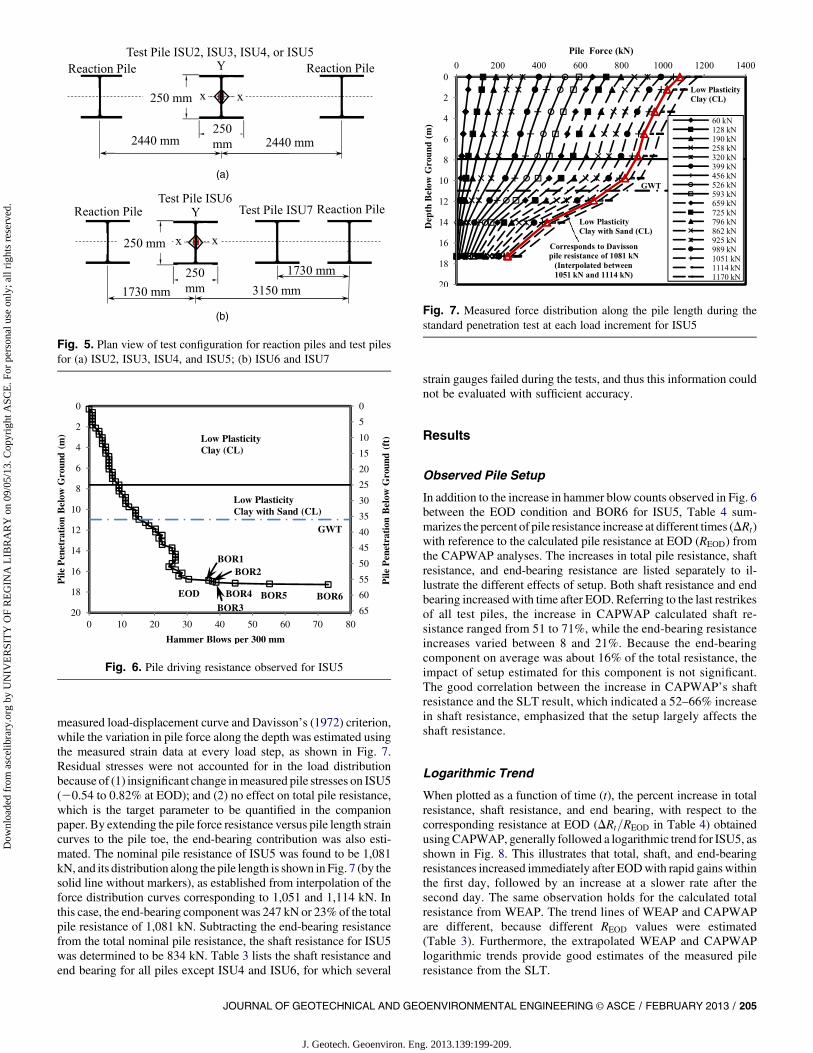
Single-acting, open-ended diesel hammers were used to drive andrestrike all test piles, as summarized in Table 3, and to install all re-action piles. Before driving each test pile, two 18.3-m-long HP2503 62 reaction piles were driven with webs oriented parallel toadjacent piles, as shown in Fig. 5. To avoid the effect of reaction pileinstallations on soil properties initially measured at the test pile lo-cation, the reaction piles were installed at an equal distance of 2.44 mon both sides of the test pile [Fig. 5(a)] except for ISU6 [Fig. 5(b)],where the reaction piles were installed at distances of 1.73 and 3.12mon either side of the test pile, because another test pile (ISU7) wasincluded within the same test configuration but with a shallowerembedded length of only 5.8 m. In all cases, the reaction piles wereinstalled with an exposed length of 1.8 m for connection with ahorizontal reaction beam. The test pile was then driven and the PDAdata recorded during both pile driving and restrikes. During eachrestrike, an average of eight hammer blows was delivered to the test
Table 2. Weighted Average Soil Properties along Pile Shaft and Near PileToe
Fig. 4. Proposed relationships between horizontal coefficient of consolidation and (a) undrained shear strength (Su); (b) standard penetration testN-value
pile, with the third blow selected for analyses. To helpwith pile setupevaluations, the time and pile embedded length before and aftereach restrike were precisely recorded for each test pile (Table 3).Furthermore, pile driving resistance in terms of the total number ofhammer blows per 300 mm of pile penetration (i.e., hammer blowcount) was accurately obtained using video. Fig. 6 depicts the blowcounts for ISU5, which increased from 30 at EOD to 72 at thebeginning of restrike Number 6 (i.e., BOR6), over a period of 7.92days. This substantial rise in blow count under a comparable hammerenergy ratio during driving and restrikes (with an average of 44.5%and standard deviation of 4.4%), without a significant increase inpile embedded length, is mainly caused by pile setup, ultimatelyincreasing the pile resistance.
Dynamic Analysis Methods
With the available pile, soil, and hammer information, as well asrecorded hammer blow counts, the total pile resistance for each re-strike was estimated using the Wave Equation Analysis Program
(WEAP) SPT N-value based method (i.e., SA method specified byPile Dynamics, Inc., 2005). Furthermore, the PDA-measured forceand velocity records near the pile head were used in the CAPWAPanalyses to determine shaft resistance and end bearing at each event,as summarized in Table 3. Unlike WEAP, which relies on a staticgeotechnical analysis for an assessment of resistance distribution,CAPWAP quantifies the total static resistance, as well as its dis-tribution along the pile length and the end-bearing component.
Static Load Tests
Following completion of all restrikes, vertical SLTs were performedon test piles following the quick test procedure of ASTM D1143(ASTM 2007), according to the schedule indicated in Table 3. In ad-dition to recording the strain data along the pile shaft, four 250-mmstroke displacement transducers, installed at the four extremeedges of the test pile flanges, recorded the pile vertical movementduring each loading and unloading step. For each pile, the pileresistance (or the total nominal resistance) was calculated using the
Table 3. Summary of Five Test Piles and Their Results
aTime in minutes.bTime in hours.cPile resistance based on Davisson’s (1972) criterion.dMaximum sustainable test load measured during standard penetration test.
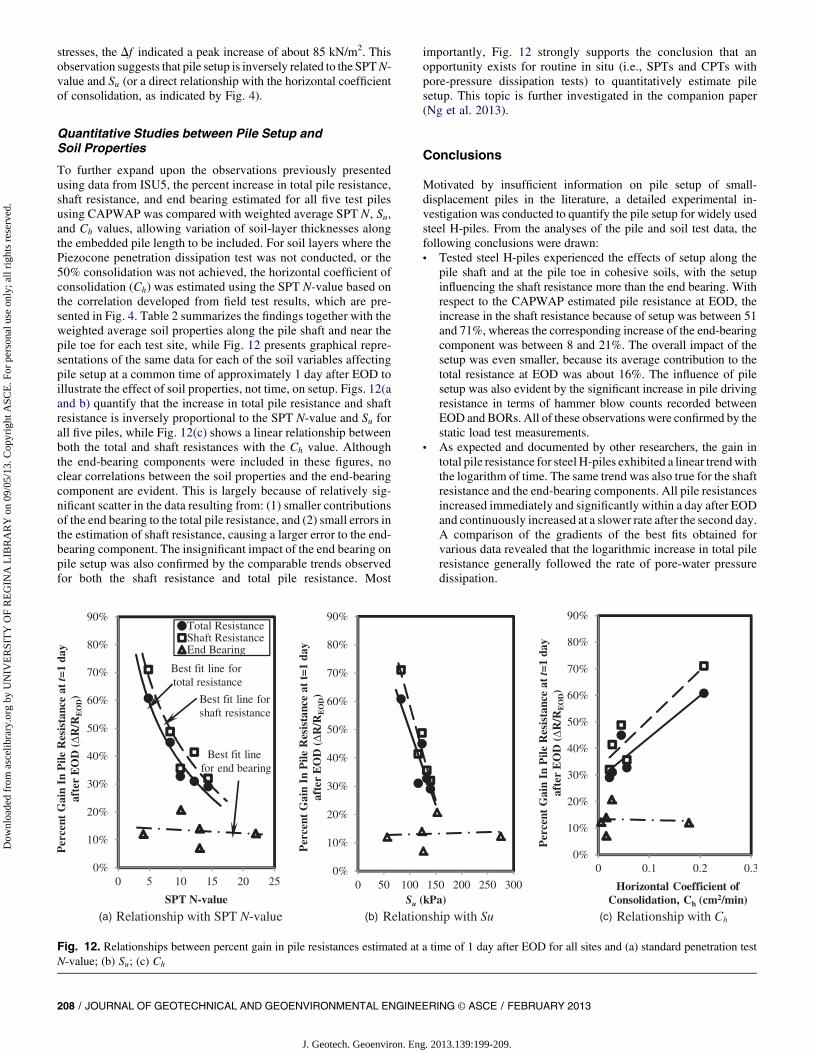
measured load-displacement curve and Davisson’s (1972) criterion,while the variation in pile force along the depth was estimated usingthe measured strain data at every load step, as shown in Fig. 7.Residual stresses were not accounted for in the load distributionbecause of (1) insignificant change inmeasured pile stresses on ISU5(20.54 to 0.82% at EOD); and (2) no effect on total pile resistance,which is the target parameter to be quantified in the companionpaper. By extending the pile force resistance versus pile length straincurves to the pile toe, the end-bearing contribution was also esti-mated. The nominal pile resistance of ISU5 was found to be 1,081kN, and its distribution along the pile length is shown in Fig. 7 (by thesolid line without markers), as established from interpolation of theforce distribution curves corresponding to 1,051 and 1,114 kN. Inthis case, the end-bearing component was 247 kN or 23% of the totalpile resistance of 1,081 kN. Subtracting the end-bearing resistancefrom the total nominal pile resistance, the shaft resistance for ISU5was determined to be 834 kN. Table 3 lists the shaft resistance andend bearing for all piles except ISU4 and ISU6, for which several
strain gauges failed during the tests, and thus this information couldnot be evaluated with sufficient accuracy.
Results
Observed Pile Setup
In addition to the increase in hammer blow counts observed in Fig. 6between the EOD condition and BOR6 for ISU5, Table 4 sum-marizes the percent of pile resistance increase at different times (DRt)with reference to the calculated pile resistance at EOD (REOD) fromthe CAPWAP analyses. The increases in total pile resistance, shaftresistance, and end-bearing resistance are listed separately to il-lustrate the different effects of setup. Both shaft resistance and endbearing increased with time after EOD. Referring to the last restrikesof all test piles, the increase in CAPWAP calculated shaft re-sistance ranged from 51 to 71%, while the end-bearing resistanceincreases varied between 8 and 21%. Because the end-bearingcomponent on average was about 16% of the total resistance, theimpact of setup estimated for this component is not significant.The good correlation between the increase in CAPWAP’s shaftresistance and the SLT result, which indicated a 52–66% increasein shaft resistance, emphasized that the setup largely affects theshaft resistance.
Logarithmic Trend
When plotted as a function of time (t), the percent increase in totalresistance, shaft resistance, and end bearing, with respect to thecorresponding resistance at EOD (DRt=REOD in Table 4) obtainedusingCAPWAP, generally followed a logarithmic trend for ISU5, asshown in Fig. 8. This illustrates that total, shaft, and end-bearingresistances increased immediately after EODwith rapid gainswithinthe first day, followed by an increase at a slower rate after thesecond day. The same observation holds for the calculated totalresistance from WEAP. The trend lines of WEAP and CAPWAPare different, because different REOD values were estimated(Table 3). Furthermore, the extrapolated WEAP and CAPWAPlogarithmic trends provide good estimates of the measured pileresistance from the SLT.
Fig. 5. Plan view of test configuration for reaction piles and test pilesfor (a) ISU2, ISU3, ISU4, and ISU5; (b) ISU6 and ISU7
Fig. 6. Pile driving resistance observed for ISU5
Fig. 7. Measured force distribution along the pile length during thestandard penetration test at each load increment for ISU5
Given that PC1 at ISU5was installed above theGWTand because ofspace limitations, only the results of ISU6 are explicitly describedherein. The percent change in pore-water pressures with respect tothe hydrostatic pressure of 63 kPa recorded at ISU6 using PC3 andPC4 at 10m below ground surface, with the groundwater table at 4.6m, is plotted in Fig. 9 as a function of time. Fig. 9(a) shows therecorded data for the first 20-min period. Accordingly, pore-waterpressure recorded using PC3 experienced a slight reduction inreadings before the pile toe reached the depth of the device, but nosignificant change was recorded as the pile passed by the gaugelocation during driving. The recorded pore pressure progressivelyincreased from 34 to 61% at PC3 and from 212 to 2% at PC4between the time when the pile passed through the devices andBOR3. After BOR3, fluctuations in data during restrike and SLT, aswell as gradual dissipation of pressurewith time,were generally seen[Fig. 9(b)]. For PC3, which was closer to the pile, the pore-waterpressure dissipation generally followed a logarithmic trend andreduced to 9%within a day (i.e., around BOR5), almost returning toits hydrostatic state, which indicates complete dissipation in about 8days (i.e., ∼1 day after BOR7). Unfortunately, PC3 failed to recordanymeasurements thereafter. The dissipated PC3 pore-water pressureas a percentage of the pressure measured at EOD as a function of
Table 4. Percentage Increase in Pile Resistance Based on WEAP, CAPWAP, and Standard Penetration Test
time (t) was best fitted with a logarithmic trend with a relatively highcoefficient of determination (R2) of 0.79, shown in Fig. 10. Within 1day after EOD, both the percent increase in total resistance anddissipated pore-water pressurewere comparable (i.e., both are∼30%at 1 day). The minimal difference in the gradients (i.e., 0.55 forresistance and 0.50 for pore-water pressure dissipation, as shown inequations included in Fig. 10) suggests that the logarithmic increasein total pile resistance followed the rate of the pore-water pressuredissipation. The difference between the increase of pile resistanceand the percent of pore-water pressure dissipation curves, which ismainly because of the difference in the intercept values of 0.33for resistance and 0.25 for pore-water pressure, as shown byequations presented in Fig. 10, is believed to be the result of re-molding and the healing processes occurring in the soil disturbedby pile driving.
Influence of Soil Properties
Because the pile setup largely increases the shaft resistance, a de-tailed correlation study between soil properties and the increase inunit shaft resistance (Df ) was performed. The increase in unit shaftresistance calculated for ISU5 using CAPWAP between EOD and
the last restrikewas plotted along the embedded pile length in Fig. 11together with the measured vertical coefficient of consolidation (Cv)and the SPT N-value. A similar distribution of Df for the SLT, thedifference between the measured unit shaft resistance from the SLTat 9 days after EOD and the CAPWAP calculated unit shaft re-sistance at EOD are also included in Fig. 11 for comparative pur-poses. The distributions of Df for both CAPWAP and the SLT havea similar trend. Referring to the Df distribution based on the SLT(dashed line), Fig. 11 shows that theDf increased by about 15 kN/m2
in the top 5-m-thick soil layer, which was characterized witha relatively small Su value of 97 kPa and SPT N-values rangingbetween 6 and 8. TheDf continued to reduce to a depth of about 11mfrom the ground surface, where the surrounding cohesive soil layerhas the highest Su of 211 kPa and the highest SPTN-value of 22. Thisreduction to Df is believed to be the result of the dilation of therelatively dense soil layer, causing an increase in pore-water pres-sure, which was observed during the Piezocone penetration dissi-pation test conducted at a depth of 11.75 m.With the reduction in Sufrom 211 to 126 kPa and an SPT N-value from 22 to 13 below the11-m depth, where the surrounding soil experiences larger lateral
Fig. 9. Percent change in pore-water pressure recorded by push-inpressure cells (PC3 and PC4) at ISU6 as a function of time consideredafter EOD in (a) minutes; (b) days
Fig. 10. Comparison between pore-water pressure dissipation and pilesetup for ISU6
Fig. 11. Relationship between the increase in unit shaft resistance andsoil properties for ISU5
stresses, the Df indicated a peak increase of about 85 kN/m2. Thisobservation suggests that pile setup is inversely related to the SPTN-value and Su (or a direct relationship with the horizontal coefficientof consolidation, as indicated by Fig. 4).
Quantitative Studies between Pile Setup andSoil Properties
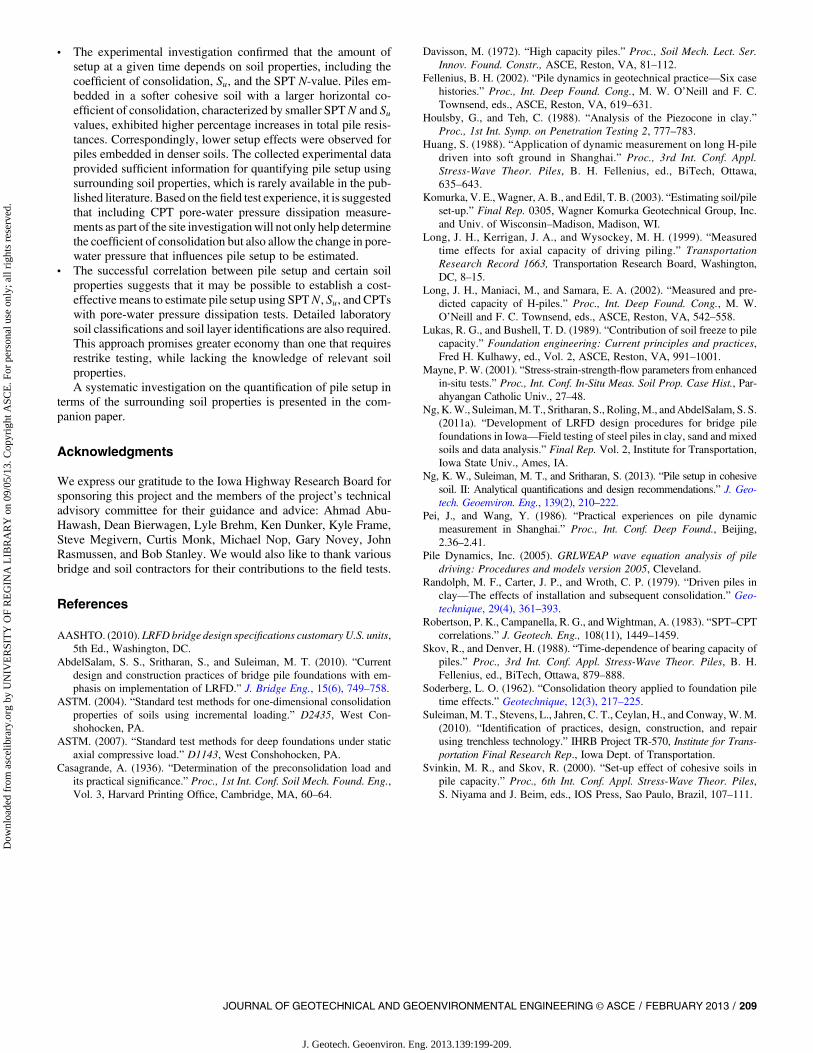
To further expand upon the observations previously presentedusing data from ISU5, the percent increase in total pile resistance,shaft resistance, and end bearing estimated for all five test pilesusing CAPWAP was compared with weighted average SPT N, Su,and Ch values, allowing variation of soil-layer thicknesses alongthe embedded pile length to be included. For soil layers where thePiezocone penetration dissipation test was not conducted, or the50% consolidation was not achieved, the horizontal coefficient ofconsolidation (Ch) was estimated using the SPT N-value based onthe correlation developed from field test results, which are pre-sented in Fig. 4. Table 2 summarizes the findings together with theweighted average soil properties along the pile shaft and near thepile toe for each test site, while Fig. 12 presents graphical repre-sentations of the same data for each of the soil variables affectingpile setup at a common time of approximately 1 day after EOD toillustrate the effect of soil properties, not time, on setup. Figs. 12(aand b) quantify that the increase in total pile resistance and shaftresistance is inversely proportional to the SPT N-value and Su forall five piles, while Fig. 12(c) shows a linear relationship betweenboth the total and shaft resistances with the Ch value. Althoughthe end-bearing components were included in these figures, noclear correlations between the soil properties and the end-bearingcomponent are evident. This is largely because of relatively sig-nificant scatter in the data resulting from: (1) smaller contributionsof the end bearing to the total pile resistance, and (2) small errors inthe estimation of shaft resistance, causing a larger error to the end-bearing component. The insignificant impact of the end bearing onpile setup was also confirmed by the comparable trends observedfor both the shaft resistance and total pile resistance. Most
importantly, Fig. 12 strongly supports the conclusion that anopportunity exists for routine in situ (i.e., SPTs and CPTs withpore-pressure dissipation tests) to quantitatively estimate pilesetup. This topic is further investigated in the companion paper(Ng et al. 2013).
Conclusions
Motivated by insufficient information on pile setup of small-displacement piles in the literature, a detailed experimental in-vestigation was conducted to quantify the pile setup for widely usedsteel H-piles. From the analyses of the pile and soil test data, thefollowing conclusions were drawn:• Tested steel H-piles experienced the effects of setup along the
pile shaft and at the pile toe in cohesive soils, with the setupinfluencing the shaft resistance more than the end bearing. Withrespect to the CAPWAP estimated pile resistance at EOD, theincrease in the shaft resistance because of setup was between 51and 71%, whereas the corresponding increase of the end-bearingcomponent was between 8 and 21%. The overall impact of thesetup was even smaller, because its average contribution to thetotal resistance at EOD was about 16%. The influence of pilesetup was also evident by the significant increase in pile drivingresistance in terms of hammer blow counts recorded betweenEOD and BORs. All of these observations were confirmed by thestatic load test measurements.
• As expected and documented by other researchers, the gain intotal pile resistance for steel H-piles exhibited a linear trendwiththe logarithm of time. The same trend was also true for the shaftresistance and the end-bearing components. All pile resistancesincreased immediately and significantly within a day after EODand continuously increased at a slower rate after the second day.A comparison of the gradients of the best fits obtained forvarious data revealed that the logarithmic increase in total pileresistance generally followed the rate of pore-water pressuredissipation.
Fig. 12. Relationships between percent gain in pile resistances estimated at a time of 1 day after EOD for all sites and (a) standard penetration testN-value; (b) Su; (c) Ch
• The experimental investigation confirmed that the amount ofsetup at a given time depends on soil properties, including thecoefficient of consolidation, Su, and the SPT N-value. Piles em-bedded in a softer cohesive soil with a larger horizontal co-efficient of consolidation, characterized by smaller SPTN and Suvalues, exhibited higher percentage increases in total pile resis-tances. Correspondingly, lower setup effects were observed forpiles embedded in denser soils. The collected experimental dataprovided sufficient information for quantifying pile setup usingsurrounding soil properties, which is rarely available in the pub-lished literature. Based on the field test experience, it is suggestedthat including CPT pore-water pressure dissipation measure-ments as part of the site investigationwill not only help determinethe coefficient of consolidation but also allow the change in pore-water pressure that influences pile setup to be estimated.
• The successful correlation between pile setup and certain soilproperties suggests that it may be possible to establish a cost-effective means to estimate pile setup using SPTN, Su, and CPTswith pore-water pressure dissipation tests. Detailed laboratorysoil classifications and soil layer identifications are also required.This approach promises greater economy than one that requiresrestrike testing, while lacking the knowledge of relevant soilproperties.A systematic investigation on the quantification of pile setup in
terms of the surrounding soil properties is presented in the com-panion paper.
Acknowledgments
We express our gratitude to the Iowa Highway Research Board forsponsoring this project and the members of the project’s technicaladvisory committee for their guidance and advice: Ahmad Abu-Hawash, Dean Bierwagen, Lyle Brehm, Ken Dunker, Kyle Frame,Steve Megivern, Curtis Monk, Michael Nop, Gary Novey, JohnRasmussen, and Bob Stanley. We would also like to thank variousbridge and soil contractors for their contributions to the field tests.
AbdelSalam, S. S., Sritharan, S., and Suleiman, M. T. (2010). “Currentdesign and construction practices of bridge pile foundations with em-phasis on implementation of LRFD.” J. Bridge Eng., 15(6), 749–758.
ASTM. (2004). “Standard test methods for one-dimensional consolidationproperties of soils using incremental loading.” D2435, West Con-shohocken, PA.
ASTM. (2007). “Standard test methods for deep foundations under staticaxial compressive load.” D1143, West Conshohocken, PA.
Casagrande, A. (1936). “Determination of the preconsolidation load andits practical significance.” Proc., 1st Int. Conf. Soil Mech. Found. Eng.,Vol. 3, Harvard Printing Office, Cambridge, MA, 60–64.
Davisson, M. (1972). “High capacity piles.” Proc., Soil Mech. Lect. Ser.Innov. Found. Constr., ASCE, Reston, VA, 81–112.
Fellenius, B. H. (2002). “Pile dynamics in geotechnical practice—Six casehistories.” Proc., Int. Deep Found. Cong., M. W. O’Neill and F. C.Townsend, eds., ASCE, Reston, VA, 619–631.
Houlsby, G., and Teh, C. (1988). “Analysis of the Piezocone in clay.”Proc., 1st Int. Symp. on Penetration Testing 2, 777–783.
Huang, S. (1988). “Application of dynamic measurement on long H-piledriven into soft ground in Shanghai.” Proc., 3rd Int. Conf. Appl.Stress-Wave Theor. Piles, B. H. Fellenius, ed., BiTech, Ottawa,635–643.
Komurka, V. E.,Wagner, A. B., and Edil, T. B. (2003). “Estimating soil/pileset-up.” Final Rep. 0305, Wagner Komurka Geotechnical Group, Inc.and Univ. of Wisconsin–Madison, Madison, WI.
Long, J. H., Kerrigan, J. A., and Wysockey, M. H. (1999). “Measuredtime effects for axial capacity of driving piling.” TransportationResearch Record 1663, Transportation Research Board, Washington,DC, 8–15.
Long, J. H., Maniaci, M., and Samara, E. A. (2002). “Measured and pre-dicted capacity of H-piles.” Proc., Int. Deep Found. Cong., M. W.O’Neill and F. C. Townsend, eds., ASCE, Reston, VA, 542–558.
Lukas, R. G., and Bushell, T. D. (1989). “Contribution of soil freeze to pilecapacity.” Foundation engineering: Current principles and practices,Fred H. Kulhawy, ed., Vol. 2, ASCE, Reston, VA, 991–1001.
Mayne, P. W. (2001). “Stress-strain-strength-flow parameters from enhancedin-situ tests.” Proc., Int. Conf. In-Situ Meas. Soil Prop. Case Hist., Par-ahyangan Catholic Univ., 27–48.
Ng,K.W., Suleiman,M. T., Sritharan, S., Roling,M., andAbdelSalam, S. S.(2011a). “Development of LRFD design procedures for bridge pilefoundations in Iowa—Field testing of steel piles in clay, sand and mixedsoils and data analysis.” Final Rep. Vol. 2, Institute for Transportation,Iowa State Univ., Ames, IA.
Ng, K. W., Suleiman, M. T., and Sritharan, S. (2013). “Pile setup in cohesivesoil. II: Analytical quantifications and design recommendations.” J. Geo-tech. Geoenviron. Eng., 139(2), 210–222.
Pei, J., and Wang, Y. (1986). “Practical experiences on pile dynamicmeasurement in Shanghai.” Proc., Int. Conf. Deep Found., Beijing,2.36–2.41.
Pile Dynamics, Inc. (2005). GRLWEAP wave equation analysis of piledriving: Procedures and models version 2005, Cleveland.
Randolph, M. F., Carter, J. P., and Wroth, C. P. (1979). “Driven piles inclay—The effects of installation and subsequent consolidation.” Geo-technique, 29(4), 361–393.
Robertson, P. K., Campanella, R. G., andWightman, A. (1983). “SPT–CPTcorrelations.” J. Geotech. Eng., 108(11), 1449–1459.
Skov, R., and Denver, H. (1988). “Time-dependence of bearing capacity ofpiles.” Proc., 3rd Int. Conf. Appl. Stress-Wave Theor. Piles, B. H.Fellenius, ed., BiTech, Ottawa, 879–888.
Soderberg, L. O. (1962). “Consolidation theory applied to foundation piletime effects.” Geotechnique, 12(3), 217–225.
Suleiman, M. T., Stevens, L., Jahren, C. T., Ceylan, H., and Conway, W.M.(2010). “Identification of practices, design, construction, and repairusing trenchless technology.” IHRB Project TR-570, Institute for Trans-portation Final Research Rep., Iowa Dept. of Transportation.
Svinkin, M. R., and Skov, R. (2000). “Set-up effect of cohesive soils inpile capacity.” Proc., 6th Int. Conf. Appl. Stress-Wave Theor. Piles,S. Niyama and J. Beim, eds., IOS Press, Sao Paulo, Brazil, 107–111.