Advanced Performance Management Time allowed Reading and planning: 15 minutes Writing: 3 hours This paper is divided into two sections: Section A – THIS ONE question is compulsory and MUST be attempted Section B – TWO questions ONLY to be attempted Do NOT open this paper until instructed by the supervisor. During reading and planning time only the question paper may be annotated. You must NOT write in your answer booklet until instructed by the supervisor. This question paper must not be removed from the examination hall. Professional Pilot Paper – Options module Paper P5 The Association of Chartered Certified Accountants
Transcript
Advanced Performance Management
Time allowed Reading and planning: 15 minutesWriting: 3 hours
This paper is divided into two sections:
Section A – THIS ONE question is compulsory and MUST be attempted
Section B – TWO questions ONLY to be attempted
Do NOT open this paper until instructed by the supervisor.During reading and planning time only the question paper may be annotated. You must NOT write in your answer booklet until instructed by the supervisor.This question paper must not be removed from the examination hall.
Professional Pilot Paper – Options module
Pape
r P5
The Association of Chartered Certified Accountants
2
Section A: THIS ONE question is compulsory and MUST be attempted
1 Mackerel Contracting (Mackerel) is a listed defence contractor working mainly for its domestic government in Zedland. You are a consultant brought in to advise Mackerel on a number of issues facing the company. The board need a report from you:• outlining the external factors affecting the profitability of a potential new contract and how these factors can be
built in to the choice of the design budget which is ultimately set, • advising on a proposed change to the company’s information systems and • advising on suitable performance measures for Mackerel.
Firstly, Mackerel is currently considering tendering for a contract to develop a new armoured personnel vehicle (APV) for the army to protect its soldiers during transport around any future battlefield. The invitation to tender from the government specifies that the APV should take two years to develop and test, and be delivered for a full cost to Mackerel of no more than $70,000 per unit at current prices. Normally, government contracts are approximately priced on a cost plus basis with Mackerel aiming to make a 19% mark-up.
At the last briefing meeting, the institutional shareholders of Mackerel expressed worry about the volatility of the company’s earnings (currently a $20.4m operating profit per annum) especially during the economic downturn which is affecting Zedland at present. They are also concerned by cuts in government expenditure resulting from this recession. The Zedland minister for procurement has declared ‘In the current difficult economic conditions, we are preparing a wide ranging review of all defence contracts with a view to deciding on what is desirable within the overall priorities for Zedland and what is possible within our budget.’ The government procurement manager has indicated that the government would be willing to commit to purchase 500 APV’s within the price limit set but with the possibility of increasing this to 750 or 1,000 depending on defence commitments. In the invitation to tender document, the government has stated it will pay $7.5m towards development and then a 19% mark-up on budgeted variable costs.
Mackerel’s risk management committee (RMC) is considering how much to spend on design and development. It has three proposals from the engineering team: a basic package at $7.5m (which will satisfy the original contract specifications) and two other improved design packages. The design packages will have different total fixed costs but are structured to give the same variable cost per unit. It is believed that the improved design packages will increase the chances of gaining a larger government order but it has been very difficult to ascertain the relevant probabilities of different order volumes. The RMC need a full appraisal of the situation using all suitable methods.
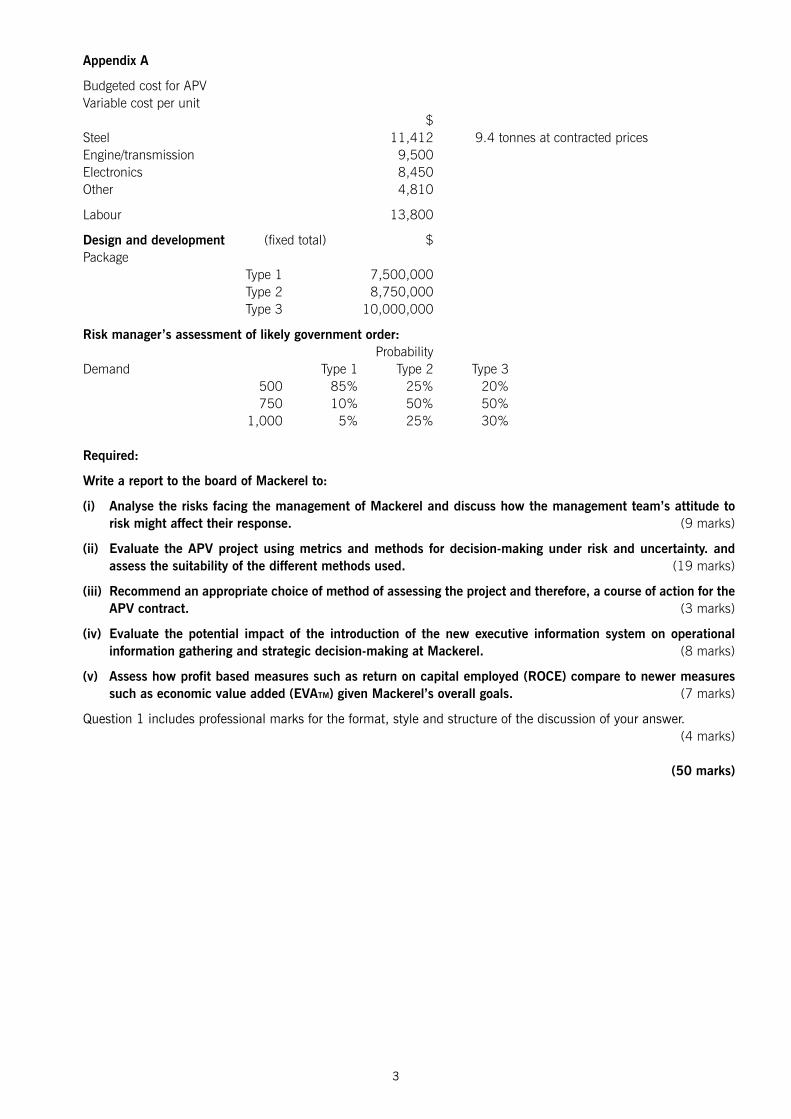
The risk manager has gathered information on the APV contract which is contained in appendix A. She has identified that a major uncertainty in pricing the vehicle is the price of steel, as each APV requires 9.4 tonnes of steel. However, she has been successful in negotiating a fixed price contract for all the steel that might be required at $1,214 per tonne. The risk manager has tried to estimate the effect of choosing different design packages but is unsure of how to proceed to evaluate the different options.
Secondly, the board is also considering a change to the information systems at Mackerel. The existing systems are based in the individual functions (production, sales, service, finance and human resources). Currently, reports are submitted by each function and then integrated at head office into the board papers that form the main strategic information system of the company. The board are considering the implementation of a new system based on an integrated, single database that would be accessible at any of the company’s five sites. The company network would be upgraded to allow real-time input and update of the database. The database would support a detailed management information system and a high-level executive information system.
Finally, the chief executive officer (CEO) of Mackerel believes that this new information system will provide the opportunity for a change in how performance is evaluated within the company. The company’s mission is to maximise shareholder wealth and currently, the board use total shareholder return (TSR) as an overall corporate measure of performance. The CEO has asked you consider the general impact of the new information system and also, how profit based measures such as return on capital employed (ROCE) compare to newer measures such as economic value added (EVATM) with regard to meeting the overall goals of Mackerel and its external measure of performance.
3
Appendix A Budgeted cost for APV Variable cost per unit $ Steel 11,412 9.4 tonnes at contracted prices Engine/transmission 9,500 Electronics 8,450 Other 4,810 Labour 13,800 Design and development (fixed total) $ Package Type 1 7,500,000 Type 2 8,750,000 Type 3 10,000,000 Risk manager’s assessment of likely government order: Probability Demand Type 1 Type 2 Type 3 500 85% 25% 20% 750 10% 50% 50% 1,000 5% 25% 30% Required:
Write a report to the board of Mackerel to:
(i) Analyse the risks facing the management of Mackerel and discuss how the management team’s attitude to risk might affect their response. (9 marks)
(ii) Evaluate the APV project using metrics and methods for decision-making under risk and uncertainty. and assess the suitability of the different methods used. (19 marks)
(iii) Recommend an appropriate choice of method of assessing the project and therefore, a course of action for the APV contract. (3 marks)
(iv) Evaluate the potential impact of the introduction of the new executive information system on operational information gathering and strategic decision-making at Mackerel. (8 marks)
(v) Assess how profit based measures such as return on capital employed (ROCE) compare to newer measures such as economic value added (EVATM) given Mackerel’s overall goals. (7 marks)
Question 1 includes professional marks for the format, style and structure of the discussion of your answer. (4 marks)
(50 marks)
4
Section B – Two questions from the three given must be attempted.
2 Albacore Chess Stores (Albacore) is a chain of twelve shops specialising in selling items associated with the game of chess: boards, pieces, clocks, software and books. Three years ago, the company was the subject of a venture capital buyout from a larger group. A new senior management team was put in place after the buyout. They have the aim of running the business in order to maximise profits.
The Chief Financial Officer (CFO) along with the other members of senior management sets the annual budget and uses a standard costing approach with variance analysis in order to control individual shop performance. The head office handles all capital purchases and brand marketing. All inventory purchasing is done centrally and the shop opening times are set as standard across the company. As an illustration of senior management attitude, the CFO had set the budget for 2011 staff costs at $7 per hour for part-time staff and this was rigorously observed in the period.
Each shop is run by a manager who reports their financial results to the operational director at head office. The shop managers recruit and manage the staffing of their shop. They have some autonomy in setting prices locally and have been given authority to vary prices by up to 10% from a master list produced by the CFO. They also have a local marketing budget agreed each year by the shop’s manager and the marketing director as part of the annual appraisal process.
The shop managers have approached the Chairman of Albacore to complain about the way that they are managed and their remuneration. They feel that their efforts are unrecognised by senior management. One manager commented ‘I have had a successful year in hard economic circumstances. I have run a number of promotions in the shop that have been well received by the customers. However, the budgets that are set are impossible to achieve and as a result I have not been paid any bonus although I feel that I have done everything in my power to bring in good profits.’
The shop managers at Albacore are paid a basic salary of $27,000 with bonuses of up to 30% of basic salary dependent on two factors: performance above budget and the operational director’s assessment of the manager’s performance. The budget for the next year is prepared by the CFO and presented by the operational director at the shop manager’s annual appraisal.
The Chairman has come to you to ask if you can consider the system of performance assessment for the shop managers and give an independent perspective on the reward systems at Albacore. She has heard of variance analysis but is unsure as what would be relevant in this situation. She has provided the following illustrative branch report from the previous year for one shop:
Albacore Chess Stores Tunny Branch Year to Sept 2011 Budget Actual Variance $ $ $ Sales 266,000 237,100 -28,900 Cost of sales 106,400 94,840 11,560 Gross profit 159,600 142,260 -17,340 Marketing 12,000 11,500 500 Staff costs Manager 27,000 27,000 0 Part-time staff 38,000 34,000 4,000 Property costs 26,600 26,600 0 Shop profit 56,000 43,160 -12,840 Notes: Property costs includes heating, lighting and rental. Positive variances are favourable.
End of report
5
The manager of this shop commented at the appraisal meeting that she felt that the assessment was unfair since her failure to make budget was due to general economic conditions. The industry as a whole saw a 12% fall in revenues during the period and the budget for the period was set to be the same as the previous period. She was not paid a bonus for the period.
Required:
(a) Evaluate the suitability of the existing branch report as a means of assessing the shop manager’s performance and draft an improved branch report with justifications for changes. (13 marks)
(b) Analyse the performance management style and evaluate the performance appraisal system at Albacore. Suggest suitable improvements to its reward system for the shop managers. (12 marks)
(25 marks)
3 Pharmaceutical Technologies Co (PT) is a developer and manufacturer of pharmaceuticals medical drugs in Beeland. It is one of the 100 largest listed companies on the national stock exchange. The company focuses on buying prospective products drugs from small bio-engineering companies that have shown initial promise in testing from small bio-engineering companies. PT then leads these through three regulatory stages to launch in the general medical market. The three stages are:
1 to confirm that the safety of the drug product (does it harm humans?), with small scale trials;,2 to test the efficacy of the product (does it help cure?), again in small scale trials; and3 finally, large scale trials to definitively decide on the safety and efficacy of the product.
The drugs are then marketed through the company’s large sales force to health care providers and end users (patients). The health care providers are paid by either health insurance companies or the national government dependent on the financial status of the patient.
The Beeland Drug Regulator (BDR) oversees this testing process and makes the final judgement about whether a product can be sold in the country.
Its objectives are to protect, promote and improve public health by ensuring that:• medicines have an acceptable balance of benefit and risk;,• the users of these medicines understand this risk-benefit profile; and• new beneficial product development is encouraged.
The regulator is governed by a board of trustees appointed by the government. It is funded directly by the government and also, through fees charged to drug companies when granting licences to sell their products in Beeland.
PT has used share price and earnings per share as its principal measures of performance to date. However, the share price has underperformed the market and the health sector in the last 2 two years. The chief executive officer (CEO) has identified that these measures are too narrow and is considering implementing a balanced scorecard approach to address this problem.
A working group has drawn up a suggested balanced scorecard. It began by identifying the objectives from the board’s medium term strategy:• Create shareholder value by bringing commercially viable drugs to market • Improve the efficiency of drug development• Increase shareholder value by innovation in the drug approval process
6
The working group then considered the stakeholder perspectives:• Shareholders want an competitive return on their investment• Payers Purchasers (governments, insurers and patients) want to pay a reasonable price for the drugs• Regulators want an efficient process for the validation of drugs• Doctors want safe and effective drug products• Patients want to be cured
Finally, this leads to the proposed scorecard of performance measures:• Financial – share price and earnings per share• Customer – number of patients using TTPT products• Internal business process – above exceed industry-standard quality of on design and testing; time to regulatory
approval of a product• Learning and growth – training days undertaken by staff; time to market of new product; percentage of drugs
bought by TTPT that gain final approval.
This balanced scorecard now needs to be reviewed to ensure that it will address the company’s objectives and the issues that it faces in its business environment.
Required:
(a) Evaluate the performance measures proposed for PT’s balanced scorecard. (10 marks)
(b) Briefly describe a method of analysing stakeholder influence and analyse the influence of four different external stakeholders on the regulator (BDR). (8 marks)
(c) Using your answer from part (b), describe how the application of the balanced scorecard approach at BDR would differ from the approach within PT. (7 marks)
(25 marks)
4 PLX Refinery Co is a large oil refinery business in Kayland. Kayland is a developing country with a large and growing oil exploration and production business which supplies PLX with crude oil. Currently, the refinery has the capacity to process 200,000 barrels of crude oil per day and makes profits of $146m per year. It employs about 2,000 staff and contractors. The staff are paid $60,000 each per year on average (about twice the national average in Kayland).
The government of Kayland has been focussed on delivering rapid economic growth over the last 15 years. However, there are increasing signs that the environment is paying a large price for this growth with public health suffering. There is now a growing environmental pressure group, Green Kayland (GK), which is organising protests against the companies that they see as being the major polluters.
Kayland’s government wishes to react to the concerns of the public and the pressure groups. It has requested that companies involved in heavy industry contribute to a general improvement in the treatment of the environment in Kayland.
As a major participant in the oil industry with ties to the nationalised oil exploration company (Kayex), PLX believes it will be strategically important to be at the forefront of the environmental developments. It is working with other companies in the oil industry to improve environmental reporting since there is a belief that this will lead to improved public perception and economic efficiency of the industry. PLX has had a fairly good compliance record in Kayland with only two major fines being levied in the last eight years for safety breaches and river pollution ($1m each).
The existing information systems within PLX focus on financial performance. They support financial reporting obligations and allow monitoring of key performance metrics such as earnings per share and operating margins. Recent publications on environmental accounting have suggested there are a number of techniques (such as input/output analysis, activity-based costing (ABC) and a lifecycle view) that may be relevant in implementing improvements to these systems.
7
Currently, the refinery has the capacity to process 200,000 barrels of crude oil per day and makes profits of $146m per year. It employs about 2,000 staff and contractors. The staff are paid $60,000 each per year on average (about twice the national average in Kayland). PLX has had a fairly good compliance record in Kayland with only two major fines being levied in the last eight years for safety breaches and river pollution ($1m each).
PLX is considering a major capital expenditure programme to enhance capacity, safety and efficiency at the refinery. This will involve demolishing certain older sections of the refinery and building on newly acquired land adjacent to the site. Overall, the refinery will increase its land area by 20%.
Part of the refinery extension will also manufacture a new plastic, Kayplas. Kayplas is expected to have a limited market life of five years when it will be replaced by Kayplas2. The refinery accounting team have forecast the following data associated with this product and calculated PLX’s traditional performance measure of product profit for the new product:
Additionally, other costs associated with closing down and recycling the equipment in Kayplas production are estimated at $18m in 2016.
The board wishes to consider how it can contribute to the oil industry’s performance in environmental accounting, how it can implement the changes that this might require and how these changes can benefit the company.
Required:
Write to the board of PLX to:
(a) Discuss and illustrate four different cost categories that would aid transparency in environmental reporting both internally and externally at PLX. (6 marks)
(b) Explain and evaluate how the three management accounting techniques mentioned can assist in managing the environmental and strategic performance of PLX. (9 marks)
(c) Assess the impact of implementing an input/output analysis on the information systems used in PLX. (3 marks)
(d) Evaluate the costing approach used for Kayplas’s performance compared to a lifecycle costing approach, performing appropriate calculations. (7 marks)
(25 marks)
8
13 [P.T.O.
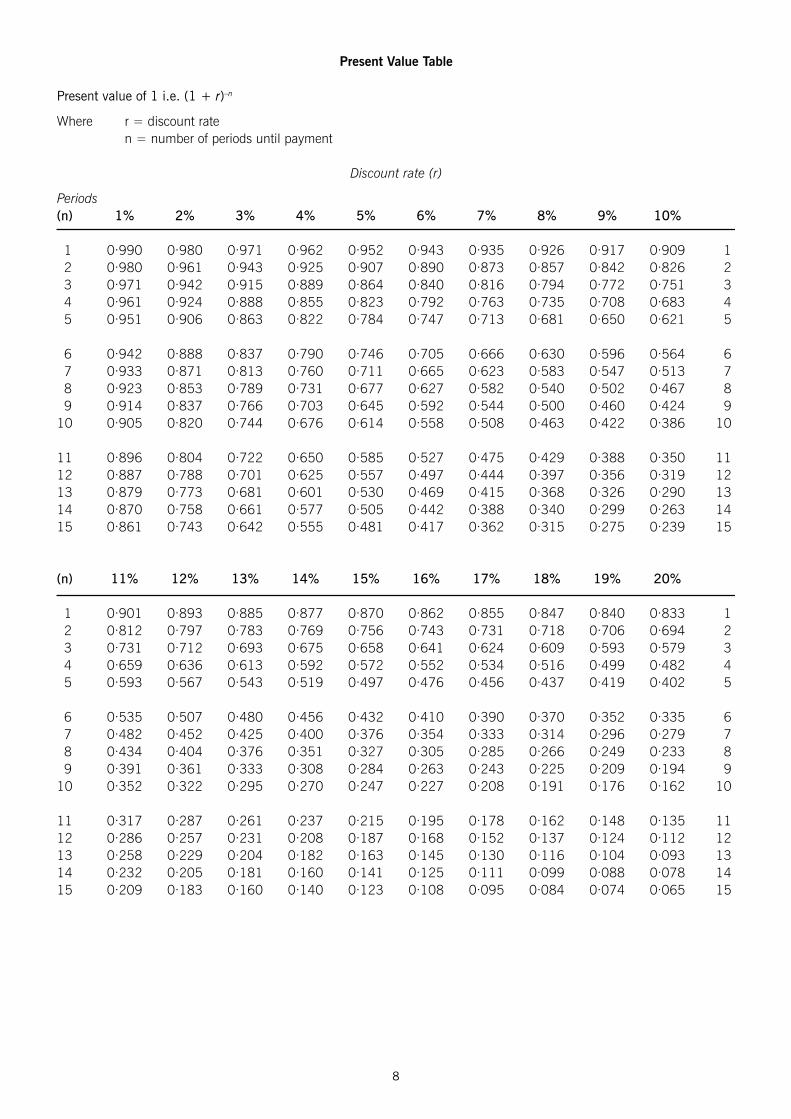
Present Value Table
Present value of 1 i.e. (1 + r)–n
Where r = discount rate n = number of periods until payment
Pilot Paper P5 AnswersAdvanced Performance Management
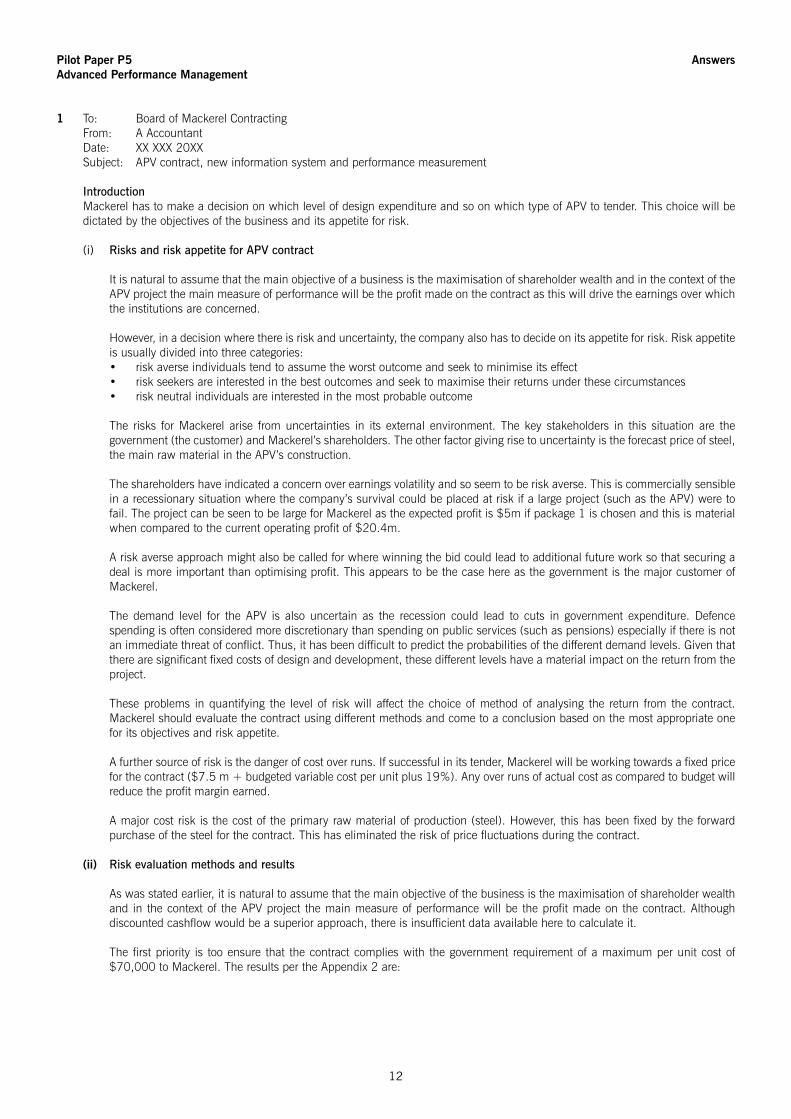
1 To: Board of Mackerel Contracting From: A Accountant Date: XX XXX 20XX Subject: APV contract, new information system and performance measurement
Introduction Mackerel has to make a decision on which level of design expenditure and so on which type of APV to tender. This choice will be
dictated by the objectives of the business and its appetite for risk.
(i) RisksandriskappetiteforAPVcontract It is natural to assume that the main objective of a business is the maximisation of shareholder wealth and in the context of the
APV project the main measure of performance will be the profit made on the contract as this will drive the earnings over which the institutions are concerned.
However, in a decision where there is risk and uncertainty, the company also has to decide on its appetite for risk. Risk appetite is usually divided into three categories: • risk averse individuals tend to assume the worst outcome and seek to minimise its effect• risk seekers are interested in the best outcomes and seek to maximise their returns under these circumstances• risk neutral individuals are interested in the most probable outcome
The risks for Mackerel arise from uncertainties in its external environment. The key stakeholders in this situation are the government (the customer) and Mackerel’s shareholders. The other factor giving rise to uncertainty is the forecast price of steel, the main raw material in the APV’s construction.
The shareholders have indicated a concern over earnings volatility and so seem to be risk averse. This is commercially sensible in a recessionary situation where the company’s survival could be placed at risk if a large project (such as the APV) were to fail. The project can be seen to be large for Mackerel as the expected profit is $5m if package 1 is chosen and this is material when compared to the current operating profit of $20.4m.
A risk averse approach might also be called for where winning the bid could lead to additional future work so that securing a deal is more important than optimising profit. This appears to be the case here as the government is the major customer of Mackerel.
The demand level for the APV is also uncertain as the recession could lead to cuts in government expenditure. Defence spending is often considered more discretionary than spending on public services (such as pensions) especially if there is not an immediate threat of conflict. Thus, it has been difficult to predict the probabilities of the different demand levels. Given that there are significant fixed costs of design and development, these different levels have a material impact on the return from the project.
These problems in quantifying the level of risk will affect the choice of method of analysing the return from the contract. Mackerel should evaluate the contract using different methods and come to a conclusion based on the most appropriate one for its objectives and risk appetite.
A further source of risk is the danger of cost over runs. If successful in its tender, Mackerel will be working towards a fixed price for the contract ($7.5 m + budgeted variable cost per unit plus 19%). Any over runs of actual cost as compared to budget will reduce the profit margin earned.
A major cost risk is the cost of the primary raw material of production (steel). However, this has been fixed by the forward purchase of the steel for the contract. This has eliminated the risk of price fluctuations during the contract.
(ii)Riskevaluationmethodsandresults
As was stated earlier, it is natural to assume that the main objective of the business is the maximisation of shareholder wealth and in the context of the APV project the main measure of performance will be the profit made on the contract. Although discounted cashflow would be a superior approach, there is insufficient data available here to calculate it.
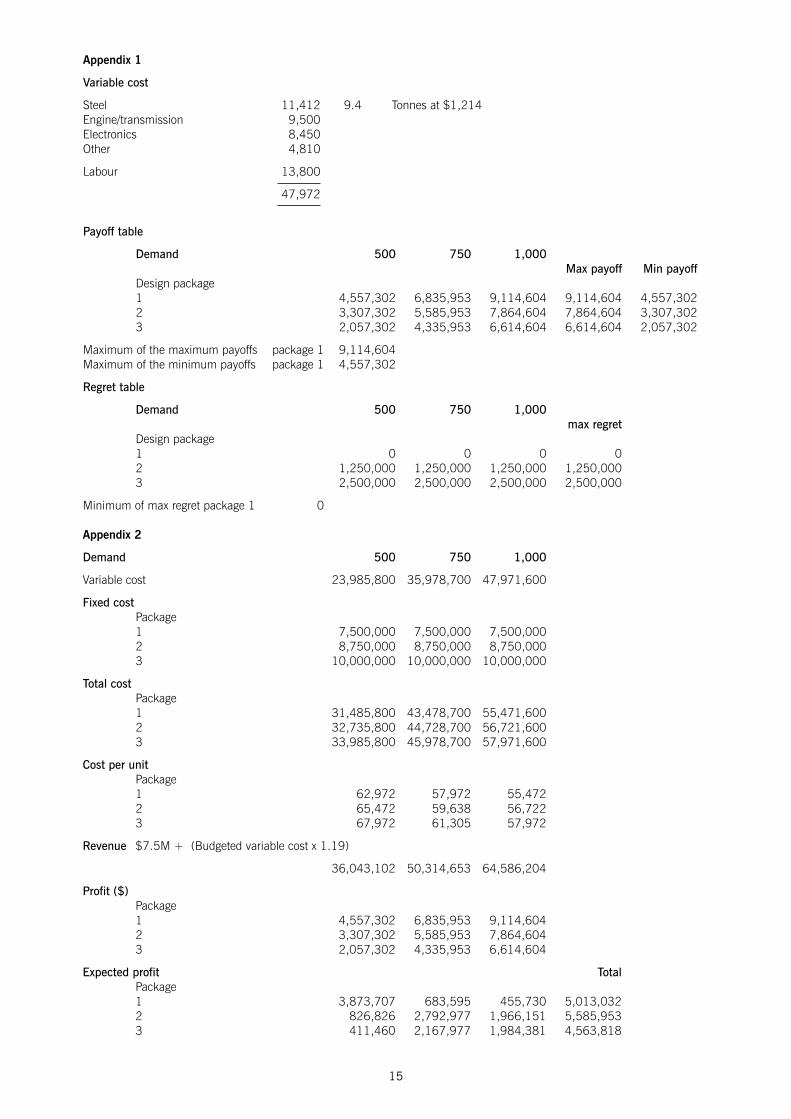
The first priority is too ensure that the contract complies with the government requirement of a maximum per unit cost of $70,000 to Mackerel. The results per the Appendix 2 are:
13
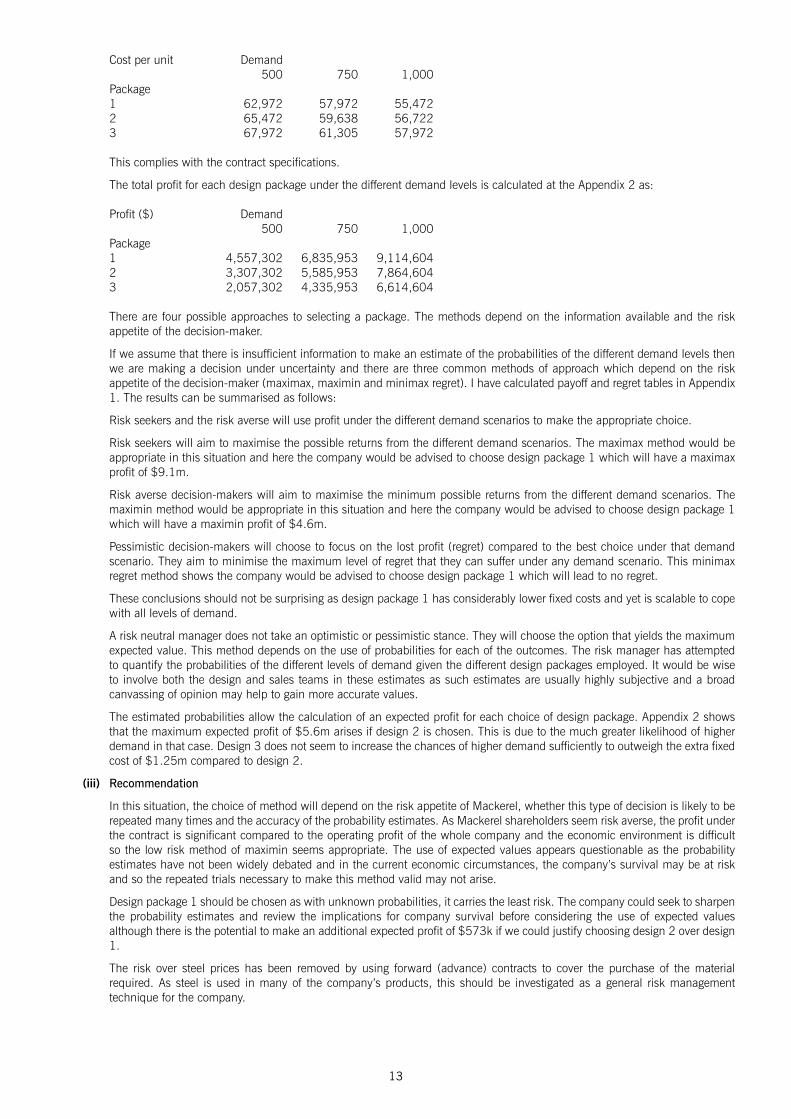
Cost per unit Demand 500 750 1,000 Package 1 62,972 57,972 55,472 2 65,472 59,638 56,722 3 67,972 61,305 57,972
This complies with the contract specifications.
The total profit for each design package under the different demand levels is calculated at the Appendix 2 as:
There are four possible approaches to selecting a package. The methods depend on the information available and the risk appetite of the decision-maker.
If we assume that there is insufficient information to make an estimate of the probabilities of the different demand levels then we are making a decision under uncertainty and there are three common methods of approach which depend on the risk appetite of the decision-maker (maximax, maximin and minimax regret). I have calculated payoff and regret tables in Appendix 1. The results can be summarised as follows:
Risk seekers and the risk averse will use profit under the different demand scenarios to make the appropriate choice.
Risk seekers will aim to maximise the possible returns from the different demand scenarios. The maximax method would be appropriate in this situation and here the company would be advised to choose design package 1 which will have a maximax profit of $9.1m.
Risk averse decision-makers will aim to maximise the minimum possible returns from the different demand scenarios. The maximin method would be appropriate in this situation and here the company would be advised to choose design package 1 which will have a maximin profit of $4.6m.
Pessimistic decision-makers will choose to focus on the lost profit (regret) compared to the best choice under that demand scenario. They aim to minimise the maximum level of regret that they can suffer under any demand scenario. This minimax regret method shows the company would be advised to choose design package 1 which will lead to no regret.
These conclusions should not be surprising as design package 1 has considerably lower fixed costs and yet is scalable to cope with all levels of demand.
A risk neutral manager does not take an optimistic or pessimistic stance. They will choose the option that yields the maximum expected value. This method depends on the use of probabilities for each of the outcomes. The risk manager has attempted to quantify the probabilities of the different levels of demand given the different design packages employed. It would be wise to involve both the design and sales teams in these estimates as such estimates are usually highly subjective and a broad canvassing of opinion may help to gain more accurate values.
The estimated probabilities allow the calculation of an expected profit for each choice of design package. Appendix 2 shows that the maximum expected profit of $5.6m arises if design 2 is chosen. This is due to the much greater likelihood of higher demand in that case. Design 3 does not seem to increase the chances of higher demand sufficiently to outweigh the extra fixed cost of $1.25m compared to design 2.
(iii) Recommendation
In this situation, the choice of method will depend on the risk appetite of Mackerel, whether this type of decision is likely to be repeated many times and the accuracy of the probability estimates. As Mackerel shareholders seem risk averse, the profit under the contract is significant compared to the operating profit of the whole company and the economic environment is difficult so the low risk method of maximin seems appropriate. The use of expected values appears questionable as the probability estimates have not been widely debated and in the current economic circumstances, the company’s survival may be at risk and so the repeated trials necessary to make this method valid may not arise.
Design package 1 should be chosen as with unknown probabilities, it carries the least risk. The company could seek to sharpen the probability estimates and review the implications for company survival before considering the use of expected values although there is the potential to make an additional expected profit of $573k if we could justify choosing design 2 over design 1.
The risk over steel prices has been removed by using forward (advance) contracts to cover the purchase of the material required. As steel is used in many of the company’s products, this should be investigated as a general risk management technique for the company.
14
(iv) Newinformationsystem
The executive information system (EIS) will bring a number of benefits in decision-making at the strategic level at Mackerel but at certain costs and with certain problems at the operational and strategic levels. The key danger is that the tangible increase in costs is not balanced by the intangible (and difficult to quantify) benefits of the new system.
At the operational level, the data gathering will generate new costs as the expectations of users for immediate update of the system drive demand for less batch input of data. This problem represents an opportunity to automate the input of data in order to fully benefit from real-time data availability.
At the strategic level, the benefits relate to improved decision-making as the EIS should allow drill-down access to the more detailed operational records but the initial presentation of data should be based on the key performance indicators for the company. This system should also be linked to external data sources so that senior management do not fall into the trap of only looking inwards in the organisation at the risk of ignoring wider issues in the business environment (for example, the risks associated with the APV contract such as the effect of the recession and the attitude of government). These will represent new data sources and so again increase the cost of the system.
The new system will increase the amount of information and analysis that it will be possible for senior managers to perform. It will present opportunities for better decision-making using the more up-to-date information. However, it may present the problem of information overload for senior managers. Therefore, the system will need to be designed to give access to only those areas that it is appropriate for any given manager to see.
The data used in decision-making will be more robust as a single database will reduce the problem of redundancy where multiple copies of the same data are held on different systems. This will remove the danger of inconsistencies and reduce the storage required by the company. This benefit will be felt at the tactical level of the company were such data consistency will aid inter-functional communication.
The EIS would allow access to decision support systems such as large spreadsheet models built in order to pull data out of the database for use in forecasting and appraising projects (for example, demand forecasting and risk modelling of the APV contract).
The EIS will also give access to tactical information such as budgets in order to help the executive control the business.
In order to gain the maximum benefit from the new system, executive managers will need to be trained and this training should occur just before the new system is available so that they are in a position to use it immediately.
(v) PerformancemeasuresatMackerel
The proposed new performance measures should be judged against the overall mission which is to maximise shareholder wealth and so optimise total shareholder return (TSR). It should be noted that TSR reflects both dividend returns and capital gains and so deals with both the current performance of the business (current dividend payments) and its expected future performance (as this dictates the share price).
The return on capital employed (ROCE) is calculated on profit before interest and tax divided by capital employed in a project or at the company as a whole. ROCE is a simple, commonly used measure of performance. However, it can encourage delays to investment in new assets since this measure improves as assets are depreciated with age. ROCE has the disadvantage of being based on profit measures of performance rather than cash. Measures such as NPV use cash flows which are less subject to the interpretation of accounting rules and are more directly aligned with shareholder interests. It is unclear that ROCE will align with the overall performance measure of TSR since TSR depends on share price and dividends paid. In particular, the fact that share price is based on a long-term view of dividend prospects makes the use of short period-based measures (such as profit) less valuable.
EVATM is an absolute performance measure. It involves a more complex calculation than ROCE with many adjustments to the accounting figures of profit and net assets, such as the use of replacement costs for asset values and economic depreciation rather than accounting depreciation.
Many of the EVATM adjustments are intended to avoid distortion of results by accounting policies that are present in ROCE. EVATM has the advantage that by treating certain costs as investments it encourages appropriate capital expenditure.
However, EVATM depends on historical data while shareholders will be focused on future performance. Thus, while EVATM is more directly aligned with the objective of increasing shareholder wealth, it too falls short of measuring shareholders’ expectations which are present in the share price.
Conclusions Given the current risk appetites of key stakeholders and economic environment, it is recommended that the design package 1 for
the APV be chosen, as it carries least risk.
The new EIS represents an opportunity to gain considerable strategic advantage provided the costs of the new system are properly understood and controlled.
Neither ROCE nor EVATM represent a perfect match to the company’s main external measure of performance (TSR) due to their backward looking nature. However, EVATM may be closer to the spirit of TSR in measuring increased shareholder wealth.
15
Appendix 1
Variablecost
Steel 11,412 9.4 Tonnes at $1,214 Engine/transmission 9,500 Electronics 8,450 Other 4,810
Labour 13,800 47,972 Payofftable
Demand 500 750 1,000 Maxpayoff Minpayoff Design package 1 4,557,302 6,835,953 9,114,604 9,114,604 4,557,302 2 3,307,302 5,585,953 7,864,604 7,864,604 3,307,302 3 2,057,302 4,335,953 6,614,604 6,614,604 2,057,302 Maximum of the maximum payoffs package 1 9,114,604 Maximum of the minimum payoffs package 1 4,557,302 Regrettable
2 (a) The branch information appears to be inadequate on a number of levels to appraise the shop manager’s performance. The manager should only be held responsible for those areas of performance that they can control.
The branch manager should be appraised on a realistic sales budget. The overall market fall of 12% suggests that the original budget of no change on previous year was not realistic. It is possible to analyse this by calculating planning and operational variances as follows:
$ Revised budgeted sales given market fall 234,080
Budgeted gross margin 60% Revised budgeted gross margin 140,448 Original budgeted gross margin 159,600 Planning variance 19,152 A Actual sales 237,100 Revised budgeted sales 234,080 3,020 F Budgeted gross margin 60% Operational variance 1,812 F
The operational variance reflects more accurately the manager’s work and from this we can see the manager has done well by limiting the fall in gross profit by $1,812.
This analysis could be extended to other areas of the performance report. For example, if the breakdown of sales prices and volumes for individual product lines were given together with details of market volumes and price movements then the sales price variance could be broken down into operational and planning elements to reflect the manager’s use of the limited discounting power that she has. Overall at the Tunny branch, the gross margin has remained constant (at 60%) which indicates that the manager may not have made use of the sales price discounting authority.
There are a number of other non-controllable costs in the branch information. It is unlikely that the branch manager can affect the price variance of heating and lighting costs as the prices are set through central purchasing although they will have some control over usage. The rental cost will reflect head office property management and is not controllable. The manager’s own wages are not controllable although the staff costs will reflect the fact that the manager can choose to work longer hours and so save on part-time staff, therefore a labour efficiency variance would be appropriate.
A revised report would split the costs into two groups (controllable and on-controllable) so that a controllable profit would be shown as well as the overall shop profit. This would be the basic measure of performance of the store. A more detailed understanding of responsibility for the variances would be given by a breakdown of the operational (controllable) and planning (non-controllable) elements of each variance.
Summary The manager’s performance has been good in difficult general economic circumstances since if we exclude the gross margin
planning variance ($19,152A) and allow that the part-time staff costs and marketing costs are controllable then we see that there is a favourable variance in controllable profit of $6,312 ($19,152-$12,840).
17
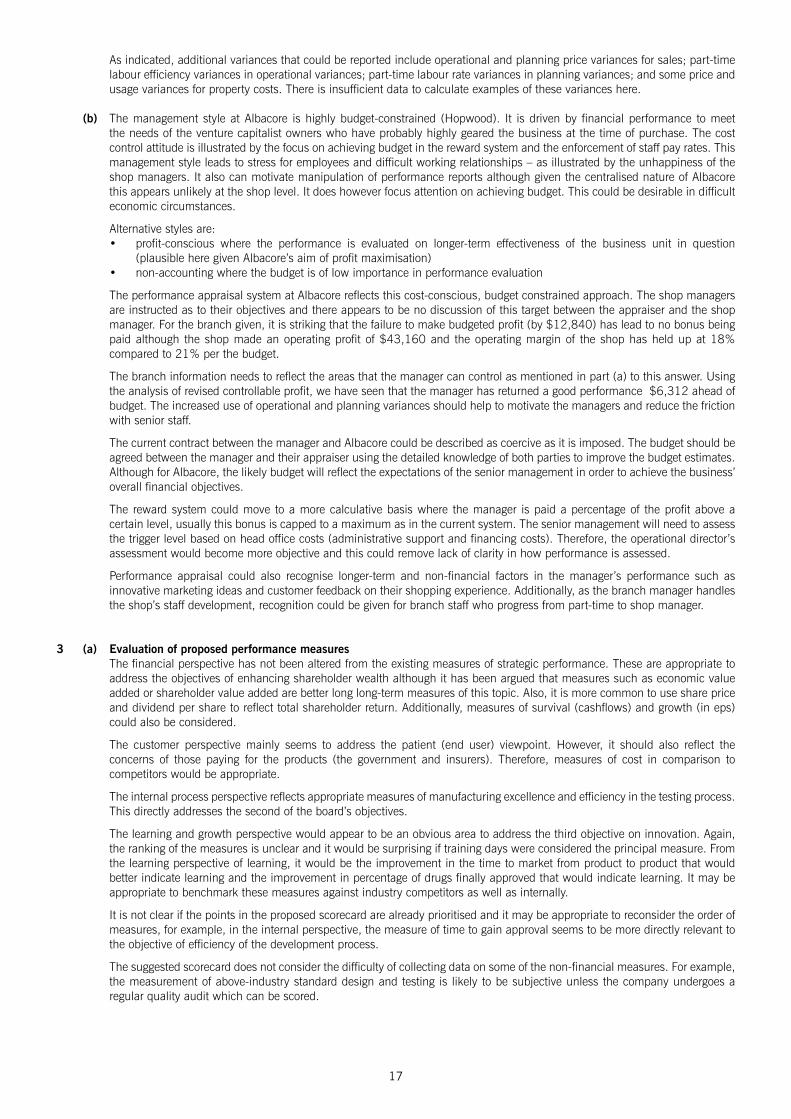
As indicated, additional variances that could be reported include operational and planning price variances for sales; part-time labour efficiency variances in operational variances; part-time labour rate variances in planning variances; and some price and usage variances for property costs. There is insufficient data to calculate examples of these variances here.
(b) The management style at Albacore is highly budget-constrained (Hopwood). It is driven by financial performance to meet the needs of the venture capitalist owners who have probably highly geared the business at the time of purchase. The cost control attitude is illustrated by the focus on achieving budget in the reward system and the enforcement of staff pay rates. This management style leads to stress for employees and difficult working relationships – as illustrated by the unhappiness of the shop managers. It also can motivate manipulation of performance reports although given the centralised nature of Albacore this appears unlikely at the shop level. It does however focus attention on achieving budget. This could be desirable in difficult economic circumstances.
Alternative styles are:• profit-conscious where the performance is evaluated on longer-term effectiveness of the business unit in question
(plausible here given Albacore’s aim of profit maximisation)• non-accounting where the budget is of low importance in performance evaluation
The performance appraisal system at Albacore reflects this cost-conscious, budget constrained approach. The shop managers are instructed as to their objectives and there appears to be no discussion of this target between the appraiser and the shop manager. For the branch given, it is striking that the failure to make budgeted profit (by $12,840) has lead to no bonus being paid although the shop made an operating profit of $43,160 and the operating margin of the shop has held up at 18% compared to 21% per the budget.
The branch information needs to reflect the areas that the manager can control as mentioned in part (a) to this answer. Using the analysis of revised controllable profit, we have seen that the manager has returned a good performance $6,312 ahead of budget. The increased use of operational and planning variances should help to motivate the managers and reduce the friction with senior staff.
The current contract between the manager and Albacore could be described as coercive as it is imposed. The budget should be agreed between the manager and their appraiser using the detailed knowledge of both parties to improve the budget estimates. Although for Albacore, the likely budget will reflect the expectations of the senior management in order to achieve the business’ overall financial objectives.
The reward system could move to a more calculative basis where the manager is paid a percentage of the profit above a certain level, usually this bonus is capped to a maximum as in the current system. The senior management will need to assess the trigger level based on head office costs (administrative support and financing costs). Therefore, the operational director’s assessment would become more objective and this could remove lack of clarity in how performance is assessed.
Performance appraisal could also recognise longer-term and non-financial factors in the manager’s performance such as innovative marketing ideas and customer feedback on their shopping experience. Additionally, as the branch manager handles the shop’s staff development, recognition could be given for branch staff who progress from part-time to shop manager.
3 (a) Evaluation of proposed performance measures The financial perspective has not been altered from the existing measures of strategic performance. These are appropriate to
address the objectives of enhancing shareholder wealth although it has been argued that measures such as economic value added or shareholder value added are better long long-term measures of this topic. Also, it is more common to use share price and dividend per share to reflect total shareholder return. Additionally, measures of survival (cashflows) and growth (in eps) could also be considered.
The customer perspective mainly seems to address the patient (end user) viewpoint. However, it should also reflect the concerns of those paying for the products (the government and insurers). Therefore, measures of cost in comparison to competitors would be appropriate.
The internal process perspective reflects appropriate measures of manufacturing excellence and efficiency in the testing process. This directly addresses the second of the board’s objectives.
The learning and growth perspective would appear to be an obvious area to address the third objective on innovation. Again, the ranking of the measures is unclear and it would be surprising if training days were considered the principal measure. From the learning perspective of learning, it would be the improvement in the time to market from product to product that would better indicate learning and the improvement in percentage of drugs finally approved that would indicate learning. It may be appropriate to benchmark these measures against industry competitors as well as internally.
It is not clear if the points in the proposed scorecard are already prioritised and it may be appropriate to reconsider the order of measures, for example, in the internal perspective, the measure of time to gain approval seems to be more directly relevant to the objective of efficiency of the development process.
The suggested scorecard does not consider the difficulty of collecting data on some of the non-financial measures. For example, the measurement of above-industry standard design and testing is likely to be subjective unless the company undergoes a regular quality audit which can be scored.
18
(b) Stakeholders and their influence The key stakeholders of BDR are the government, the drug companies being tested, the healthcare providers and their funders,
and the patients.
A measure of influence of different stakeholders could be obtained by considering the degree to which they have power to affect decisions in the company and the likelihood that they would exercise their power (their degree of interest in the decisions). (Mendelow’s matrix would be a suitable technique to perform this analysis.)
The government is an influential stakeholder on this basis as they have power over senior appointments and the funding of BDR. They are unlikely to use this power having delegated authority to the trustees, unless they are provoked by some financial or medical scandal.
The drug companies will be highly interested in the day-to-day workings of BDR as it sets the testing environment without which the drug companies will not have products. However, they will have little influence in the decisions within BDR as BDR must be seen to be independent of them. Nevertheless, it is in BDR’s interest to have a successful drug development industry in order to achieve its goal of encouraging new drug development.
The healthcare providers will have interest principally in the quality of the approval process so they can have confidence about the cures that they dispense. They will have limited influence mainly through the pressure that they can bring to bear through the government.
The patients will be concerned that there is innovation as new cures are quickly and safely brought to market. They have limited secondary influence on decisions decision-making in BDR, as for the healthcare providers. Their influence will mainly be felt by affecting the actions of the government.
(c) Differences in the application of the balanced scorecard The objectives at BDR are less obviously financial than at PT. The use of the balanced scorecard approach will be of great
use to BDR as it emphasises non-financial performance which fits with BDR’s objectives relating to quality of drugs and the relationship with key stakeholders. This can lead to difficulty in setting quantifiable measures due to the soft issues involved, e.g. measuring the level of user understanding of the risk/benefit profile of products. There is also the danger of setting quantifiable measures which are then obsessively pursued without regard to the softer aim of the organisation. An example could be the need to encourage drug innovation at the expense of making sure that each new product was a material improvement on existing drug products.
BDR will have a more complex balanced scorecard than PT due to the diverse nature of important stakeholders. As a public service organisation, the customer perspective may be more significant. The principal stakeholder is the government and so there will be a complex, political dimension to measuring performance.
The primary objective at PT is financial while at BDR there are several key objectives among which there is no clear ranking. Stakeholders may have conflicting objectives, for example, patients want effective drugs but the same individuals as taxpayers/insurance premium payers may not be willing to foot the bill if the price is too high. This will lead to difficulties in setting priorities among the various measures identified on the balanced scorecard.
4 (a) Environmental cost categories PLX will need to identify existing and new cost information that is relevant to understanding its environmental impact.
There are conventional costs such as raw material costs and energy costs which should be broadened to include the cost of waste through inefficiency. These and other conventional costs (such as regulatory fines) are often hidden within overheads and therefore will not be a high priority for management control unless they are separately reported.
There are contingent costs such as the cost of cleaning industrial sites when these are decommissioned. These are often large sums that can have significant impact on the shareholder value generated by a project. As these costs often occur at the end of the project life, they can be given low priority by a management that is driven by short-term financial measures (e.g. annual profit) and make large cash demands that must be planned at the outset of the project.
There are relational costs such as the production of environmental information for public reporting. This reporting will be used by environmental pressure groups and the regulator and it will demonstrate to the public at large the importance that PLX attaches to environmental issues.
Finally, there are reputational costs associated with failing to address environmental issues when consumer boycotts and adverse publicity lose sales revenue.
(b) Explanation and evaluation of techniques A lifecycle view consists of considering the costs and revenues of a product over the whole life of the product rather that
one accounting period. For an oil refinery, this might be taken to be the useful life of the refinery. A lifecycle view may take profit or discounted cashflow as the principal measure of performance. This is particularly relevant for PLX given the planned redevelopment programme at the refinery which will highlight the decommissioning costs of such plant. This will aid future long-term investment planning at PLX.
Activity-based Costing (ABC) is a method of detailed cost allocation that when applied to environmental costs distinguishes between environment-related costs and environment-driven costs. At PLX, related costs would include those specifically attributed to an environmental cost centre such as a waste filtration plant while driven costs are those that are generally hidden in overheads but relate to environmental drivers such as additional staff costs or the shorter working life of equipment (in order
19
to avoid excess pollution in the later years of its working life). This will assist PLX in identifying and controlling environmental costs.
Input/output analysis (sometimes called mass balance) considers the physical quantities input into a business process and compares these with the output quantities with the difference being identified as either stored or wasted in the process. These physical quantities can be translated into monetary quantities at the end of the tracking process. Flow cost accounting is associated with this analysis as it reflects the movement of physical quantities through a process and will highlight priorities for efficiency improvements.
These techniques are not mutually exclusive and all can assist PLX in improving performance. However, cost/benefit analysis will need to be undertaken for each of the systems. This will be difficult, as benefit estimates will prove vague given the unknown nature of the possible improvements that may accrue from using the techniques. The non-financial benefits will include a better public image and reduced chance of protest by environmental groups and an improved relationship with the government who is likely to be a key supplier of crude oil to the business. Additionally, ABC and input/output analysis will require significant increases in the information that the management accounting systems collect and so incur increased costs. As a result, the decision to use these techniques is likely to be based on the balance between known costs and estimated strategic benefits of non-financial factors.
(c) Impact of input/output analysis on information systems Input/output analysis will require the information systems to collect not just monetary but also physical measurements of the
materials being processed through the refinery. This may require additional records and costly changes to company’s existing database structures. Systems will have to be put in place to monitor physical volumes of raw materials, waste and recycled material within the refinery’s processes. The collection and use of such information may present a challenge to PLX with its culture of focussing on financial performance measures. The information that will be generated will help to identify efficiency improvements and so drive the profit margin and earnings of the company.
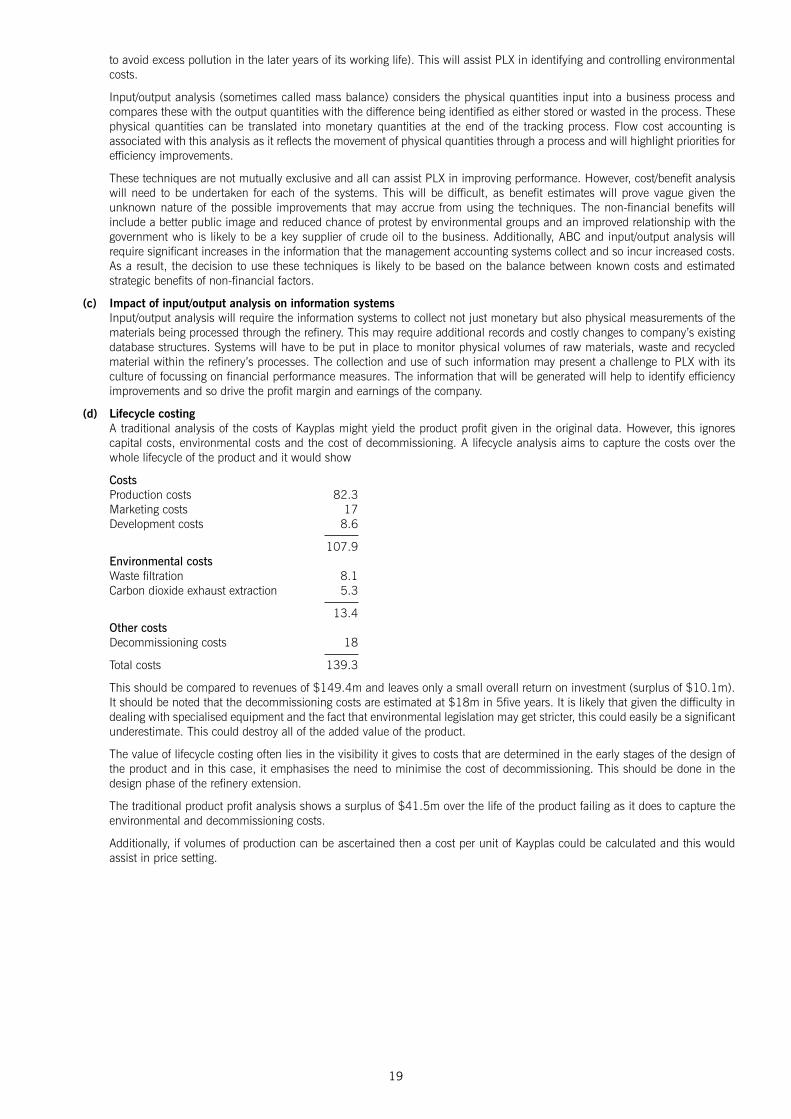
(d) Lifecycle costing A traditional analysis of the costs of Kayplas might yield the product profit given in the original data. However, this ignores
capital costs, environmental costs and the cost of decommissioning. A lifecycle analysis aims to capture the costs over the whole lifecycle of the product and it would show
Costs Production costs 82.3 Marketing costs 17 Development costs 8.6 107.9 Environmentalcosts Waste filtration 8.1 Carbon dioxide exhaust extraction 5.3 13.4 Othercosts Decommissioning costs 18 Total costs 139.3
This should be compared to revenues of $149.4m and leaves only a small overall return on investment (surplus of $10.1m). It should be noted that the decommissioning costs are estimated at $18m in 5five years. It is likely that given the difficulty in dealing with specialised equipment and the fact that environmental legislation may get stricter, this could easily be a significant underestimate. This could destroy all of the added value of the product.
The value of lifecycle costing often lies in the visibility it gives to costs that are determined in the early stages of the design of the product and in this case, it emphasises the need to minimise the cost of decommissioning. This should be done in the design phase of the refinery extension.
The traditional product profit analysis shows a surplus of $41.5m over the life of the product failing as it does to capture the environmental and decommissioning costs.
Additionally, if volumes of production can be ascertained then a cost per unit of Kayplas could be calculated and this would assist in price setting.
20
Pilot Paper P5 Marking SchemeAdvanced Performance Management
Marks1 (i) Appropriate metrics 1 Risk appetites 3 x 0.5 1.5 Identify key stakeholders and risks 3 Risk appetite 3 Demand risk 1 Cost overrun risk 2 Other 1 mark per point made Maximum 9
(ii) Comment on metric used: profit v DCF 1 Variable cost per unit 1 Total cost under each package 2 Cost per unit contract check 2 Revenue 1 Profit total table 2 Maximax calculation 1 Conclusion 0.5 Maximin calculation 1 Conclusion 0.5 Minimax regret calculation 2 Conclusion 0.5 Expected value calculation 1.5 Conclusion 0.5
(Working rounded to thousands is acceptable.)
Describe different methods 4 x 0.5 2 Evaluate methods 4 Maximum 19
(iii) Recommend method 2 Final recommendation on contract 1 Other risk reduction comments 1 Maximum 3
(iv) New information system impacts Operation information gathering up to 3 marks Strategic decision-making Benefits up to 4 Problems up to 3 Maximum 8
(v) Comments on TSR Up to 2 Comments on ROCE Up to 3 Comments on EVATM Up to 3 Maximum 7
Upto4professionalmarks.
Total 50
21
2 (a) Variances Calculations: Flexed budget 1 Operation and planning (1 mark per point up to 4) 4 Controllable profit 1
Revised performance report up to 8 Comments: Structure 1 Revenue budget unrealistic 1 Controllable costs 3 (general 1 specific justifications 2) Controllable profit 1 Other variances up to 5 Maximum 13
(b) Management styles (1 mark per point up to 6) 6 Performance appraisal system (1 mark per point up to 6) 6 Improvements (1 mark per point up to 3) 3 Maximum 12
Total 25
3 (a) 1 mark per point. There is a wide range of good answer points to be made. Points should be made about the measures suggested (whether they cover the perspective intended) and also, if there are other suitable measures. Other marks are for linking the measures to the stated company objectives, commenting on the difficulty of collecting appropriate data and ranking the measures. Maximum of 10 marks.
(b) Up to 2 marks on method of analysis. Up to 2 marks on each stakeholder. Answers must display a consideration of both the power and the likelihood of exercising it in order to score full marks. Maximum of 8 marks.
(c) 1 mark per point. In order to score highly, a candidate must give examples that are relevant to the scenario. Maximum of 7 marks.
(25 marks)
4 (a) Up to 2 marks per cost area discussed. Points must include examples of relevance to the scenario to score full marks. Maximum of 6 marks.
(b) Up to 2 marks per technique – an explanation and its link to environmental performance. 3 marks for an evaluation of the techniques. Maximum of 9 marks.
(c) 1 mark on need for more non-financial information (physical units). 2 marks for comments on sources and difficulties of collecting such information. Maximum of 3 marks.
(d) 2 marks for calculation of lifecycle costs. Up to 2 marks for calculating the product profits of the two approaches. Up to 4 marks for discussion of improvements and issues identified by lifecycle costing. Maximum of 7 marks.