NRELP-432-4981 • UC Category: 233 • DE92016405 Pilot-Scale Stu of the Solar Detoxification o VOC-Contamina Groundwater Mark Mehos, Craig Turchi National Renewable Ener Laborato Jim Pacheco Sandia National Laboratories A.J. Boegel, Tim Merrill, Richard Staey Lawrence Livermore National Laborato h· � . ,-� •I -• •. . . . � - .-- . National Renewable Energy Laboratory (formerly the Solar Energy Research Institute) 1617 Cole Boulevard Golden, Colorado 80401-3393 A Division of Midwest Research Institute Operated for the U.S. Department of Energy under Contract No. DE-AC02-83CH10093 August 1992
Transcript
NREL/TP-432-4981 • UC Category: 233 • DE92016405
Pilot-Scale Stu of the Solar Detoxification o VOC-Contamina Groundwater
Mark Mehos, Craig Turchi National Renewable Energy Laboratory
Jim Pacheco Sandia National Laboratories
A.J. Boegel, Tim Merrill, Richard Stanley Lawrence Livermore National Laboratory
h· � ... ,-� •I !!!!I-• •. . .. .. �-....... -
... National Renewable Energy Laboratory (formerly the Solar Energy Research Institute) 1617 Cole Boulevard Golden, Colorado 80401-3393 A Division of Midwest Research Institute Operated for the U.S. Department of Energy under Contract No. DE-AC02-83CH10093
August 1992
On September 16, 1991 the Solar Energy Institute was designated a national laboratory, and its name was changed
to the National Renewable Energy Laboratory.
NOTICE This report was prepared as an account of work sponsored by an agency of the United States government. Neither the United States government nor any agency thereof, nor any of1heir employees, makes any warranty, express or implied, or assumes any legal liability or responsibility for the accuracy, completeness, or usefulness of any information, apparatus, product, or process disclosed, or represents that its use would not infringe privately owned rights. Reference herein to any specific commercial product, process, or service by trade name, trademark, manufacturer, or otherwise does not necessarily constitute or imply its endorsement, recommendation, or favoring by the United States government or any agency thereof. T h e views and opinions of authors expressed herein do not necessarily state or reflect those of the United States government or any agency thereof.
Printed in the United States of America Available from:
National Technical Information Service U.S. Department of Commerce
5285 Port Royal Road Springfield, VA 22161
Price: Microfiche A01 Printed Copy A03
Codes are used for pricing all publications. The code is determined by the number of pages in the publication. Information pertaining to the pricing codes can be found in the current issue of the following publications which are generally available in most libraries: Energy Research Abstracts (ERA); Government Reports Announcements and Index (GRA and I}; Scientific and Technical Abstract Reports (STAR); and publication NTIS·PR·360 available from NTIS at the above address.
Pilot-scale Study of the Solar Detoxification of VOC-Contaminated Groundwater
Mark Mehos, Craig Turchi National Renewable Energy Laboratory
Golden, Colorado
Jim Pacheco Sandia National Laboratories Albuquerque, New Mexico
A.J. Boege!, Tim Merrill, Richard Stanley Lawrence Livermore National Laboratory
Livermore, California
Presented at: American Institute of Chemical Engineers 1992 Summ"er Annual Meeting, Minneapolis, Minnesota, August 9-12.
ABSTRACT
The Solar Detoxification Field Experiment was designed to investigate the photocatalytic decomposition of organic contaminants in groundwater at a Superfund site at Lawrence Livermore National Laboratory (LLNL). The process uses ultraviolet (UV) energy, available in sunlight, in conjunction with the photocatalyst, titanium dioxide, to decompose organic chemicals into nontoxic compounds. The field experiment was developed by three federal laboratories: the National Renewable Energy Laboratory (NREL), Sandia National Laboratory (SNLA), and LLNL. The U. S. Department of Energy funded the experiment. The objectives of the pilot-scale study included the advancement of the solar technology into a nonlaboratory waste-remediation environment, the compilation of test data to help guide laboratory research and future demonstrations and the development of safe operational procedures. Results of the pilot study are discussed, emphasizing the effect of several process variables on the system performance. These variables include alkalinity, catalyst loading, flow velocity through the reactor, and incident solar UV radiation. The performance of the solar detoxification process are discussed as it relates to concentrating and nonconcentrating collectors.
INTRODUCTION
The ultraviolet (UV) light induced photocatalytic oxidation of organic molecules is a recognized phenomenon [1 ]. The UV light activates the semiconductor catalyst in a process that produces hydroxyl radicals, OH•, as depicted in Figure 1. The oxidation chemistry and potency of the photocatalytic process are similar to other chemical oxidation methods that generate hydroxyl radicals, e.g., UV/hydrogen peroxide and UV/ozone. Given sufficient exposure to hydroxyl radicals, most organic pollutants will oxidize into nontoxic materials, such as carbon dioxide and water. In the case of the commonly found chlorinated solvents, dilute hydrochloric acid is also formed.
1
e-
Recombination
11 Charge
h+
0-2
H20
OH � . Pollutant
Figure 1. Illumination of a semiconductor by UV light results in the production of highly reactive hydroxyl radicals.
The feasibility of using sunlight in conjunction with a photocatalyst to destroy organic water pollutants was demonstrated by researchers in the mid-1980s [2,3,4]. In the solar process, sunlight illuminates the contaminated water contained within a transparent receiver. The catalyst is either suspended as a slurry in the water or supported on a fixed matrix within the reactor. Although the chemistry can be driven by sunlight or UV-lamps, the solar process requires substantially less electric power.
SITE HISTORY
Lawrence Livermore National Laboratory is located outside Livermore, CA, about 30 miles east of the San Fransisco Bay area. Groundwater contamination at LLNL dates from World War II when the facility was a Naval Air Station and training and maintenance facility. Large quantities of trichloroethylene (TCE) and other chemicals were used to clean engine parts during this period and have found their way into the groundwater. As part of the feasibility studies under the Comprehensive Environmental Response, Compensation, and Liability Act (CERCLA), LLNL is currently studying the operation of two UV/hydrogen peroxide treatment facilities to pump and treat the contaminated groundwater plumes resulting from this period. Other types of advanced oxidation systems are being evaluated and planned for testing. The results of the pilot studies will lead to an approved plan for the clean-up of the site.
The solar detoxification field experiment was positioned to draw water from an existing LLNL well pipeline, treat it in the solar-driven system and return it to the pipeline so that it could be processed by the permitted treatment facility before being recharged to the aquifer. Four monitoring wells connected to the pipeline can be run individually or in parallel. This allowed
2
a great deal of flexibility in choosing the water inlet conditions to the solar process (see Table 1).
Table 1. Inlet Groundwater Conditions from Monitoring Wells
Constituent Range
Trichloroethylene 80- 500 ppb
Other Volatile Organic Compounds <10 ppb
Bicarbonate 500 ppm
pH 6.5 - 8.0
EXPERIMENTAL APPARATUS
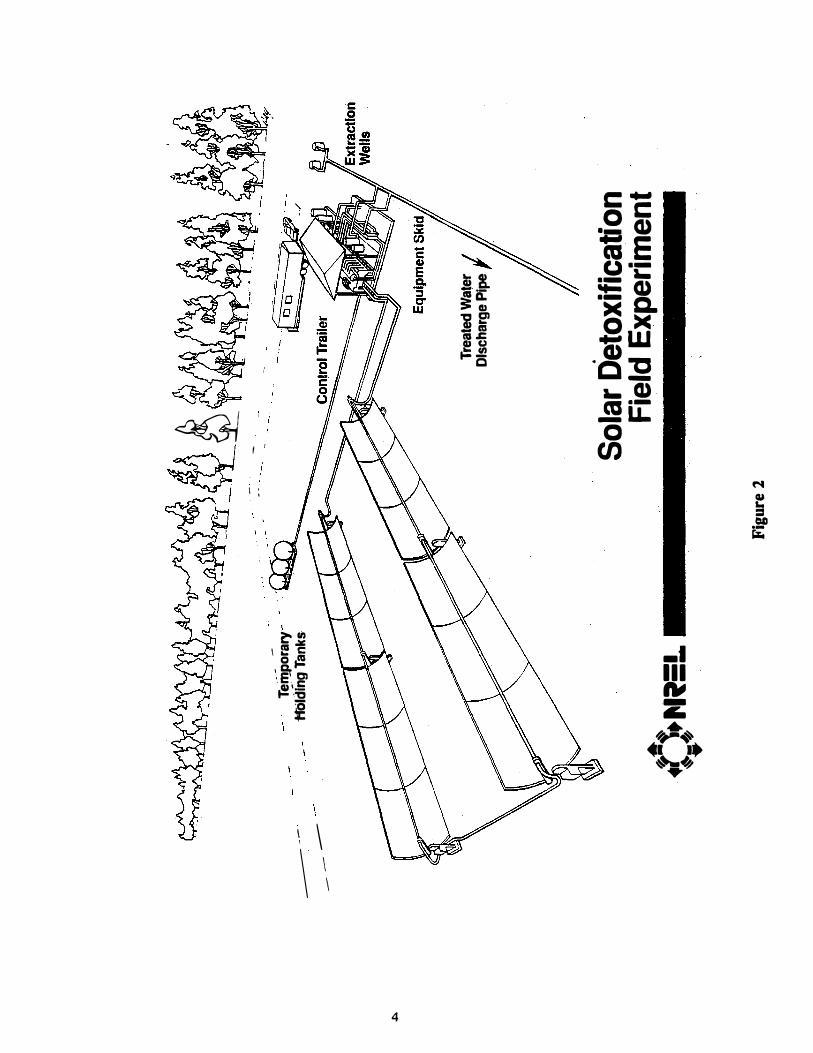
The system at Livermore had three major components: a concentrating solar collector, a photoreactor, and a mobile equipment skid. A sketch of the field experiment is shown in Figure 2 and a simplified operational schematic is provided as Figure 3. In addition, tanks were provided by LLNL for settling the titanium dioxide (Ti02) catalyst and for intermediate storage of the treated water. The collectors for this experiment consisted of two drive strings of commercially-manufactured concentrating parabolic solar troughs. The parabolic troughs were resurfaced for this experiment with a reflective film designed to enhance the UV reflectivity. The solar UV "'Weighted reflectivity of the film was nominally 85%. Each drive string was 120 ft long by 7 ft wide resulting in an aperture area of 840 fe per string. The troughs were aligned on an east-west axis and used a shadow band tracker to keep them properly aligned with the sun during an experiment.
The photoreactor for these experiments consisted of 2 in. i.d. borosilicate glass pipe. The reactors ran along the length of the collectors and were located at the focal point of the parabolic troughs� The effective concentration ratio for this arrangement, including reflective and transmissive losses, was calculated to be approximately 20 based on the width of collector and the half-circumference of the glass pipe.
The third component of the system was the ancillary equipment necessary to support the experiment. This equipment consisted of the main process pump, a 150 gal. tank, tanks and pumps required for pH adjustment and slurry addition, a heat exchanger for maintaining constant temperature, and a control panel. Information such as reactor inlet and outlet pH, inlet and outlet temperature, and rate of flow were logged at 30-s intervals and stored on a computer. In addition, data on both the direct and global-horizontal components of full-spectrum and UV radiation were collected from solar instruments located near the concentrators.
3
:II c.., oc
� ·- G)
�
a;s s!.
u·-3it ·--
Cl) :t::G)
�
i� ><C. -m m'fi o>< .:� a;w
c
�
·c-c -
� I I
a..Gl m·-
_u..
I :
c en
N � a CG �
I f!'CII I m
.:.:: ... c 0� ·.� Cl Cl)iC .-.:c
-·
:0 �
Ill ,._ -... ...
.... � I •• .... ..
\ \ \ \
4
TREATED WATER OUT +-���--------�
GROUND WA TEA �e-+M��t::?il-
IN 1i02
Figure 3. Operational schematic of the field experiment at Livermore
EXPERIMENTAL TEST PLAN AND RESULTS
The test plan for the Livermore field experiment was broken down into the following series of experiments:
Single-pass experiments with groundwater Recirculating batch experiments with TCE-spiked deionized water Recirculating batch experiments with groundwater Recirculating batch follow-on experiments with groundwater
All experiments used a fresh sample of P25 Ti02 purchased from Degussa Corp. During singlepass operation of the experiment, destruction of TCE in the groundwater took place in one pass through the photoreactor. For these experiments, contaminant levels were measured at the inlet and outlet of the photoreactor. In batch operation the contaminated groundwater was recirculated continuously through the photoreactor with samples taken at equal time intervals.
System performance was determined by measuring TCE concentration as a function of on-sun time. For each experiment, samples of the contaminated water were retrieved and stored in 40 mL glass sample vials with Teflon-lined septa. The vials were stored upside down in a closed ice chest and transported to an on-site lab immediately following completion of the experiment. Samples were analyzed as soon as possible, usually within 24 h. The samples were analyzed using a Hewlett-Packard 5880 gas chromatograph (GC) fitted with a electron capture detector. The GC was connected to a Dynatech PTA-30 W/S autosampler which was connected to a 01 Analytical 4460A purge and trap. The limit of detection of TCE for this arrangement is 0.5 ppb
(p.g!L).
5
To maximize the level of destruction of the contaminant, both drive strings were used for the single-pass experiments. All subsequent batch experiments used one· drive string so that a detectable level of contaminant could be maintained over the half-hour test period. The details for each series of experiments are provided below.
Single-pass Experiments with Groundwater
The objective of the single-pass experiments was to verify that destruction of the contaminant to less than 5 ppb (the EPA standard for drinking water) was possible in a single pass through the photoreactor. Prior laboratory tests showed that the high level of bicarbonate would slow the destruction process but that this effect could be offset by a reduction in pH. Therefore, destruction performance tests were performed with and without acid addition to the contaminated groundwater. The Ti02 slurry mete:dng pump was calibrated with water and adjusted before the experiment to yield a catalyst loading of approximately 1.0 giL Ti02 (0.1 wt%) in the contaminated water entering the photoreactor.
•
Table 2 shows the results of the single-pass experiments. Results are shown for two conditions: no pretreatment and adjustment of pH to approximately 5.6 by the addition of dilute HCI. The flow rate through the reactor was maintained at approximately 4 gpm throughout the test, corresponding to a residence time of 10 minutes. The measured catalyst loading was 0.8 to 0.9 giL. The lower than expected loading was due to a change in metering capacity due to pumping a concentrated slurry rather than ordinary water.
Table 2. Single-pass Experiments with and without Acid Addition
Inlet [TCE] pH Outlet [TCE] (ppb) (ppb)
107 7.2±0.1 10
106 5.6±0.5 <0.5
Recirculating Batch Experiments with TCE-spiked Deionized Water
The objective of the slurry baseline experiments was to establish a baseline TCE reaction rate in Ti02 water slurries for comparison with other outdoor experiments and with later groundwater experiments. These experiments were run at noon using TCE spiked deionized water with initial concentrations representative of the LLNL groundwater (=200 ppb).
Prior to the baseline experiments, a series of leak tests and headspace-liquid equilibrium experiments were performed to ensure that loss of the contaminant was due solely to destruction by the solar detoxification process. Initial leak tests indicated a loss of TCE in the system even though the trough concentrators were stowed (aimed at the ground). A rigorous search for the "leak" led to the discovery that transmission of ambient UV through the translucent piping used in the experiment and through the stowed photoreactors was decomposing the contaminant before
6
the trough concentrators focused sunlight onto the photoreactors. To eliminate the problem, all piping was wrapped with black plastic. The photoreactors were simiiarly covered until the concentrator was focused on-sun. Subsequent leak tests quantified that the system operated properly and that the decreasing concentrations of TCE were due soley to photocatalytic oxidation.
The data for one of the baseline tests are shown in Figure 4. The experiment was run with TCE-spiked deionized water at a flow rate of 30 gpm through the reactor and a catalyst loading of 1.0 giL Ti02• The baseline test was performed near solar noon. For comparison, the baseline result is plotted with the results for two destruction tests for TCE in Livermore groundwater. In Figure 4, the concentration of TCE is plotted as a function of exposure time - that is the amount of time the water was contained in the photoreactor tubes. Details of the groundwater experiments are provided in the next section.
Figure 4. Baseline deionized water destruction tests at the field experiment at Livermore
The reaction rate for TCE in deionized water is rapid so essentially complete destruction was achieved in only one pass through the photoreactor. In such cases the performance of a recirculating system is independent of reaction rate (see the appendix for details of the model used to describe this system). Figure 4 shows destruction rate if complete destruction is obtained just before the end of the photoreactor. If destruction is achieved at an intermediate point inside the photoreactor the remaining portion of the reactor would be inactive. Therefore, the curve for deionized water in Figure 4 may represent an upper bound for the required exposure time.
Recirculating Batch Groundwater Experiments
The objective of the slurry groundwater experiments was to establish TCE destruction rates in
7
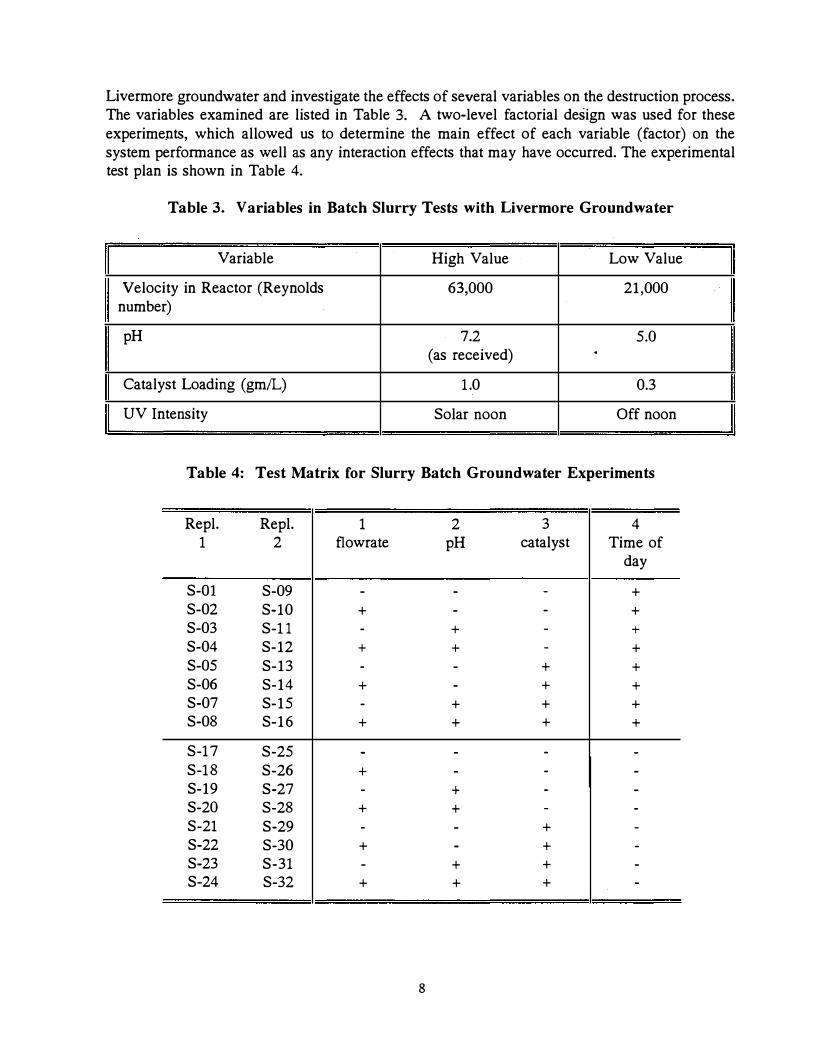
Livermore groundwater and investigate the effects of several variables on the destruction process. The variables examined are listed in Table 3. A two-level factorial design was used for these experiments, which allowed us to determine the main effect of each variable (factor) on the system performance as well as any interaction effects that may have occurred. The experimental test plan is shown in Table 4.
Table 3. Variables in Batch Slurry Tests with Livermore Groundwater
Variable High Value Low Value
Velocity in Reactor (Reynolds 63,000 21,000 number)
pH 7.2 5.0 (as received) .
Catalyst Loading (gm/L) 1.0 0.3
UV Intensity Solar noon Off noon
Table 4: Test Matrix for Slurry Batch Groundwater Experiments
Repl. Repl. 1 2 3 4 1 2 flowrate pH catalyst Time of
Because it was not possible to rigidly control light intensity, all tests were run to investigate the variation in the first three factors around solar noon. An additional test was run in the mornings, thus pro�iding several pairs of runs differing only in UV intensity. Two replicates of each test were run to determine the experimental error. This resulted in a total of 32 experiments.
Because the field reactor displayed high conversions per pass, a numerical model was used to account for the effect of mixing the batch tank. First-order kinetics proved adequate for describing the observed reaction kinetics. Details of the model are provided in the appendix. A comparison between the experimental data for the noon and off-noon tests and the model is shown in Figures 5 and 6. The results of this comparison indicate that the model provides a good representation of the system behavior.
Noon Tests
1.0
0.8
0.2
0.2 0.4 O.B 0.8 1.0 (C/Co)r.a
1.0
0.8
I o.a (j• 9: 0.4
0.2
Off.:Noon Tests
0.2 0.4 0.6 0.8 1.0 (C/Co)r.a
Figures 5 and 6. Comparison of measured data with model for Livermore groundwater experiments
Figure 7 shows the first-order rate constants for the noon experiments where each bar shown is the average of two replicate runs. An estimate of the error for each experiment was obtained by analyzing the variation in the duplicate experiments for all the different test conditions. As seen in the figure, lowering the pH of the groundwater significantly improved the performance of the destruction process. This improvement was likely due to the elimination of hydroxyl-scavenging bicarbonate ions, which are converted to C02 at the lower pH. Catalyst loading and velocity effects were negligible.
9
Rate Constant (1/min) 1"6
L - Low Value H - High Value
Ve L
·············E�i�'r }···
pH L H L L H H Loading L L L L H H H H
Figure 7. First-order rate constants for noon groundwater experiments. Each bar represents the average of two replicate experiments.
Figure 8 shows the first-order rate constants for the series of off-noon experiments. As seen in the figure, the estimated error for this series is approximately twice that of the noon experiments. However, the trends indicated in the figure reproduce those found in the noon experiments described above.
Figure 8. First-order rate constants for off-noon groundwater experiments. Each bar represents the average of two replicate experiments.
10
• Solar detoxification can reduce TCE in groundwater to levels below those required to meet drinking water standards in single-pass operation.
·
• Lowering pH offsets the deleterious effects of high bicarbonate levels and can substantially improve performance. This is evidence that common, nonhazardous components like bicarbonate can likely be dealt with successfully.
• Catalyst loading and velocity through the photoreactor had a negligible effect on performance over the range these parameters were tested.
• Results from a single experiment indicated that a one-sun configuration performed eight times better than the concentrator configuration when results were normalized by sunlight collection area.
NREL and SNLA are planning additional field experiments and demonstrations of the solar detoxification process for groundwater and industrial waste water applications. These systems will use photoreactors developed by industry. Future work should include an investigation of the lifetime of supported catalysts in continuous contact with groundwater. In addition, filtration options for Ti02 slurries in large-scale systems should be tested if they are to be considered as a viable alternative to the use of supported catalysts. The information gained through the first field experiment has been valuable and will pave the way for these future demonstrations and the eventual commercialization of the solar detoxification technology.
Appendix: Modelling Recirculating Batch Reactors
The Solar Detoxification Field Experiment was frequently operated in a recirculating batch mode as depicted in Figure Al. In this scheme, the fluid is continuously recirculated between a reactor zone and a tank in which no reaction occurs. In the general case this system can be modeled as a plug flow reactor and a perfectly mixed tank connected in a loop. For most laboratory-scale systems, the amount of conversion of reactant per pass through the reactor is small, and the concentration throughout the system is relatively constant. In that case, the entire system can be easily modeled as a simple batch system in which only a fraction (i.e., the part in the reactor) of the total mixture is undergoing reaction.
13
Pllotule<�ctol
C1(t)
Batch Tank
Figure Al. Schematic of a recirculating batch system
C2(t)
In the large field system, the amount of conversion per pass through the reactor is appreciable. As the relatively clean water exiting the reactor is mixed with the "dirty" water in the batch tank the resulting water sent to the reactor has a lower concentration. Because rate usually decreases as concentration decreases, the overall rate in the reactor suffers. Thus, unless properly accounted for, the presence of the tank will alter the perceived performance of the photoreactor [8].
As stated initially, the recirculating batch system can be modeled as a plug flow reactor and a perfectly mixed tank connected in a loop. In the steady-state case, the reactor outlet concentration at time t, Clt), is determined from the inlet concentration (which does not change with time) and the reaction kinetics. However, because the system is a transient process, one cannot use the normal steady-state plug flow reactor equation to model the photoreactor. Because the inlet concentration changes with time, Clt) is defined by what went into the reactor one residence time prior to t, Clt--r), and the kinetics. The batch tank is still modeled as a wellmixed tank. Solving these equations is more difficult than the low-conversion-per-pass case and a numerical routine is required to fit the data from the batch tests in the Field Experiment. This routine also takes into account the volume of the piping between the reactor outlet and the batch tank.
If the goal is to determine the true kinetic performance of a reactor, one can correct for effects of a mixing tank. Yet in a full-scale system, where the goal is to obtain the best possible performance, mixing water from the reactor outlet in a large batch tank will decrease the overall processing rate. Thus, if a full-scale system operates in a recirculating mode it is desirable to minimize the size of or eliminate the batch tank.
Laboratory and literature data suggest that the photocatalytic process may be more efficient at lower UV light intensity. To test this possibility with the groundwater at Livermore, an experiment was performed to compare the destruction rate of TCE under "one-sun" illumination with rates observed using the concentrated light produced by the parabolic troughs. Both strings of photoreactors were used for this experiment. The concentrating solar arrays were positioned horizontally (pointed at the zenith). In this position, the troughs do not concentrate the incident direct-beam UV radiation onto the photoreactor. As with the concentrated UV experiments, both direct-normal and diffuse UV radiation illuminated the side of the photoreactor facing the sun. The results are shown in Figure 9 in the form of system throughput, defined as the maximum allowable flow rate per square meter of aperture area to maintain destruction of TCE from an initial concentration of 200 ppb to a final concentration of 5 ppb. The normalized aperture areas for the concentrator and one-sun configuration are based on the width of the concentrator and the diameter of the photoreactor, respectively. •
Figure 9. Performance of one-sun versus concentrating photoreactor for treatment of Livermore groundwater
When adjusted for the different aperture areas of the two arrangements, the one-sun system performed, eight times better than the concentrating system. This large difference is likely due to three effects: a) elimination of concentrator reflectance losses, b) ability of the one-sun system to capture more diffuse light, and c) improved catalyst efficiency at lower light intensities [1,5,6].
Recirculating Batch Follow-on Experiments -Effect of Bicarbonate
As shown previously, adjustment of the pH had a large impact on system performance. The
11
improved performance at lower pH is believed to result from the reduction in the concentration of bicarbonate ion, a known scavenger of hydroxyl radicals. By reducing pH, the bicarbonate equilibrium is shifted toward dissolved carbon dioxide. Changing from pH 7.2 to pH 5.0 reduces bicarbonate levels by 95%.
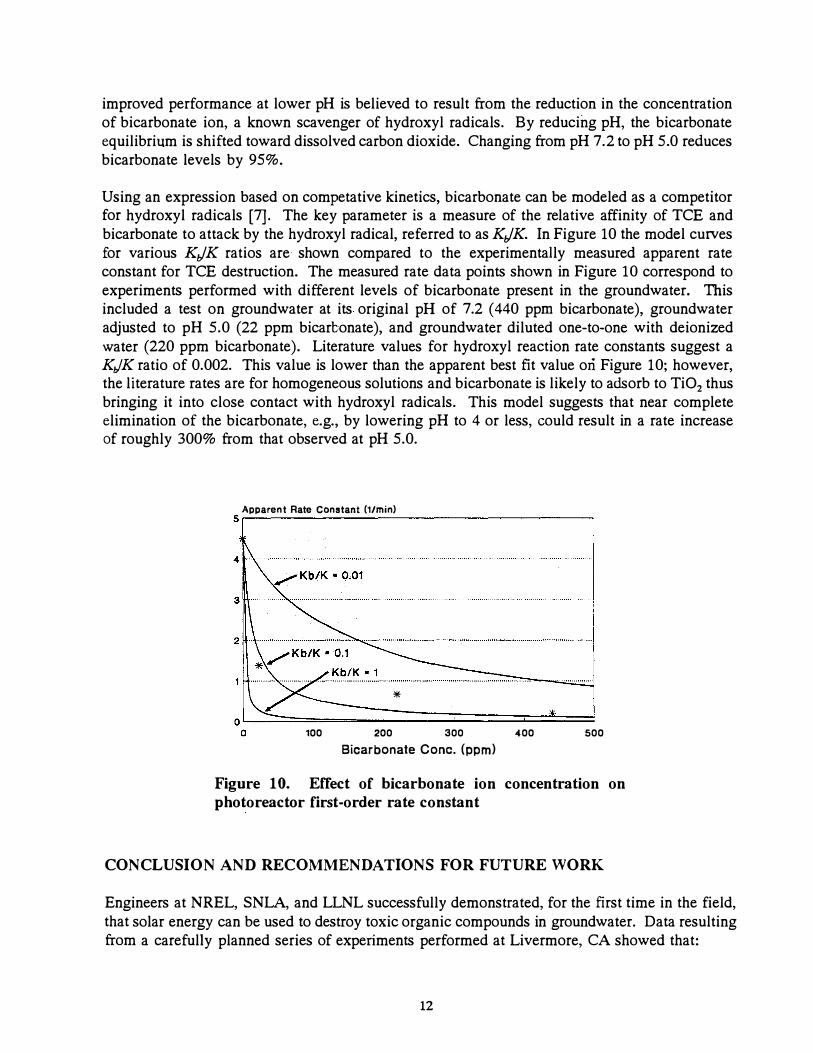
Using an expression based on competative kinetics, bicarbonate can be modeled as a competitor for hydroxyl radicals [7]. The key parameter is a measure of the relative affinity of TCE and bicarbonate to attack by the hydroxyl radical, referred to as K,jK. In Figure 10 the model curves for various K,jK ratios are shown compared to the experimentally measured apparent rate constant for TCE destruction. The measured rate data points shown in Figure 10 correspond to experiments performed with different levels of bicarbonate present in the groundwater. This included a test on groundwater at its original pH of 7.2 ( 440 ppm bicarbonate), groundwater adjusted to pH 5.0 (22 ppm bicarbonate), and groundwater diluted one-to-one with deionized water (220 ppm bicarbonate). Literature values for hydroxyl reaction rate constants suggest a KJK ratio of 0.002. This value is lower than the apparent best fit value orl Figure 10; however, the literature rates are for homogeneous solutions and bicarbonate is likely to adsorb to Ti02 thus bringing it into close contact with hydroxyl radicals. This model suggests that near complete elimination of the bicarbonate, e.g., by lowering pH to 4 or less, could result in a rate increase of roughly 300% from that observed at pH 5.0.
Figure 10. Effect of bicarbonate ion concentration on photoreactor first-order rate constant
CONCLUSION AND RECOMMENDATIONS FOR FUTURE WORK
Engineers at NREL, SNLA, and LLNL successfully demonstrated, for the first time in the field, that solar energy can be used to destroy toxic organic compounds in groundwater. Data resulting from a carefully planned series of experiments performed at Livermore, CA showed that:
12
Mathematical Formulation
The defiping equations for the system components shown in Figure A1 are given by basic chemical engineering principles [9]. For the plug flow reactor
(1)
In the batch process, both concentrations vary with time, that is, C1 = C/t) and C2 = Cit). Solution for Clt) and Cit) for all t can be obtained if one defines three different time regimes as follows.
Regime 1: t = 0 (Reactor exposed to sunlight at t = 0). By definition we have C1 = C2 = C0•
Regime 2: 0 < t < -rR. Under these conditions the fluid exiting the reactor has been illuminated for less than one complete reactor residence time. In equation (1) the time spent in the reactor is equal to t, and the starting concentration is C 0, thus
(lb)
Regime 3: t C!: -rR. Now the fluid exiting the reactor has been illuminated for one complete residence time and -rR * = -rR. However, to solve for the reactor outlet concentration at time t, one must know what went into the reactor at time t - -rR. This defines the lower limit on the rate integral:
(lc)
Having defined these three regimes we now write the material balance over the wellmixed tank:
(2)
It now remains only to couple equation (2) with the different forms of equation (1). To do this we must define the rate expression. A simple first order rate expression was found to fit the field experiment data quite well. Therefore we assume
z = -kc . (3)
The solution algorithm solves equation (1) for C/t) as a function of C2 at the different time
15
regimes using first-order kinetics (equation 3). This expression for Cz(t) is substituted into equation (2) and the value for Cit) predicted. This prediction is then compared to the experimental values for the concentration in the batch tank. Finally, one iterates until a k value which provides the best fit to the data is obtained. These first order rate constants are plotted in Figures 7 and 8.
NOMENCLATURE
Co Initial reactant concentration in the system C1 Reactant concentration at the reactor outlet C2 Reactant concentration in the batch tank and at the reactor inlet k First order rate constant Q Recirculation flowrate r Rate of reactant destruction t Time -cR Residence time in the reactor
Vr Volume of the batch tank
REFERENCES
1. Ollis, D.F., E. Pelizzetti, and N. Serpone, "Photocatalyzed Destruction of Water Contaminants," E nviron. Sci. Techno/., 25, 1523 (1991).
2. Ahmed, S., and D.F. Ollis, "Solar Photoassisted Catalytic Decomposition of the Chlorinated Hydrocarbons Trichloroethylene and Trichloromethane," Solar Energy, 32, 597 (1984).
3. Matthews, R., "Photo-oxidation of Organic Material in Aqueous Suspensions of Titanium Dioxide," Water Res., 20, 569 (1986).
4. Barbeni, M., M. Morello, E. Pramauro, E. Pelizzetti, M. Vincenti, E. Borgarello, and N. Serpone, "Sunlight Photodegradation of 2,4,5-Trichlorophenoxy-acetic acid and 2,4,5-Trichlorophenol on Ti02," Chemosphere, 16, 1165 (1987).
5. Okamoto, K., Y. Yamamoto, H. Tanaka, and A. Itaya, "Kinetics of Heterogeneous Photocatalytic Decomposition of Phenol over Ti02 Powder," Bull. Chem. Soc. Jpn. , 58, 2023 (1985).
6. D'Oliveira, J.-C., G. Al-Sayyed, and P. Pichat, "Photodegradation of 2- and 3-Chlorophenol in Ti02 Aqueous Suspensions," E nviron. Sci. Techno/. , 24, 990 (1990).
7. Turchi, T.S. and D.F. Ollis, "Mixed Reactant Photocatalysis: Intermediates and Mutual Rate Inhibition," J. Catalysis, 119, (1989).
8. Wolfrum, E. and C.S. Turchi, "Comments on Reactor Dynamics in the Evaluation of Photocatalytic Oxidation Kinetics," J. Catal., in press.
9. Levenspiel, 0., Chemical Reaction E ngineering, John Wiley & Sons, New York, p. 99 ff, p. 452, 1962.