Piloting OU Analyse and the Student Probabilities Model on 12 STEM Modules Full Report 1. Introduction In the UK, and elsewhere, changes in the higher education policy environment, such as the introduction of the Teaching Excellence Framework (TEF), over the last decade have placed increasing emphasis on reporting, understanding and improving the student experience at universities. At the same time, increased use of online and onscreen education has meant that far more data is available than ever before. Educators have been encouraged to engage with learning analytics in order to better understand their students and explore the promised potential of these new technologies (Clow, 2012) as well as offering personalisation and adaptability to cater for individual student needs (Lodge, Horvath & Corrin, 2019). Further, considerable work has gone into exploring the benefits to be gained from visualising learning analytics in meaningful and interpretable ways (Dalziel et al, 2016; Olney, Rienties and Toetenel, 2019) and as a result tertiary education institutions have devoted significant resources to developing and evaluating learning analytics approaches that might empower educators to provide better academic support for their students, increase satisfaction and improve retention. However, despite this widely reported promise, it is worth recognising that learning analytics effectiveness and deployment come with caveats. For some they offer both opportunities and challenges (Daniel, 2015) and, as part of a range of tools assisting in the ‘ongoing digitizations of higher education’ are best framed by others in ‘problematic - rather than celebratory – terms’ (Castaneda and Selwyn, 2018). 2. Institutional Background In recent years the Open University has been at the forefront of developing many different learning analytics approaches. In 2014, as part of a large suite of initiatives to provide support to its diverse learners, the OU introduced a significant project called The Analytics Project. This project, which had a budget of £2 million, was mandated to attempt to better understand how learning analytics could be developed, tested and applied on an institutional scale. Consulting widely with students, teachers, management and academics one output of the Analytics Project included the development of a hands-on support structure, called the Analytics4Action (A4A) Framework, designed to help academics make informed design alterations and interventions to modules based upon learning analytics data presented in a range of different dashboards (Rienties, et al, 2018; Hidalgo, 2018). Another was the development of the first Ethics Policy on Learning Analytics in the tertiary education sector (Slade & Boroowa, 2014). Other work has concentrated on embedding the findings from the Open University Learning Design Initiative (OULDI) in design approaches and includes the application of an Activity Types Classification Framework to module curriculum across the OU (Conole, 2012). The systematic gathering, visualising, and interpreting of pedagogically informed learning analytics has allowed for important research to
Transcript
Piloting OU Analyse and the Student Probabilities Model on 12 STEM Modules
Full Report
1. Introduction In the UK, and elsewhere, changes in the higher education policy environment, such as the introduction of the Teaching Excellence Framework (TEF), over the last decade have placed increasing emphasis on reporting, understanding and improving the student experience at universities. At the same time, increased use of online and onscreen education has meant that far more data is available than ever before. Educators have been encouraged to engage with learning analytics in order to better understand their students and explore the promised potential of these new technologies (Clow, 2012) as well as offering personalisation and adaptability to cater for individual student needs (Lodge, Horvath & Corrin, 2019). Further, considerable work has gone into exploring the benefits to be gained from visualising learning analytics in meaningful and interpretable ways (Dalziel et al, 2016; Olney, Rienties and Toetenel, 2019) and as a result tertiary education institutions have devoted significant resources to developing and evaluating learning analytics approaches that might empower educators to provide better academic support for their students, increase satisfaction and improve retention. However, despite this widely reported promise, it is worth recognising that learning analytics effectiveness and deployment come with caveats. For some they offer both opportunities and challenges (Daniel, 2015) and, as part of a range of tools assisting in the ‘ongoing digitizations of higher education’ are best framed by others in ‘problematic - rather than celebratory – terms’ (Castaneda and Selwyn, 2018).
2. Institutional Background
In recent years the Open University has been at the forefront of developing many different learning analytics approaches. In 2014, as part of a large suite of initiatives to provide support to its diverse learners, the OU introduced a significant project called The Analytics Project. This project, which had a budget of £2 million, was mandated to attempt to better understand how learning analytics could be developed, tested and applied on an institutional scale. Consulting widely with students, teachers, management and academics one output of the Analytics Project included the development of a hands-on support structure, called the Analytics4Action (A4A) Framework, designed to help academics make informed design alterations and interventions to modules based upon learning analytics data presented in a range of different dashboards (Rienties, et al, 2018; Hidalgo, 2018). Another was the development of the first Ethics Policy on Learning Analytics in the tertiary education sector (Slade & Boroowa, 2014). Other work has concentrated on embedding the findings from the Open University Learning Design Initiative (OULDI) in design approaches and includes the application of an Activity Types Classification Framework to module curriculum across the OU (Conole, 2012). The systematic gathering, visualising, and interpreting of pedagogically informed learning analytics has allowed for important research to
take place on how design choices can impact on the student experience. (Nguyen et al, 2017; Rienties & Toetenel, 2016). The OU has also been exploring the use of predictive learning analytics to try and guide early interventions with students who might be considered ‘at risk’ of not submitting assessment pieces or completing a module (Hlosta et al, 2015; Calvert, 2014). To do this the Early Alert Indicators (EAI) project has been set up as a test and learn project with the goal of advising the University how on how it might best use predictive analytics in the future and to generate evidence of what works and what does not in this field. Whilst is was established in 2016, work on predictive analytics predates the establishment of the EAI project and is not confined to it. This continuing work is the responsibility of the Data & Insights team which sits in the Chief Information Officer (CIO) portfolio. In this report we use the term learning analytics, and its acronym LA, in accordance with the widely accepted definition provided at the First International Conference on Learning Analytics (LAK 2011):
Learning analytics is the measurement, collection, analysis, and reporting of data about learners and their contexts, for the purposes of understanding and optimizing learning and the environments in which it occurs.
A subset of this definition can be seen in the more recent development of predictive learning analytics (PLA) that uses machine learning and artificial intelligence approaches to predict student behaviour and/or outcomes. We have attempted to be scrupulous in our use of the terms here, in particular to avoid confusion that engagement with LA in the EAI dashboard necessarily equates to engagement with the PLA. One does not necessarily follow the other. 11 STEM module teams and their tutors were given access to the EAI dashboard and the 3 types of LA in it: 1. TMA submission scores (PI level for tutor group) and rates of submission (aggregated for
module level) 2. VLE engagement data (PI level for tutor group and aggregated for module level) 3. PLA generated on a weekly basis by OU Analyse (OUA) machine learning algorithms that
predict whether or not a student will submit their next tutor-marked assignment (TMA). The EAI dashboard uses a traffic light system to pinpoint in red students who are predicted not to submit their next TMA, in amber those who are likely not to submit their next TMA, and in green those who are predicted to submit. OUA predictions are based largely on the basis of successful students’ engagement with particular VLE components of the same module on past presentations, thus creating a module ‘fingerprint’. (Hlosta et al, 2015)
11 of the 12 modules in this project piloted the use of the EAI dashboard. The EAI project has also been tasked with expanding the use of the Student Probability Model (SPM) which produces predictions of whether an individual student will reach specific milestones (different points in a module presentation or between modules) such as completing and passing a module or returning in the next academic year. Predictions or probabilities in the SPM are based on models generated through logistic regression of a set of 70 explanatory variables. These predictions are generated at the start of the module and can be updated at different points during the presentation.
One of the 12 modules in this project piloted the use of the SPM by providing periodic updates to tutors via emailed spreadsheets, without the involvement of the EAI project (Chicot et al, 2018). During the course of the Piloting OU Analyse and the Student Probabilities Model on 12 STEM Modules the EAI project was also working towards introducing the SPM into the EAI dashboard. The inclusion of SPM in the EAI dashboard, and its use, is outside the scope of this study. Thus, the OU finds itself awash with learning analytics, predictive data models, learning design data, as well as management and business information dashboards. These analytics may potentially allow for fine grained analysis and evidence-based interventions, but they also provide a complex and complicated institutional background with competing aims and advice for practitioners.
3. Aims and objectives
The eSTEeM project Piloting OU Analyse and the Student Probabilities Model on 12 STEM Modules was established in November 2017 and aimed to explore whether, and how, learning analytics tools, such as the EAI dashboard, could contribute to one of the four STEM Retention and Progression Plan 2017/18 priorities set to assist STEM in reaching its institutional targets.
This priority, the use of data and analytics, is broken down further into 3 proposed aims:
1. Proactive support of ‘at risk’ students using appropriate data (e.g. predictive models and student behaviour real-time data)
2. Systematic use of data/analytics to inform and evaluate retention and progression activities 3. A single source of actionable data aligned with internal and external quality assurance
requirements
Evaluation of OUA in the past has previously concentrated on attempting to link the use of the EAI dashboard to retention figures with mixed results. Pilots conducted in 2015/16 demonstrated that student performance was positively associated with higher levels of tutor use of OUA predictive data. The larger scale 2016/17 pilot also showed mixed results. Some aspects of student performance were positively correlated with tutors who were categorised as ‘high usage’ users of the EAI dashboard. Students supported by ‘high usage’ tutors achieved statistically significant higher TMA scores, but there was no evidence of increases either in EMA scores or module pass rates. (Rienties et al, 2017)
Evaluation by the EAI project of student performance data on piloting modules in 2017/18 also supported the previous findings that students whose tutors engaged repeatedly with the EAI dashboard displayed better completion and pass rates than those who did not. (Herodoutou unpublished, 2019b) However, interpretation of this data is not straight forward. For example, correlation in one aspect of better performance does not necessarily imply causation. It is quite plausible that more attentive ALs are more likely to use LA more frequently rather than the LA themselves being the cause of improved performance.
Problems with conflation of data sets are also apparent in these studies. Since (as noted above) the EAI dashboard contained historical VLE engagement data and TMA submission scores & rates of submission as well as OUA PLA, it does not necessarily follow that engagement with the EAI dashboard equates to engagement with OUA PLA. Tutors may have only been using the dashboard to access the other data sets. Also, overall low levels of tutor engagement with the dashboard were identified as an issue. In interviews with 20 ‘educational stakeholders’ from different areas of the OU (senior management x6, student engagement x4, tuition delivery x6, and student support x4) this slow uptake
of both OUA PLA and SPM PLA was linked to a lack of strong evidence that proves the effectiveness of either model to support students at risk. The same study also found that competing managerial priorities contributed to this slow uptake and nine recommendations were made. (Herodoutou et al, 2019a)
We sought to manage this project from inside STEM where we have a greater level of buy-in from module teams and were able to position ourselves as a more neutral observer, interested in the teaching and learning aspect of LA. We did, however, work closely with the EAI project team who did the technical set-up, delivered the tutor training and played an ongoing advisory role for some module teams. The STEM-based project team was comprised of:
➢ Carlton Wood – Associate Dean, Student Experience ➢ Steve Walker – Staff Tutor, Computing & Communications ➢ Tom Olney – Senior Manager, Learning & Teaching ➢ Maria Kantirou – Head of Student Success ➢ Anactoria Clarke – Senior Manager, Curriculum Innovation ➢ Moira Dunworth - Tutor
The Piloting OU Analyse and the Student Probabilities Model on 12 STEM Modules project focused on trying to establish recommendations about the incorporation of LA, and its subset PLA, into existing academic and student support practices currently provided by module teams and tutors. Whilst the project was not designed to explicitly address the aims of the STEM Retention and Progression Priority 3: use of data and analytics, there are clear and obvious crossovers. As such, later sections of this report attempt to shed some light on questions of how and when tutors and module teams might best make use of LA to identify students ‘at risk’ and the contribution LA might play in questions of retention and progression.
4. Methodology
4.1 Outline In order to evaluate Piloting OU Analyse and the Student Probabilities Model on 12 STEM Modules we took an explicitly realist approach addressing the question ‘what works, for whom, in what circumstances’ As outlined in both the introduction and aims and objectives above, the evidence on the effectiveness of using LA and PLA as the basis for interventions is mixed. This suggests that, at the very least, using data to support students is not a straightforward process. In part this is because organisational information systems are complex systems combining the human, the organisational and the artefactual (software, hardware, etc.). Determining ‘success’ and attributing cause and effect is often difficult. Piloting OU Analyse and the Student Probabilities Model on 12 STEM Modules drew on approaches from the social informatics approach to studying information technology, which views technological artefacts as inextricably bound up with organisational and social practice and culture. One consequence of this approach for evaluation is to recognise that different actors and stakeholders will often have different understanding of what even constitutes success.
Importantly, the emphasis in this approach is on how the use of LA produces outcomes (i.e. the practices of the tutor or module team in using the data and how/whether this contributes to improving student success). Both social informatics and realist evaluation recognise the messiness and complexity of the social world and importantly, that what works well for some actors, in some contexts, may not work for other actors or in other contexts. Our strategy, then, considered the context, mechanisms and outcomes of the introduction of LA:
- Context: Of particular interest are the specific contexts of the focus modules in terms of their pedagogies, assessment strategies, learning designs, presentation patterns and delivery platform choices. This could also refer to the context the module team or tutors find themselves in at the time of providing feedback. For example, the time available to them to engage with learning analytics, prior experience, and module content are all relevant here.
- Mechanisms: How and when do tutors and module teams use LA in their practice, and why do they do it this way? This includes mechanisms that may realise or suppress the incorporation of LA into participants practice. Issues around payments and contracts, performance monitoring, data trust and quality are all relevant here.
- Outcomes: are there patterns in the outcomes? To what extent are they realistic and achievable? To what extent have they been realised? Is it possible to link stated outcomes to context and mechanisms?
With these theoretical underpinnings in mind, the practical implementation of collecting interpretable and useful data from the two different user groups, tutors and module teams, for Piloting OU Analyse and the Student Probabilities Model on 12 STEM Modules, consisted of two slightly different approaches. Thus, they are separated below for simplicity:
4.2 Tutors 7 tutors who were not part of the larger study were initially interviewed as part of a preliminary, small-scale study to establish how tutors use the data available to them to identify students who might be at risk of non-completion of a module, and how they intervene to support these students. In line with realist evaluation approaches the aim was to sketch a picture of the ways in which tutors already use data and information tools to support students, prior to the introduction of any new data-based dashboards. (Walker et al, 2018)
Then, tutors were selected randomly from the population of those modules piloting either the EAI dashboard or SPM on their module. The identified respondents were then contacted by the researcher, who was a tutor from outside STEM, and invited to participate in the study. Because of low acceptance this invitation was later expanded to include all the piloting tutors. 38 interviews were completed using an interview instrument developed over several iterations by the project team (Appendix A). Most of the interviews were conducted by another tutor, from within STEM. The 30 min interviews, which made every effort to examine information and views on LA and PLA were conducted by telephone or Skype, were recorded and transcribed, and then loaded into analysis software NVivo. After the end of the 17J presentation colleagues from the EAI project were able to export and share user (tutor) engagement data from the OUA dashboard with the Piloting OU Analyse and the Student Probabilities Model on 12 STEM Modules team. This data is anonymous but indicates how often and when tutors accessed the LA in the EAI dashboard per module. (Appendix F) This quantitative data was then analysed and combined with the qualitative outputs from the interviews to guide a thematic
analysis (Braun & Clarke, 2006; Maguire & Delahunt, 2017) and provide a rich picture of tutor views and behaviours.
4.3 Module Teams 11 Module Teams were identified in STEM which managed modules with high populations, were new (in first presentation), and/or had low retention who were interested and willing in piloting the use of the EAI dashboard. When it became apparent that a 12th module was already planning on piloting the SPM in a different way it was added to the project. All modules were also supported via the Analytics 4 Action (A4A) data touchpoint meetings provided by the Learning Design team in Learner and Discovery Services (LDS-LD). Every attempt was made to ensure the pilot modules were representative of the diversity of STEM. 3 were from Engineering and Innovation (E&I), 1 from Computing and Communications (C&C), 1 from Mathematics and Statistics (M&S), 4 from Life, Health and Chemical Sciences (LHCS), 1 from Earth, Environment and Ecosystems (EEES), and 2 from Physical Sciences (PS). 7 modules were from level 1, 3 from level 2, and 2 from level 3. 4 modules had participated in pilots containing OUA data in the past, but for the other 8 the EAI dashboard was brand new. 3 modules were in first presentation. The full list of modules was: S111, S112, S215, S217, S315, SDK100, SK299, T192, T193, T313, TM111, and MU123. Initially, these module teams were asked to respond to an 8 question, multiple choice implementation intention survey, (Appendix B) designed by the project team to prompt the module teams into considering options as to how the EAI dashboard might be implemented on their module. The approach was to assist the module team, who were best placed to identify the pedagogic and support requirements of their students, to consider approaches to using the LA available to them and to encourage them to communicate these strategies to their tutors. The role of the project was not to specify centrally how this might be done, but to attempt to gain a better understanding of why module teams might choose to implement a new source of LA in the way that they did. This survey was conducted in Sept 2017. A round of interviews (Appendix C) was then undertaken with all the module teams in Oct and Nov 2017, using the results of the implementation intention survey as a basis, to build agreed logic models (Appendix D) which would record the proposed activities and outcomes the module teams expected to get from piloting the LA. (Kellogg, 2004) Some of these interviews were conducted by the project team and others by the non-STEM AL who was also working on the project. The outputs of these interviews were recorded as the logic models themselves. I hour final module team interviews (Appendix E) were undertaken in Aug and Sept 2018 by one member of the project team in a semi-structured interview using an interview instrument agreed by the project team. Module teams were asked to choose and comment on the proposed activities and outcomes they had identified in their logic models and consider to what extent these had been realised. Module teams were also asked to share feedback they had received from their tutors and to what extent they had engaged with LA themselves, either through the EAI dashboard, with SPM, from their inclusion in the A4A support, or via other means. The interviews were recorded, transcribed and thematic analysis techniques (Braun & Clarke, 2006; Maguire & Delahunt, 2017) applied by the project team to produce a range of themes, common across the modules, which could be viewed as representative of the 12 STEM modules from the perspectives of the lead academics.
5. Findings and data It is to be noted that confusion about the terms used to describe the different pieces of data module teams and tutors used was commonplace in these interviews. During 17J the whole of the EAI dashboard was commonly referred to as OU Analyse even when reference was being made specifically to the non-PLA elements. Since the context of the comments below is not necessarily obvious to the reader clarification has been added in square brackets by the authors to some of the quotes below to add clarity to any analysis that follows.
5.1 Module teams Thematic analysis of the transcripts from the module team interviews identified 6 major themes:
1. Attitudes towards, and use of, learning analytics. 2. Learning analytics as a ‘game changer’. 3. A one size fits all / big data approach to predictive learning analytics. 4. Learning analytics and the teacher / student relationship. 5. Learning analytics and the module team / teacher relationship. 6. Some ethical implications of using predictive learning analytics.
The interviews showed that module teams are generally interested in, welcome and value, the use of quality LA that they can access directly.
The analytics we’re finding extremely useful is like knowing more about your students so actually surprising when you have more than 50% of your students in full time work, and more than 20% have declared a disability… The good thing, jumping ahead, the good thing for module teams is we’ve got direct access to the data…
While this project looked in detail at the use of LA as presented in the EAI dashboard and SPM, module teams also have access to, and mentioned specifically, a number of different learning analytics sources that they used:
• SAS-VA Retention and Progression Dashboards
• CIRCE
• VOICE
• TIGGR-POTTS
• Gradebook
• SS Tool In order to take part in this pilot scheme all module teams were also supported by the Learning Design team from Learner Discovery Services (LD-LDS) in the form of at least three Data Touchpoint Meetings that use the Analytics for Action (A4A) Framework as the basis for interpreting the SAS-VA Retention and Progression Dashboards. Piloting modules had either received this support on previous presentations or did so during 2017J. Partly prompted by this support but also independently of it, several module teams were able to identify uses for the data from the EAI dashboard outside of its basic and intended functionality, to improve their understanding of the module. Examples included tutor engagement, student behaviour in groups that don’t engage with certain assessment points, online and offline study patterns and
monitoring TMA submissions by tutor group. (It should be noted these examples all used the VLE engagement data from the EAI dashboard and not the PLA). This sometimes required comparing data sets from different sources and synthesising the data in spreadsheets or similar. However, it was also clear that there were differences in the confidence of the module teams in using multiple data sources. For some there was a desire for more and more data to be made available in order for confident actions to be made:
And from the module team chair point of view there’s not quite enough data to play with… So, SAS-VA is fantastic at the level of digging down you can do, but it does not have the bit of data that I really wanted.
So, it was very difficult in my mind to get a real sense unless I looked at individual students, to get a real sense for actually as a cohort, you know was there a problem or not a problem?
Whilst for others there were different issues with using LA. Some module teams expressed confusion around how the data was generated, the terminology of the different sources, what the different LA was telling them, and ultimately what to do with it and when:
So, we have so much data to draw on it’s actually quite difficult, the difficulty is remembering where to go to get some of it when you need it! …in the past our use of data has only ever been about the annual review points so introducing it at a point where people are thinking about this more regularly is a challenge. It’s a change in people’s thinking I think it’s fair to say.
There was also a recognition that a big barrier to engaging with the learning analytics was a lack of time to engage in meaningful analysis:
I think the problem is remembering to use it all the time, I have kind of spates of using it, roundabout when we have the meetings with Rafa [for SAS-VA] and I guess OUA with yourself but it’s using it as a regular tool throughout, but you know. Because there’s so many other things to be thinking about you know, mistakes in TMA’s and god knows what! If I had the time… It [AL user engagement with OUA] kind of looks like my usage of it because I was using it about once a week until Christmas and then I kind of stopped using it.
The EAI dashboard has been primarily promoted as a PLA tool but module teams were generally unconvinced about the accuracy of the PLA presented in it and on the whole did not consider them to provide an accurate picture of students ‘at risk’. All of the module teams were able to provide specific insight as to why they were not prepared to action student contact based on the predictions alone. The main reasons were: a. A perceived inability of OUA PLA to adapt to reflect the nuances of specific assessment strategies that might incorporate weightings, iCMAs, substitutable TMAs and exams;
…so, it’s just, as we say it’s probably you know Gradebook gives much clearer indication than anything else.
So, our assessment strategy meant that in order to pass the module you had to turn up to the exam, but you could pass the module without submitting a single TMA. I don’t know if your model was aware that some students were doing concurrent study and therefore were taking the path of least likely resistance [in terms of submitting assessment] to get through. I think what would have been really helpful is if we could have built in the ICMAs…
b. A perceived inability of OUA PLA to account for student study behaviour when using different learning delivery platforms (3rd party, blended, online and offline learning);
So, I think most of the students, who are not using the VLE very much, but are obviously engaging with the module are printing the pdfs because they are pretty good and working from those. …a large proportion chose to study offline and to use an alternative format, in which case you won’t see them on here unless they’re engaging on the activities they were supposed to do for the TMA. This is another student who has really interesting behaviour because she did well in TMAs with almost no activity. So, what was she doing? Was she very efficient, did she know what she was doing already? Has she downloaded raw material?
c. A perceived inability of the EAI dashboard to respond to changes between presentations (out of sync study calendars, errors with thresholds, students prior learning not being acknowledged). d. A perceived tendency of the OUA PLA to generate overly pessimistic predictions that need to be corroborated and contextualised by a human with expertise;
I was surprised by how many students were being identified as predicted to not submit and it looked like sometimes, that half the students were being predicted that way, whereas…the TMA submissions would be higher than that. I understand plenty of what this is doing but don’t understand the machine learning behind the predictive so I would not blindly trust it, so I would not, I don’t think that has that much value, I think what to me this year, I think if it would be demonstrated to me that it is an excellent predict for a student behaviour, which it definitely wasn’t this year because you looked at that last student the predictions were wrong most of the time. And that’s as much to do with process I think and peoples understanding of the module and people from outside kind of interpreting data as meaning one thing when we felt it was indicative rather than absolute. Essential to that training session I think for me although it seems to get a long time ago now was that it was the module team… and I think that that kind of thing cannot be underestimated that people volunteer because of the people and that’s really key.
It was also clear that module teams did not have a clear understanding of how the OUA PLA was generated. There was confusion as to what the predictions were based on.
Analysis of the final evaluation interviews (Appendix E) revealed that the successful realisation of the identified proposed outcomes in the logic models was around a quarter. However, it is recognised that this analysis does not attempt to differentiate between the complexity of the different outcomes.
Proposed Outcomes
Realised 7
Partially realised 8
Not realised 13
Total 28 Table 1: number of realised proposed outcomes identified by the module teams.
9 module teams identified ‘improved student retention, progression, pass and/or completion rates’ as one of their desired outcomes of using the EAI dashboard and were asked about it at interview. None of the 9 teams considered this outcome to have been realised.
So, I don’t think we’ve got any evidence that using OU Analyse [EAI dashboard] has increased the retention, has improved the retention.
Therefore, it seems plausible to suggest that despite a widespread belief that increased use of learning analytics will lead to improvements in retention and student outcomes the delivery of this promise remains problematic. The main reason expressed by the module teams was that with so many other types of intervention initiatives on modules it is difficult to pin down the direct impact access to the EAI dashboard has made on student retention or success.
Typical comments included:
I think there has been an improvement on retention, albeit not horrendously brilliant, but how OUA [EAI dashboard] contributed I don’t know as we had so many initiatives underway… So, there’s so many different interventions going on, you’re practically tripping over!
Examples of these other initiatives included:
• Proactive calling initiatives (by ALs and SSTs)
• MILLS interventions
• Embedding of specified AL/student contact points in newer modules
• Data support for module teams from LDS-LD via the A4A framework
• Forum monitoring
• Changes to teaching materials and assessment strategies
• Introduction of ‘buddy systems’
• Introduction of Single Component Assessment After piloting the use of the EAI dashboard for the 17J presentation certain customisation options became available to module teams for 18J. The teams were able to choose to provide their teachers with combinations of 3 types of data:
a. VLE engagement and TMA results data (existing data, previously available to teachers in pilot)
b. OUA PLA providing short term predictions (existing data, previously available to teachers in pilot)
c. SPM PLA providing long term predictions (new data, not previously available to teachers in pilot)
The results were mixed, but from the 12 piloting module teams, 3 module teams (all of which had made OUA PLA available on previous presentations) chose to remove all predictive data from their tutors (that is, option a. only). Of the others, 6 module teams chose to keep the existing levels of data (that is a. and b.) and 3 module teams (1 of which had already been exposed to the SPM model) chose to make the new predictive data available to their tutors (that is, a., b. and c.).
5.2 Tutors The first part of this study sought to understand how tutors use the data that was, and still is, available to them before the widespread introduction of the EAI dashboard It found, amongst other things that tutors, like module team members, were generally positive about using LA in their work and accessed a wide variety of data sets when they were available to them. When tools were easy to use and understand and had clear actions attributable to them they were incorporated without too much difficulty into daily routines (Walker et al, 2018). Whilst some tutors made the EAI dashboard a cornerstone of their practice many failed to be won over by the detail on offer, returning instead to original tried and tested methods.
S215-5: I stopped using them [EAI dashboard] properly earlier this year, the beginning of the year, because it was giving me information that wasn’t useful. So, for me just a simple spreadsheet of who has been active, who hasn’t and who has been contacted that week was working better for me than OU Analyse [EAI dashboard] so I went back to that really.
T313-2: So OU Analyse [EAI dashboard] hasn’t really offered anything, and I can tell whether they have been online or not from Tutor Home.
On the whole, tutors were far more positive about being able to access PI level VLE engagement data than the PLA. Data extracted from the user engagement screen on the EAI dashboard showed that in absolute
numbers and averaged across 10 modules (TM111 data was not collected) the amount of times tutors
engaged with the EAI dashboard roughly halved every 11 weeks. (Appendix F) It can be seen that this
pattern occurs on the individual modules too.
When asked at interview the tutors made it clear that they access the EAI dashboard in the first 11 weeks more often than in the following weeks because they don’t know much about their students at the start and want to get to know them better. Most tutors were clear that they primarily used the VLE engagement data to do this.
SDK100-4: The OU Analyse [EAI dashboard] is quite handy then [at the start] because I can
look online and see if that student's been on the website. And then, if they are on the website
and visiting, it's less of a panic and I can just chase them up by email. If they're not on the
website, it's something I've got to look at…
Modules Weeks
1 to 11 12 to 23 24 to end
A S111 131 74 39
B S112 190 85 64
C S215 43 26 20
D S217 43 23 17
E S315 30 19 16
F SDK100 82 44 13
G SK299 99 34 31
H T192 94 59 n/a
I T193 35 15 n/a
J T313 18 5 5
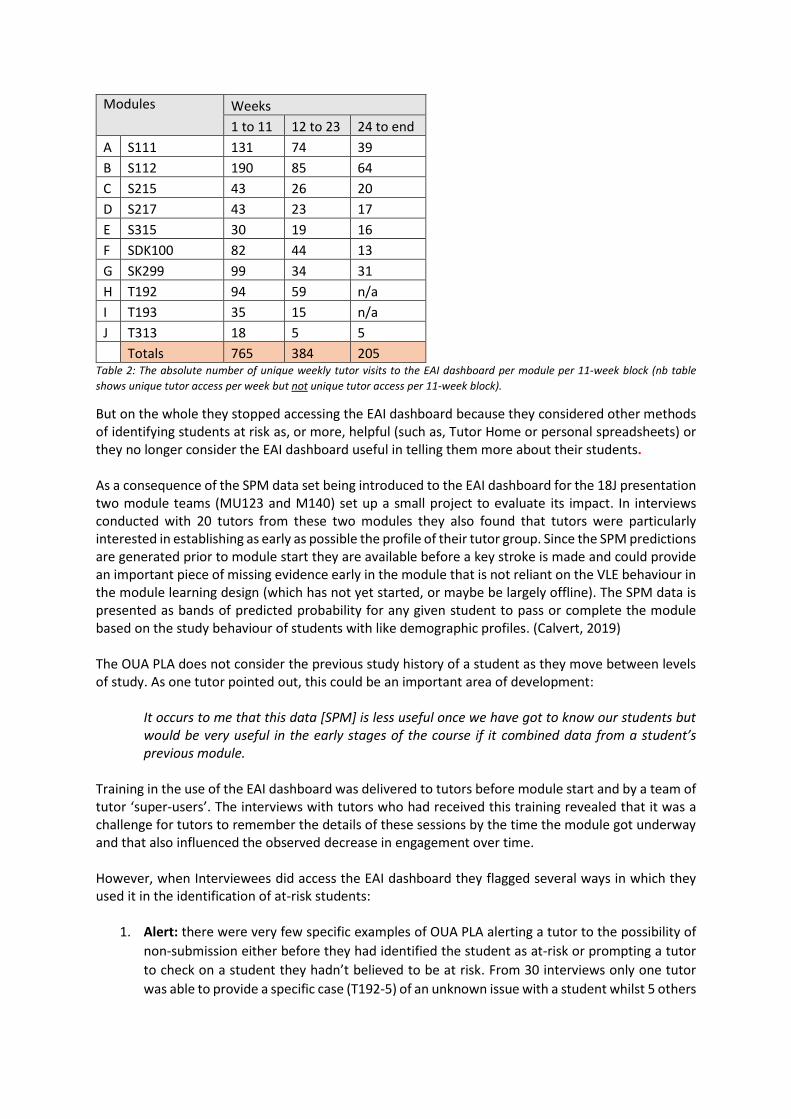
Totals 765 384 205 Table 2: The absolute number of unique weekly tutor visits to the EAI dashboard per module per 11-week block (nb table
shows unique tutor access per week but not unique tutor access per 11-week block).
But on the whole they stopped accessing the EAI dashboard because they considered other methods of identifying students at risk as, or more, helpful (such as, Tutor Home or personal spreadsheets) or they no longer consider the EAI dashboard useful in telling them more about their students. As a consequence of the SPM data set being introduced to the EAI dashboard for the 18J presentation two module teams (MU123 and M140) set up a small project to evaluate its impact. In interviews conducted with 20 tutors from these two modules they also found that tutors were particularly interested in establishing as early as possible the profile of their tutor group. Since the SPM predictions are generated prior to module start they are available before a key stroke is made and could provide an important piece of missing evidence early in the module that is not reliant on the VLE behaviour in the module learning design (which has not yet started, or maybe be largely offline). The SPM data is presented as bands of predicted probability for any given student to pass or complete the module based on the study behaviour of students with like demographic profiles. (Calvert, 2019) The OUA PLA does not consider the previous study history of a student as they move between levels of study. As one tutor pointed out, this could be an important area of development:
It occurs to me that this data [SPM] is less useful once we have got to know our students but would be very useful in the early stages of the course if it combined data from a student’s previous module.
Training in the use of the EAI dashboard was delivered to tutors before module start and by a team of tutor ‘super-users’. The interviews with tutors who had received this training revealed that it was a challenge for tutors to remember the details of these sessions by the time the module got underway and that also influenced the observed decrease in engagement over time. However, when Interviewees did access the EAI dashboard they flagged several ways in which they used it in the identification of at-risk students:
1. Alert: there were very few specific examples of OUA PLA alerting a tutor to the possibility of
non-submission either before they had identified the student as at-risk or prompting a tutor
to check on a student they hadn’t believed to be at risk. From 30 interviews only one tutor
was able to provide a specific case (T192-5) of an unknown issue with a student whilst 5 others
indicated they believed they had taken an action, such as accessing further data, which they
may not have done without OUA PLA alerting them to a potential issue being present.
2. Confirmation or reassurance: for most tutors the predicted data confirmed or reassured a
pre-existing view that a tutor had about whether a student was likely to submit a TMA. For
example, this could be due to non-communication on the student’s part.
SDK100-5: I just [access EAI dashboard] if I want specific information about a student. If I
was worried that their engagement was tailing off, if I wanted to check how many times
they'd logged into the module website over the past few weeks.
3. Curiosity about the PLA:
S215-4: I think I used it [EAI dashboard] a lot more at the start of the module, when I was seeing how useful it [OUA PLA] was going to be…
4. At specific times: Examples included; before TMA due dates, as part of a weekly routine or
only when explicitly prompted to do so by external nudges on a forum or from the module team.
As with the module teams, a majority of the tutors interviewed raised issues about the limitations of using the OUA PLA and the potential false positives (a student predicted to submit doesn’t) and negatives (a student predicted not to submit does) being generated. Comments included:
S215-4 ‘very misleading’, ‘it was incredibly inaccurate’, and ‘I have instances on 215 where I contacted students that hadn’t done anything, they told me they were working offline then submitted a TMA that scored really high, so I thought, that’s a bit embarrassing.’ S215-5 if I was using that as a reliable source of information, I would still not have a true representation of my group. S217-3 I used it to support what I have been seeing in terms of email and interaction through the TMAs, I haven’t used it, I haven’t been relying on it as a predictive tool. SDK100-4 I use the VLE log-ons probably more than anything. The predictions I look at more out of interest because they're often quite wrong. T192-3 So, it's useful in flagging things up but quite often I'm quite aware of what's going on as well and it sometimes confirms, but sometimes it seems to contradict with, what I know is going on with a student. SDK100-5 I have found at times the traffic light system to be very inaccurate. So, I'm looking at it now, for example, and it's got three students that it's predicting will not submit their next TMA. Well, I know two of them will. I mean the final result prediction, it's a bit early I suppose, but it's got more than half my students predicted to fail and that's not going to happen. T192-5: (AL superuser) I'm not sure that I use the predictive data to be honest… But I don't trust OU Analyse, I don't think, 'Oh well, OU Analyse says this'. I use it as a bit of a nudge to go and have a look really.
T192-7: I do use them [OUA predictions]. They are not highly accurate.
Comments from tutors on established modules seemed to support the idea that time spent using the EAI dashboard over several presentations was very helpful:
T192-3: And yes, I think I used it more, or explored it more, this time than what I did the previous time. Because I used it last year and then I used it this year and sort of realised more about what it could do
And for those ALs who have access to the dashboard across several modules this positive response seems to be magnified:
MU123-3 (tutoring on 3 modules): Because like I said, I had it for MU123 and then they decided not to carry on with that and so I asked the project if I could still see it because I felt like I had something missing as soon as it had gone.
The EAI dashboard does divide opinion. The interviews suggest that for those ALs who have already made up their mind about the EAI dashboard, they return, but for others it offers little new. In particular, tutors that teach across several modules were more likely to invest time and effort into exploring the capabilities of the EAI dashboard than those only involved with one module. Also, on first presentation modules tutors would appear to give OUA a go out of curiosity but don’t repeatedly engage, citing the confusing and time pressured environment of a new module as reasons not to engage. For them there is simply too much else going on.
6. Discussion and Recommendations
1. Learning analytics should be considered as one option in a range of retention strategies.
Tutors and module teams were generally positive about using learning analytics in their work. Both groups accessed a wide variety of relevant data sets when they were available to them and demonstrated an ability and willingness to combine them when appropriate. When tools were easy to use, understand, and had clear actions attributable to them they were incorporated without too much difficulty into daily routines. However, the ongoing training of staff, managing access issues, developing LA strategies and building LA dashboards all take time and resources. Time was identified as a significant barrier to engaging in a meaningful way with LA. It was found that tutors that taught across several modules were more likely to invest time and effort into the EAI dashboard than those only involved with one module. Despite the recognition of the potential for using LA by module teams, the interviews demonstrated that only around a quarter of the outcomes module teams hoped to achieve were actually realised. (it is recognised this statistic does not take into account the complexity of these outcomes). 9 module teams identified ‘improved student retention, progression, pass and/or completion rates’ as one of their desired outcomes of using the EAI dashboard and were asked about it at interview. None of the 9 teams considered this outcome to have been realised. This evidence suggests that module teams (although not only them) may have a heightened or unrealistic expectation of what learning analytics can actually deliver, especially in the area of student retention and progression. Neither module teams nor tutors perceived LA to have a great effect on retention. Module teams typically employed a range of retention strategies and this complexity
makes the impact of any specific one almost impossible to evaluate. Therefore, the effectiveness of LA and PLA in regard to retention was not proven here.
2. Learning analytics should be considered as one way to initiate conversations between
tutors, students and module teams about students at risk.
Tutors and module management teams repeatedly emphasised the importance of discussion and communication with students as being more important than using LA. Some tutors reported that they felt having access to these data enabled them to have more informed discussions with their students, although others felt it added little to what they already knew. It was observed that on occasions analysis of the data also prompted a focused discussion amongst some module teams that might not have previously occurred. It is recommended that any future uses of LA should continue to focus on it as a method to support tutors in their work.
3. The timing and content of training provided to tutors and module teams needs to be
reviewed.
Neither tutors or module teams trusted the OUA PLA to any great extent. There was confusion as to what underlying principles the predictions were based on and how the OUA model generated its predictions. Since this was not communicated to tutors or module teams during the training, many participants were reluctant to act on the data it presented. Increased efforts need to be made to communicate this to tutors and module teams if use of the EAI dashboard is chosen as a retention strategy option. This concurs with the findings from the EAI Project team (Herodoutou et al, 2019). Training was provided to module teams and tutors by allocated super users before the start of presentation. Whilst module teams and tutors considered the training to be useful, many reported they were later unable to remember it. It is recommended that training should be ongoing (perhaps split on either side of TMA01) and contextualised more finely to the specific module or area of curriculum rather than as a one-off event. Other studies into the use of LA at the OU have come up with similar findings. (Rienties et al, 2018; Calvert, 2019)
4. The development of new learning analytics dashboards and the strategies and guidance that
goes with them, should be developed through consultation with tutors and owned by
module teams.
Tutors identified a desire to get to know their students as much as possible before module start and as a consequence, they engaged with the dashboard heavily at the start of the module. Engagement subsequently halved every 11 weeks in individual modules and when aggregated. Tutors reported the OUA PLA were of no use and the VLE engagement data of limited use during this time period before module start. However, whilst OUA PLA does not really meet this need, it is possible that the SPM may, and as such further research in this area is recommended. Since it was identified that tutors accessed OUA PLA for four distinct reasons – 1. Alert, 2. Confirmation or reassurance, 3. Curiosity and 4. At specific times – these should be considered in any strategy developed by a module team. Module teams and tutors reported that the ‘one size fits all’, big data predictive model used by OUA was unreliable when attempting to account for the vagaries of specific assessment strategies, differences in platform delivery, first presentations, etc. It is possible that the emphasis of OUA on
delivering predictive analytics at scale may impact on its accuracy. Future work could include considering and trialling a model that can adapt and incorporate small, module specific data. In any case, module teams are best placed to critique, interrogate and/or interpret the predictions as they relate to their module context and reject or accept the value of them accordingly. In future design, emphasis should be placed on ‘ease of use’, which, in this context, needs to be seen not just as the immediate usability of a particular data source or tool but also, it’s location among the other sources & tools that are available to tutors. Also, the introduction of new data sources and tools is unlikely to lead to significant improvements in student retention if there are no effective ‘levers’ that can be pulled to try to influence predicted outcomes. (Walker et al, 2018)
5. For first presentation modules, module teams should make only TMA submission scores and
VLE engagement data available to tutors before introducing OUA PLA on second
presentations onwards if required.
As above, the interviews suggested that tutors and module teams were not convinced about the accuracy of the OUA predictive data and continued exposure to it further undermined that trust. Since the OUA model largely generates its predictions about a student’s likelihood to submit their next TMA on the basis of successful students’ engagement with the VLE components of the same module in the past, without previous presentation data the machine learning predictions were observed as being largely unreliable. Crucially, module teams also reported that the time limitations in managing a first presentation module are considerable and they were not able to commit sufficient time to also managing the use of the EAI dashboard. New modules interested in using the OUA model should trial the EAI dashboard without offering access to the predictive data to their tutors. That is restricting access to PI level VLE engagement and TMA data only. In this way module teams can monitor the OUA predictive data over a presentation, critically assess its usefulness and, if they decide to go ahead, develop an appropriate tuition strategy and trust in the data. This is consistent with current advice given in STEM and should continue for 19J.
6. Further research into uses for the OUA PLA should be undertaken, particularly in the field
of producing static learning design visualisations.
Static visualisations of the engagement with VLE components that successful students take through a module, or a ‘module fingerprint’ (Hlosta et al, 2015), may be of interest to module teams and tutors in order to share and improve their understanding of their module. It is envisaged that this fingerprint could potentially be combined with other existing learning design data to provide a rich data source.
7. References Braun V & Clarke V (2006) Using thematic analysis in psychology. Qualitative Research in Psychology. 3:2, pp 77-101. doi: 10.1191/1478088706qp063oa Castañeda, L., & Selwyn, N. (2018). More than tools? Making sense of the ongoing digitizations of higher education. International Journal of Educational Technology in Higher Education, 15(1), 22. doi: 10.1186/s41239-018-0109-y Calvert, C. (2014). Developing a model and applications for probabilities of student success: a case study of predictive analytics, Open Learning, 29:2, pp 160-173, doi: 10.1080/02680513.2014.931805 Calvert C (2019) Using OU Analyse on two mathematics modules. Unpublished internal OU report presented to L1 Chairs group, 15/05/19 Chicot, K., Calvert, C., Crighton, S. & Golding, G. (2018) Using Student Analytics with ALs to increase retention: eSTEeM Final Report, Faculty of mathematics, Computing and Technology, The Open University Clow, D. (2012). The learning analytics cycle: closing the loop effectively. Paper presented at the LAK12: 2nd International Conference on Learning Analytics and Knowledge, Vancouver, BC. Conole, G. (2012). Designing for Learning in an Open World. Dordrecht: Springer Dalziel J, Conole G, Wills S, Walker S, Bennett S, Dobozy E, Cameron L, Badilescu-Buga E, Bower M (2016) The Larnaca Declaration on Learning Design, Journal of Interactive Media in Education, 2016 (1):7, pp.1-24, doi: http://dx.doi.org/10.5334/jime.407 Daniel, B. (2015). Big Data and analytics in higher education: Opportunities and challenges. British Journal of Educational Technology, 46(5), 904-920. doi:10.1111/bjet.12230 Herodoutou C, Rienties B, Verdin B, Boroowa A (2019a). Predictive learning analytics “At Scale”: towards guidelines to successful implementation in higher education based on the case of the Open University UK. Journal of Learning Analytics Volume 6(1), 85 –95. doi: 10.18608/jla.2019.61.5 Herodoutou C (2019b). Using Predictive Learning Analytics to Support Just-in-time Interventions: The Teachers’ Perspective Across a University-Wide Implementation, submitted to Journal of Computer Assisted Learning. Hlosta, M., Herrmannova, D., Zdrahal, Z., & Wolff, A. (2015). OU Analyse: analysing at-risk students at The Open University. Learning Analytics Review, 1-16 Hidalgo, R. (2018). Analytics for Action: using data analytics to support students in improving their learning outcomes. In G. Ubachs & L. Konings (Eds.), The Envisioning Report for Empowering Universities (2nd ed) 6-8
Kantirou, M (2017) The STEM Retention and Progression Plan, 2017/18 http://intranet6.open.ac.uk/stem-faculty/sites/intranet6.open.ac.uk.stem-faculty/files/files/STEM%20Retention%20and%20Progression%20Plan%202017-18_d5Nov2017.pdf, retrieved 18/03/19
Kellogg, W (2004). WK Kellogg Foundation logic model development guide. WK Kellogg Foundation, Michigan
Lodge, J., Horvath, J. & Corrin, L (2019). Chapter 1: Introduction in Lodge, J., Horvath, J. & Corrin (ed) Learning Analytics in the Classroom: Translating Learning Analytics for Teachers pp 7, Routledge
Maguire M & Delahunt B (2017) Doing a Thematic Analysis: A Practical, Step-by-Step Guide for Learning and Teaching Scholars. All Ireland Journal of Teaching and Learning in Higher Education (AISHE-J). 3 (autumn 2017). Nguyen, Q., Rienties, B., Toetenel, L., Ferguson, F., & Whitelock, D. (2017). Examining the designs of computer-based assessment and its impact on student engagement, satisfaction, and pass rates. Computers in Human Behaviour, 76 (November 2017), 703-714 Olney, T, Rienties B, & Toetenel, L (2019). Chapter 6: Gathering, visualising and interpreting learning design analytics to inform classroom practice and curriculum design in Lodge, J., Horvath, J. & Corrin (ed) Learning Analytics in the Classroom: Translating Learning Analytics for Teachers, Routledge Slade, S., & Boroowa, A. (2014). Policy on Ethical use of Student Data for Learning Analytics. Milton Keynes: Open University https://help.open.ac.uk/documents/policies/ethical-use-of-student-data/files/22/ethical-use-of-student-data-policy.pdf , retrieved 18/03/19
Rienties B, Olney T, Herodoutou C, Schenks M & Boroowa, A. (2018) Making sense of learning analytics dashboards: a technology acceptance perspective of 95 teachers. The International Review of Research in Open and Distributed Learning. Rienties, B. & Toetenel (2016) The impact of learning design on student behaviour, satisfaction and performance: A cross-institutional comparison across 151 modules, Computers in Human Behaviour, 60 333-341 Rienties, B., Edwards, C., Gaved, M., Marsh, V., Herodotou, C., Clow, D., Cross, S., Coughlan, T., Jones, J., Ullmann, T (2017) What is the impact of predictive analytics on student retention? Scholarly Insight Report Autumn 2017: a Data Wrangler Perspective, http://article.iet.open.ac.uk/D/Data%20Wranglers/Scholarly%20Insight%20Report%20Autumn%202017/DW_Scholarly_Insight_Report_Autumn_2017.pdf, retrieved 18/03/2019 Walker S, Olney T, Wood C, Clarke A, Dunworth M (2018) How do tutors use data to support their students? Open Learning, 34:1, pp 118-133 doi: 10.1080/02680513.2018.1554476
8. Appendixes
Appendix A – Interview Instrument (Tutors)
OUA instrument – Interviews with ALs on OUA focus modules
Notes for interviewers Note availability of case summaries and logic models to help contextualise questions
Note that all interviewees will have been sent an introductory email and will have
agreed to this interview.
Note that some interviewees have been selected randomly from those using OUA on
their module. For others, we are interviewing all OUA users on a module because of
low numbers.
In the interview, focus on a particular module, as per the Excel list, but don’t exclude
reference to others on which they might be tutoring. It might be helpful to have the
dashboard open in front of you. If an AL is currently using OUA on more than one
module, ask the core use questions separately for each Focus module to assist
analysis. We can collect data about non-focus modules but not in detail.
Note interviewee’s gender on the Excel sheet of respondents
Send thanks email to each interviewee immediately after the interview (text of that
email is available).
Preamble There are two projects which you may have come across in relation to the use of
predictive data at the OU. The Early Alert Indicator Project (EAI) is a centrally run
project that is exploring the feasibility of predictive data in a number of different
models, of which OU Analyse is one, across the whole university and how this
approach might impact on retention. However, this interview is for a project run by
the STEM faculty that is looking to explore how the OU Analyse dashboard, in
particular, might best be used by module teams.
As part of the project we need to understand how ALs are using OUA and what their
views are about it as a tool in their support of students. We want to look at the
predictive and VLE engagement OUA Dashboard data separately in this interview.
Confidentiality.
This interview is being recorded so that it can be transcribed in order to help with our
analysis. The data will only be used anonymously. They will be used for this study
and any resulting papers or conference presentations, but respondents will never be
identified within those data. Is that acceptable to you.’
Demographic
How long have you been an AL?
Geography – where in the UK do you teach and where are your students?
Module/s - on how many modules do you currently tutor?
On how many of those modules do you use the OUA Dashboard?
What is your academic background?
Have you used OUA prior to using it on this module?
[Note to interviewer: the following four sections are divided into questions about
predictive and VLE engagement data – we must collect this evidence separately]
How are you using the OUA Dashboard?
- Predictive data
- Triggers for use
o What prompts you to look at it?
o Do you do that at regular interviews, pre/post TMA cut-off dates,
reminders from module team?
Issues found in relation to OUA dashboard/data - What issues have you found with the OUA Dashboard?
o Usability – need to capture any mentions of usability/responsiveness
etc.
- Data issues
o Timeliness, relevance, completeness
o how does OUA fit with ALs’ own records of students?
Data use, frequency [Note for interviewer: This is a really important question. We are measuring how
often they LOOK at it.]
- On average how often do you access the OUA dashboard during the module
presentation?
o More than once a week
o Once a week
o Less than once a week but at least once a fortnight
o About once a month
o Less than once a month
Interpretation and application
- Predictive data - How do you interpret the OUA Dashboard predictive data (specifically, the bar
chart & red/amber/green status)?
- Do you triangulate/supplement the data to/with other sources? (If so, what –
direct student communication? Info on student contact history? etc)
- What do you do with the data? (Remember this is just about predictive data).
o E.g. Confirmation of identification of at-risk students vs initial
identification?
o (How) does the predictive data help in the diagnosis of student issues
(e.g. health, time management, academic unpreparedness, content
challenges, family health, travel, work commitments etc)?
o (How) does the predictive data influence the response to student
issues (e.g. timing/nature of AL intervention; communication with SST
o Criteria for contacting students? How does the OUA RAG status
contribute to this?
How are you using the OUA Dashboard?
- VLE Engagement data
- Triggers for use
o What prompts you to look at it?
o Do you do that at regular interviews, pre/post TMA cut-off dates,
reminders from module team?
Issues found in relation to OUA systems/data - What issues have you found with the OUA Dashboard?
o Usability – need to capture any mentions of usability/responsiveness
etc.
- Data issues
o Timeliness, relevance, completeness
▪ how does OUA fit with ALs’ own records of students?
Data use, frequency [Note for interviewer: This is a really important question. We are measuring how
often they LOOK at it.]
- On average how often do you access the OUA dashboard during the module
presentation?
o More than once a week
o Once a week
o Less than once a week but at least once a fortnight
o About once a month
o Less than once a month
Interpretation and application
- VLE Engagement data - How do you interpret the VLE Engagement data?
- Do you triangulate/supplement the data to/with other sources? (If so, what –
direct student communication? Info on student contact history? etc)
- What do you do with the data? (Remember this is just about VLE
Engagement data).
o Identification of at-risk students whom you thought were doing ok
o E.g. Confirmation of identification of at-risk students about whom you
were already concerned?
▪ What data source informed your existing concern about such
students?
o (How) does the VLE Engagement data help in the diagnosis of
student issues (e.g. health, time management, academic
unpreparedness, content challenges, family health, travel, work
commitments etc)?
o (How) does the VLE Engagement data influence your response to
student issues (e.g. timing/nature of your intervention; communication
with SST)
o Criteria for taking action?
Training and support [Note to interviewer: we don’t anticipate any distinction here between predictive and
VLE engagement data but please note if such a distinction emerges]
[Note to interviewer: The EAI project were responsible for providing training that the
AL might have had from AL ‘superusers’, or online briefing sessions, before they
started using OU Analyse.]
- What guidance have you received about the purpose and use of OUA?
o Training sessions, email/forum guidance etc
o System use
o Data interpretation
o Action required of you, the AL
o From whom did you get this training/support?
▪ Module team
▪ Staff tutor
▪ EAI/OUA project
• Superusers
▪ Peers
o Overall has this been adequate?
Overall
- how do you feel that OUA has contributed to the support you’ve been able to
give to your students?
- Is there anything else that we should have asked you?
Closing o Thanks
o I will write to you repeating the confidentiality information and giving you the
number of my manager in case you have any issues with this process.
Appendix B – Implementation Intention Survey (Module Teams) Dear MTC, You should have been contacted recently by the Early Alert Indicators Project Team about establishing the training sessions for your Associate Lecturers. Whilst this work is going on I wanted to contact you to see how you are getting on with considerations as to what strategy you are going to use for the implementation of OU Analyse for on your module. There are quite a few options as to how OU Analyse could be implemented. So, to help you set clear expectations for your ALs, and as part of the scholarship and evaluation work that will underpin this project, we have developed the following ideas. We hope that by considering these options, and deciding on the most appropriate course of action, we’ll be able to get the most from this pilot. The approach to using these learning analytics will be the responsibility of the module team who are best placed to identify the pedagogic and support requirements of their students. It is not the purpose of this pilot and evaluation to specify centrally how this might be done, but to attempt to gain a better understanding of why you have chosen to approach the use of OUA in the way that you have. Therefore, we would like you to consider the following in your guidance to ALs and let us know your approaches: 1. Who will you be recruiting as ALs for the pilot?
o Volunteers o All ALs, i.e. as part of the tuition strategy. o Module selected ALs based on some other criteria.
2. How will you be communicating your expectations of the use of OUA to the ALs?
o Tutor Forum. o General email or cascade. o Personal contact via email or phone. o Face to face via established tutor briefing session. o Get the super-users to do it via training session.
3. When will you be advising your ALs to view the OUA data?
o Ad hoc / as they consider appropriate. o Before and/or after identified key pieces of learning. o Weekly. o Fortnightly. o Shortly (two/three weeks) before TMAs.
4. Which groups of students will you be advising your ALs to review the data for each time they view the dashboard?
o All students in the tutor group. o Students who are predicted not to pass their next TMA by OUA. o Students whose TMA prediction has changed since the last viewing in OUA. o Students the AL considers to be ‘at risk’ based on a combination of personal
experience and OUA data. 5. What criteria will you be advising your ALs to apply in order to choose whether an intervention should take place?
o Students who are predicted not to pass their next TMA by OUA data.
o Students whose TMA prediction has changed since the last viewing in OUA data. o Students the AL considers to be ‘at risk’ based on a combination of personal
experience and OUA data. 6. What type of intervention will you be advising your ALs to take?
o Whatever the AL believes is appropriate based on their personal experience. o Phone call. o Email. o Refer to SST.
7. How will you be advising your ALs to record any decisions they make or interventions they do or/do not take?
o VOICE o CIRCE o OUA tool
8. How are you going to monitor/get feedback from your ALs on the pilot?
o Via the module team website forum. o Via the usage stats screen in OUA. o Via the module wide dashboard in OUA. o Via OUA pilot AL meetings.
Appendix C – Interview Instrument (Module Teams- Logic Models) STEM OU Analyse Pilot Evaluation – Module Chair Initial Interview Schedule
Name: Date: Interviewer:
Preamble: this is voluntary, are you happy if we record? Used for the purposes of evaluating the OUA pilot in STEM STEM is doing this because we think there are some things missing from the current approach. We want a ‘real world’ view of how OUA might be used. We’re hoping to produce some proposals or recommendations for what works that can inform the use of LA in STEM.
1. The DW have published a scholarly insight report that can also be used to frame our own approach: For example, ‘Recommendation 5: the OU needs a consistent policy and implementation of PLA across Level 1-2, as providing PLA data to ALs who act upon this data significantly improves retention and progression’ (pg. 7) seems to be something our project could inform?
2. And, ‘(e) Research is still needed to identify which interventions should be used by ALs to effectively support students at risk’ and (f)…along with strategies as to how best support ALs when using PLA’ also could be within our scope. (pg. 28)
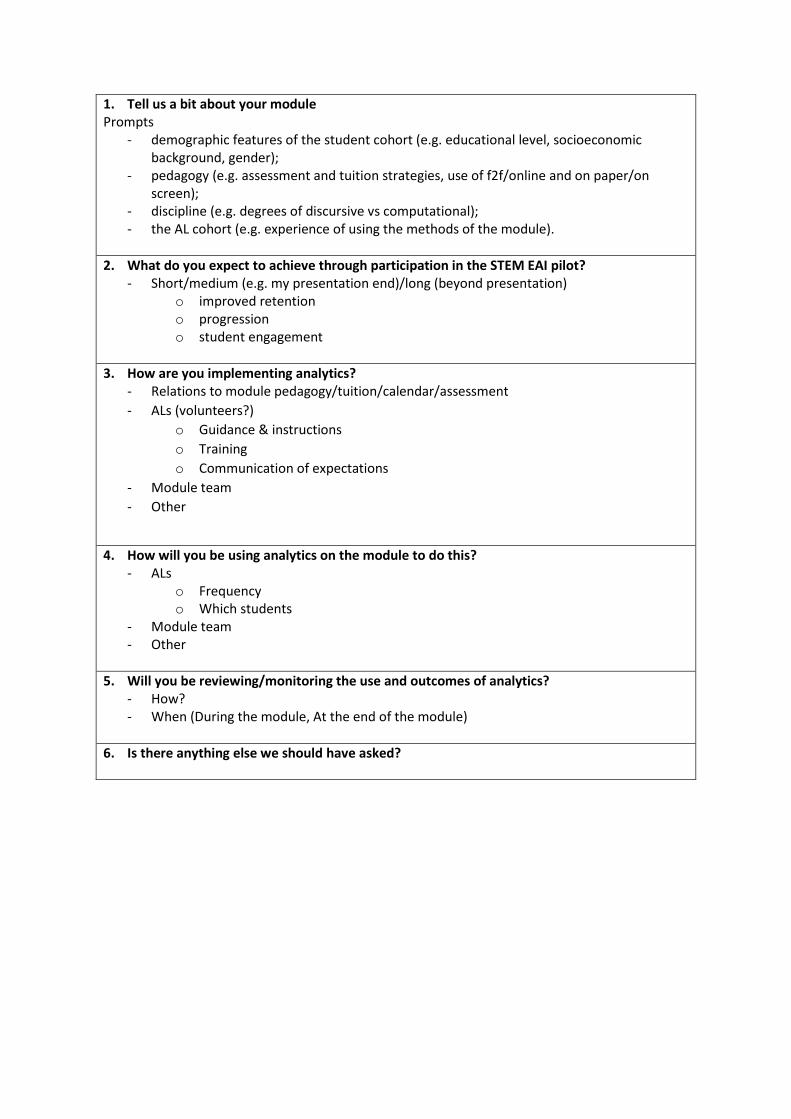
This first part of the evaluation approach is to try to help us all: 1. better understand your expectations for the pilot, 2. identify the kinds of data we might need to evaluate your approach, and 3. ensure the implementation/evaluation approach matches your expectations.
1. Tell us a bit about your module Prompts
- demographic features of the student cohort (e.g. educational level, socioeconomic background, gender);
- pedagogy (e.g. assessment and tuition strategies, use of f2f/online and on paper/on screen);
- discipline (e.g. degrees of discursive vs computational); - the AL cohort (e.g. experience of using the methods of the module).
2. What do you expect to achieve through participation in the STEM EAI pilot? - Short/medium (e.g. my presentation end)/long (beyond presentation)
o improved retention o progression o student engagement
3. How are you implementing analytics? - Relations to module pedagogy/tuition/calendar/assessment
- ALs (volunteers?)
o Guidance & instructions
o Training
o Communication of expectations
- Module team
- Other
4. How will you be using analytics on the module to do this? - ALs
o Frequency o Which students
- Module team - Other
5. Will you be reviewing/monitoring the use and outcomes of analytics? - How? - When (During the module, At the end of the module)
6. Is there anything else we should have asked?
Appendix D – Logic Model Template
Inputs Outputs Activities Participation
Outcomes Short Medium Long
Assumptions
External Factors
Adapted from Univ. Wisconsin (2003)
Appendix E – Interview Instrument (Module Team – Final Evaluation) Present: Preamble: I’m recording this. What I’m going to be using it for. The purpose of it. What we have been doing Outputs from the project Refer to logic model
1. The proposed activities and to what extent they were implemented.
2. The proposed outcomes and to what extent they were realised.
3. Your personal experiences of feedback from ALs in using the dashboard.
4. Your experience of OU Analyse in combination with the other learning analytics dashboards from A4A.
Appendix F – User (Tutors) Engagement Data
Table 3: The absolute number of tutors that accessed OUA per module per week (unique tutor access per week / not unique tutor access across weeks).
Notes:
- TU100 17B & SDK100 17B not part of pilot. - SK299 17J data combined with SKYN299 data (two slightly different cohorts of same module) - Week 11 is last week before Xmas. - No data available for TM111 or MU123. - Engagement is with the EAI dashboard. There is no way to split PLA from VLE or TMA data
using this data set. - T192 and T193 are 24-week modules.