PINCER trial: a cluster randomised trial comparing the effectiveness and cost-effectiveness of a p harmacist-led I T- based in tervention with simple feedback in reducing rates of c linically important er rors in medicines management in general practices A report for the Department of Health Patient Safety Research Portfolio February 2010 Anthony J Avery 1 , Sarah Rodgers 2 , Judith A Cantrill 3 , Sarah Armstrong 4 , Matthew Boyd 6 , Kathrin Cresswell 5 , Martin Eden 3 , Rachel Elliott 6 , Matthew Franklin 6 , Julia Hippisley-Cox 1 , Rachel Howard 7 , Denise Kendrick 1 , Caroline J Morris 8 , Scott A Murray 5 , Robin J Prescott 5 , Koen Putman 9 , Glen Swanwick 10 , Lorna Tuersley 3 , Tom Turner 10 , Yana Vinogradova 1 , Aziz Sheikh 5 1 Division of Primary Care, University of Nottingham Medical School, Queen’s Medical Centre, Nottingham, NG7 2UH, UK. 2 Research and Evaluation Team, Quality and Governance Directorate, NHS Nottinghamshire County, Birch House, Southwell Road West, Mansfield, Nottinghamshire NG21 0HJ 3 Drug Usage & Pharmacy Practice Group, School of Pharmacy & Pharmaceutical Sciences, University of Manchester, Oxford Road, Manchester, M13 9PL, UK 4 Trent Research Design Service, Division of Primary Care, Tower Building, University Park, Nottingham, NG7 2RD, UK 5 Centre for Population Health Sciences, University of Edinburgh, Teviot Place, Edinburgh, EH8 9AG, UK 6 Division for Social Research in Medicines and Health, The School of Pharmacy, University of Nottingham, University Park, Nottingham, NG7 2RD, UK 7 School of Pharmacy, University of Reading, PO Box 226, Whiteknights, Reading, RG6 6AP, UK 8 Department of Primary Health Care and General Practice, Wellington School of Medicine and Health Sciences, University of Otago, Mein Street, Wellington South, New Zealand 9 Department of Medical Sociology and Health Sciences, Faculty of Medicine and Pharmacy, Vrije Universiteit Brussel, Laarbeeklaan 103 B-1090 Brussel, Belgium 10 Consumers in Research Advisory Group, c/o: Research and Evaluation Team, Quality and Governance Directorate, NHS Nottinghamshire County, Birch House, Southwell Road West, Mansfield, Nottinghamshire NG21 0HJ Corresponding author: Professor Anthony J Avery Division of Primary Care, University of Nottingham Medical School, Queen’s Medical Centre, Nottingham NG7 2UH Email address: [email protected]Telephone: 0115 8230207 or 8230209 Fax: 0115 8230214 Competing interests: none
Transcript
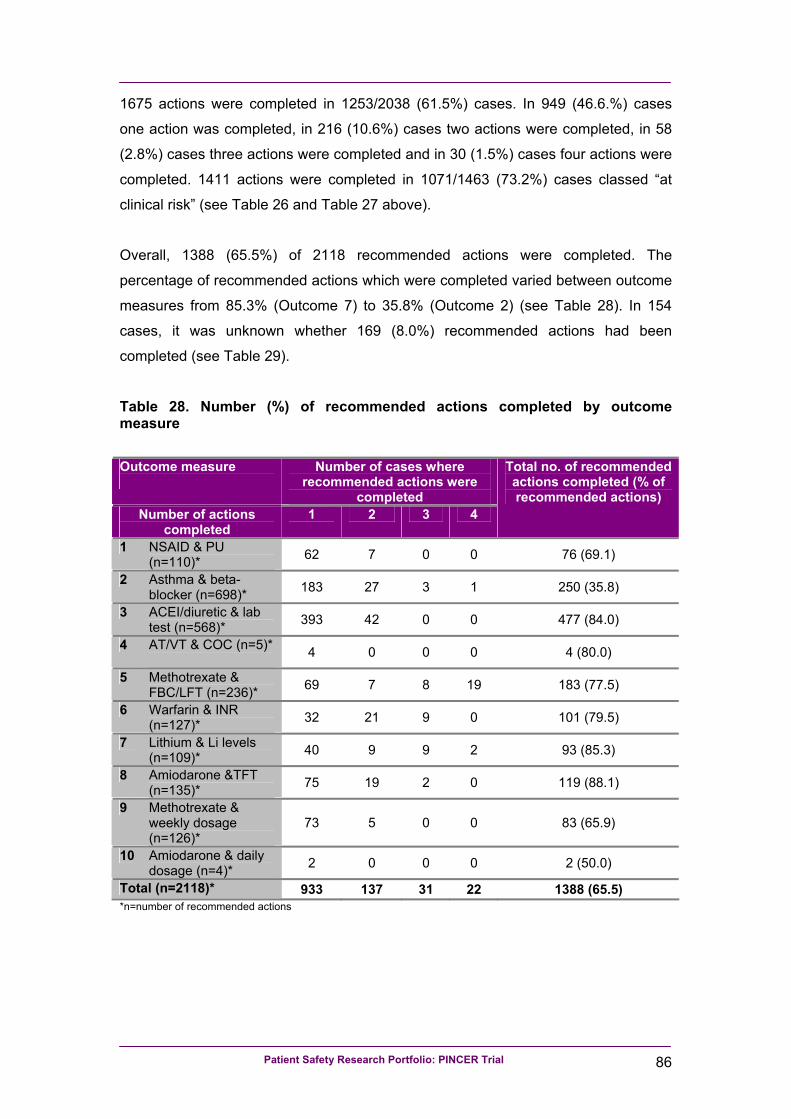
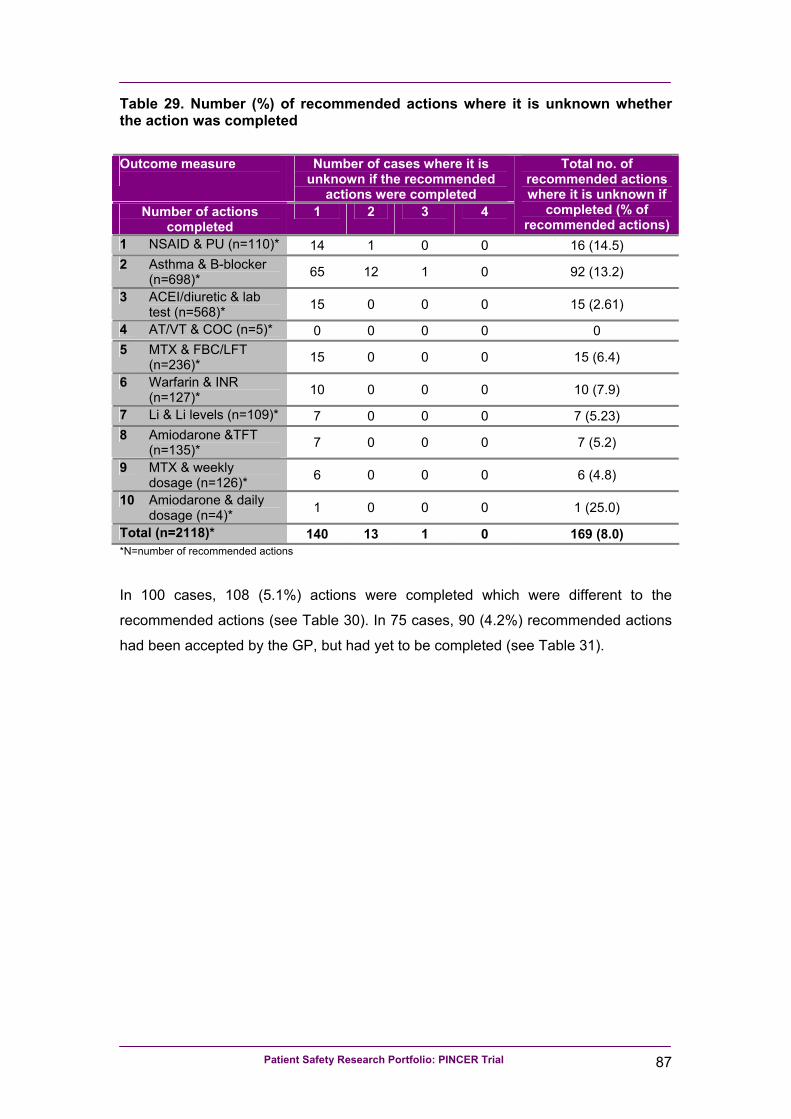
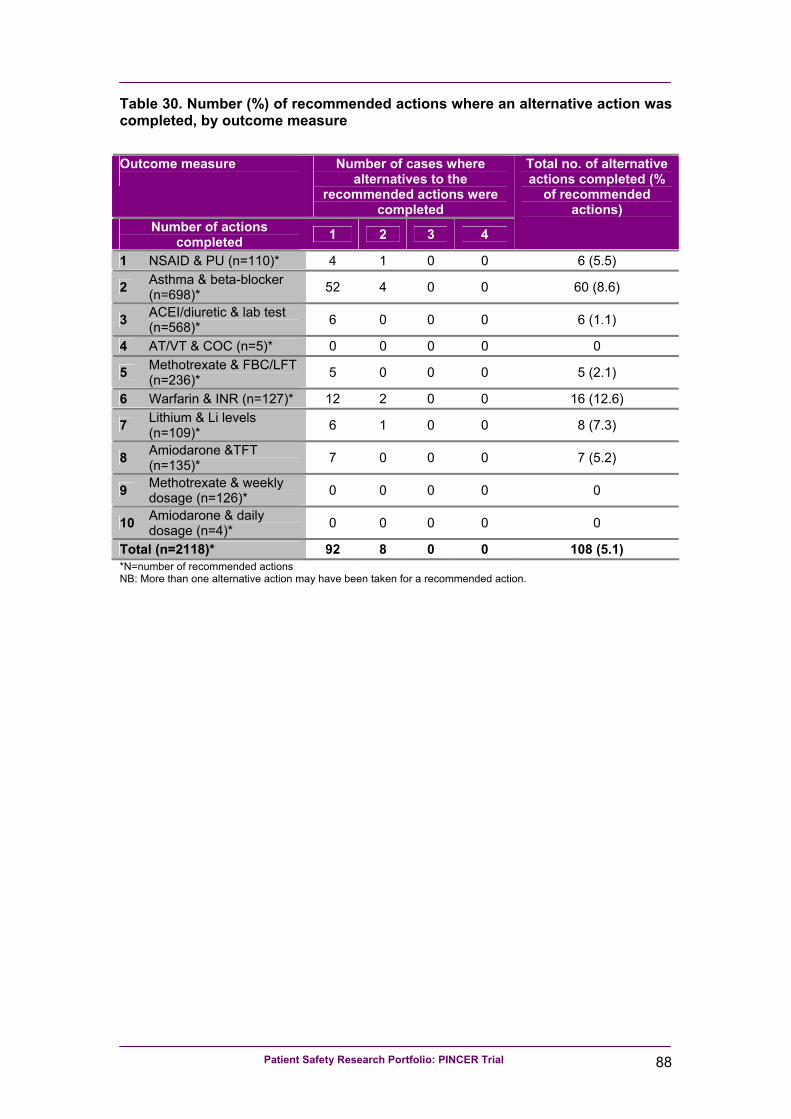
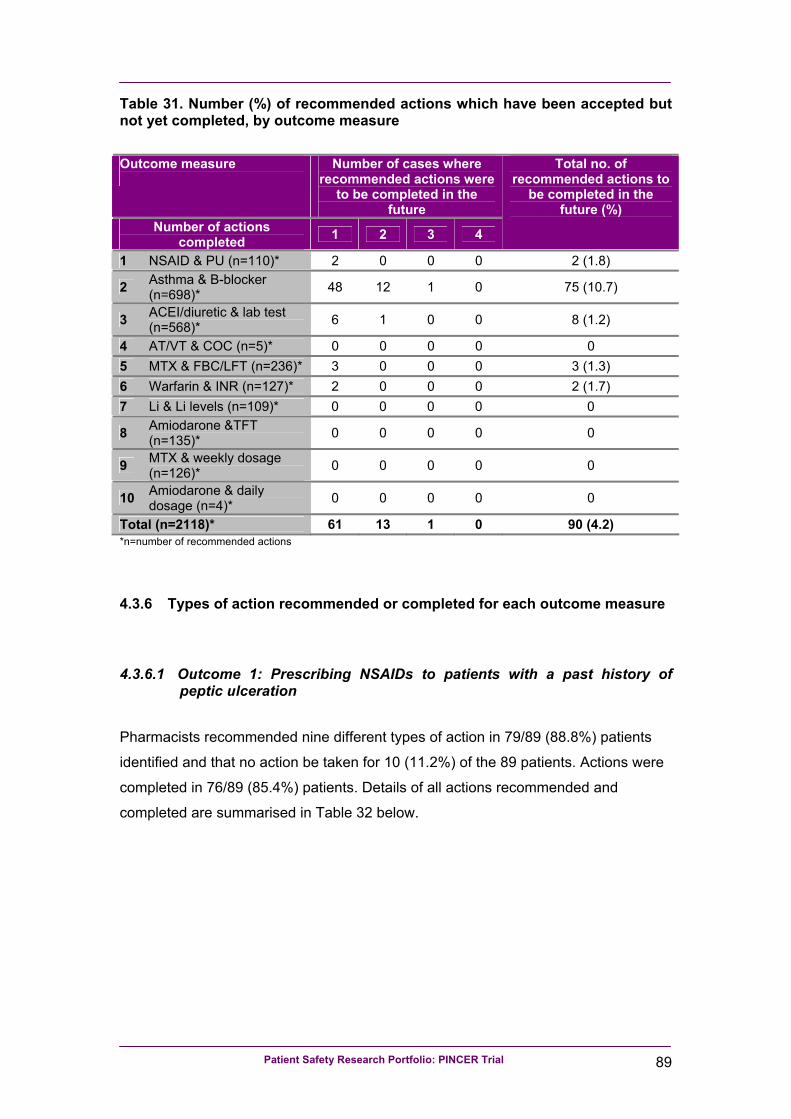
PINCER trial: a cluster randomised trial comparing the effectiveness and cost-effectiveness of a pharmacist-led IT-based intervention with simple feedback in reducing rates of
clinically important errors in medicines management in general practices
A report for the Department of Health Patient Safety Research Portfolio
February 2010
Anthony J Avery1, Sarah Rodgers2, Judith A Cantrill3, Sarah Armstrong4, Matthew Boyd6, Kathrin Cresswell5, Martin Eden3, Rachel Elliott6, Matthew Franklin6, Julia Hippisley-Cox1, Rachel Howard7, Denise Kendrick1, Caroline J Morris8, Scott A Murray5, Robin J Prescott5, Koen Putman9, Glen Swanwick10, Lorna Tuersley3, Tom Turner10, Yana Vinogradova1, Aziz Sheikh5 1Division of Primary Care, University of Nottingham Medical School, Queen’s Medical Centre, Nottingham, NG7 2UH, UK. 2Research and Evaluation Team, Quality and Governance Directorate, NHS Nottinghamshire County, Birch House, Southwell Road West, Mansfield, Nottinghamshire NG21 0HJ 3Drug Usage & Pharmacy Practice Group, School of Pharmacy & Pharmaceutical Sciences, University of Manchester, Oxford Road, Manchester, M13 9PL, UK 4Trent Research Design Service, Division of Primary Care, Tower Building, University Park, Nottingham, NG7 2RD, UK 5Centre for Population Health Sciences, University of Edinburgh, Teviot Place, Edinburgh, EH8 9AG, UK
6Division for Social Research in Medicines and Health, The School of Pharmacy, University of Nottingham, University Park, Nottingham, NG7 2RD, UK
7School of Pharmacy, University of Reading, PO Box 226, Whiteknights, Reading, RG6 6AP, UK 8Department of Primary Health Care and General Practice, Wellington School of Medicine and Health Sciences, University of Otago, Mein Street, Wellington South, New Zealand 9Department of Medical Sociology and Health Sciences, Faculty of Medicine and Pharmacy, Vrije Universiteit Brussel, Laarbeeklaan 103 B-1090 Brussel, Belgium 10Consumers in Research Advisory Group, c/o: Research and Evaluation Team, Quality and Governance Directorate, NHS Nottinghamshire County, Birch House, Southwell Road West, Mansfield, Nottinghamshire NG21 0HJ Corresponding author: Professor Anthony J Avery Division of Primary Care, University of Nottingham Medical School, Queen’s Medical Centre, Nottingham NG7 2UH Email address: [email protected] Telephone: 0115 8230207 or 8230209 Fax: 0115 8230214 Competing interests: none
Patient Safety Research Portfolio: PINCER Trial ii
Foreword
Medication related errors are now recognised internationally as an important –
potentially avoidable – source of morbidity and mortality. Although we have over
recent years developed a good understanding of the frequency of and causes
underpinning such errors, there is much less known about how effectively to reduce
the risk of harm from such errors.
This report, summarising findings from the PINCER trial and related studies, is
unique in that it provides a detailed account of how medication related errors can be
reduced in an acceptable, effective and efficient manner. Its implications will, we
hope, be profound for improving the safety of medicines management both in
England, and beyond.
We have many people to thank who have contributed to the developments that have
allowed us to arrive at this juncture and these individuals and organisations are duly
acknowledged in the report. We would however in particular like to underscore our
appreciation to the Patient Safety Research Portfolio, led by Professor Richard
Lilford, for entrusting us with the resources to undertake this work, which we hope will
aid clinicians in realising the truth in that enduring maxim ‘Primum non nocere’.
Tony Avery, Judith Cantrill and Aziz Sheikh on behalf of the PINCER Team
Nottingham, Manchester and Edinburgh
February 2010
Patient Safety Research Portfolio: PINCER Trial iii
Abstract Title PINCER trial: a cluster randomised trial comparing the effectiveness and cost-effectiveness of
a pharmacist-led IT-based intervention with simple feedback in reducing rates of clinically
important errors in medicines management in general practices
Authors Anthony J Avery, Sarah Rodgers, Judith A Cantrill, Sarah Armstrong, Matthew Boyd, Kathrin
Cresswell, Martin Eden, Rachel Elliott, Matthew Franklin, Julia Hippisley-Cox, Rachel
Howard, Denise Kendrick, Caroline J Morris, Scott A Murray, Robin J Prescott, Koen Putman,
Glen Swanwick, Lorna Tuersley, Tom Turner, Yana Vinogradova, Aziz Sheikh
Background Medication errors in general practice are an important source of potentially preventable
morbidity and mortality. Building on previous descriptive, qualitative and pilot work, we
sought to investigate the effectiveness, cost-effectiveness and likely generalisability of a
complex pharmacist-led IT-based intervention aiming to improve prescribing safety in general
practice.
Objectives We sought to:
• Test the hypothesis that a pharmacist-led IT-based complex intervention using
educational outreach and practical support is more effective than simple feedback in
reducing the proportion of patients at risk from errors in prescribing and medicines
management in general practice.
• Conduct an economic evaluation of the cost per error avoided, from the perspective of the
National Health Service (NHS).
• Analyse data recorded by pharmacists, summarising the proportions of patients judged to
be at clinical risk, the actions recommended by pharmacists, and actions completed in the
practices.
• Explore the views and experiences of healthcare professionals and NHS managers
concerning the intervention; investigate potential explanations for the observed effects,
and inform decisions on the future roll-out of the pharmacist-led intervention
• Examine secular trends in the outcome measures of interest allowing for informal
comparison between trial practices and practices that did not participate in the trial
contributing to the QRESEARCH database.
Patient Safety Research Portfolio: PINCER Trial iv
Methods Two-arm cluster randomised controlled trial of 72 English general practices with embedded
economic analysis and longitudinal descriptive and qualitative analysis. Informal comparison
of the trial findings with a national descriptive study investigating secular trends undertaken
using data from practices contributing to the QRESEARCH database. The main outcomes of
interest were prescribing errors and medication monitoring errors at six- and 12-months
following the intervention.
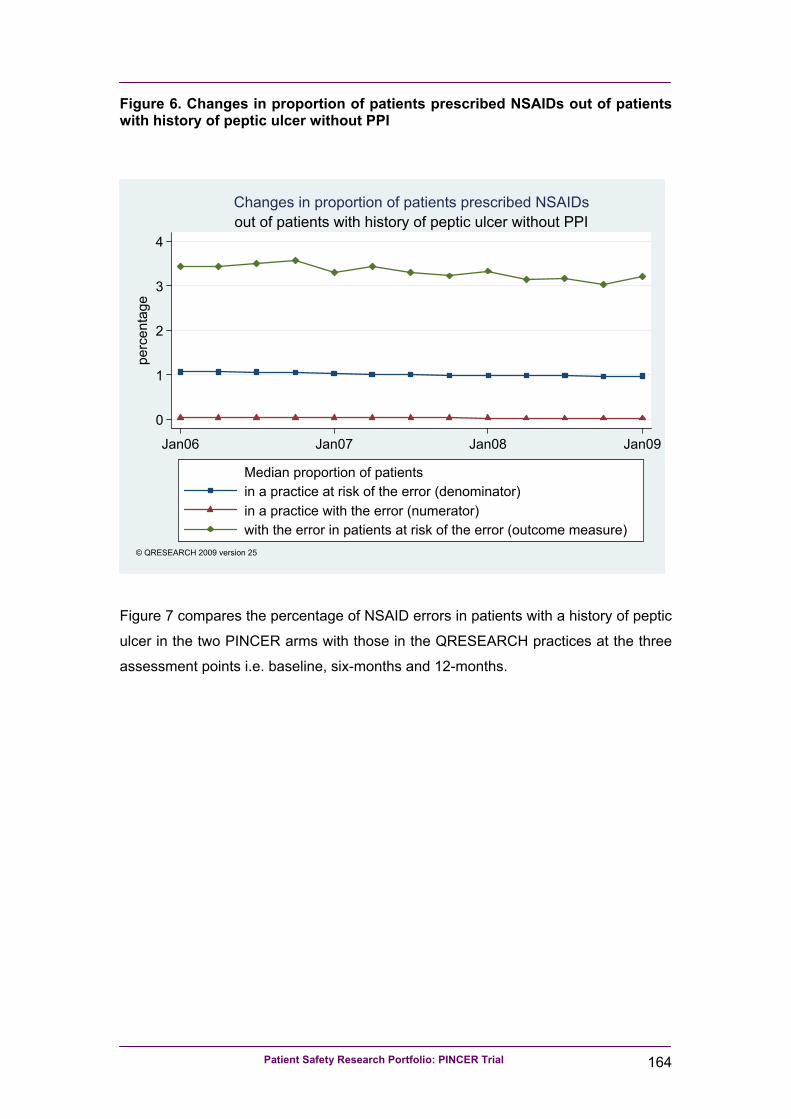
Results Participants in the pharmacist intervention arm practices were significantly less likely to have
been prescribed a non-selective NSAID without a proton pump inhibitor (PPI) if they had a
history of peptic ulcer (OR 0.58, 95%CI 0.38, 0.89), to have been prescribed a beta-blocker if
they had asthma (OR 0.73, 95% CI 0.58, 0.91) or (in those aged 75 years and older) to have
been prescribed an ACE inhibitor or diuretic without a measurement of urea and electrolytes
in the last 15 months (OR 0.51, 95% CI 0.34, 0.78).
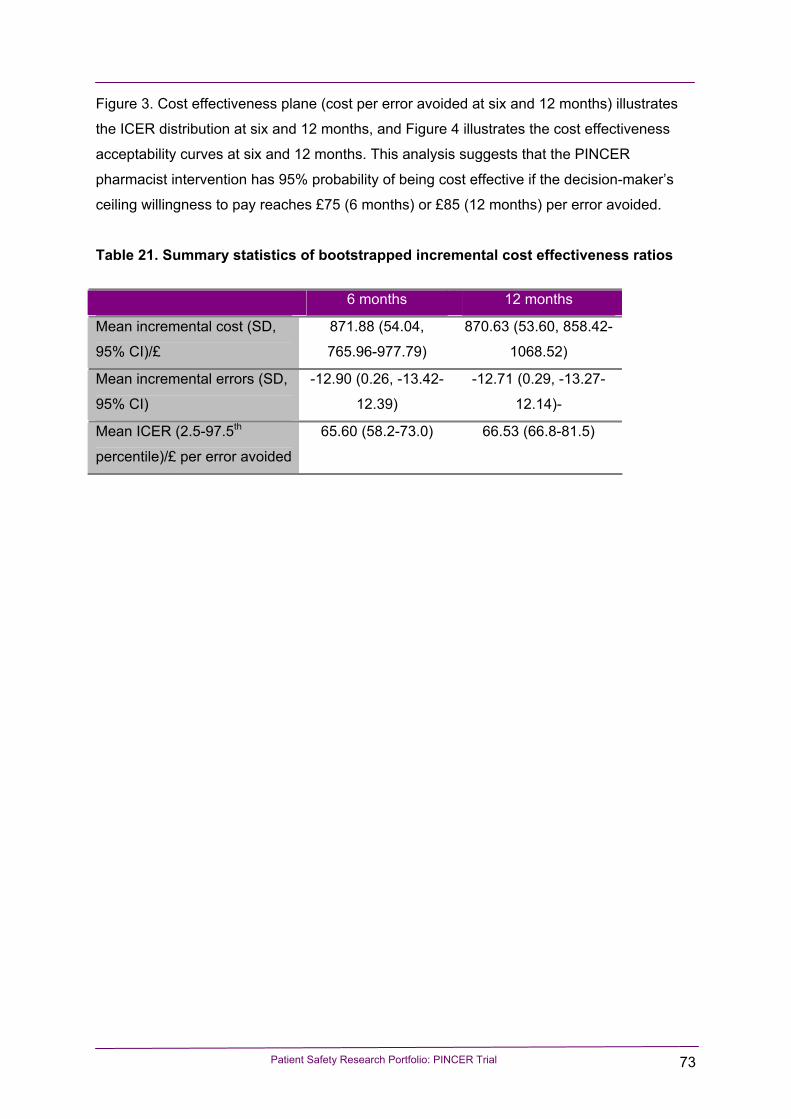
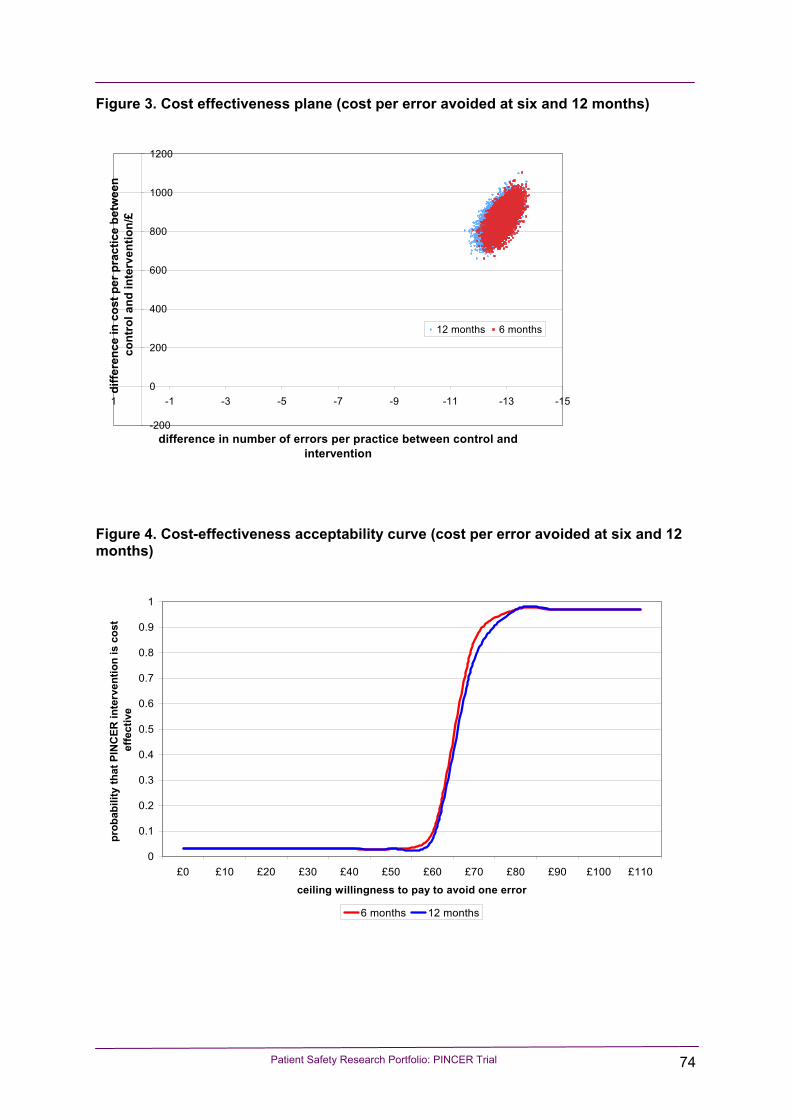
The economic analysis suggests that the PINCER pharmacist intervention has 95%
probability of being cost effective if the decision-maker’s ceiling willingness to pay reaches
£75 (6 months) or £85 (12 months) per error avoided.
The intervention addressed an issue that was important to professionals and their teams and
was delivered in a way that was acceptable to practices with minimum disruption of normal
work processes.
Comparison of the trial findings with changes seen in QRESEARCH practices indicated that
any reductions achieved in the simple feedback arm were likely, in the main, to have been
related to secular trends rather than the intervention.
Conclusions Compared with simple feedback, the pharmacist-led intervention resulted in reductions in
proportions of patients at risk of prescribing and monitoring errors for the primary outcome
measures and the composite secondary outcome measures at six-months and (with the
exception of the NSAID/peptic ulcer outcome measure) 12-months post-intervention. The
intervention is acceptable to pharmacists and practices, and is likely to be seen as cost-
effective by decision makers.
Patient Safety Research Portfolio: PINCER Trial v
List of Abbreviations
ACE: Angiotensin converting enzyme (inhibitor)
CHD: Coronary heart disease
CTU: Clinical Trials Unit
DMEC: Data Monitoring and Ethics Committee
EMIS: Egton Medical Information Systems (the name of a GP
computer system)
GP: General practitioner (or family practitioner)
ICC: Intraclass correlation coefficient
ICER: Incremental cost effectiveness ratio
IMD: Index of Multiple Deprivation
INR: International normalised ratio
IT: Information technology
Li: Lithium
MRC: Medical Research Council
NHS: The UK National Health Service
NPSA: National Patient Safety Agency
NSAIDs: non-steroidal anti-inflammatory drugs
ONS: Office for National Statistics
OR: odds ratio
PCT: Primary Care Trust
PPI: proton pump inhibitor
SPSS: Statistical Package for the Social Sciences
TFT: Thyroid Function test
TPP: The Phoenix Partnership (the name of a GP computer system)
TSC: Trial Steering Committee
U&E: Urea and electrolytes
Patient Safety Research Portfolio: PINCER Trial vi
Executive summary
Background
Medication errors occurring in general practice are an important cause of morbidity
and mortality. UK Government reports have suggested that while there may still be a
need to understand more about medication errors, the burden they pose and the
reasons for their occurrence, the priority is now to find cost-effective, acceptable and
sustainable ways of preventing patients from being harmed from such errors.
Aims
To determine the effectiveness, cost-effectiveness and acceptability of a complex
pharmacist-led information technology (IT)-based intervention compared with simple
feedback in reducing the proportion of patients at risk from hazardous prescribing
and inadequate medication monitoring in general practice.
Objectives
We sought to:
1. Test the hypothesis that a pharmacist-led IT-based complex intervention using
educational outreach and practical support is more effective than simple feedback
in reducing the proportion of patients at risk from errors in prescribing and
medicines management in general practice.
2. Conduct an economic evaluation of the cost per error avoided, from the
perspective of the National Health Service (NHS), of the pharmacist-led
intervention compared with simple feedback.
3. Explore the views and experiences of health care professionals and NHS
managers concerning the intervention; investigate potential explanations for the
observed effects, and inform the development of a model for future roll-out of the
pharmacist-led intervention depending on whether or not it proved to be effective.
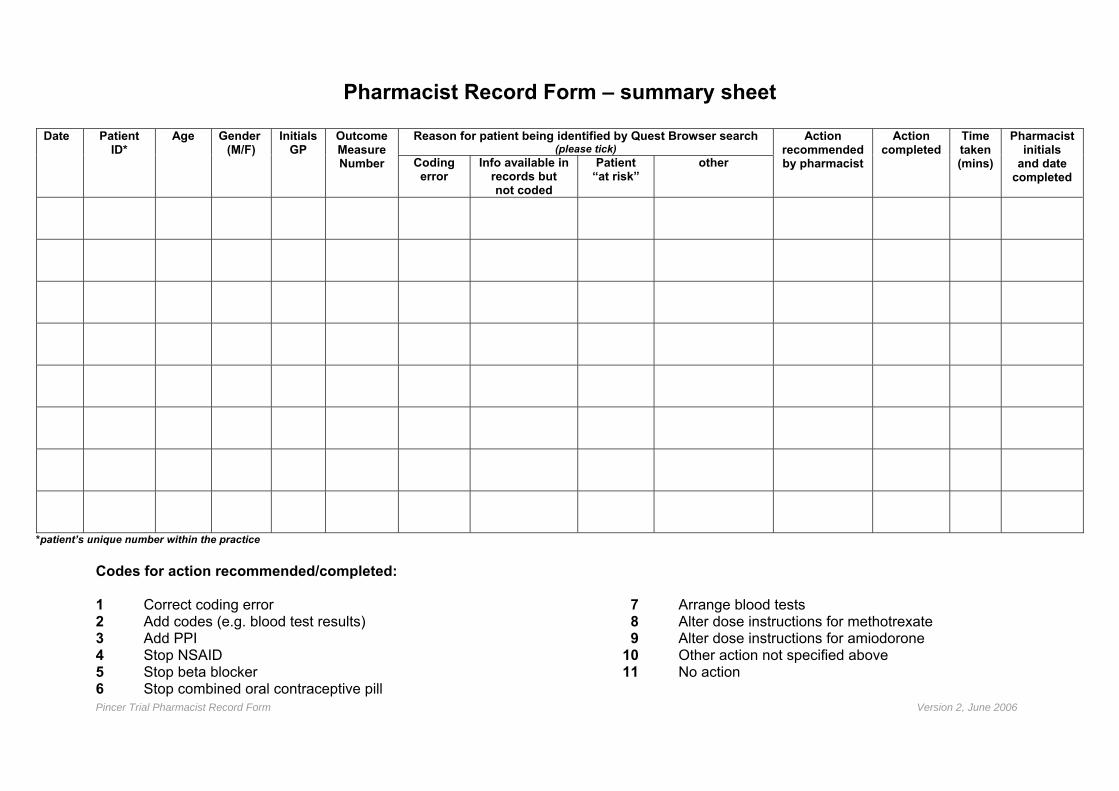
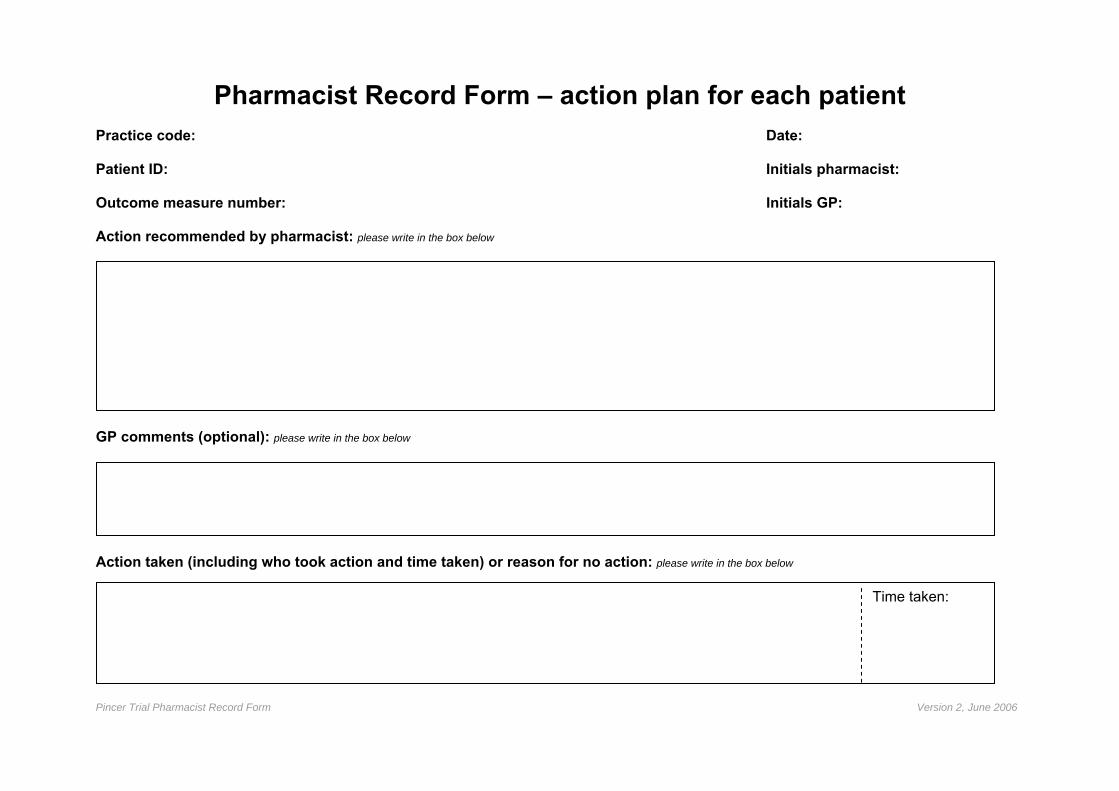
4. Analyse data recorded by pharmacists, summarising the proportions of patients
judged to be at clinical risk, the actions recommended by pharmacists, which
actions were undertaken and the time taken to: review cases, make
recommendations, and implement actions.
Patient Safety Research Portfolio: PINCER Trial vii
5. Examine secular trends in the outcome measures of interest, allowing for informal
comparison between trial practices and practices contributing to the
QRESEARCH database that did not participate in the trial.
Methods
Main trial
Research subject group: Patients, aged 18 or over, registered with computerised
general practices in two geographical regions in England.
We have also taken account of errors associated with the use of methotrexate, in
view of warnings about this drug from the Chief Pharmaceutical Officer for England4,
and lithium and amiodarone because of their narrow therapeutic indices and
nationally accepted guidance for regular blood test monitoring13.
1.1.4 Underlying causes of medication errors
There have been a number of studies that have investigated the underlying causes of
medication errors in hospitals. Leape et al, for example, identified 16 major systems
failures from an analysis of 334 errors14. The most common underlying problem was
“failure of drug knowledge dissemination” (i.e. the doctor not knowing enough about
the drug) and this accounted for 29% of errors14. In contrast, Dean et al investigated
the causes of 44 prescribing errors and found that slips in attention or failure to apply
relevant rules were the commonest underlying causes15.
Patient Safety Research Portfolio: PINCER Trial 4
There have been relatively few detailed analyses of the causes of medication errors
in primary care although several studies have identified the points in the medicines
management process where most errors occur10, 16.
Gurwitz et al found that the majority of preventable adverse drug events associated
with community-based prescribing were due to errors in the prescribing and
monitoring phases of pharmaceutical care16. These findings were mirrored in the
study of drug-related hospital admissions that was undertaken in Nottingham, UK10,
where 35% of admissions were thought to be due to unsafe prescribing decisions
and 26% due to inadequate monitoring.
Our analysis of these studies suggest that in aiming to reduce rates of medication
error in general practice the key factors that need to be addressed are:
• Ensuring that general practitioners (GPs) are aware of the risks of the drugs most
commonly associated with adverse events.
• Ensuring that GPs recognise the hazards of rule violation, e.g. prescribing drugs
that are contraindicated.
• Developing robust systems for monitoring patients on high-risk medications
(including call and recall for blood tests) so that patients are not exposed to
correctable hazards.
We have taken account of these issues in the design of the complex pharmacist-led
information-technology (IT) based intervention for our trial.
1.1.5 The development of methods for identifying medication errors using GP computer systems
The use of clinical computer systems to identify patients with medication errors is a
potentially powerful method for “error trapping” that may allow general practices to
correct errors before patients are harmed.
We used MIQUEST17 software successfully in our pilot work to identify preventable
drug-related morbidity in general practice18, 19. This process involved writing precise
computer queries that are capable of extracting the information required.
Patient Safety Research Portfolio: PINCER Trial 5
In our pilot work18, 19, we found the processing of MIQUEST data very time-
consuming. This is because it usually involves visiting general practices to extract
data and then a considerable amount of work in processing and checking the data.
Also, it does not produce user-friendly output for practices on individual patients who
are deemed to be “at risk”.
We resolved these problems through the use of an additional type of software called
Quest Browser (www.tcr.i12.com). This well-established software uses MIQUEST
queries of GP computer systems, but has several advantages over using MIQUEST
alone. Firstly, it can produce user-friendly feedback at the practice-level on patients
with medication errors (or any other clinical problem). Secondly, output from Quest
Browser can be imported straight into a database without the need for additional
manipulation. Thirdly, Quest Browser has a facility (called Quest Browser Central)
whereby, with agreement from the practices and research ethics committees, linked-
anonymised data can be sent to researchers in an encrypted form via the Internet.
This reduces the number of visits that researchers need to make to practices and
helps with the timely collection of large volumes of data.
1.1.6 Development of the complex pharmacist-led IT-based intervention
Informed by the Medical Research Council’s (MRC) framework for complex
interventions20, we took account of the theoretical considerations outlined above,
along with pilot work, to develop the pharmacist-led IT-based intervention. This is
described in more detail below (see “pharmacist-led intervention” section).
1.2 Aims of the study
To determine the effectiveness, cost-effectiveness and acceptability of a complex
pharmacist-led information technology (IT)-based intervention compared with simple
feedback in reducing the proportion of patients at risk from hazardous prescribing
and inadequate medication monitoring in general practice.
Patient Safety Research Portfolio: PINCER Trial 6
1.3 Specific objectives
We sought to:
1. Test the hypothesis that a pharmacist-led IT-based complex intervention using
educational outreach and practical support is more effective than simple feedback
in reducing the proportion of patients at risk from errors in prescribing and
medicines management in general practice.
2. Conduct an economic evaluation of the cost per error avoided, from the
perspective of the National Health Service (NHS), of the pharmacist-led
intervention compared with simple feedback.
3. Examine secular trends in the outcome measures of interest allowing for informal
comparison between trial practices and practices contributing to the
QRESEARCH database that did not participate in the trial.
4. Analyse data recorded by pharmacists, summarising the proportions of patients
judged to be at clinical risk, the actions recommended by pharmacists, which
actions were undertaken and the time taken to: review cases, make
recommendations, and implement actions.
5. Explore the views and experiences of health care professionals and NHS
managers concerning the intervention; investigate potential explanations for the
observed effects, and inform decisions on the future roll-out of the pharmacist-led
intervention depending on whether or not it proved to be effective.
Patient Safety Research Portfolio: PINCER Trial 7
2 Chapter 2: Main trial
Patient Safety Research Portfolio: PINCER Trial 8
2.1 Introduction
In this chapter we present the methods, results and discussion for the main trial.
2.2 Methods
2.2.1 Trial design
We conducted a two-arm pragmatic cluster randomised trial. Trial practices received
either i) computerised feedback on patients identified to be at risk from potentially
hazardous prescribing and medicines management (simple feedback’) or ii) a
complex pharmacist-led IT-based intervention in addition to computerised feedback.
2.2.2 Eligibility of general practices for entering the trial
2.2.2.1 Inclusion criteria:
• English NHS general practices within a 50 mile radius of Manchester and
Nottingham.
• Practices within NHS primary care trusts (PCTs) that agreed to be involved in the
study.
• Practices that were laboratory-linked (or had other reliable systems for recording
blood test results on the practice computer system) for at least 15 months prior to
the time of baseline data collection (being laboratory-linked means having all
blood test results relayed electronically to the practice so that these can be
downloaded into patients’ computerised records).
2.2.2.2 Exclusion criteria:
• Practices that stated they did not routinely record morbidities such as asthma or
peptic ulcer on patients’ computerised records.
• Practices not routinely using their computers to record prescriptions issued.
Patient Safety Research Portfolio: PINCER Trial 9
• Practices that were intending to change their GP computer systems to that of a
different supplier which was not Quest Browser compatible during the course of
the study.
• Practices in PCTs that were undertaking interventions that might overlap with our
intervention.
• Practices that were involved in the pilot study for the trial.
• Practices that already had a dedicated practice pharmacist (over and above that
provided by their PCT).
• Practices that expected major changes in list size (numbers of registered
patients) during the course of the study, either because of the splitting up of the
practice, merger with other practices or any other reason for a large influx or loss
of patients.
2.2.3 Recruitment of general practices
We wrote to 240 general practices in PCTs in Nottinghamshire, Staffordshire and
Central and Eastern Cheshire, England informing them of the study. Where practices
expressed an interest in participating we arranged a face-to-face meeting at which
the study was explained in more detail. A member of the practice team then signed a
consent form, on behalf of the practice, if the practice decided to participate. Copies
of letters to general practices, information leaflets and consent forms are provided in
Appendix 1.
2.2.3.1 Patients
For the main trial it was not necessary to recruit individual patients because data
were extracted electronically and no patient-identifiable data left practices or was
accessible to research staff. Nevertheless, practices were provided with lists of
patients identified by the computer searches used in the trial. In addition, patients
were recruited for the economic analysis and details of this are provided in Chapter
3: Pincer economic analysis.
Patient Safety Research Portfolio: PINCER Trial 10
2.2.4 Interventions
We did not feel it would be appropriate to randomise practices to a no intervention
control arm. This is because it would have meant identifying patients at risk from
medication errors with there being no prospect of these being rectified.
We decided on a two arm study with one receiving simple feedback and the other
receiving a complex pharmacist-led intervention.
2.2.4.1 Simple feedback
Those practices randomly allocated to this arm received computerised feedback on
patients identified to be at risk from potentially hazardous prescribing and medicines
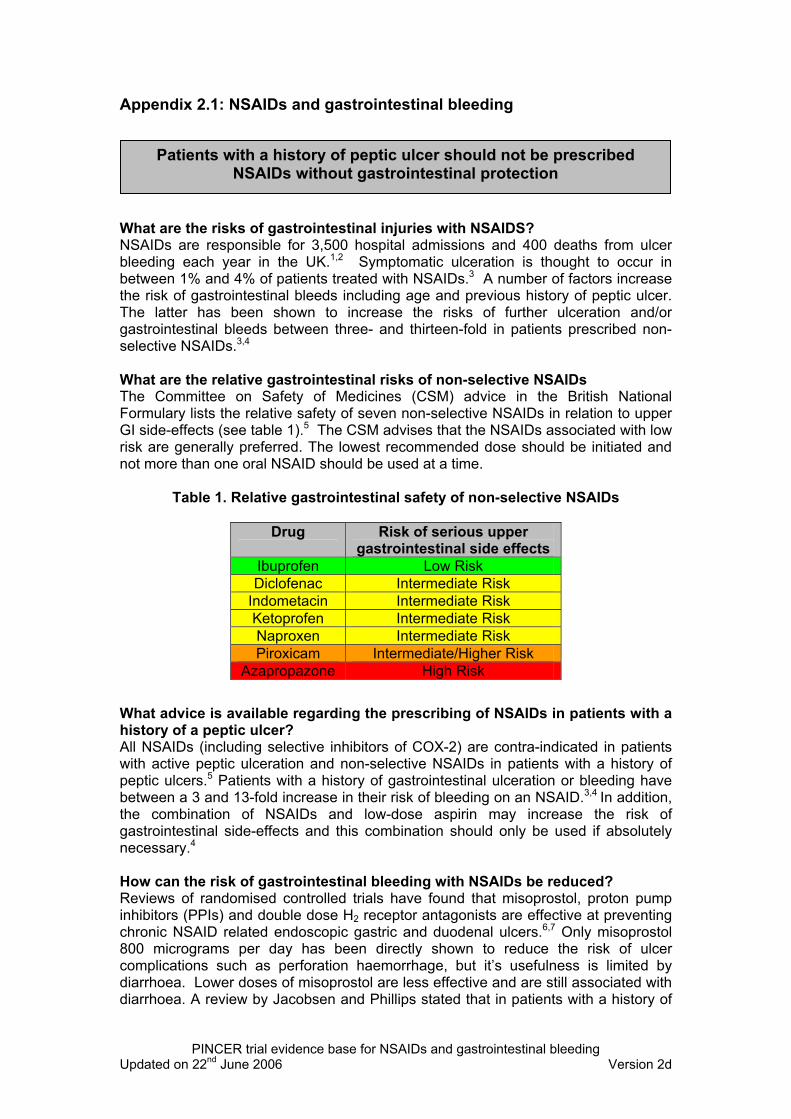
management along with brief written educational materials explaining the importance
of each type of error (in terms of the evidence-base and risks associated with each
error (see Appendix 2). This information was given to a nominated member of the
general practice (usually the practice manager) after baseline data had been
collected from the practice computer system, using Quest Browser software.
Practices in the simple feedback arm were asked to try to make any changes to
patients’ medications within a 12 week (intervention) period following the baseline
data collection.
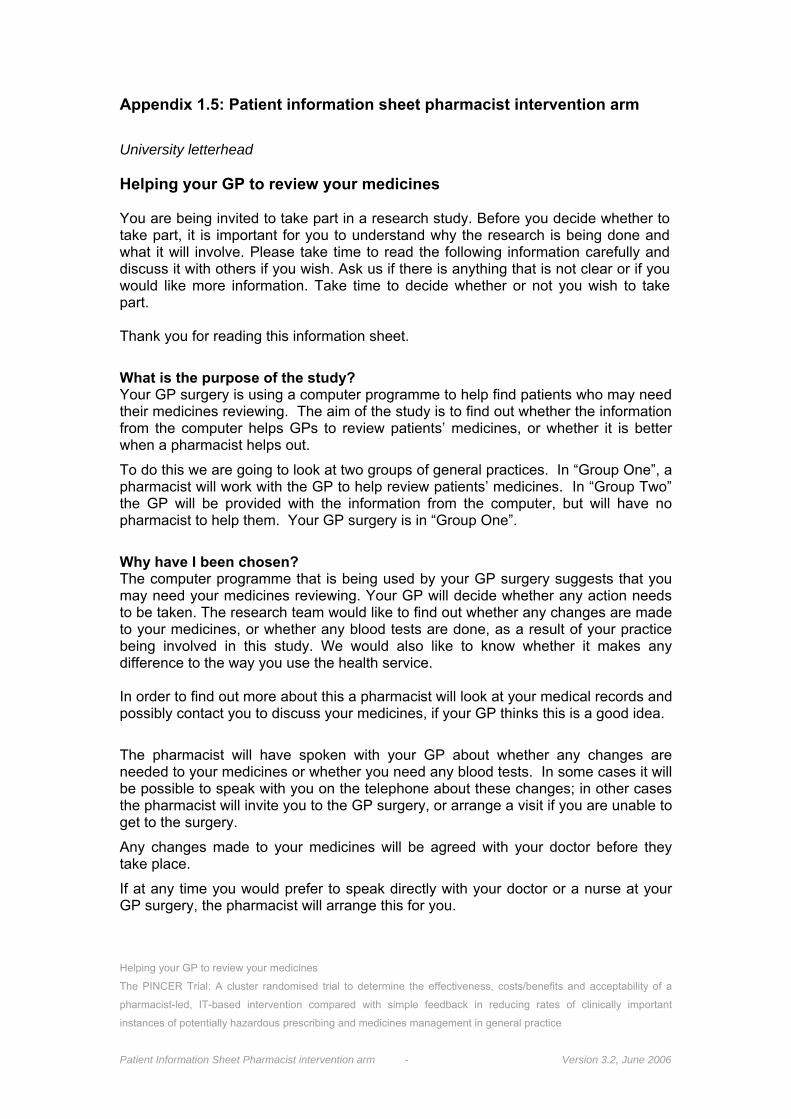
2.2.4.2 Pharmacist intervention
Those practices randomly allocated to this arm received simple feedback and in
addition, had a complex pharmacist-led IT-based intervention.
First, the trial pharmacists arranged to meet with members of the practice team to
discuss the computer-generated feedback on patients with medication errors. All
doctors were encouraged to attend this meeting along with at least one member of
the nursing staff, the practice manager and at least one member of the reception
staff.
Patient Safety Research Portfolio: PINCER Trial 11
Before the meeting, wherever possible, all relevant members of staff were provided
with a brief summary of the objectives of the pharmacist-led intervention and a
summary of the findings from the computer search.
At the meeting the pharmacists were asked to use the following approach derived
from the principles of educational outreach21 while also taking account of human
error theory6:
• Establish professional credibility by explaining their own background in clinical
pharmacy and their affiliation with either the University of Manchester or
University of Nottingham (depending on the site they are working from).
• Take a non-judgemental approach in all discussions with members of the practice
team.
• Outline the findings from the computer search.
• Explore the views of team members about the findings.
• Investigate the baseline knowledge of team members regarding the importance of
each of the errors.
• Provide clear, concise, evidence-based materials on each of the errors,
encouraging active participation by team members.
• Explore the views of team members on the underlying causes of the medication
errors (using root-cause analysis techniques22 where appropriate).
• Explain their availability to work part-time with the practice over the following 12
weeks to:
- Help take corrective action in individual patients with medication errors.
- Help improve the systems operating in the practice in order to prevent
future errors.
• Encourage the team to agree on an action plan with clear objectives.
• Ask for a member of the practice team to volunteer to liaise with the pharmacist
over arrangements for making changes to individual patients’ medication and
introducing changes to systems within the practice.
• Ask the practice to agree to a follow-up meeting within four to six weeks of the
initial meeting.
Following this initial meeting, the pharmacists used a range of techniques to help
correct the medication errors that had been identified and prevent future medication
Patient Safety Research Portfolio: PINCER Trial 12
errors. They were asked to work closely with the practice team member assigned to
provide liaison with other members of the practice.
We envisaged that the pharmacists would be taking any, or all, of the following
approaches to deal with patients identified to be at risk from hazardous prescribing
and medicines management:
• Inviting patients into the surgery for a prescription review with the pharmacist, or
a member of the general practice team, with the aim of correcting medication
errors, e.g.
- For patients with a past history of peptic ulcer who were being prescribed
a non-selective NSAID to either:
Stop the NSAID.
Add a proton pump inhibitor (PPI).
Consider using a selective inhibitor of cyclo-oxygenase-2
(COX-2 inhibitor), while recognising concerns about these
drugs in relation to cardiovascular risk.
- For patients with asthma who were being prescribed a beta-blocker:
In those taking beta-blocker eye drops for glaucoma, to
change to an alternative preparation.
In those taking oral beta-blockers, to carefully consider the
risks and benefits of the medication and, where
appropriate, slowly withdraw the drug and replace it with an
alternative preparation.
- For patients who were being prescribed methotrexate without instructions
that it should be taken weekly:
Carefully check the dosage instructions.
Convey this information to the patient verbally and in
writing.
Ensure that accurate dosage instructions were entered
onto the computer system so that these would be printed
out when the prescription was next issued.
• Inviting the following groups of patients to have a blood test:
- Those aged 75 years and older being prescribed ACE inhibitors or loop
diuretics who had not had a blood test to check renal function and
electrolytes within the previous 15 months.
Patient Safety Research Portfolio: PINCER Trial 13
- Those being prescribed methotrexate who had not had a full blood count
or liver function test within the previous three months.
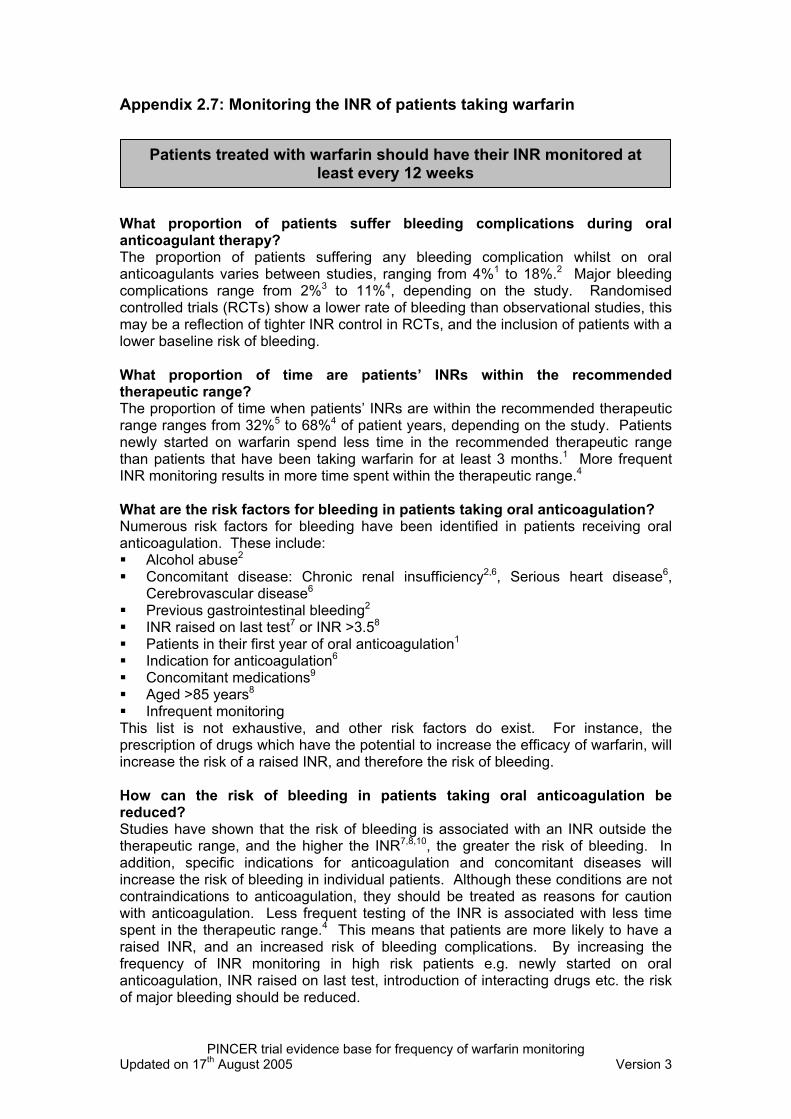
- Those being prescribed warfarin who had not had an INR test within the
previous 12 weeks (this is the maximum interval recommended by the
British National Formulary (BNF)13.
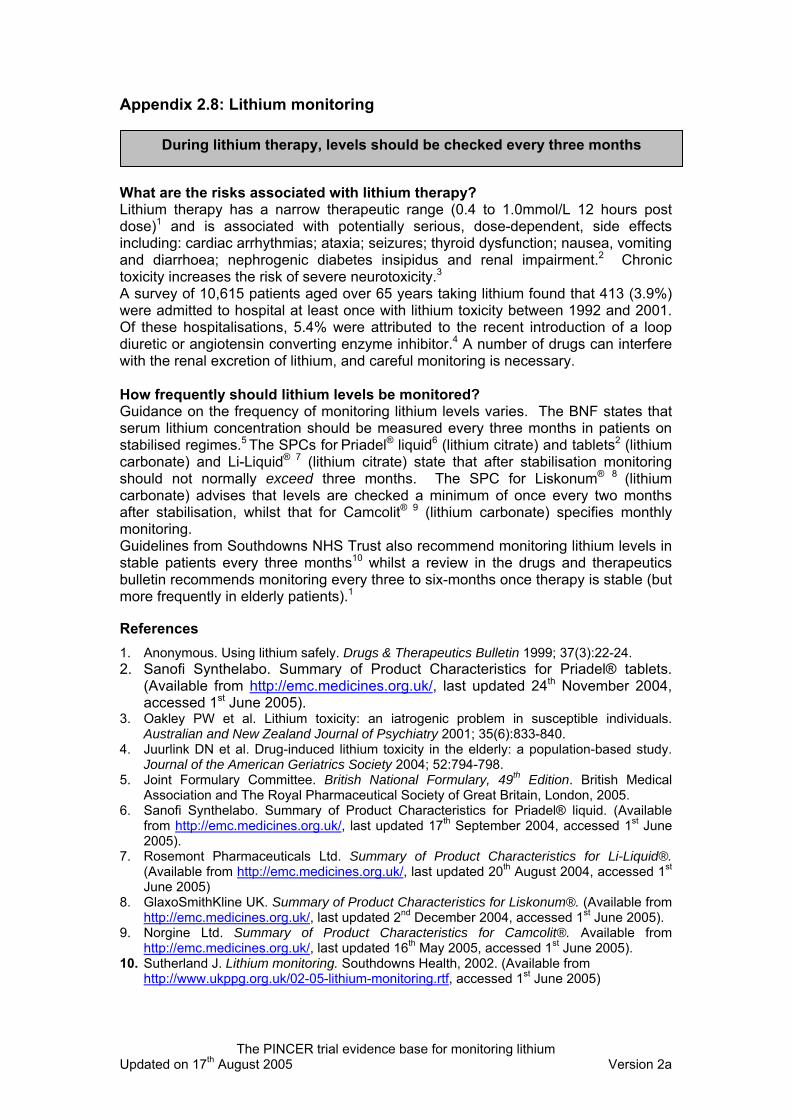
- Those being prescribed lithium who had not had a lithium level recorded
within the previous 3 months.
We envisaged the pharmacists taking the following approaches to try to prevent
future instances of hazardous prescribing and medicines management, having
agreed these approaches with the practice teams:
• In relation to hazardous prescribing:
- Meeting up with any doctors unable to attend the initial meeting in order to
provide educational outreach.
- Reinforcement of educational messages provided at the initial meeting by
repeating these messages at future meetings.
- Encouraging doctors to take heed of contraindication messages on their
computer systems.
• In relation to inadequate blood-test monitoring:
- Encouraging practices to use their computer systems to automatically
recall patients for a blood test if they had gone beyond a pre-specified
time.
- To use routine prescription reviews as the trigger for ensuring that if
patients needed blood tests, these were arranged.
Throughout the intervention period the pharmacists were asked to maintain regular
contact with the practice liaison member of staff to facilitate changes and discuss,
and resolve, any difficulties encountered. The pharmacists were asked to keep a
written log of changes made in relation to patients with medication errors, and
changes made to practice systems.
Towards the end of the intervention period, the pharmacists were asked to undertake
a further check of patients’ computer records to provide feedback to practices on
progress made in correcting medication errors. They were asked to arrange a final
meeting with members of the practice team to:
Patient Safety Research Portfolio: PINCER Trial 14
• Provide feedback on progress made in dealing with patients identified to be at
risk from potentially hazardous prescribing and medicines management.
• Provide feedback on changes made to safety systems.
• Reinforce key educational messages.
• Agree on an action plan for the practice to continue to work towards reducing
instances of hazardous prescribing and medicines management.
2.2.5 Allocation of trial interventions
The practice was the unit of allocation. Consenting practices were stratified by centre
(two strata: Manchester and Nottingham) and the size of the practice population
(three strata: <2500, 2500-6000, >6000) and randomly allocated within strata (1:1
ratio) to one of the two intervention arms.
The reason for stratifying by centre was to help ensure an even distribution of
practices allocated to each of the intervention groups within each centre. The reason
for stratifying by size of the patient population in each general practice was because
a trial of educational outreach suggested that the larger the practice the more difficult
it is to make changes to practice23.
Block randomisation, using non-predictable block sizes of either two or four, was
used to ensure a similar number of practices in each arm. Practices were centrally
randomised using the independent Internet-based randomisation service provided by
the Clinical Trials Unit (CTU) at the University of Nottingham. Access to the
sequence was confined to the CTU Data Manager (who was independent from the
study team). The sequence of treatment allocations was concealed until all data
analyses had been completed.
2.2.6 Outcome measures
In identifying outcome measures for our proposed trial we took account of a number
of factors. We decided that the outcome measures needed to be:
Patient Safety Research Portfolio: PINCER Trial 15
• Examples of hazardous prescribing or inadequate medication monitoring that
are important in terms of morbidity.
• Detectable by interrogation of GP computer systems.
• Limited in number so that it would be feasible for general practices and
pharmacists to make potentially major changes in error rates.
In deciding on examples of hazardous prescribing or inadequate medication
monitoring that are important in terms of morbidity we took into account:
• A number of studies on preventable drug-related morbidity.7-9
• Literature in relation to specific examples of hazardous prescribing or
inadequate medication monitoring (see Appendix 2).
• Our own work on the development of indicators of preventable drug-related
morbidity.10-12
• Warnings from the Committee on Safety of Medicines (CSM) in the UK
(http://medicines.mhra.gov.uk/home ).
A key factor in deciding on our primary outcome measures was that the prevalence
rate of the relevant medication errors needed to be great enough that a clinically
important change could be detected using a number of practices that is feasible
within the funding allocated to the study.
Outcome measures were measured at the following two time points:
• Six-months after the end of the intervention period.
• 12-months after the end of the intervention period.
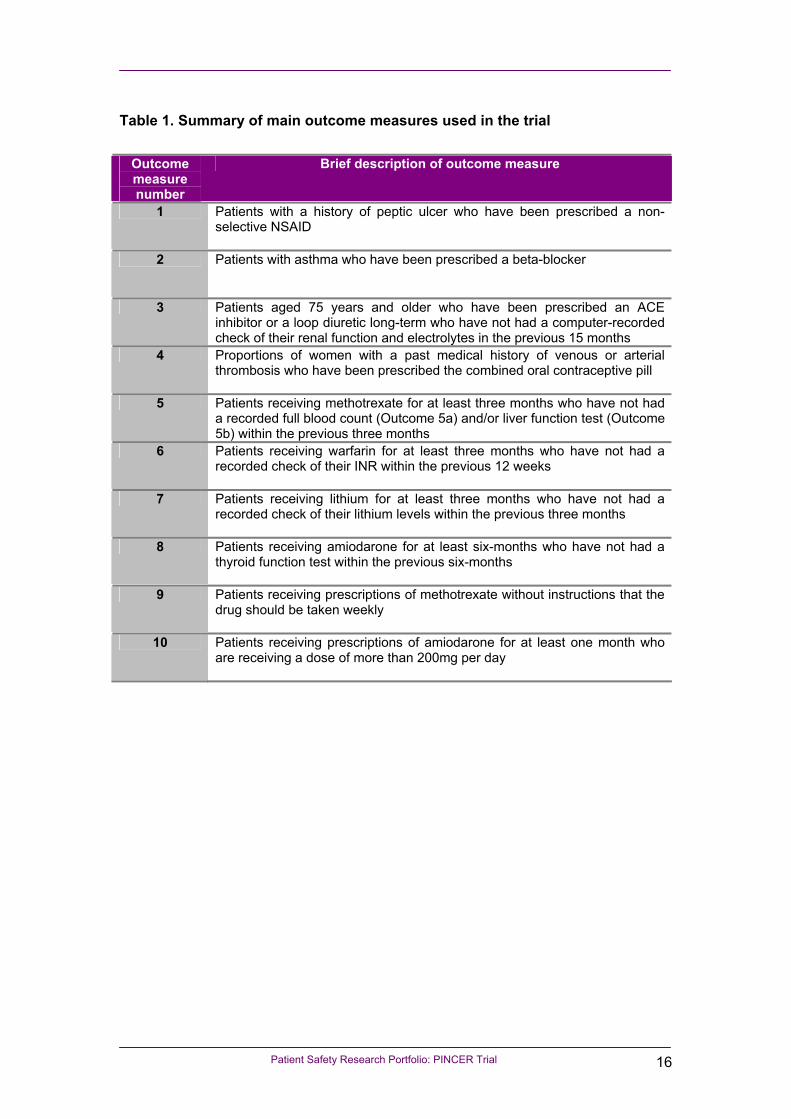
A summary of the main outcome measures is given in Table 1. The measures are
described in more detail in section 2.2.6.
Patient Safety Research Portfolio: PINCER Trial 16
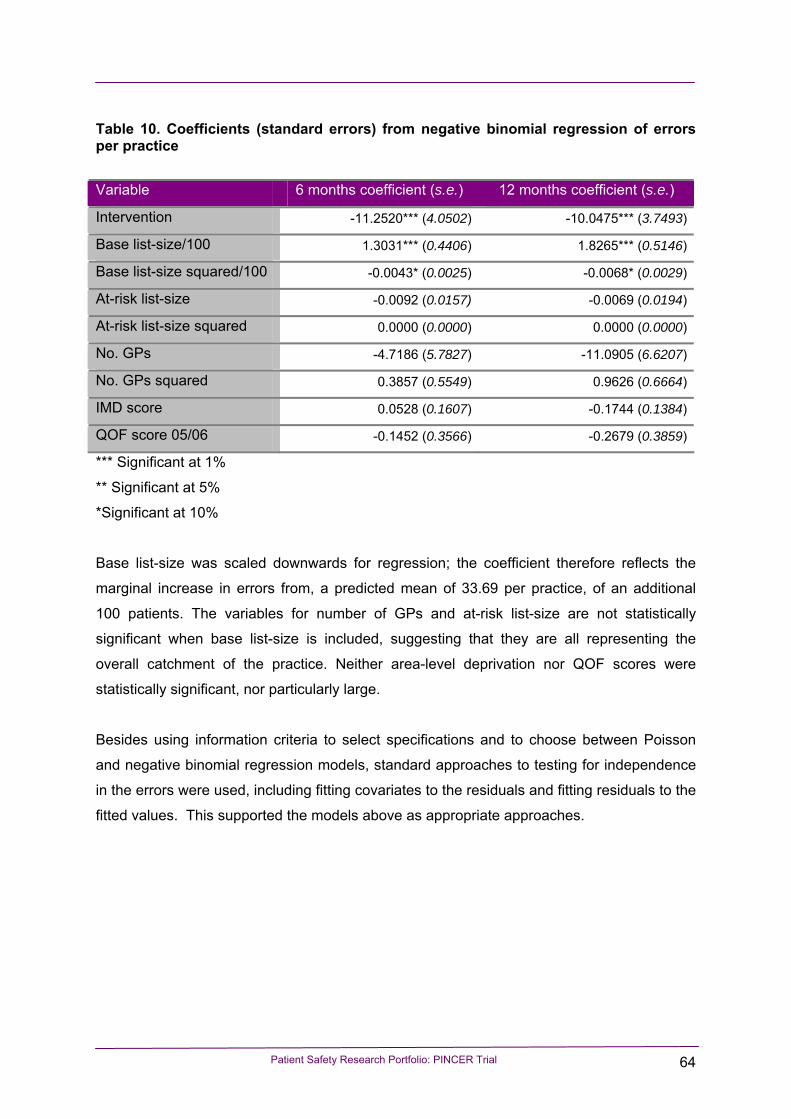
Table 1. Summary of main outcome measures used in the trial
Outcome measure number
Brief description of outcome measure
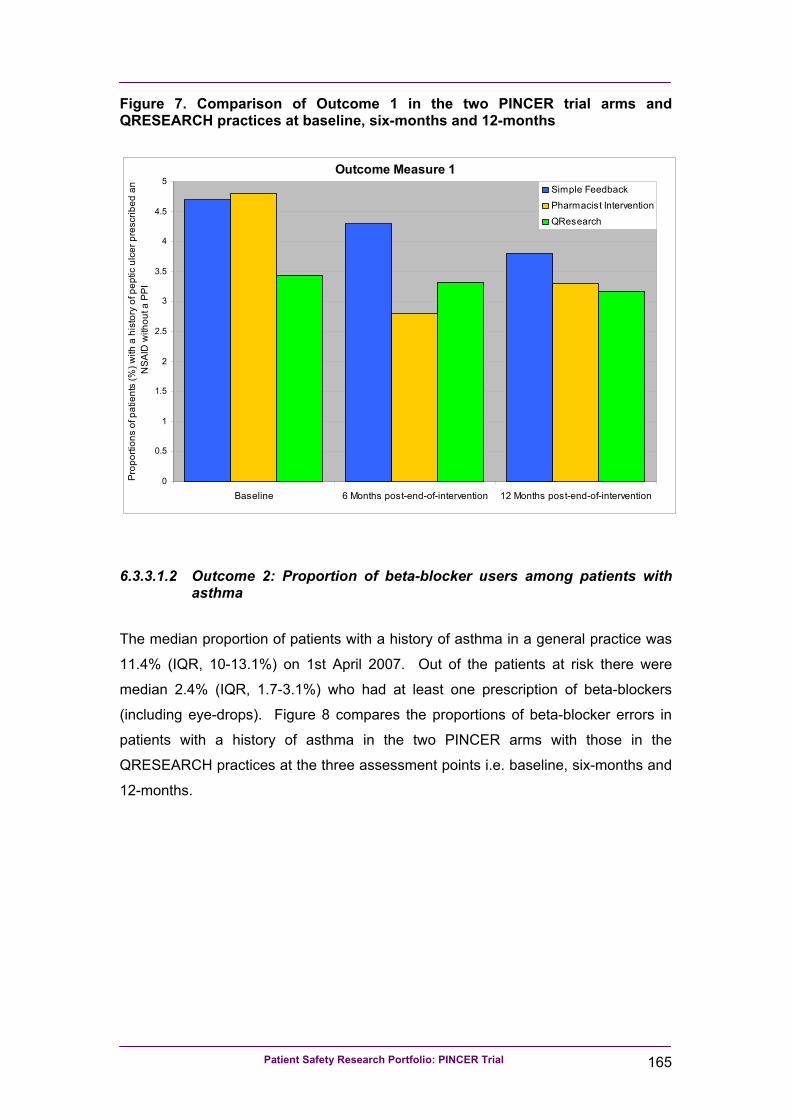
1 Patients with a history of peptic ulcer who have been prescribed a non-selective NSAID
2 Patients with asthma who have been prescribed a beta-blocker
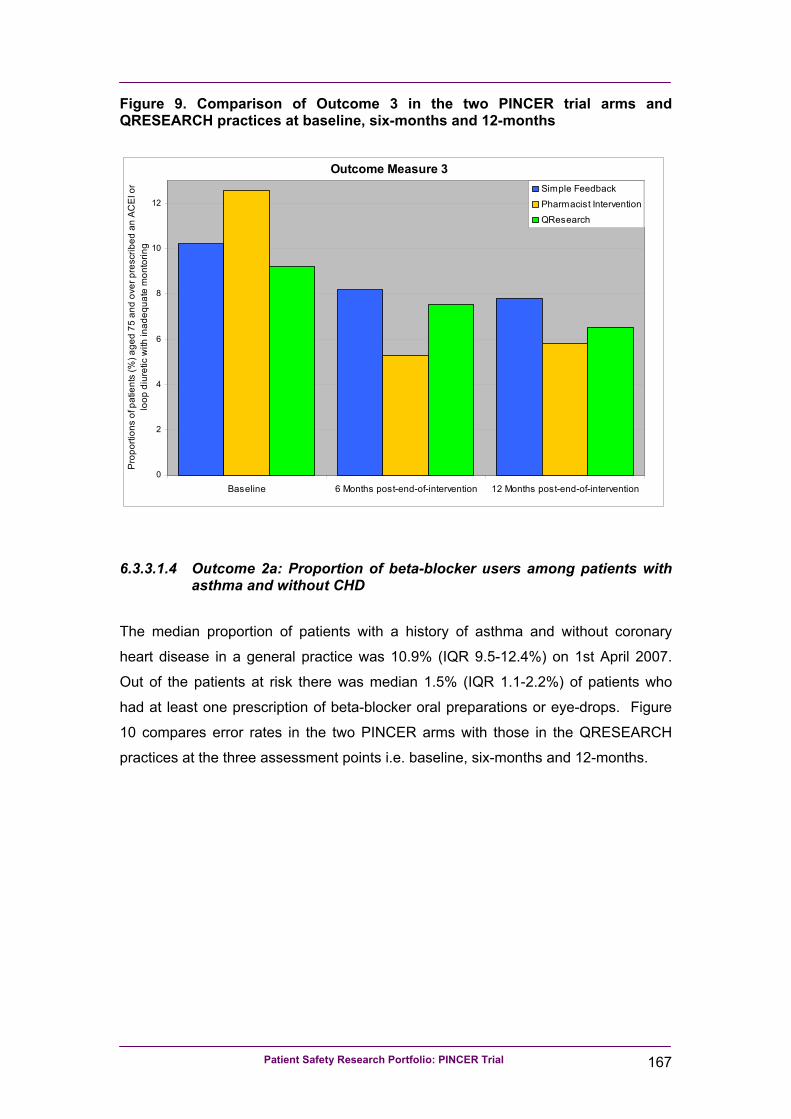
3 Patients aged 75 years and older who have been prescribed an ACE inhibitor or a loop diuretic long-term who have not had a computer-recorded check of their renal function and electrolytes in the previous 15 months
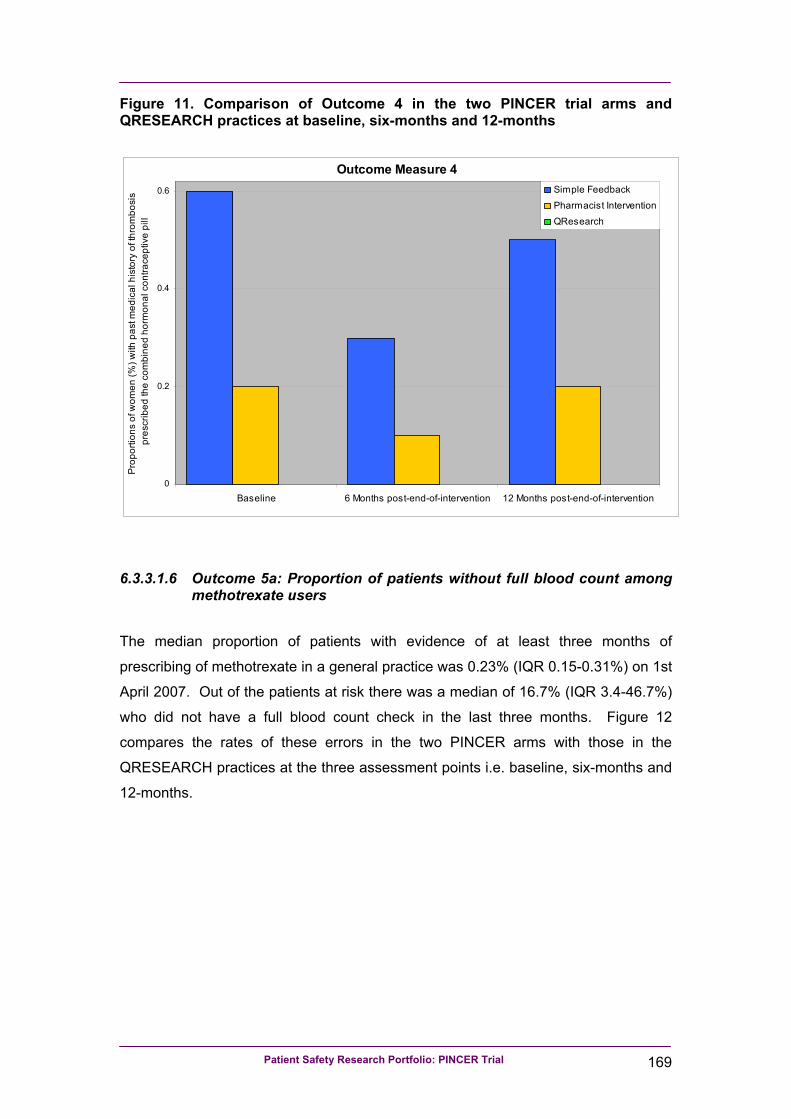
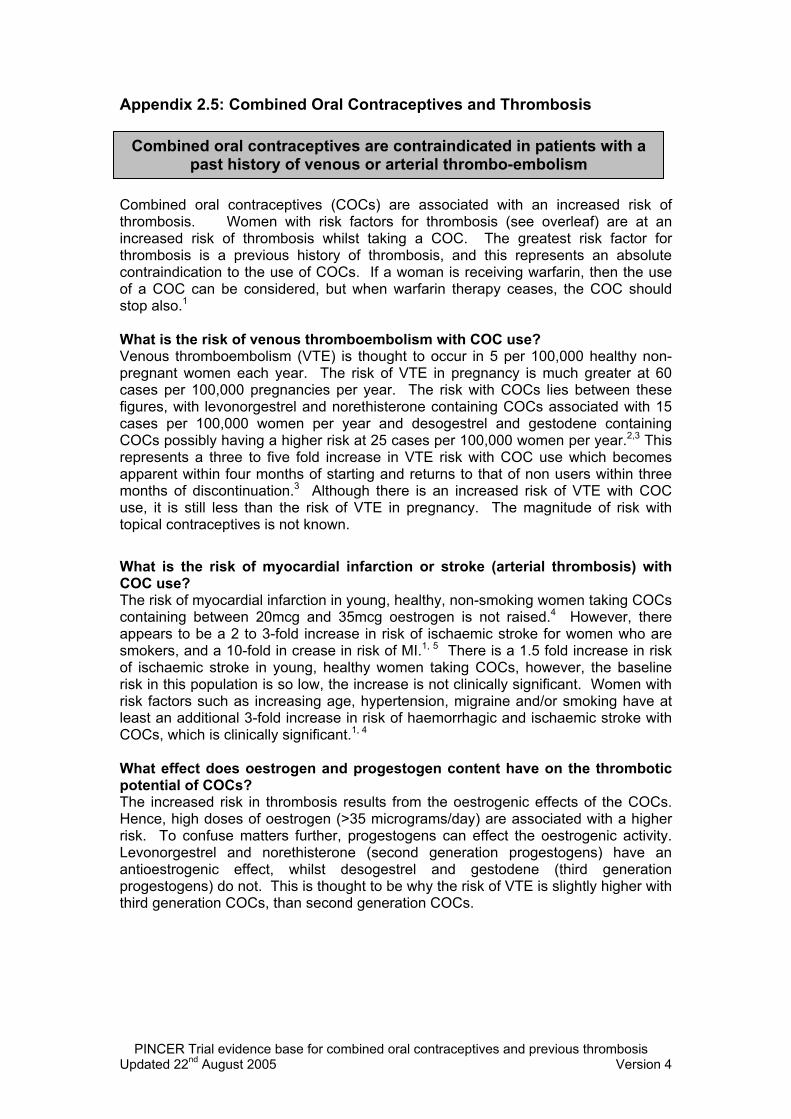
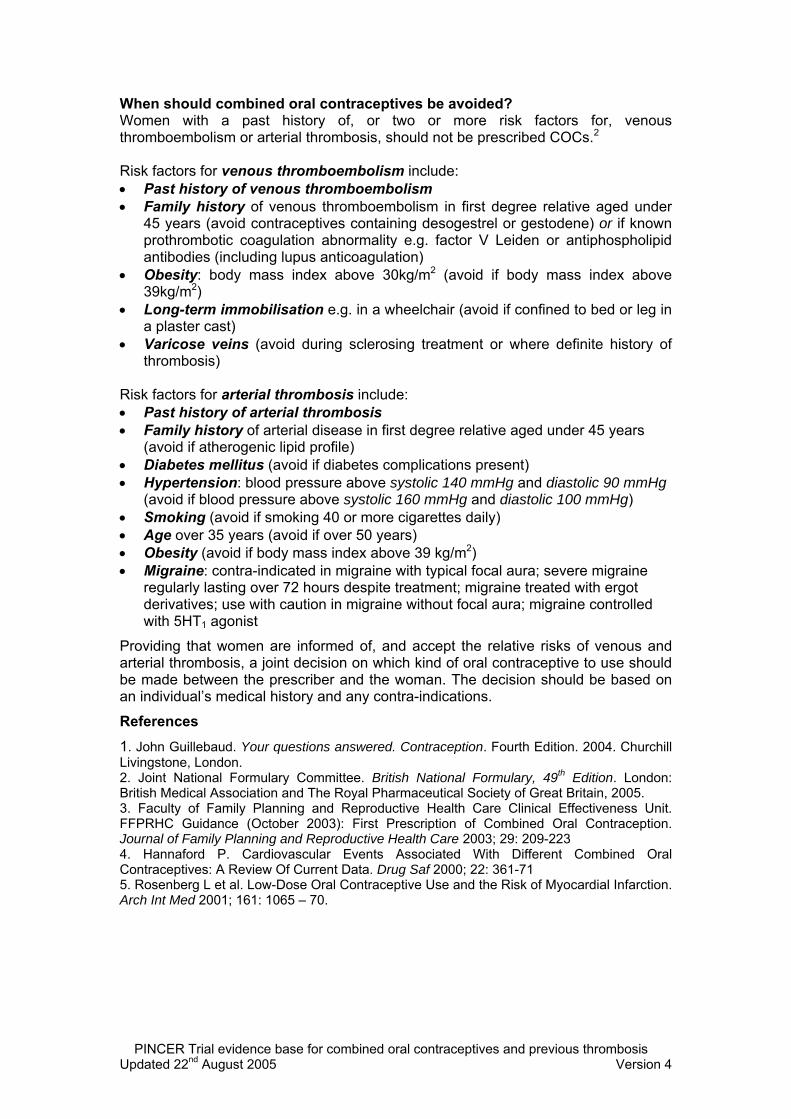
4 Proportions of women with a past medical history of venous or arterial thrombosis who have been prescribed the combined oral contraceptive pill
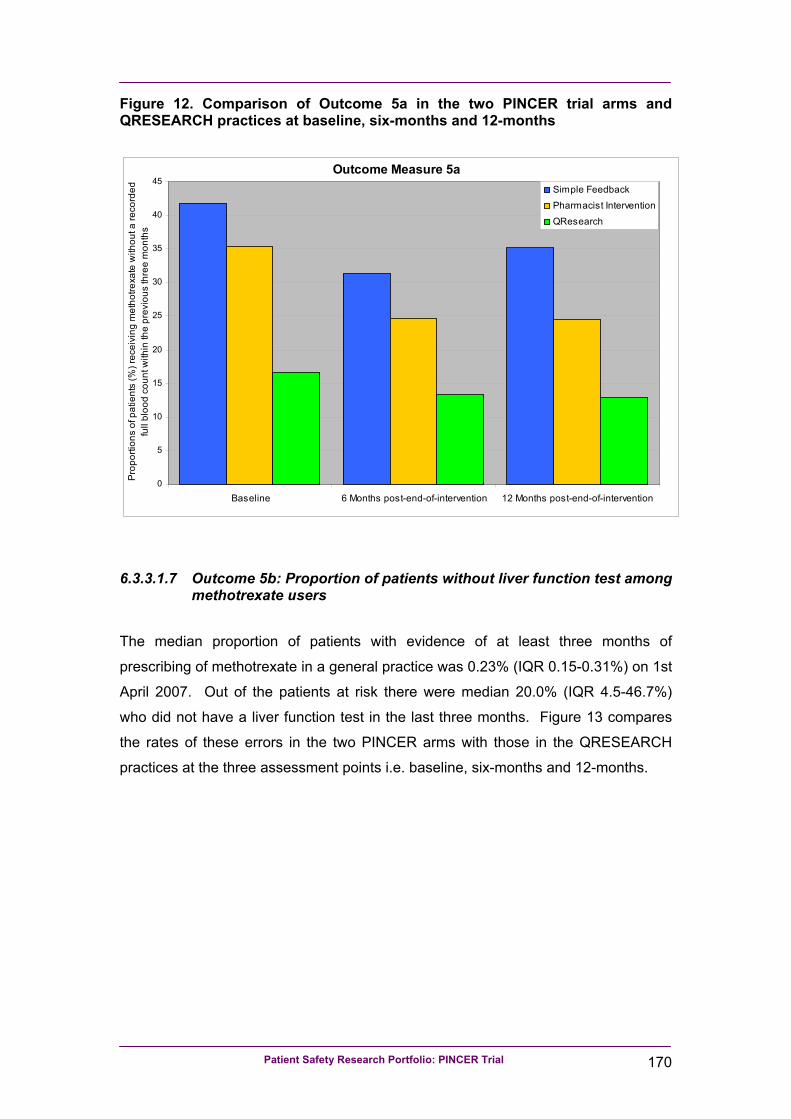
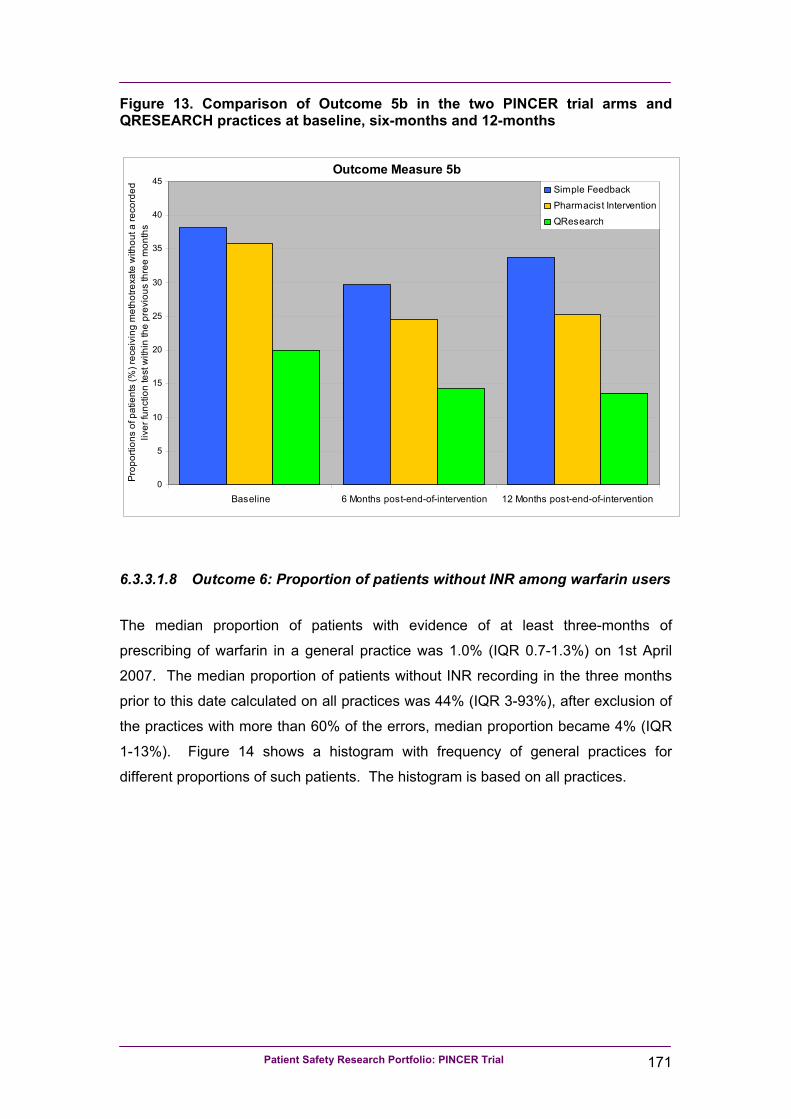
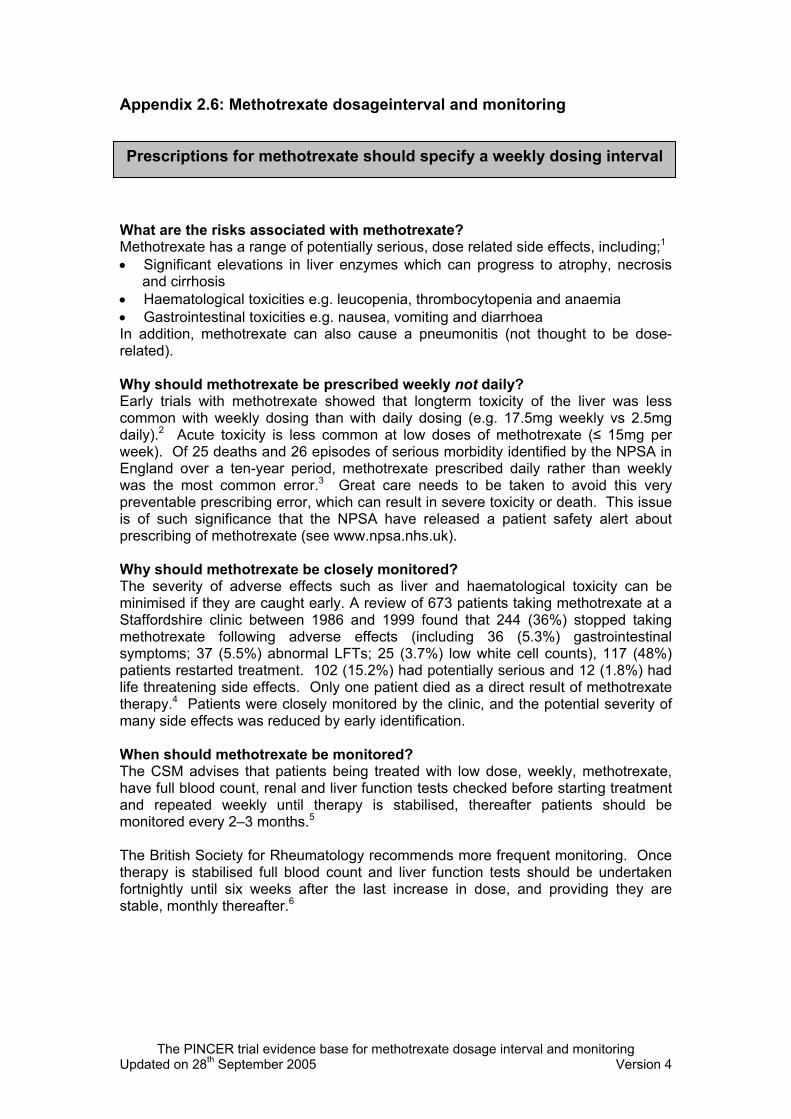
5 Patients receiving methotrexate for at least three months who have not had a recorded full blood count (Outcome 5a) and/or liver function test (Outcome 5b) within the previous three months
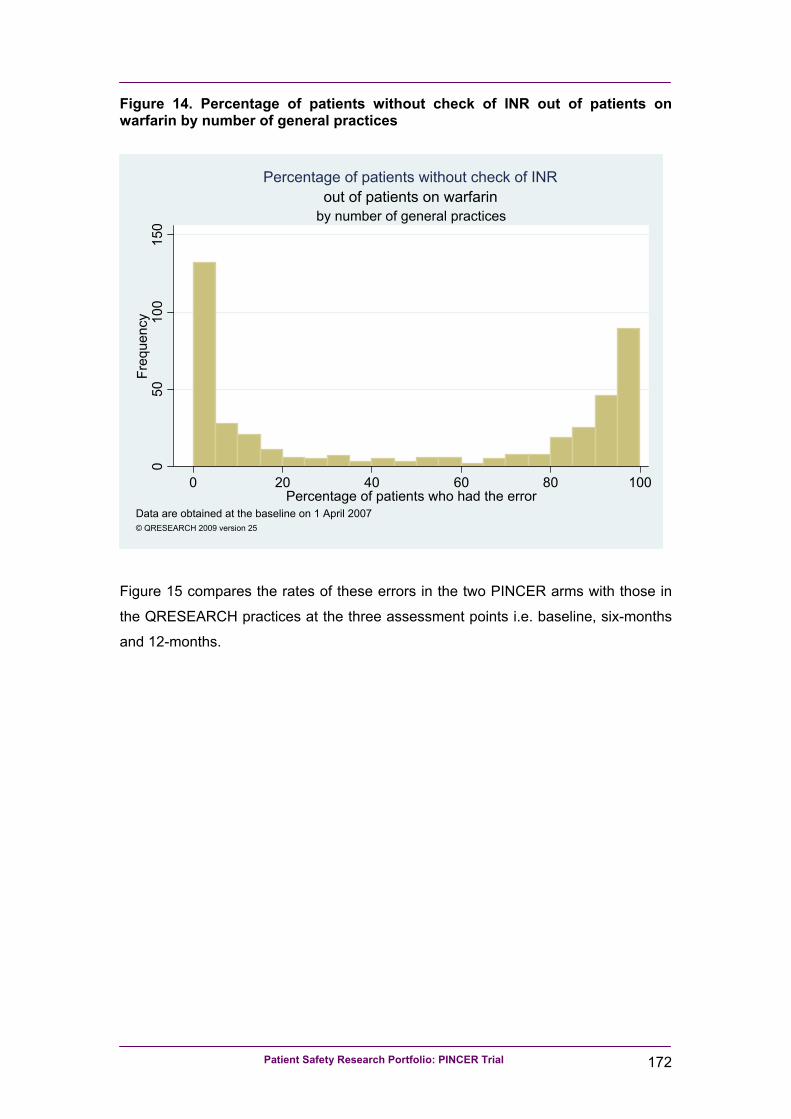
6 Patients receiving warfarin for at least three months who have not had a recorded check of their INR within the previous 12 weeks
7 Patients receiving lithium for at least three months who have not had a recorded check of their lithium levels within the previous three months
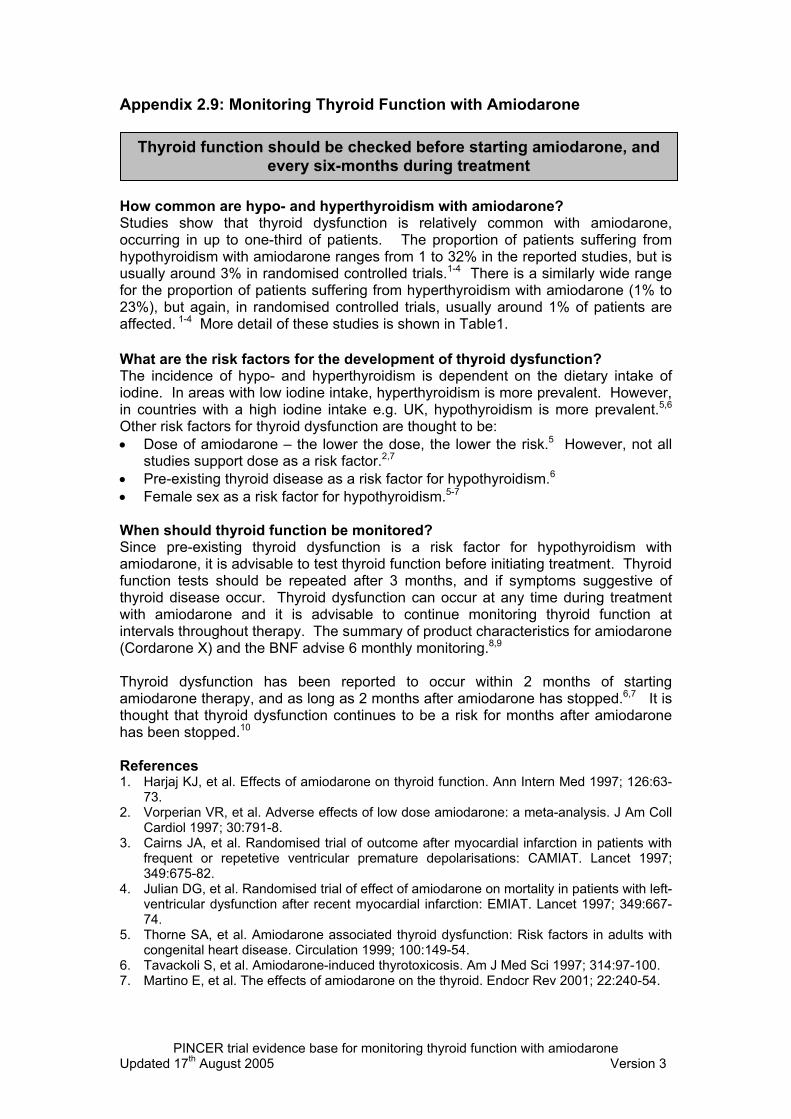
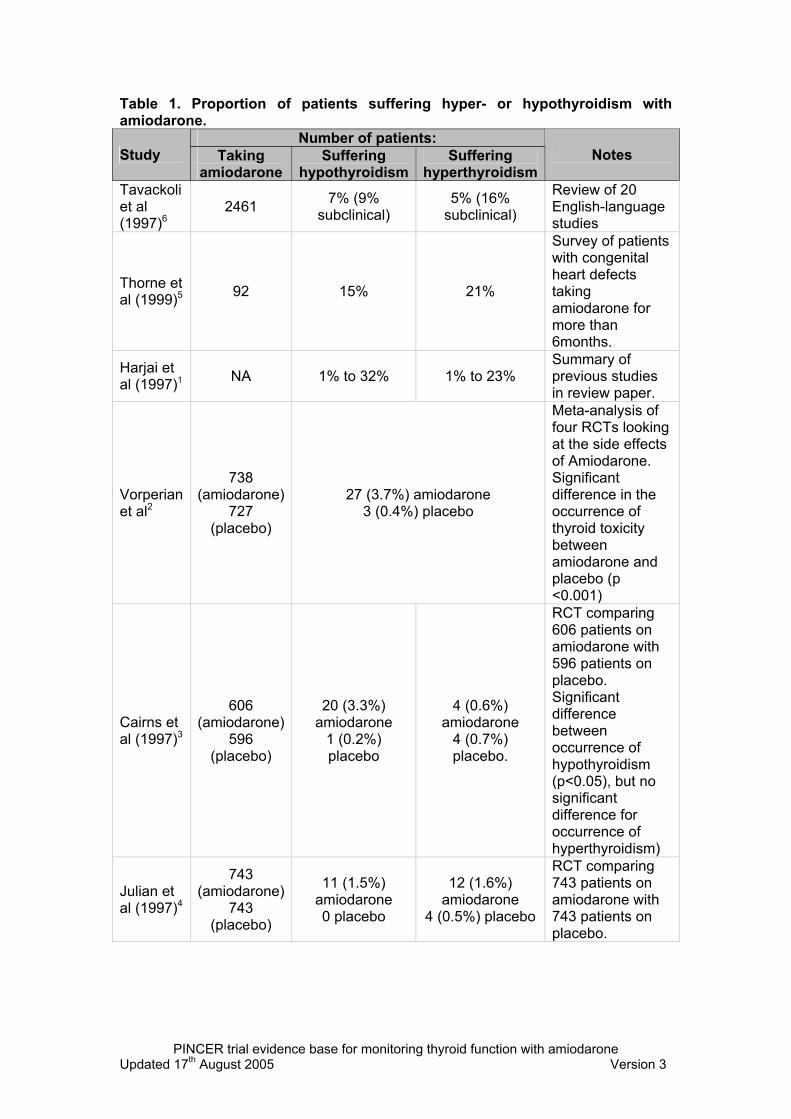
8 Patients receiving amiodarone for at least six-months who have not had a thyroid function test within the previous six-months
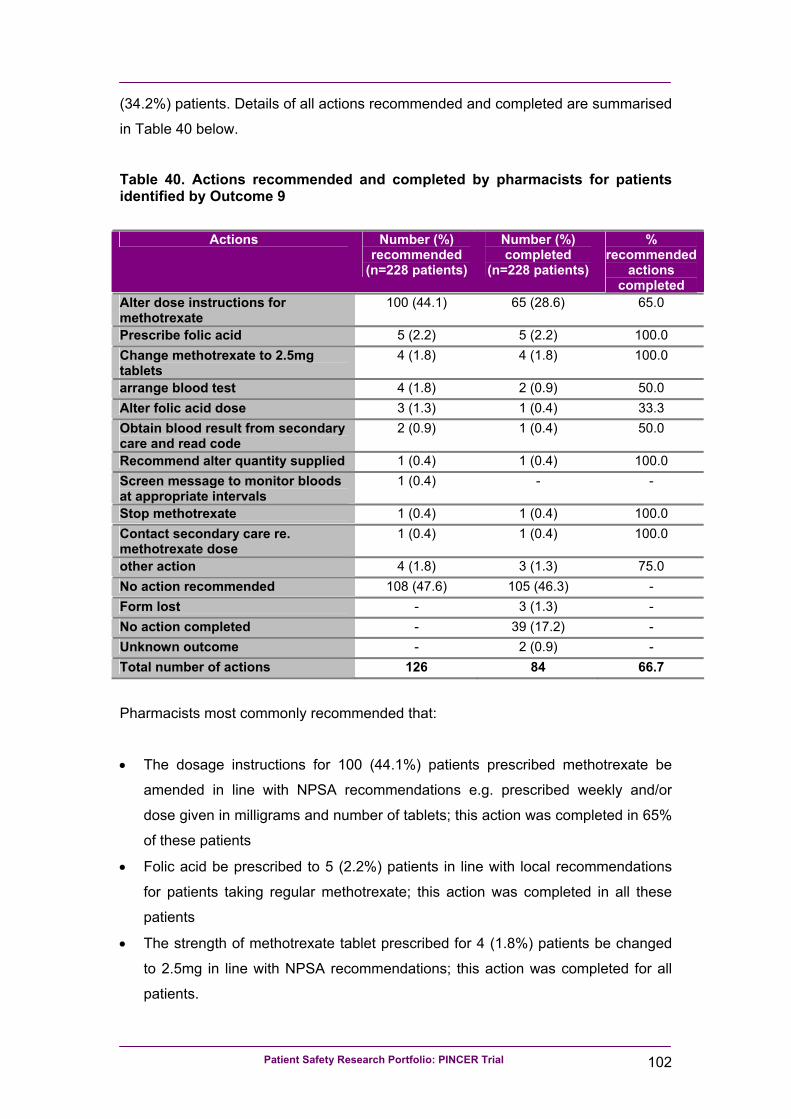
9 Patients receiving prescriptions of methotrexate without instructions that the drug should be taken weekly
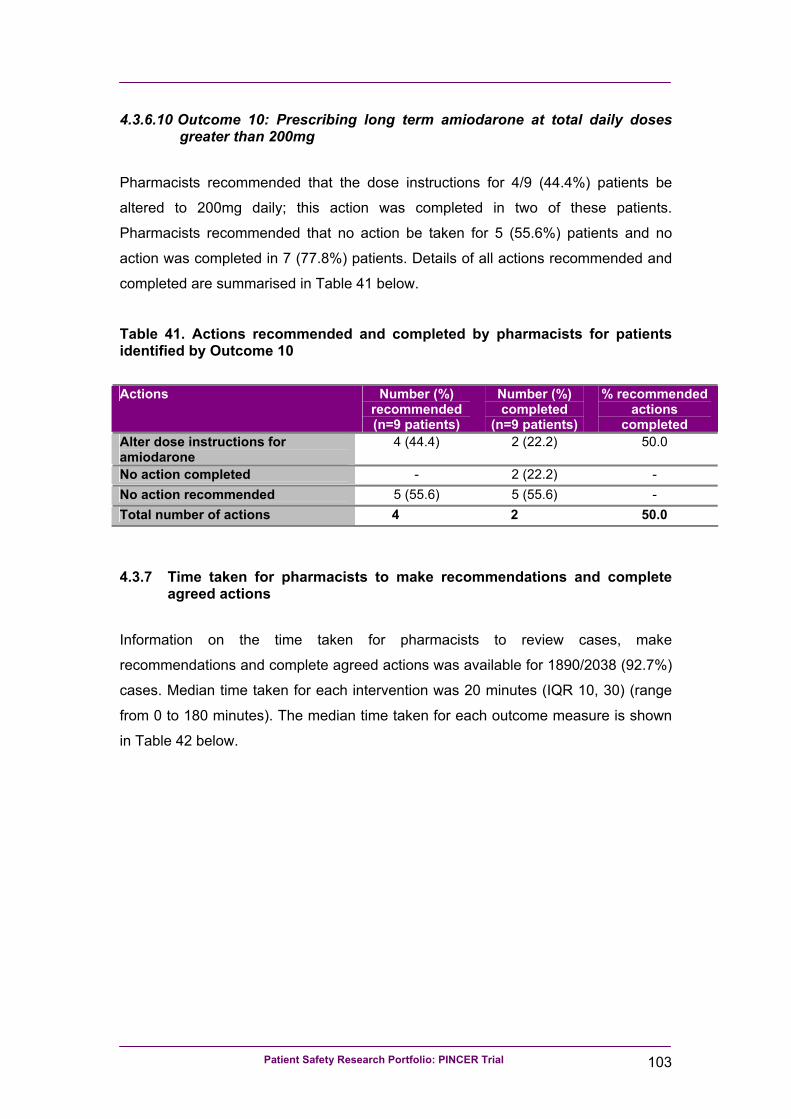
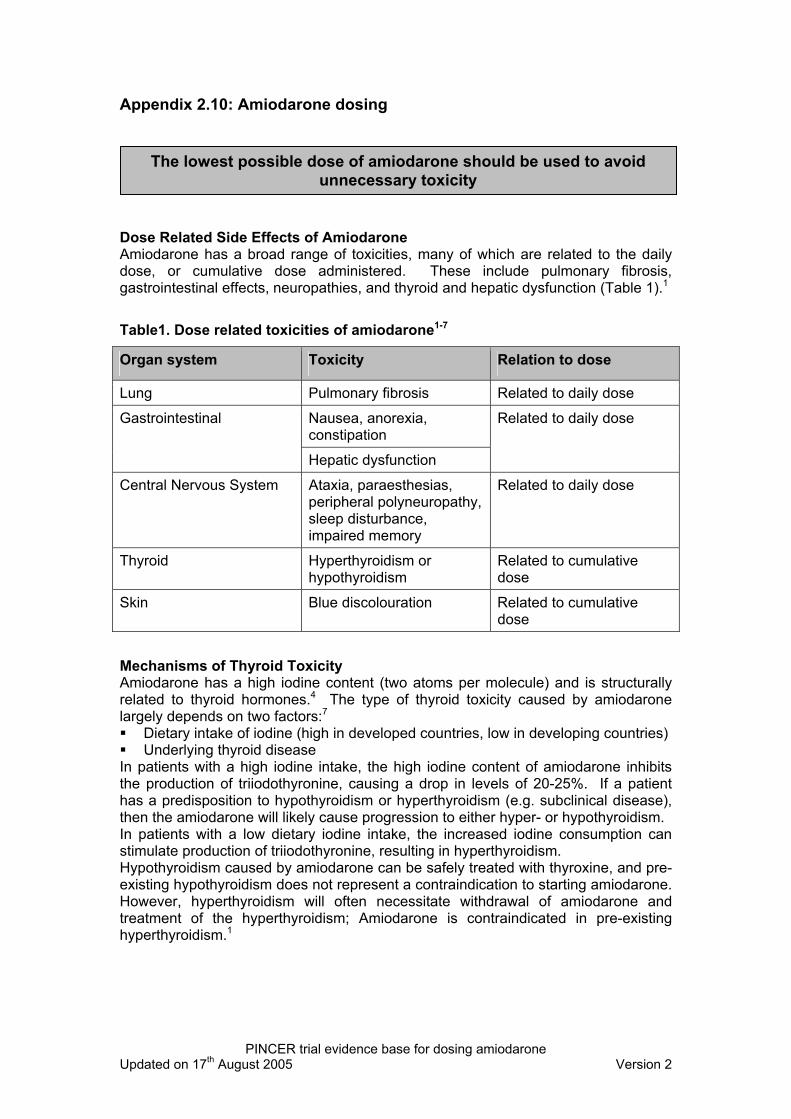
10 Patients receiving prescriptions of amiodarone for at least one month who are receiving a dose of more than 200mg per day
Patient Safety Research Portfolio: PINCER Trial 17
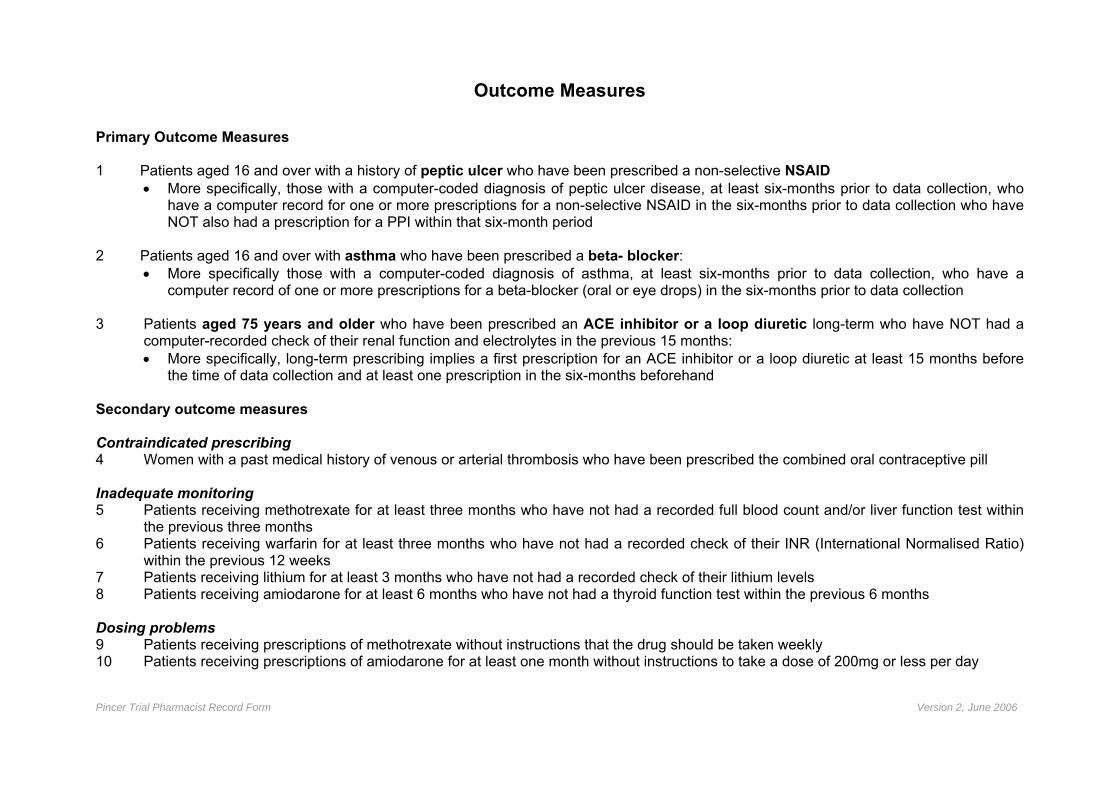
2.2.6.1 Primary outcome measures
We used the following primary outcome measures based on proportions of:
1. Patients with a history of peptic ulcer who had been prescribed a non-selective
NSAID:
• More specifically, those with a computer-coded diagnosis of peptic ulcer
disease, at least six-months prior to data collection, who had a computer
record for one or more prescriptions for a non-selective NSAID in the six-
months prior to data collection who have not also had a prescription for a PPI
within that six-month period.
• The denominator for this outcome measure was patients with a computer-
coded diagnosis of peptic ulcer disease, at least six-months prior to data
collection, who had not also had a prescription for a PPI in the six-months
prior to data collection.
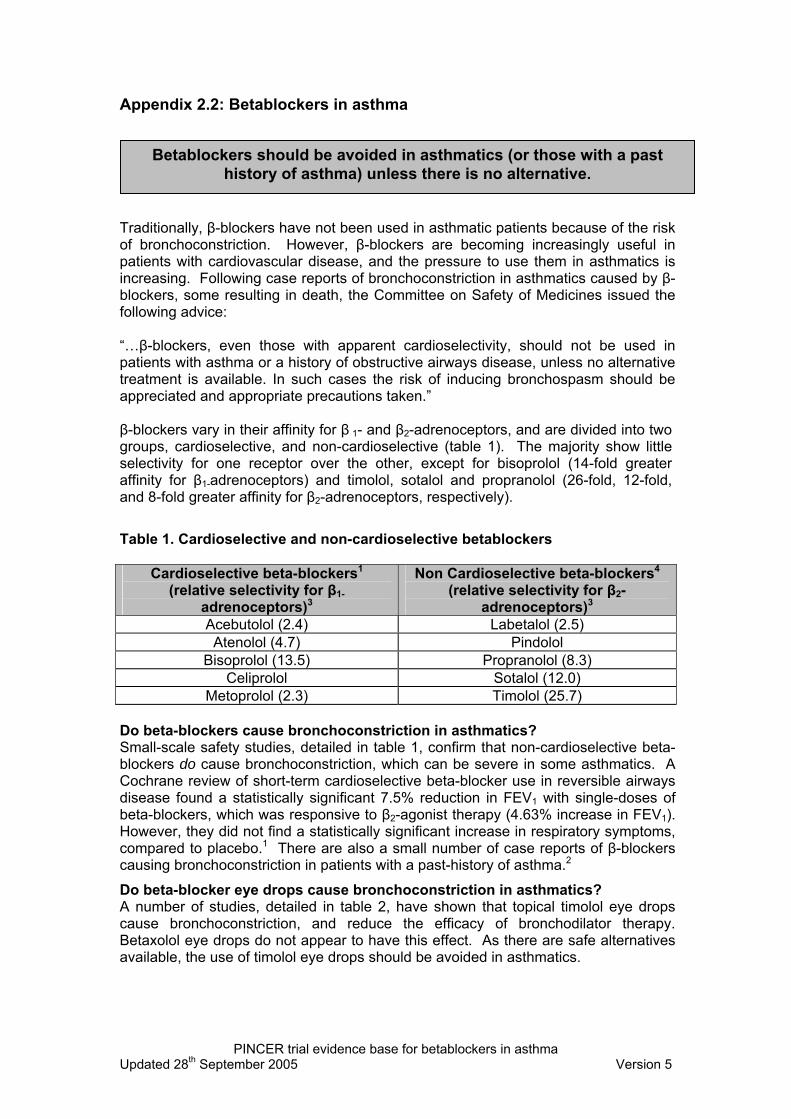
2. Patients with asthma who had been prescribed a beta-blocker:
• More specifically those with a computer-coded diagnosis of asthma, at least
six-months prior to data collection, who had a computer record of one or more
prescriptions for a beta-blocker (oral preparations or eye drops) in the six-
months prior to data collection.
• The denominator for this outcome measure was patients with a computer-
coded diagnosis of asthma, at least six-months prior to data collection.
3. Patients aged 75 years and older who had been prescribed an ACE inhibitor or a loop diuretic long-term (see below) who had not had a computer-recorded check of
their renal function and electrolytes in the previous 15 months:
• More specifically, long-term prescribing implies a first prescription for an ACE
inhibitor or a loop diuretic at least 15 months before the time of data collection
and at least one prescription in the six-months beforehand.
• The denominator for this outcome measure was patients aged 75 years and
older who had been prescribed an ACE inhibitor or a loop diuretic long-term
according to the above definition.
Patient Safety Research Portfolio: PINCER Trial 18
2.2.6.2 Secondary outcome measures
We collected data on a number of secondary outcome measures relating to
contraindicated prescribing, inadequate monitoring and dosing problems. We also
created composite outcome measures (see below) for prescribing problems and for
monitoring problems.
Contraindicated prescribing:
4. Proportions of women with a past medical history of venous or arterial thrombosis who had been prescribed the combined oral contraceptive pill:
• More specifically, women with a history of venous or arterial thrombosis
recorded at least six-months prior to data collection who had a computer-
recorded prescription for the combined oral contraceptive pill in the six-
months prior to data collection.
Inadequate monitoring:
These outcomes were based on proportions of:
5. Patients receiving methotrexate for at least three months who had not had a
recorded full blood count (FBC) and/or liver function tests (LFTs) within the
previous three months:
• More specifically
- 5a: patients with one or more prescriptions for methotrexate recorded on
computer three to six-months prior to data collection and in the three
months prior to data collection who had not had a computer-recorded FBC
within the previous three months.
- 5b: patients with one or more prescriptions for methotrexate recorded on
computer three to six-months prior to data collection and in the three
months prior to data collection who had not had a computer-recorded LFT
within the previous three months.
6. Patients receiving warfarin for at least three months who had not had a recorded
check of their INR within the previous 12 weeks:
Patient Safety Research Portfolio: PINCER Trial 19
• More specifically, patients with one or more prescriptions for warfarin
recorded on computer three to six-months prior to data collection and in the
three months prior to data collection who had not had a computer-recorded
INR within the previous three months.
7. Patients receiving lithium for at least three months who had not had a recorded
check of their lithium levels within the previous three months:
• More specifically, patients with one or more prescriptions for lithium recorded
on computer three to six-months prior to data collection and in the three
months prior to data collection who had not had a computer-recorded lithium
level within the previous three months.
8. Patients receiving amiodarone for at least six-months who had not had a thyroid
function test (TFT) within the previous six-months:
• More specifically, patients with one or more prescriptions for amiodarone
recorded on computer six to 12-months prior to data collection and in the
three months prior to data collection who had not had a computer-recorded
TFT within the previous six-months.
Dosing problems:
These outcomes were based on proportions of:
9. Patients receiving prescriptions of methotrexate without instructions that the
drug should be taken weekly:
• More specifically, patients with one or more prescriptions for methotrexate
recorded on computer within the three months prior to data collection who did
not have the term “weekly” or “week” in the dosage instructions field of the
latest prescription for the drug.
10. Patients receiving prescriptions of amiodarone for at least one month who were
receiving a dose of more than 200mg per day:
• More specifically, patients with evidence of being prescribed amiodarone
200mg tablets for more than one month in the three months prior to data
collection, who do not have the term “once daily” (or similar) in the dosage
instructions field for the drug.
Patient Safety Research Portfolio: PINCER Trial 20
Additional outcome measure relating to prescription of beta-blockers to patients with
asthma
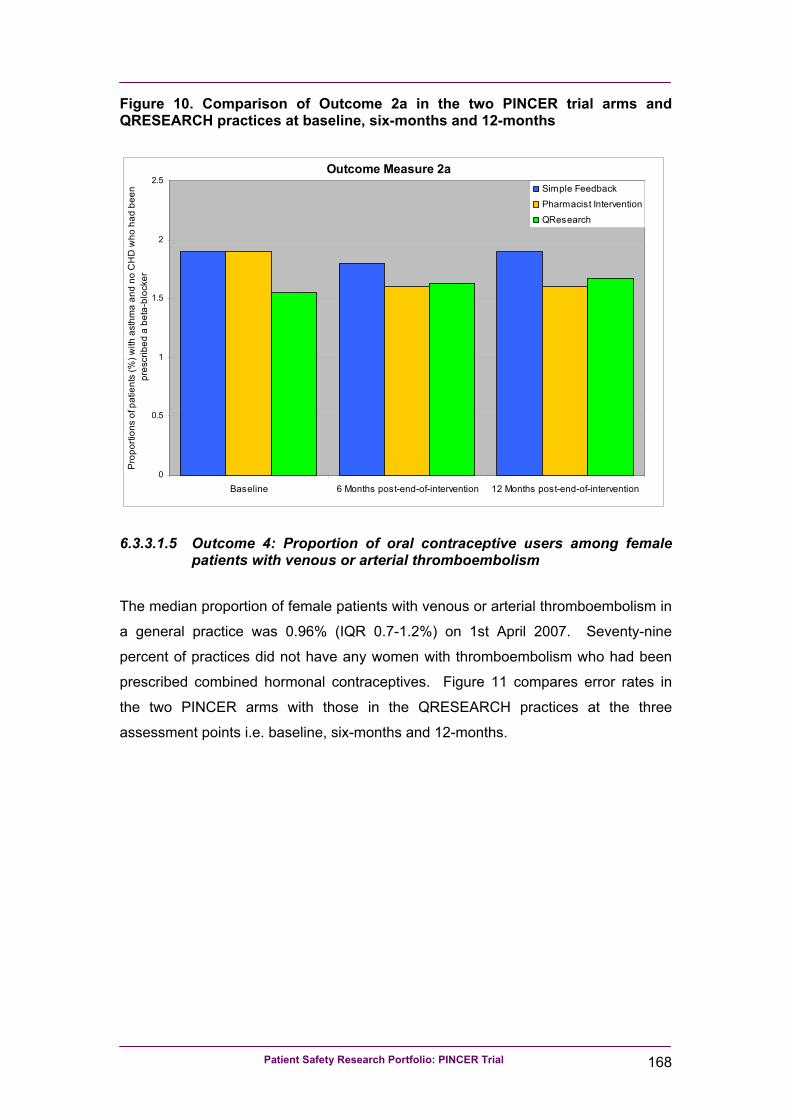
This secondary outcome measure was based on proportions of patients with asthma
who did not have coronary heart disease (CHD) and had been prescribed a beta-blocker:
• More specifically those with a computer-coded diagnosis of asthma and no record
of CHD, at least six-months prior to data collection, who had a computer record of
one or more prescriptions for a beta-blocker (oral preparations or eye drops) in
the six-months prior to data collection.
• The denominator for this outcome measure was patients with a computer-coded
diagnosis of asthma and no computer-coded record of CHD, at least six-months
prior to data collection.
Composite outcome measures
As outlined in our published trial protocol24, we also used data from the above
outcome measures to create a series of composite outcome measures for
prescribing- and monitoring-related problems.
The composite prescribing outcome is based on proportions of patients at risk of at
least one prescribing problem who had at least one prescribing problem:
• More specifically, patients appearing in the numerator for one or more of
Outcomes 1, 2 and 4 (as shown in Table 1) were counted as numerators for this
composite outcome measure.
• The denominator was patients who were identified to be at risk of one or more of
Outcomes 1, 2 and 4 (as shown in Table 1).
The composite monitoring outcome was based on proportions of patients at risk of at
least one monitoring problem who had at least one monitoring problem:
• More specifically, patients appearing in the numerator for one or more of
Outcomes 3, 5a and/or 5b, 6, 7 and 8 (as shown in Table 1).
• The denominator was patients who were identified to be at risk of one or more of
Outcomes 3, 5, 6, 7 and 8 (as shown in Table 1).
Patient Safety Research Portfolio: PINCER Trial 21
It should be noted that patients appeared only once in the denominator in relation to
Outcome 5, but they appeared in the numerator if either FBC or LFT had not been
recorded.
2.2.7 Ascertainment of outcomes
During the first three months of the study, we worked with TCR Nottingham, the
company that produce Quest Browser software (www.tcrnottingham.com). We
developed computerised queries that would produce precisely the same types of
data as we used in our pilot study of primary outcome measures that used
QRESEARCH practices (www.qresearch.org). We also worked with the company to
produce the outputs needed for the secondary outcome measures.
For each practice agreeing to be involved in the trial, Quest Browser software had to
be installed on their clinical computer system. At the time of installation of the
software, a search of the GP computer system, using Quest Browser was undertaken
to provide anonymised baseline data and details of individual patients at risk from
hazardous prescribing and medicines management.
Anonymised and encrypted data pertaining to the computerised primary and
secondary outcomes measures were sent via the Internet to secure computers at the
University of Nottingham and at TCR Nottingham. Using Quest Browser Central
software the pseudo-anonymised data were automatically imported into an Access
database along with a unique code identifying the practice and a unique code for
each patient.
Further data were collected at six- and 12-months after the completion of the 12-
week intervention period in practices in each arm of the trial.
2.2.7.1 Issues concerning ascertainment of secondary outcome measures
Over the course of the study we identified issues concerning three of our secondary
outcome measures.
Patient Safety Research Portfolio: PINCER Trial 22
As already noted, for Outcome 6, we identified seven practices that kept records of
INR results separate from their main practice computer system and thus appeared to
have very high proportions of patients not having INRs checked according to the
computer searches we have used in our study. As stated in our published trial
protocol24, we have excluded these practices from the analysis of this outcome
measure.
For Outcome 9, during the course of our study, the NPSA required all GP computer
systems to introduce methods of ensuring that electronic prescriptions for
methotrexate gave instructions that the medication should be taken weekly25. Since
this change was introduced our computer searches were unable, for all patients, to
capture the text used to confirm the dosage instructions. Having obtained the data,
however, we judged that there were sufficient numbers of patients with dosage
instructions present to allow for an analysis to be undertaken.
For Outcomes 9 and 10, we found that for the 11 practices that used The Phoenix
Partnership (TPP) computer system, we were unable to extract information on
dosage instructions. This meant that we were not able to report on these outcome
measures for the practices that use this software system.
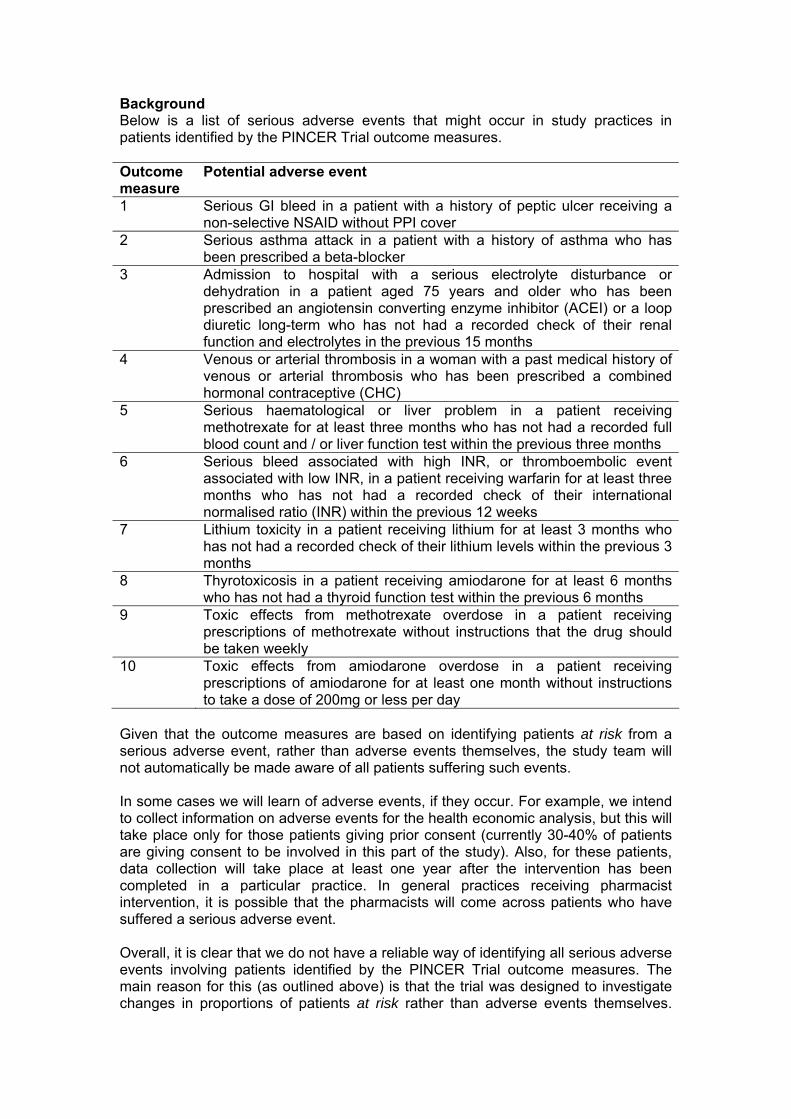
2.2.8 Adverse events
The protocol for dealing with serious adverse events that might occur in study
practices in patients identified by the PINCER trial outcome measures is shown in
Appendix 3.
2.2.9 Sample size
Our sample size calculations were based on the assumption that for the proportion of
patients fulfilling the criteria for any one of our primary outcome measures, there
would be a maximum 11% reduction in the simple feedback arm and a 50%
reduction in the pharmacist intervention arm.
Patient Safety Research Portfolio: PINCER Trial 23
The suggested 11% reduction in the simple feedback arm is the equivalent to the
75% centile for changes observed as a result of audit and feedback in a Cochrane
systematic review available at the time that we did our sample size calculations26.
The suggested 50% reduction in the pharmacist intervention arm of the trial is based
on extrapolation from our pilot studies18, 19 and findings from systematic reviews and
other studies that, at the time of applying for funding for our study, showed that:
• Pharmacist-led interventions can lead to resolution of medication-related
problems in 55-93% of patients27-31.
• Educational outreach is a moderately powerful tool for changing professional
behaviour32.
• Multifaceted interventions aimed at different barriers to change are more effective
than single interventions33.
Separate sample size calculations were performed for each of three primary outcome
measures (see Table 2). Sample sizes unadjusted for clustering were calculated
using the software package nQuery Advisor® version 6.034. Sample sizes were
inflated to adjust for clustering using ICCs and average cluster sizes estimated from
QRESEARCH practices, as described below and shown in Table 2.
Data from 43 general practices contributing anonymous clinical data to the
QRESEARCH research database (www.qresearch.org) were used to describe
prevalence rates of asthma and peptic ulcer disease and to estimate the median
proportions for each of our primary outcome measures. The intracluster correlation
coefficients (ICCs) used in the calculation of the design effect (to inflate the sample
sizes to adjust for the cluster design)35 were as follows:
• 0.01082 for patients with a history of peptic ulcer who had been prescribed a non-
selective NSAID (excluding those that were also in receipt of PPIs, which would
protect against the risks from NSAIDs);
• 0.010657 for patients with asthma who had been prescribed a beta-blocker;
• 0.00952 for patients aged 75 years and older who have been prescribed an ACE
inhibitor or a loop diuretic long-term who had not had a computer-recorded check
of their renal function and electrolytes in the previous 15 months.
Patient Safety Research Portfolio: PINCER Trial 24
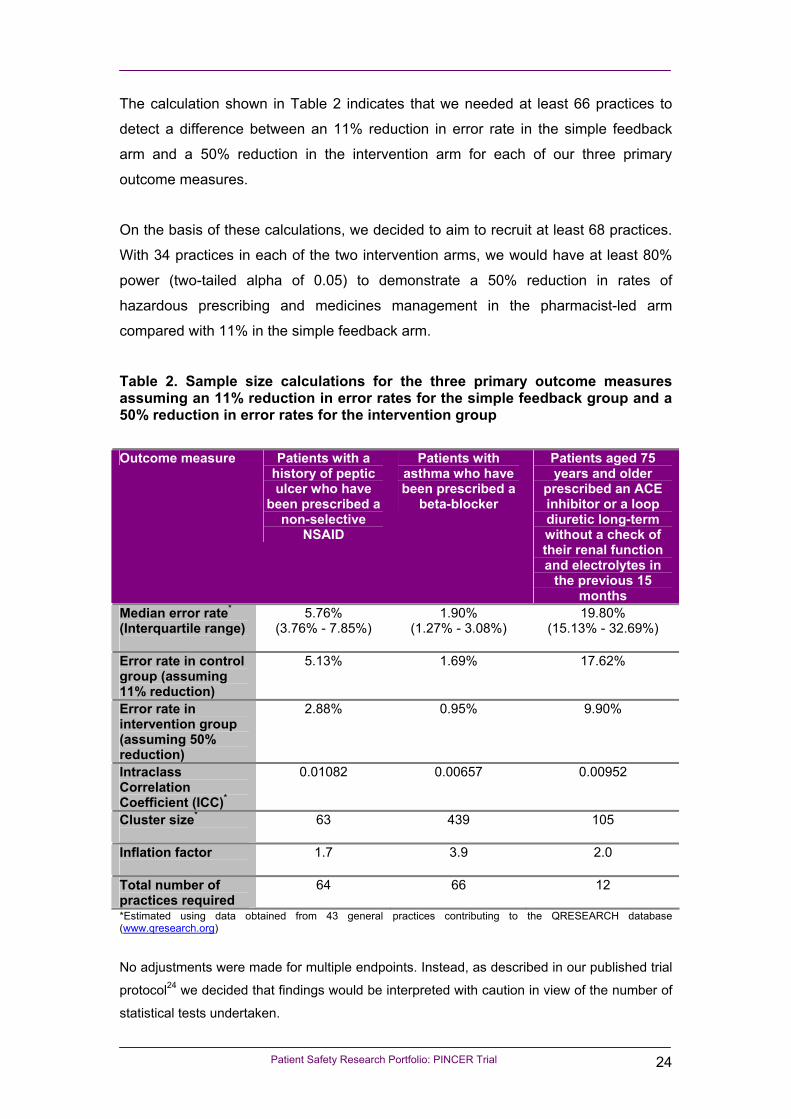
The calculation shown in Table 2 indicates that we needed at least 66 practices to
detect a difference between an 11% reduction in error rate in the simple feedback
arm and a 50% reduction in the intervention arm for each of our three primary
outcome measures.
On the basis of these calculations, we decided to aim to recruit at least 68 practices.
With 34 practices in each of the two intervention arms, we would have at least 80%
power (two-tailed alpha of 0.05) to demonstrate a 50% reduction in rates of
hazardous prescribing and medicines management in the pharmacist-led arm
compared with 11% in the simple feedback arm.
Table 2. Sample size calculations for the three primary outcome measures assuming an 11% reduction in error rates for the simple feedback group and a 50% reduction in error rates for the intervention group
Outcome measure Patients with a history of peptic ulcer who have
been prescribed a non-selective
NSAID
Patients with asthma who have been prescribed a
beta-blocker
Patients aged 75 years and older
prescribed an ACE inhibitor or a loop diuretic long-term without a check of their renal function and electrolytes in
the previous 15 months
Median error rate* (Interquartile range)
5.76% (3.76% - 7.85%)
1.90% (1.27% - 3.08%)
19.80% (15.13% - 32.69%)
Error rate in control group (assuming 11% reduction)
5.13% 1.69% 17.62%
Error rate in intervention group (assuming 50% reduction)
2.88% 0.95% 9.90%
Intraclass Correlation Coefficient (ICC)*
0.01082 0.00657 0.00952
Cluster size*
63 439 105
Inflation factor
1.7 3.9 2.0
Total number of practices required
64 66 12
*Estimated using data obtained from 43 general practices contributing to the QRESEARCH database (www.qresearch.org) No adjustments were made for multiple endpoints. Instead, as described in our published trial
protocol24 we decided that findings would be interpreted with caution in view of the number of
statistical tests undertaken.
Patient Safety Research Portfolio: PINCER Trial 25
2.2.10 Compliance
We recognised that it can be a challenge to encourage general practices to engage
in trials. However, as the intervention involved either simple feedback or feedback
and the provision of a pharmacist to work with the practices, we did not expect non-
compliance with the intervention to be a large problem. In addition, from our
experience of the pilot study and of conducting previous trials, we believed that the
risks of non-compliance would be minimised by providing practices with clear
information on what the study involved, providing access to members of the research
team to answer queries and address problems experienced by the practices, and
support from the PCTs.
2.2.11 Loss to follow-up
We did not envisage practices dropping out of the study once they had agreed to
take part. Nevertheless, at the outset we stressed to the practices the importance of
allowing us to collect follow-up data, even if the practice had not engaged fully in one
of the interventions. As outcome data collection required minimal input from
practices, we did not foresee major problems.
Some patients were likely to have moved practices and some will have died within
the intervention period. However, we were of the opinion that this was unlikely to
have had a large impact on the proportion of patients with errors at follow-up, unless
leaving the practice or death was differentially related to medication error. This was
considered unlikely because the number of deaths attributable to the medication
errors we were studying was likely to have been small during the course of the study.
Nevertheless, where patient consent was given, we followed up patients who died by
viewing their electronic medical records up until the time of death, and supplemented
this by viewing paper-based records containing details of contacts with secondary
care. In addition, at the end of the study, we asked general practices to inform us of
the number of patients identified in the baseline searches that had left the practice or
died within 12-months of these baseline searches (see Appendix 4).
Patient Safety Research Portfolio: PINCER Trial 26
2.2.12 Withdrawal of patients from the study
Informed consent of patients was requested to allow the research team to access
medical records for the purposes of the economic study (see section 3.2.1). Informed
consent was not required for the analysis of the main outcomes as these were
obtained from anonymised computer searches of all “at risk” patients in the general
practices recruited to the study. Therefore, withdrawal of patients was not an issue
for the analysis of the main outcome data.
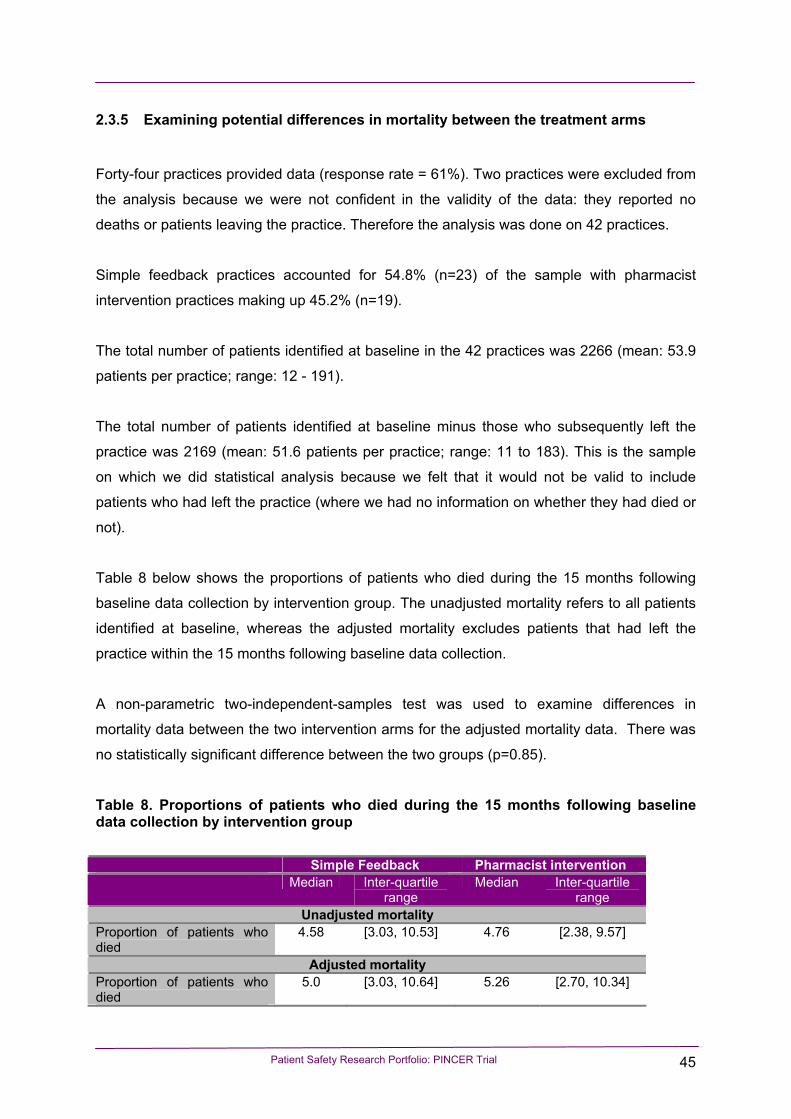
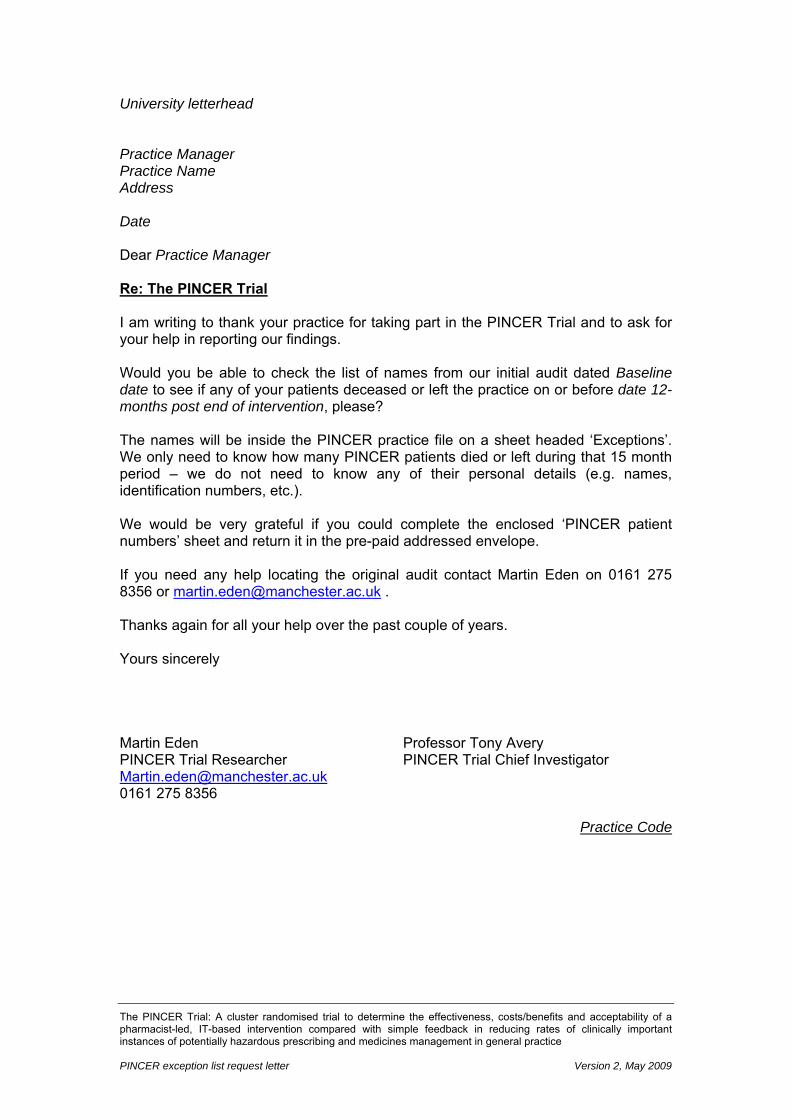
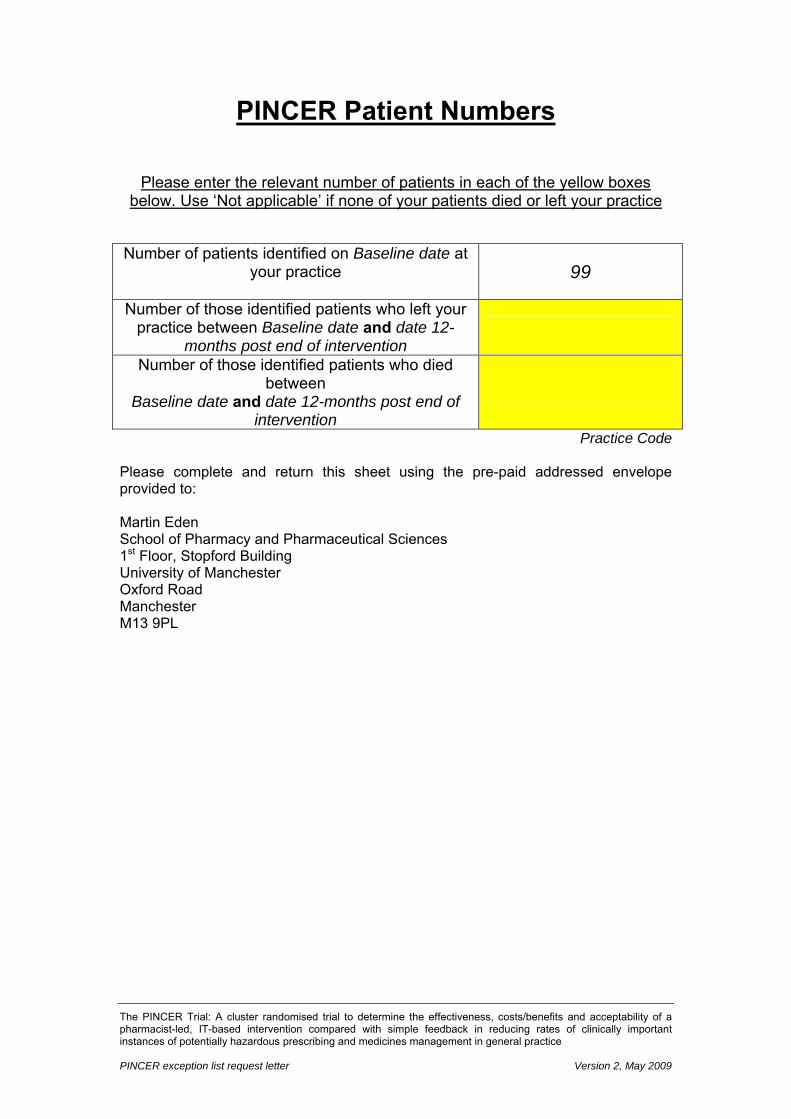
2.2.13 Examining potential differences in mortality between the treatment arms
In July 2009 we sent a letter to participating practices asking them to tell us how
many of the patients identified to be at risk from their medicine from the computer
searches had, in the 15 months following the start of the intervention, either left the
practice or died. An example of the letter sent is shown in Appendix 4.
Data from practices responding to the letter were entered into SPSS and proportions
of patients dying in each of arm of the trial were described. Potential differences were
examined using non-parametric statistics after adjusting for patients that had left the
practices within 15 months following the start of the intervention.
2.2.14 Data processing and data cleaning for the trial outcome measures
Data from the general practices for each data collection time point were collated into
separate Access databases by TCR Nottingham for each of the primary and
secondary outcome measures. These databases contained no information about
which arm of the trial the practices belonged to. This meant that any further data
processing and data cleaning was done blind to the intervention arm.
We held separate copies of the anonymised data for each time point, outcome
measure and practice at the University of Nottingham in order to cross-check
anomalies.
For each of the outcome measures we ran a number of data-checks to help ensure
that:
Patient Safety Research Portfolio: PINCER Trial 27
• Data from all the practices were present for all time points (or, if data were not
present, a cross-check against the original data revealed no cases).
• Patients included in the outcome measures were all registered with the general
practices for sufficient time to fulfill the criteria for being included.
• The ages of patients included in the outcome measures fulfilled the criteria for
being included in the relevant outcome measure.
• The morbidity Read codes, and dates for these codes, fulfilled the criteria for the
relevant outcome measure.
• The drug codes, and dates for these codes, fulfilled the criteria for the relevant
outcome measure.
• Cases labelled as numerators fulfilled the criteria for being numerators.
• Cases labelled as non-numerators were correctly labelled as non-numerators,
whilst also fulfilling the criteria for being denominators.
For the monitoring outcome measures we ran data checks to help ensure that:
• The monitoring Read codes fulfilled the criteria for the relevant monitoring
outcome measures.
• The dates of the latest relevant monitoring codes (where available) were used
correctly to assign the patient to being either a numerator or denominator.
In relation to the combined hormonal contraceptive outcome measure (Outcome 4,
see Table 1), we checked that all patients were female.
In relation to the methotrexate dosing instructions outcome measure (Outcome 9,
see Table 1) we included only those patients that had dosing instructions recorded
(i.e. records with blank dosage instructions fields were excluded – see section
2.2.7.1).
For the prescribing composite outcome measures we combined data from Outcomes
1, 2 and 4 (see Table 1 and section 2.2.6.2) ensuring that, by using patients’ unique
pseudo-anonymised codes, they were not double counted. We then identified
patients who appeared one or more times as numerators in order to calculate the
proportion of patients with one or more prescribing problems from those at risk of one
or more prescribing problems. For example, if a patient appeared as a numerator in
any of Outcomes 1, 2 and 4 they would appear as a numerator in the composite
outcome measure.
Patient Safety Research Portfolio: PINCER Trial 28
For the monitoring composite outcome measures we combined data from Outcomes
3, 5, 6, 7 and 8 (see Table 1 and section 2.2.6.2) ensuring that, by using patients’
unique pseudo-anonymised codes, they were not double counted. We then identified
patients who appeared one or more times as numerators in order to calculate the
proportion of patients with one or more monitoring problems from those at risk of one
or more monitoring problems.
2.2.15 Statistical analysis
Data analysis, using the following analysis plan, was undertaken blind to treatment
arm allocation (i.e. the treatments were identified only as X and Y until analysis was
complete). The main analysis for the clinical outcomes used in the trial was
undertaken using the six-month follow-up data.
2.2.15.1 Descriptive analyses
Characteristics of practices and patients were described using frequencies and
percentages for categorical variables, and means and standard deviations (SD) or
medians and interquartile ranges (IQR) for continuous variables, dependent on the
normality of their distribution. Practice and patient characteristics at baseline were
compared informally between treatment arms.
Describing baseline characteristics of patients and practices
The following characteristics are described by treatment arm:
• Patient age and gender.
• Practice list size (median and IQR, or mean and SD if normally distributed).
• Practice population by age group (number and %).
• Practice deprivation using the Index of Multiple Deprivation (IMD) 200436 (median
and IQR, or mean and SD if normally distributed) Note this was calculated by
multiplying the proportion of the total list size living in each Lower Layer Super
Output Area (LSOA) by IMD 2004 LSOA level score and then summing these
across all LSOAs in which patients registered at the practice live.
• Practice training status (%).
Patient Safety Research Portfolio: PINCER Trial 29
• Practice Quality and Outcomes Framework (QOF) medicines management.
indicator points and total QOF points37 if available (Mean (SD) or median (IQR)
dependent on distributions).
Describing baseline prevalence of medication-related problems
The following are described using the numerator, denominator and percentage by
treatment arm, at patient level:
• Primary outcome measures:
1. Patients with a history of peptic ulcer prescribed an NSAID without a PPI
(numerator) / Patients with a history of peptic ulcer without a PPI
(denominator).
2. Patients with asthma prescribed a beta-blocker (numerator) / Patients with
asthma (denominator).
3. Patients aged ≥75 on long term ACE inhibitors or diuretics without urea and
electrolyte monitoring in the previous 15 months (numerator) / Patients aged
≥75 on long term ACE inhibitors or diuretics (denominator).
• Secondary outcome measures:
2a. Patients with asthma and not CHD prescribed a beta-blocker (numerator) /
Patients with asthma and not CHD (denominator).
4. Female patients with a history of venous or arterial thromboembolism and
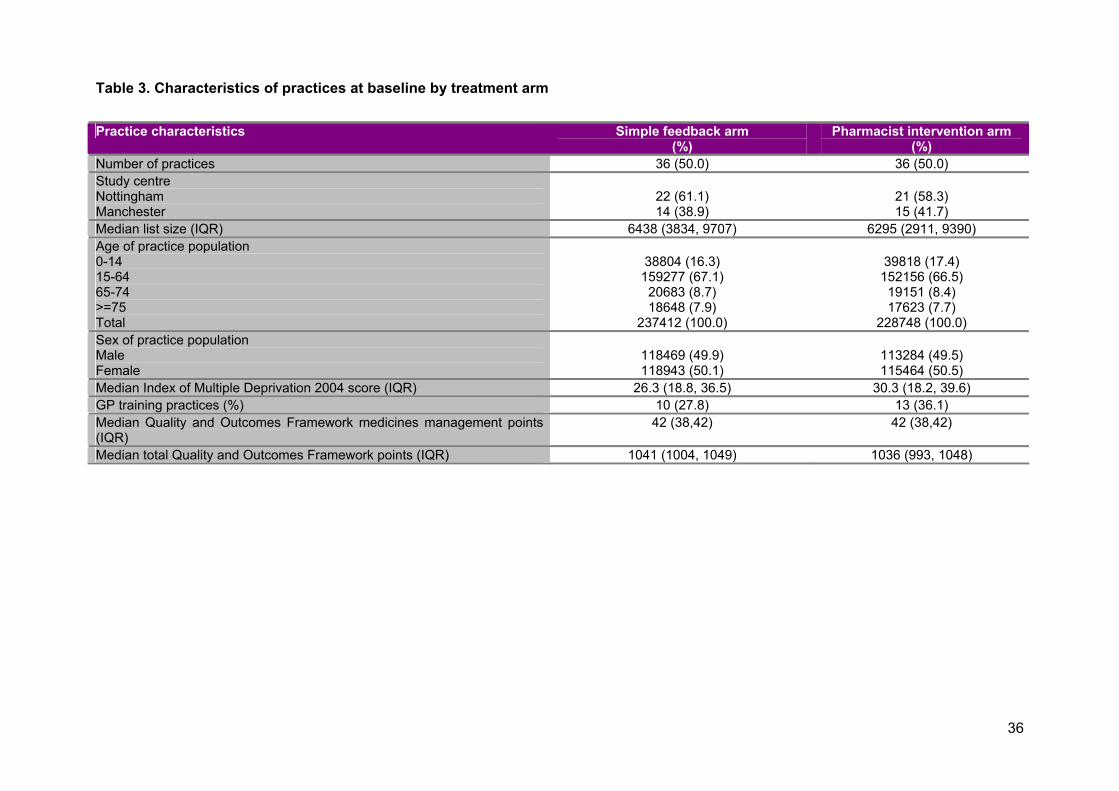
228748 (100.0) Sex of practice population Male Female
118469 (49.9) 118943 (50.1)
113284 (49.5) 115464 (50.5)
Median Index of Multiple Deprivation 2004 score (IQR) 26.3 (18.8, 36.5) 30.3 (18.2, 39.6) GP training practices (%) 10 (27.8) 13 (36.1) Median Quality and Outcomes Framework medicines management points (IQR)
42 (38,42) 42 (38,42)
Median total Quality and Outcomes Framework points (IQR) 1041 (1004, 1049) 1036 (993, 1048)
Patient Safety Research Portfolio: PINCER Trial
37
Practices in the pharmacist intervention arm had a slightly higher Index of Multiple
Deprivation (2004) score and were slightly more likely to be GP training practices.
Otherwise treatment arms were well balanced in terms of practice characteristics at
baseline.
In our original grant application (but not our published trial protocol)24 we said that we
would report rurality scores. We had intended to obtain a measure of rurality from the
Rural and Urban Area Classification of 2004. However a sample of 17 PINCER
practices drawn from three PCTs showed that the vast majority (n=16) practices fell
within one category: “Urban – Less Sparse”, so we did not report rurality scores.
Over 80% of Super Output Areas in England are classified as “Urban – Less
Sparse”46.
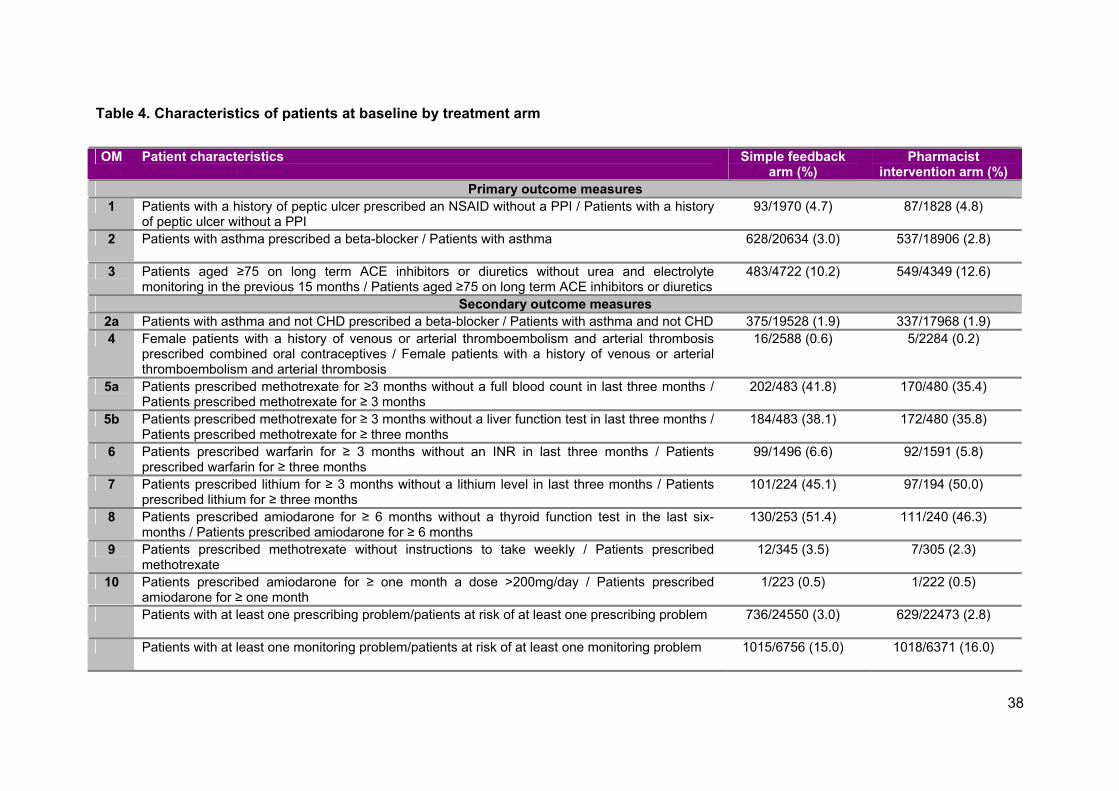
Table 4 reports baseline characteristics of patients. Patients in the simple feedback
arm were slightly more likely to have had methotrexate prescribed without a FBC or
LFT in the previous three months and amiodarone prescribed without a TFT in the
last six-months. Patients in the pharmacist intervention arm were slightly more likely
to have had an ACE inhibitor or diuretic prescribed without a U&E in the previous 15
months and to have had lithium prescribed without a lithium level in the previous
three months. Otherwise treatment arms were well balanced in terms of patient
characteristics at baseline.
38
Table 4. Characteristics of patients at baseline by treatment arm
OM Patient characteristics Simple feedback arm (%)
Pharmacist intervention arm (%)
Primary outcome measures 1 Patients with a history of peptic ulcer prescribed an NSAID without a PPI / Patients with a history
of peptic ulcer without a PPI 93/1970 (4.7) 87/1828 (4.8)
2 Patients with asthma prescribed a beta-blocker / Patients with asthma 628/20634 (3.0)
537/18906 (2.8)
3 Patients aged ≥75 on long term ACE inhibitors or diuretics without urea and electrolyte monitoring in the previous 15 months / Patients aged ≥75 on long term ACE inhibitors or diuretics
483/4722 (10.2) 549/4349 (12.6)
Secondary outcome measures 2a Patients with asthma and not CHD prescribed a beta-blocker / Patients with asthma and not CHD 375/19528 (1.9) 337/17968 (1.9) 4 Female patients with a history of venous or arterial thromboembolism and arterial thrombosis
prescribed combined oral contraceptives / Female patients with a history of venous or arterial thromboembolism and arterial thrombosis
16/2588 (0.6) 5/2284 (0.2)
5a Patients prescribed methotrexate for ≥3 months without a full blood count in last three months / Patients prescribed methotrexate for ≥ 3 months
202/483 (41.8) 170/480 (35.4)
5b Patients prescribed methotrexate for ≥ 3 months without a liver function test in last three months / Patients prescribed methotrexate for ≥ three months
184/483 (38.1) 172/480 (35.8)
6 Patients prescribed warfarin for ≥ 3 months without an INR in last three months / Patients prescribed warfarin for ≥ three months
99/1496 (6.6) 92/1591 (5.8)
7 Patients prescribed lithium for ≥ 3 months without a lithium level in last three months / Patients prescribed lithium for ≥ three months
101/224 (45.1) 97/194 (50.0)
8 Patients prescribed amiodarone for ≥ 6 months without a thyroid function test in the last six-months / Patients prescribed amiodarone for ≥ 6 months
130/253 (51.4) 111/240 (46.3)
9 Patients prescribed methotrexate without instructions to take weekly / Patients prescribed methotrexate
12/345 (3.5) 7/305 (2.3)
10 Patients prescribed amiodarone for ≥ one month a dose >200mg/day / Patients prescribed amiodarone for ≥ one month
1/223 (0.5) 1/222 (0.5)
Patients with at least one prescribing problem/patients at risk of at least one prescribing problem 736/24550 (3.0)
629/22473 (2.8)
Patients with at least one monitoring problem/patients at risk of at least one monitoring problem 1015/6756 (15.0)
1018/6371 (16.0)
Patient Safety Research Portfolio: PINCER Trial 39
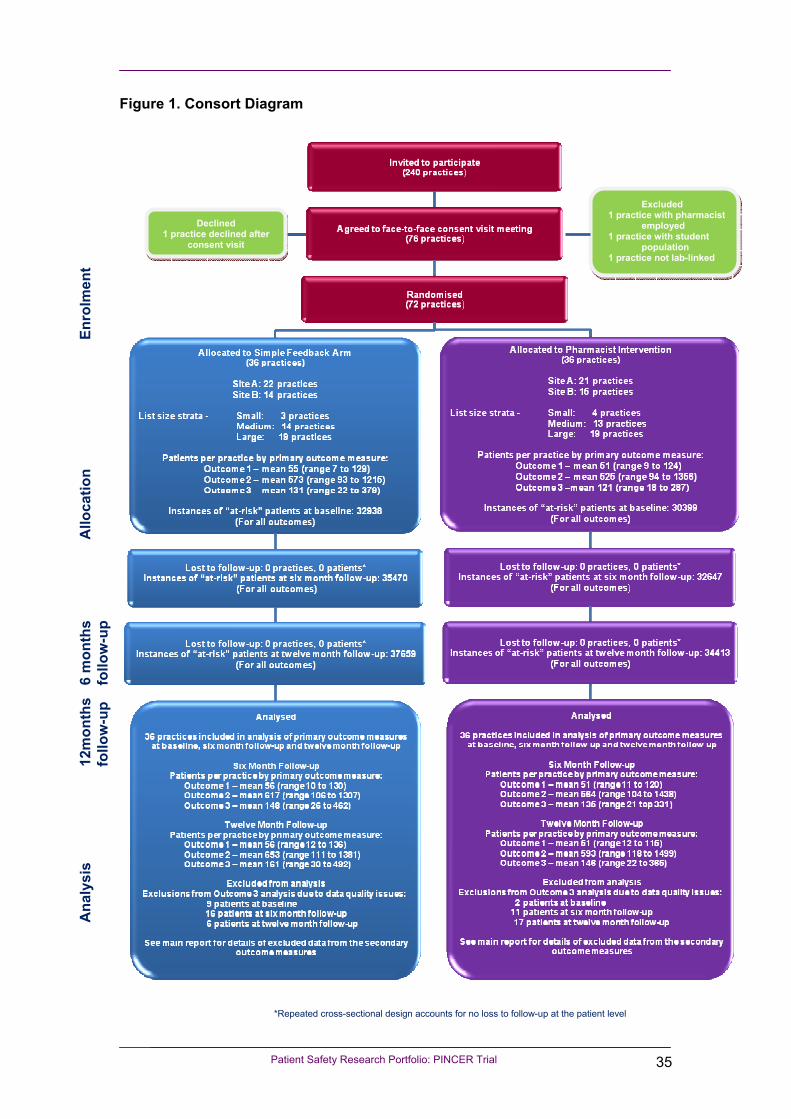
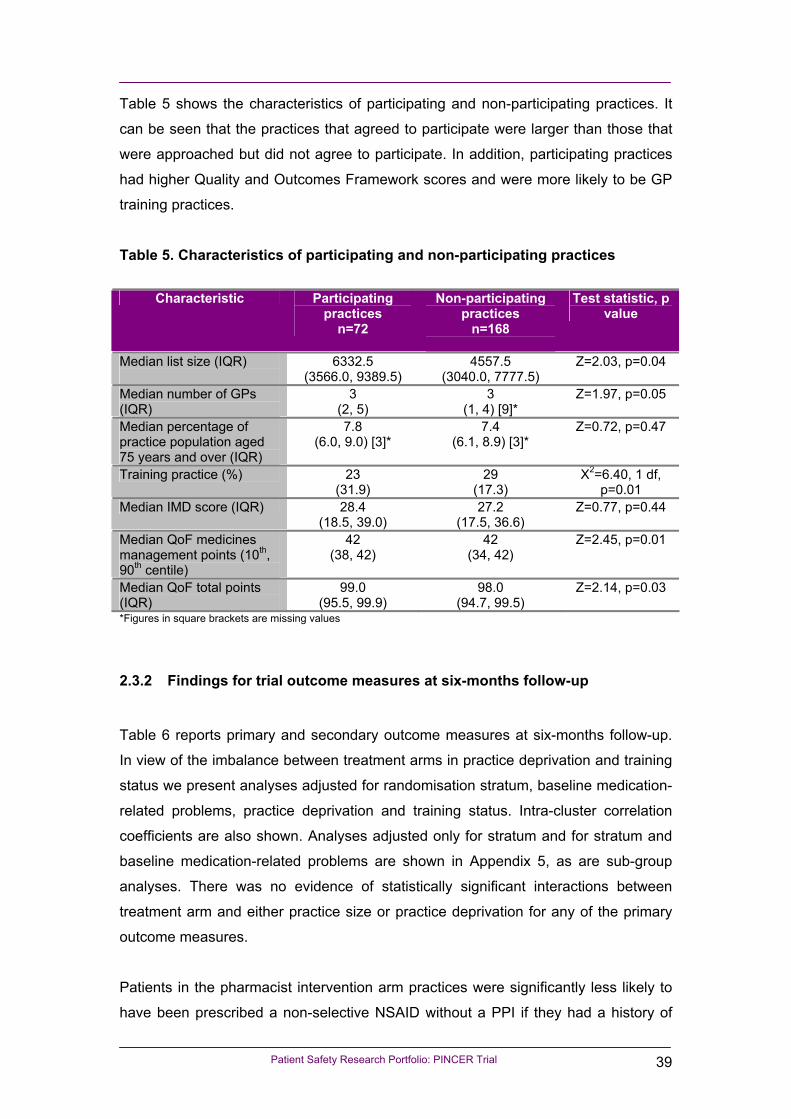
Table 5 shows the characteristics of participating and non-participating practices. It
can be seen that the practices that agreed to participate were larger than those that
were approached but did not agree to participate. In addition, participating practices
had higher Quality and Outcomes Framework scores and were more likely to be GP
training practices.
Table 5. Characteristics of participating and non-participating practices
Characteristic Participating practices
n=72
Non-participating practices
n=168
Test statistic, p value
Median list size (IQR)
6332.5 (3566.0, 9389.5)
4557.5 (3040.0, 7777.5)
Z=2.03, p=0.04
Median number of GPs (IQR)
3 (2, 5)
3 (1, 4) [9]*
Z=1.97, p=0.05
Median percentage of practice population aged 75 years and over (IQR)
7.8 (6.0, 9.0) [3]*
7.4 (6.1, 8.9) [3]*
Z=0.72, p=0.47
Training practice (%) 23 (31.9)
29 (17.3)
Χ2=6.40, 1 df, p=0.01
Median IMD score (IQR) 28.4 (18.5, 39.0)
27.2 (17.5, 36.6)
Z=0.77, p=0.44
Median QoF medicines management points (10th, 90th centile)
42 (38, 42)
42 (34, 42)
Z=2.45, p=0.01
Median QoF total points (IQR)
99.0 (95.5, 99.9)
98.0 (94.7, 99.5)
Z=2.14, p=0.03
*Figures in square brackets are missing values
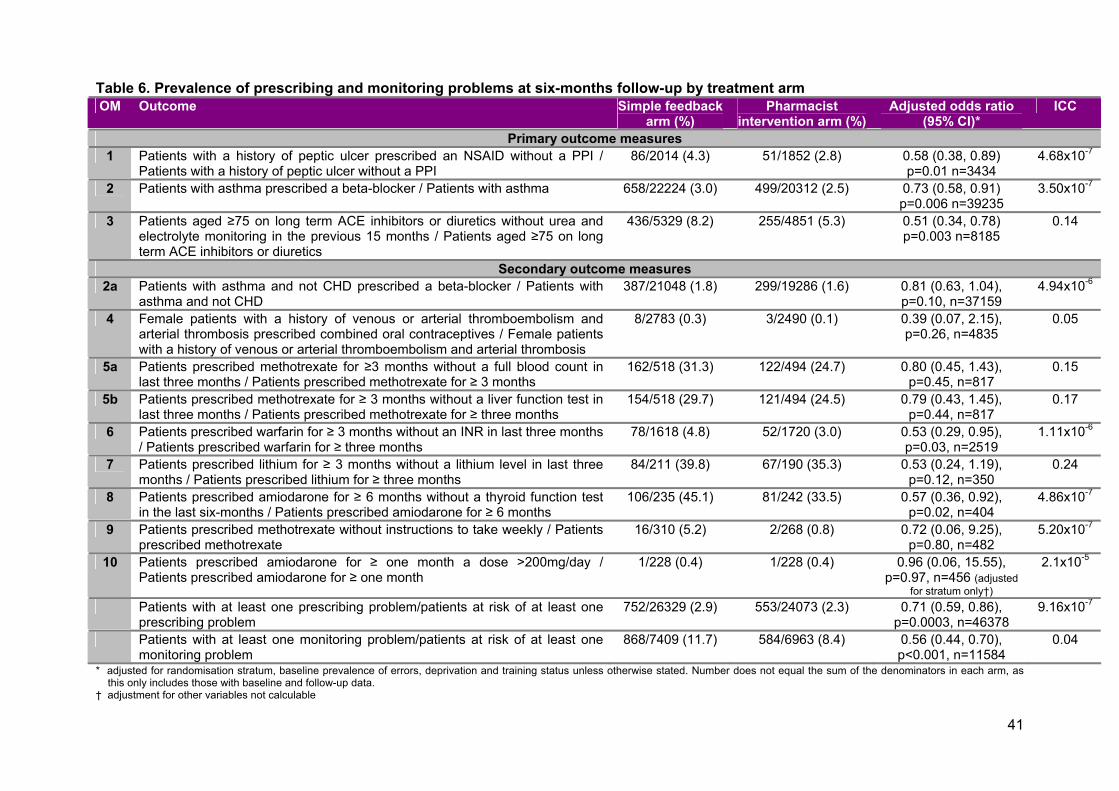
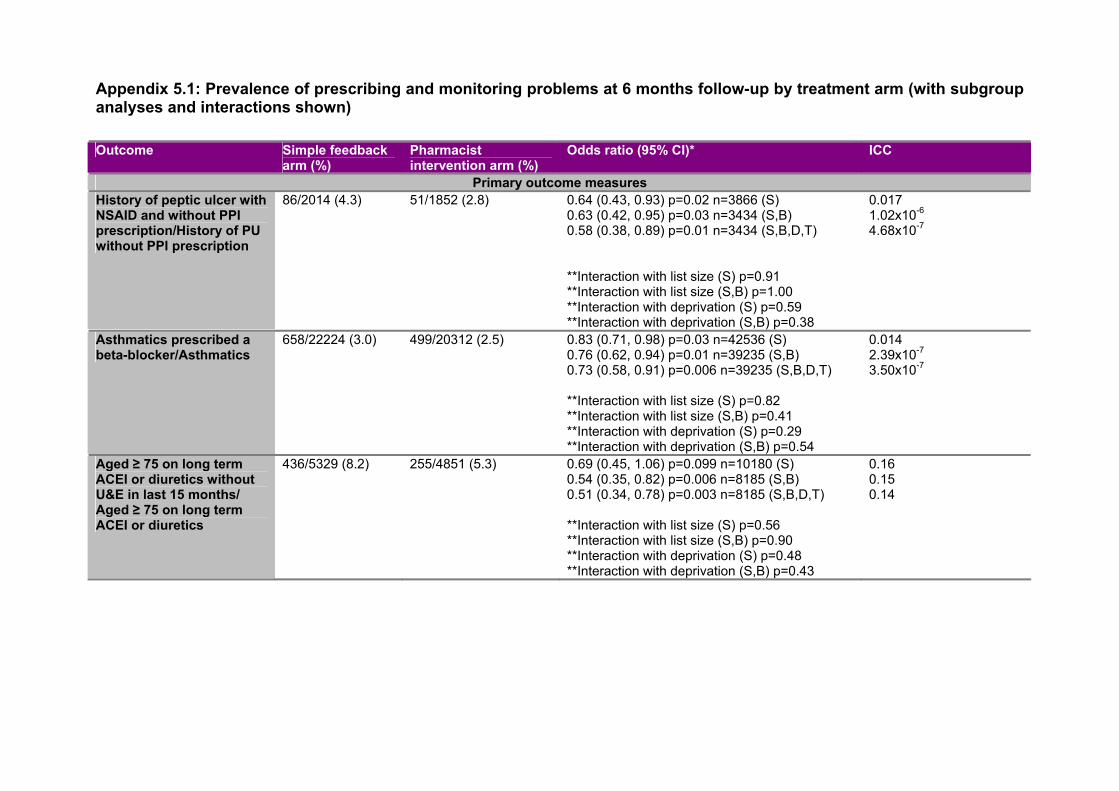
2.3.2 Findings for trial outcome measures at six-months follow-up
Table 6 reports primary and secondary outcome measures at six-months follow-up.
In view of the imbalance between treatment arms in practice deprivation and training
status we present analyses adjusted for randomisation stratum, baseline medication-
related problems, practice deprivation and training status. Intra-cluster correlation
coefficients are also shown. Analyses adjusted only for stratum and for stratum and
baseline medication-related problems are shown in Appendix 5, as are sub-group
analyses. There was no evidence of statistically significant interactions between
treatment arm and either practice size or practice deprivation for any of the primary
outcome measures.
Patients in the pharmacist intervention arm practices were significantly less likely to
have been prescribed a non-selective NSAID without a PPI if they had a history of
Patient Safety Research Portfolio: PINCER Trial 40
peptic ulcer (OR 0.58, 95%CI 0.38, 0.89), to have been prescribed a beta-blocker if
they had asthma (OR 0.73, 95% CI 0.58, 0.91) or to have been prescribed an ACE
inhibitor or diuretic without a U&E in the last 15 months (OR 0.51, 95% CI 0.34,
0.78).
In terms of the composite secondary outcome measures, patients in the pharmacist
intervention arm practices were significantly less likely to have a prescribing problem
(OR 0.71, 95% CI 0.59, 0.86) or monitoring problem (OR 0.56, 95% CI 0.44, 0.70). In
terms of the other secondary outcome measures, patients in the pharmacist
intervention arm practices were less likely to have been prescribed warfarin without
an INR in the previous three months (OR 0.53, 95% CI 0.29, 0.95), to have been
prescribed amiodarone without a TFT in the last six-months (OR 0.57, 95% CI 0.36,
0.92). There were no significant differences between treatment arms for other
secondary outcome measures.
41
Table 6. Prevalence of prescribing and monitoring problems at six-months follow-up by treatment arm OM Outcome Simple feedback
arm (%) Pharmacist
intervention arm (%) Adjusted odds ratio
(95% CI)* ICC
Primary outcome measures 1 Patients with a history of peptic ulcer prescribed an NSAID without a PPI /
Patients with a history of peptic ulcer without a PPI 86/2014 (4.3) 51/1852 (2.8) 0.58 (0.38, 0.89)
p=0.01 n=3434 4.68x10⁻⁷
2 Patients with asthma prescribed a beta-blocker / Patients with asthma 658/22224 (3.0) 499/20312 (2.5) 0.73 (0.58, 0.91) p=0.006 n=39235
3.50x10⁻⁷
3 Patients aged ≥75 on long term ACE inhibitors or diuretics without urea and electrolyte monitoring in the previous 15 months / Patients aged ≥75 on long term ACE inhibitors or diuretics
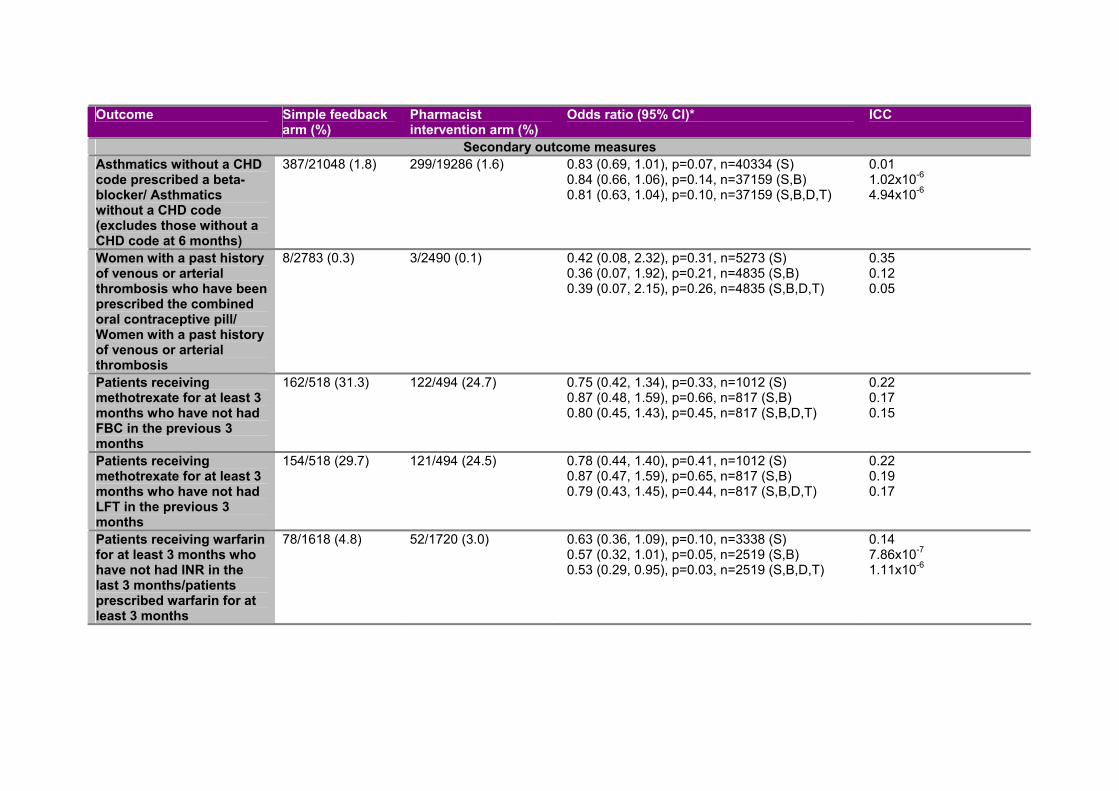
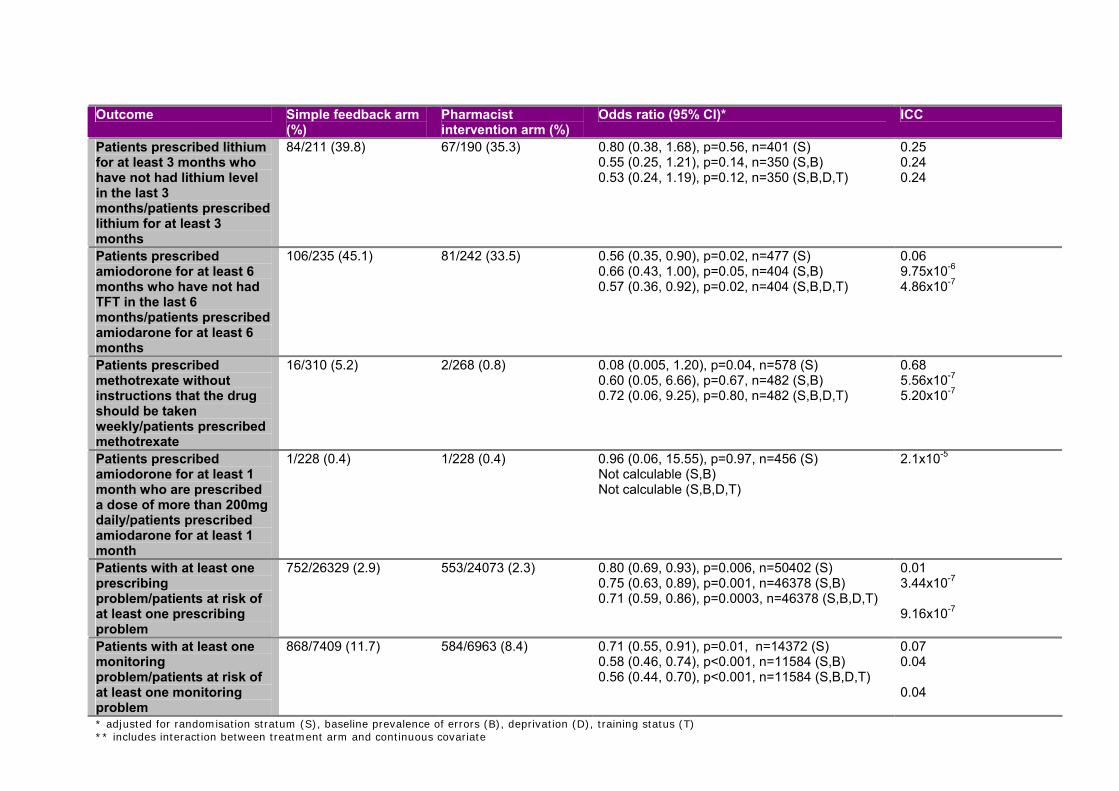
Secondary outcome measures 2a Patients with asthma and not CHD prescribed a beta-blocker / Patients with
asthma and not CHD 387/21048 (1.8) 299/19286 (1.6) 0.81 (0.63, 1.04),
p=0.10, n=37159 4.94x10⁻⁶
4 Female patients with a history of venous or arterial thromboembolism and arterial thrombosis prescribed combined oral contraceptives / Female patients with a history of venous or arterial thromboembolism and arterial thrombosis
5b Patients prescribed methotrexate for ≥ 3 months without a liver function test in last three months / Patients prescribed methotrexate for ≥ three months
* adjusted for randomisation stratum, baseline prevalence of errors, deprivation and training status unless otherwise stated. Number does not equal the sum of the denominators in each arm, as this only includes those with baseline and follow-up data.
† adjustment for other variables not calculable
Patient Safety Research Portfolio: PINCER Trial 42
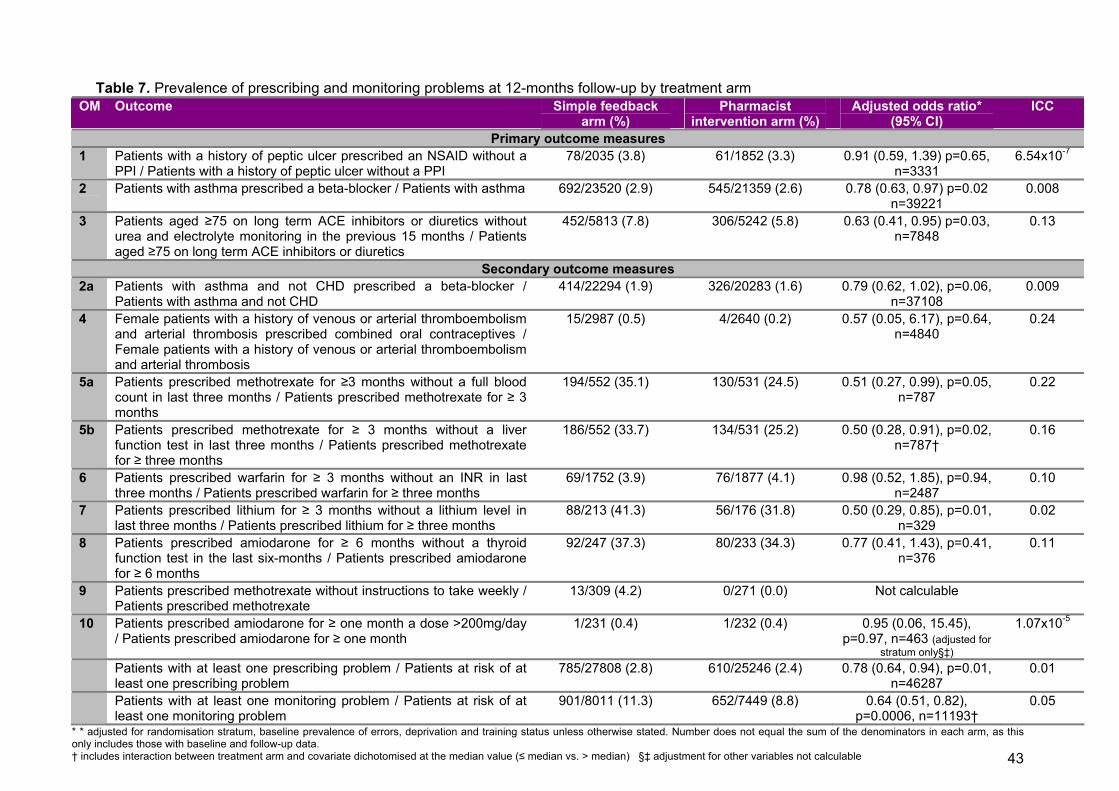
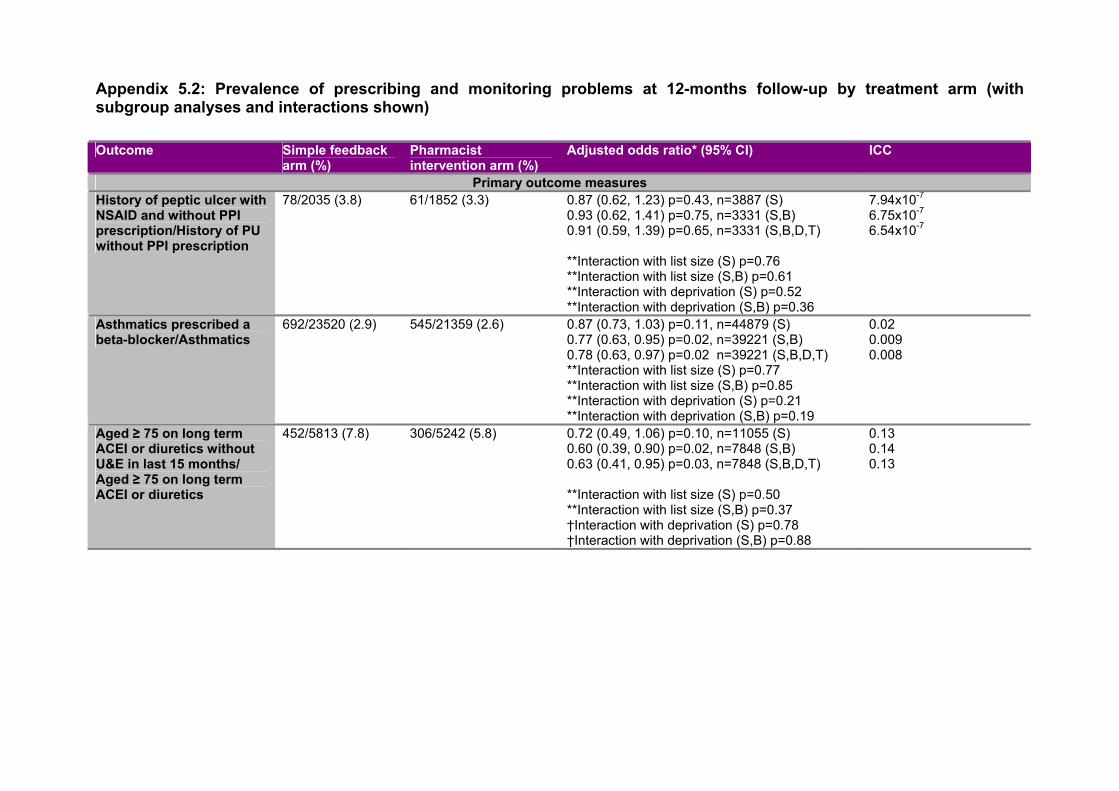
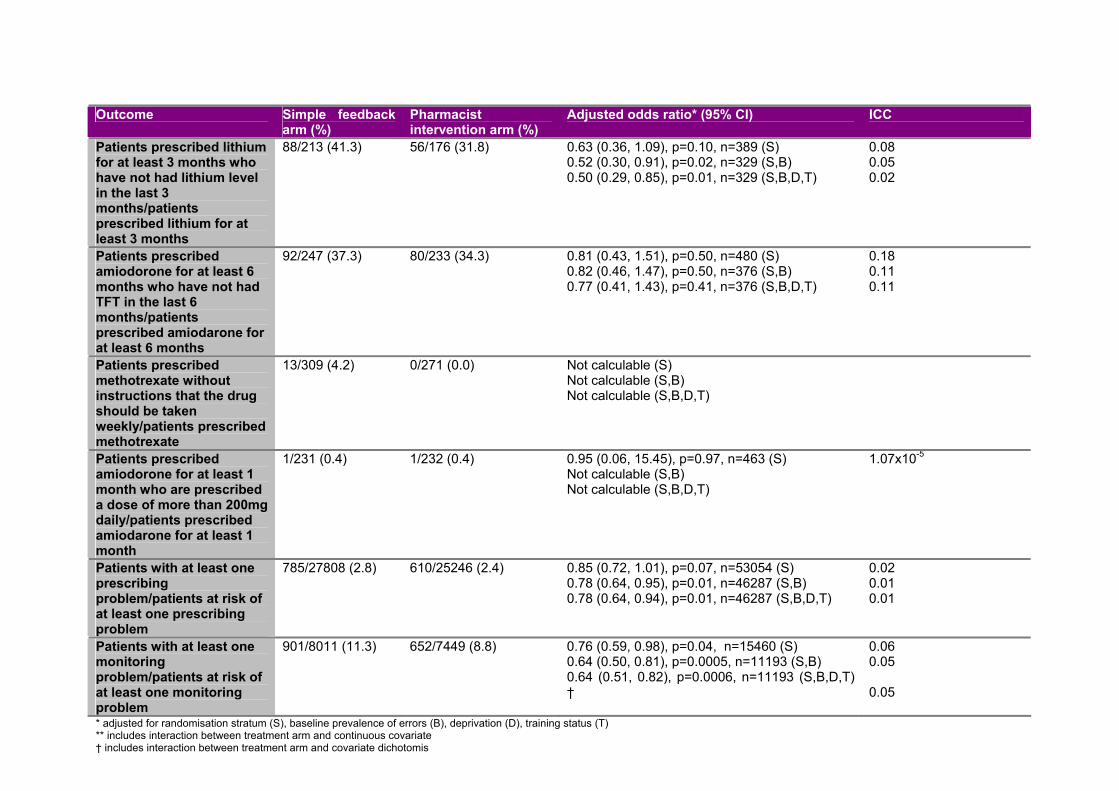
2.3.3 Findings for trial outcome measures at 12-months follow-up
Table 7 reports primary and secondary outcome measures at 12-months follow-up
adjusted for randomisation stratum, baseline medication-related problems, practice
deprivation and training status. Intra-cluster correlation coefficients are also shown.
Analyses adjusted only for stratum and for stratum and baseline medication-related
problems are shown in Appendix 5, as are sub-group analyses. There was no
evidence of statistically significant interactions between treatment arm and either
practice size or practice deprivation for any of the primary outcome measures.
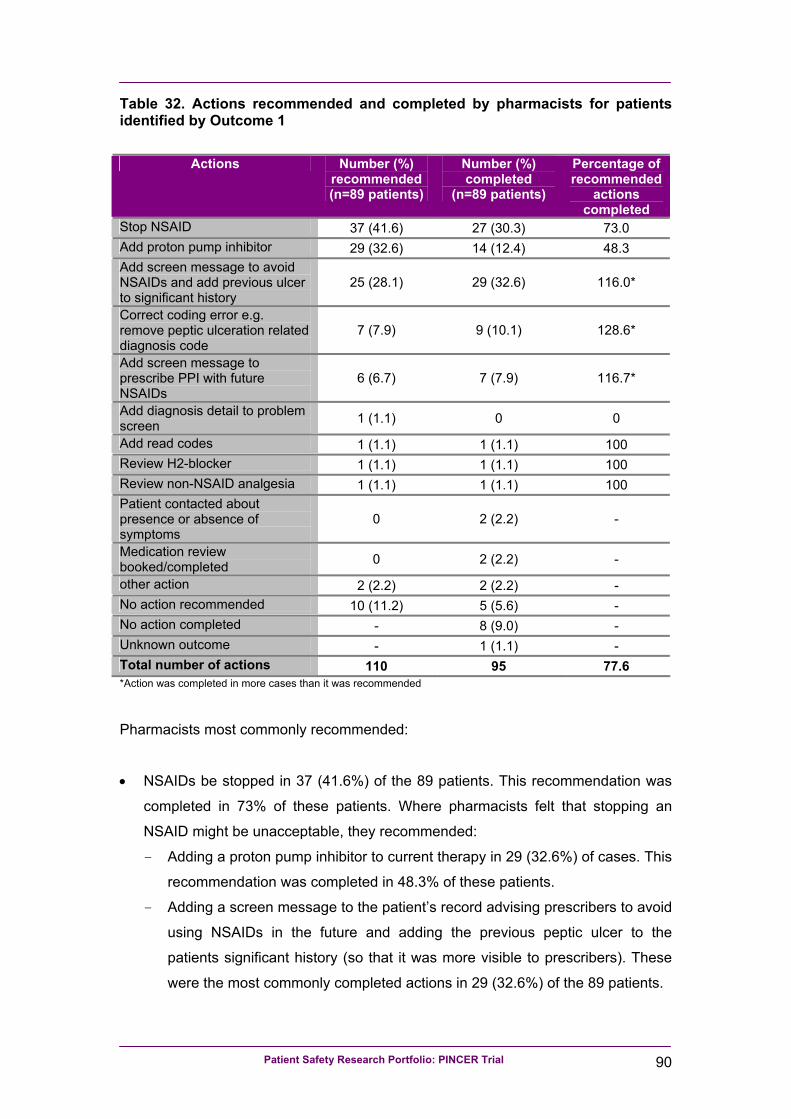
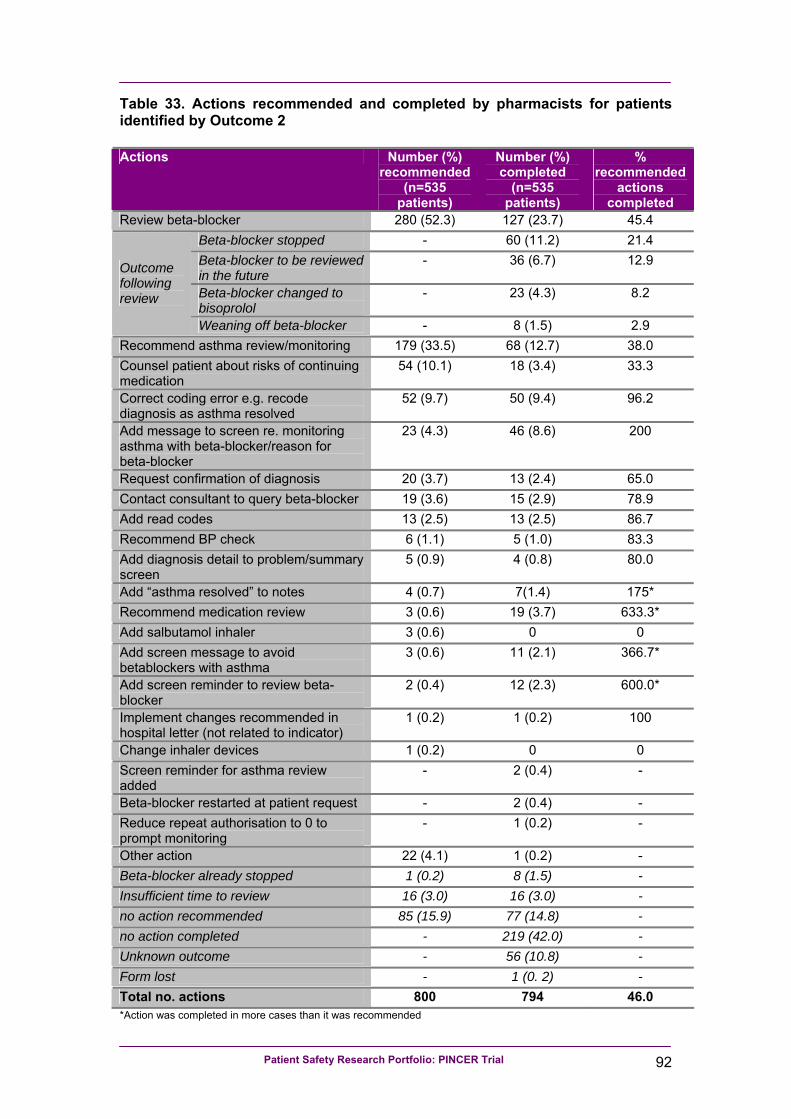
Patients in the pharmacist intervention arm practices were significantly less likely to
have been prescribed a beta-blocker if they had asthma (OR 0.78, 95% CI 0.63,
0.97) or to have been prescribed an ACE inhibitor or diuretic without a U&E in the
last 15 months (OR 0.63, 95% CI 0.41, 0.95). However there was no significant
difference in terms of being prescribed a non-selective NSAID without a PPI for
patients with a history of peptic ulcer (OR 0.91, 95%CI 0.59, 1.39).
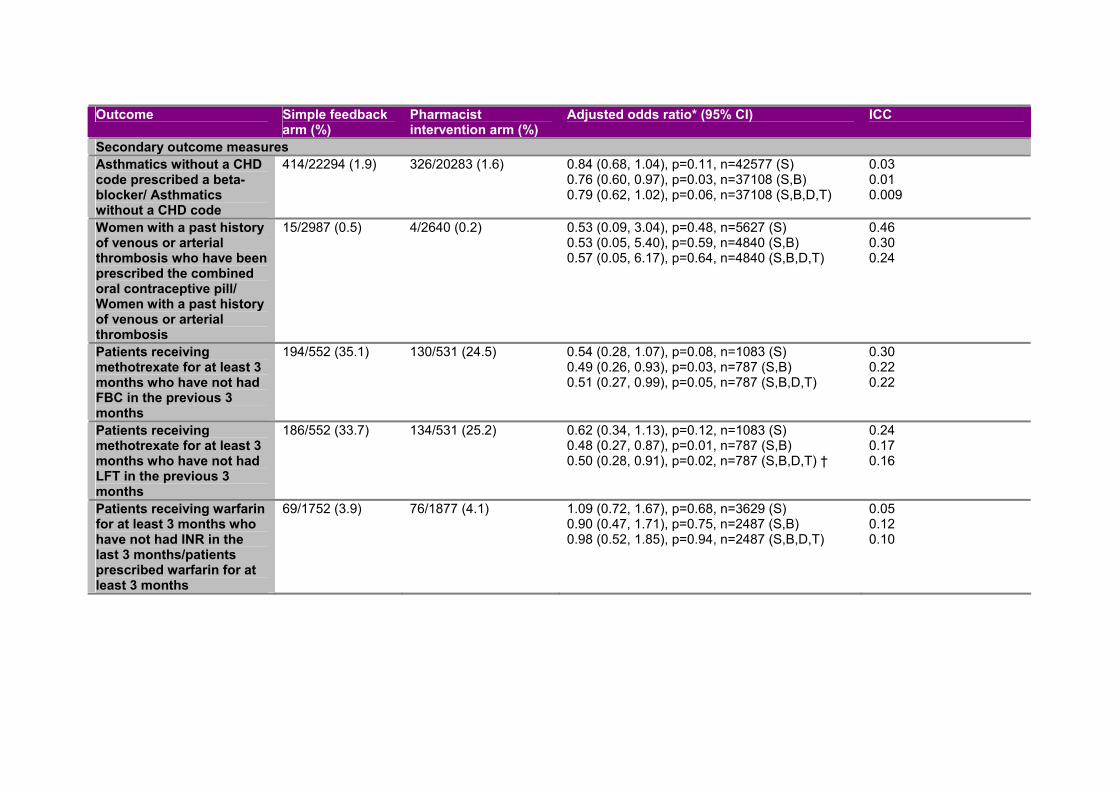
In terms of the composite secondary outcome measures, patients in the pharmacist
intervention arm practices were significantly less likely to have a prescribing problem
(OR 0.78, 95% CI 0.64, 0.94) or monitoring problem (OR 0.64, 95% CI 0.51, 0.82). In
terms of the other secondary outcome measures, patients in the pharmacist
intervention arm practices were significantly less likely to have been prescribed
methotrexate without a FBC (OR 0.51, 95% CI 0.27, 0.99) or LFT in the last 3
months (OR 0.50, 95% CI 0.28, 0.91), or to have been prescribed lithium without a
lithium level in the last 3 months (OR 0.50, 95% CI 0.29, 0.85). There were no
significant differences between treatment arms in other secondary outcome
measures.
43
Table 7. Prevalence of prescribing and monitoring problems at 12-months follow-up by treatment arm OM Outcome Simple feedback
arm (%) Pharmacist
intervention arm (%) Adjusted odds ratio*
(95% CI) ICC
Primary outcome measures 1 Patients with a history of peptic ulcer prescribed an NSAID without a
PPI / Patients with a history of peptic ulcer without a PPI 78/2035 (3.8) 61/1852 (3.3)
0.91 (0.59, 1.39) p=0.65,
n=3331 6.54x10⁻⁷
2 Patients with asthma prescribed a beta-blocker / Patients with asthma 692/23520 (2.9) 545/21359 (2.6) 0.78 (0.63, 0.97) p=0.02 n=39221
0.008
3 Patients aged ≥75 on long term ACE inhibitors or diuretics without urea and electrolyte monitoring in the previous 15 months / Patients aged ≥75 on long term ACE inhibitors or diuretics
Secondary outcome measures 2a Patients with asthma and not CHD prescribed a beta-blocker /
Patients with asthma and not CHD 414/22294 (1.9) 326/20283 (1.6) 0.79 (0.62, 1.02), p=0.06,
n=37108 0.009
4 Female patients with a history of venous or arterial thromboembolism and arterial thrombosis prescribed combined oral contraceptives / Female patients with a history of venous or arterial thromboembolism and arterial thrombosis
5b Patients prescribed methotrexate for ≥ 3 months without a liver function test in last three months / Patients prescribed methotrexate for ≥ three months
* * adjusted for randomisation stratum, baseline prevalence of errors, deprivation and training status unless otherwise stated. Number does not equal the sum of the denominators in each arm, as this only includes those with baseline and follow-up data. † includes interaction between treatment arm and covariate dichotomised at the median value (≤ median vs. > median) §‡ adjustment for other variables not calculable
Patient Safety Research Portfolio: PINCER Trial 44
2.3.4 Model checking
All except three models were robust to excluding practices, with standardised empirical
Bayes estimates of random effects above or below 2 SDs. The six-month follow-up model for
methotrexate prescription without an LFT in the last three months became significant after
excluding three practices with standardised empirical Bayes estimates of random effects
above or below 2 SDs (OR including all practices 0.79 (95% CI 0.43, 1.45) and OR
excluding three practices 0.53 (95% CI 0.30, 0.93)).
The 12-month follow-up model for methotrexate prescription without a FBC in the last three
months became non-significant when three practices with standardised empirical Bayes
estimates of random effects above or below 2 SDs were excluded from the analysis (OR
including all practices 0.51 (95% CI 0.27, 0.99) and OR excluding three practices 0.62 (95%
CI 0.35, 1.10). The 12-month follow-up model for the prescribing composite secondary
outcome measure became non significant when 3 practices with standardised empirical
Bayes estimates of random effects above or below 2 SDs were excluded from the analysis
(OR including all practices 0.78 (95% CI 0.64, 0.94) and OR excluding 3 practices 0.83 (95%
CI 0.68, 1.00).
In addition, model checking was not possible for some models. Firstly where the intra-cluster
correlation coefficient was very small, model checking became unreliable. In these cases the
standardised empirical Bayes estimates for some practices could not be estimated because
the standard deviation of the empirical Bayes estimates was zero. Therefore, testing for the
removal of outliers was not possible (Outcome 1 at six- and 12-months, Outcome 2a (for
patients with asthma but not coronary heart disease) at six-months, Outcome 6 at six-
months, Outcome 8 at six-months and the prescribing composite secondary outcome
measure at six-months). Secondly where the number of patients with an outcome was very
small, models excluding practices would not converge (Outcome 4 at 12-months, Outcome 9
at six- and 12-months and Outcome 10 at six- and 12-months).
Further information on subgroup analyses is shown in Appendix 5.
Patient Safety Research Portfolio: PINCER Trial 45
2.3.5 Examining potential differences in mortality between the treatment arms
Forty-four practices provided data (response rate = 61%). Two practices were excluded from
the analysis because we were not confident in the validity of the data: they reported no
deaths or patients leaving the practice. Therefore the analysis was done on 42 practices.
Simple feedback practices accounted for 54.8% (n=23) of the sample with pharmacist
intervention practices making up 45.2% (n=19).
The total number of patients identified at baseline in the 42 practices was 2266 (mean: 53.9
patients per practice; range: 12 - 191). The total number of patients identified at baseline minus those who subsequently left the
practice was 2169 (mean: 51.6 patients per practice; range: 11 to 183). This is the sample
on which we did statistical analysis because we felt that it would not be valid to include
patients who had left the practice (where we had no information on whether they had died or
not).
Table 8 below shows the proportions of patients who died during the 15 months following
baseline data collection by intervention group. The unadjusted mortality refers to all patients
identified at baseline, whereas the adjusted mortality excludes patients that had left the
practice within the 15 months following baseline data collection.
A non-parametric two-independent-samples test was used to examine differences in
mortality data between the two intervention arms for the adjusted mortality data. There was
no statistically significant difference between the two groups (p=0.85).
Table 8. Proportions of patients who died during the 15 months following baseline data collection by intervention group
Simple Feedback Pharmacist intervention Median Inter-quartile
range Median Inter-quartile
range Unadjusted mortality
Proportion of patients who died
4.58 [3.03, 10.53] 4.76 [2.38, 9.57]
Adjusted mortality Proportion of patients who died
5.0 [3.03, 10.64] 5.26 [2.70, 10.34]
Patient Safety Research Portfolio: PINCER Trial 46
2.4 Discussion
2.4.1 Summary of main findings
This trial has shown that a pharmacist-led IT-based complex intervention using educational
outreach and practical support is more effective than simple feedback in reducing the
proportions of patients at risk from hazardous prescribing and inadequate medication
monitoring in general practice. Statistically significant differences were noted for each of the
three primary outcome measures at six-months follow-up and for two of the three primary
outcome measures at 12-months follow-up. Statistically significant differences were noted for
both the prescribing and monitoring composite outcome measures at both six- and 12-
months follow-up. Given the high risk of serious iatrogenic harm associated with these
errors, reductions of the magnitude observed in this trial are likely to be clinically important.
2.4.2 Strengths and limitations of the trial
2.4.2.1 Recruitment of general practices
Our recruitment of general practices was moderately successful give that 30% of those
approached agreed to participate. It is likely that our success in recruitment relates to the
attention to detail we put into developing a feasible intervention that was seen to be relevant
to general practices. This view is backed up by the findings of our qualitative study.
In addition, we put considerable effort into our recruitment strategy including pre-publicising
the trial, sending documentation to general practices about the trial and following up on this
to arrange visits to practices where the study was explained in more detail.
2.4.2.2 Allocation to intervention groups
We avoided any risk of bias in allocation to intervention groups by using an independent
web-based randomisation service, and the sequence of treatment allocations was concealed
until all data analyses had been completed. The groups were reasonably well matched in
terms of list size, age-sex structure of the practice population and Quality and Outcomes
Patient Safety Research Portfolio: PINCER Trial 47
Framework scores, although the pharmacist intervention practices were slightly more
deprived and were slightly more likely to be GP training practices (see Table 3). We took
account of the latter two factors in our analysis. Nevertheless, one could argue that we
should have collected comparative data on other factors such as the proportion of UK
graduate doctors, doctors with postgraduate qualifications, and measures of prescribing
practice outside Quality and Outcomes Framework.
2.4.2.3 Sample size calculations
Our sample size calculations were based on the assumption that for the proportion of
patients fulfilling the criteria for any one of our primary outcome measures, there would be a
maximum 11% reduction in the simple feedback arm and a 50% reduction in the pharmacist
intervention arm.
Our findings at six-months follow-up show that for the primary Outcomes 1-3 (see Table 1),
the reductions in proportions of patients with potentially hazardous patterns of prescribing
and medication monitoring were 41.6%, 10.7% and 57.9% in the pharmacist intervention
group and 8.5%, 0 and 19.6% in the simple feedback group respectively (these figures were
calculated from data in Table 4 and Table 6). The reductions in the pharmacist intervention
arm were large for Outcomes 1 and 3, but only just over 10% for Outcome 2. The reductions
in the simple feedback arm were less than our estimated 11% for Outcomes 1 and 2, but
twice this amount for Outcome 3.
2.4.2.4 Ascertainment of outcome measures
Baseline data extraction was undertaken smoothly and successfully and provided the
information needed for practices to consider acting on patients with potentially hazardous
prescribing and medicines management. In particular, data extraction for our pre-specified
primary outcome measures appears to have worked successfully in all general practices
recruited to the study. Nevertheless, we encountered some difficulties with the secondary
outcome measures, as described above (see section 2.2.7.1). Some of these problems
could have been avoided with better foresight on behalf of the research team. For example,
had we been aware that some general practices kept a separate record of INR results and
did not keep these on their main clinical computer systems, we could have excluded such
practices from our recruitment. Similarly, if we had realised that it would not be possible to
Patient Safety Research Portfolio: PINCER Trial 48
extract dosage instructions for general practices using the TPP computer system, we could
have excluded practices using this computer system (we did pilot our outcome measures
using the TPP computer system and went ahead with recruiting practices because we
erroneously believed that there was a solution to the problem). For Outcome 9, which
focused on dosage instructions for methotrexate (see Table 1), a national policy change that
occurred during the course of our study25 may have reduced the proportion of analysable
cases. This is because the introduction of a forcing function to GP computer systems, which
does not allow for anything, but weekly dosing, does not always appear as a line of dosing
text that can be picked up by MIQUEST software. Nevertheless, we did find sufficient
numbers of patients with dosage instructions in order to do this analysis.
2.4.2.5 Compliance
All practices recruited to the study complied to the extent that they allowed data to be
extracted from their clinical computer systems. All practices in the pharmacist intervention
arm of the trial allowed the pharmacists into the practice. In both arms of the trial there was a
lack of engagement in some practices as indicated by our qualitative analysis (see Chapter
5: Qualitative evaluation of the PINCER trial)
2.4.2.6 Losses to follow-up
None of the practices were lost to follow-up. As noted in our qualitative analysis, this may in
part be due to the fact that the study was seen to be relevant to GPs and that it did not
involve them in running computer searches themselves or recruiting patients.
2.4.2.7 Missing data
No data were missing for any of the outcome measures for any practice for any time point. It
was a major undertaking to obtain complete data and this was partly due to the organisation
and hard work of the research team, with support from TCR Nottingham, and partly due to
the willingness of practices to allow the research team in to run computer searches at
baseline as well as six-months and 12-months follow-up.
Patient Safety Research Portfolio: PINCER Trial 49
2.4.2.8 Analysis
The analysis was undertaken independently by two statisticians both producing similar
findings. Where minor differences were found, the reasons for these were explored and in all
cases discrepancies were resolved.
2.4.2.9 Generalisability
Practices that took part in the study were larger than those that were approached but did not
take part. Also, the participating practices had higher scores in the Quality and Outcomes
Framework and were more likely to be GP training practices. This means that the practices
recruited to the PINCER trial were not representative of all practices approached.
In addition, comparison of outcome measures at baseline for trial practices with a similar
time point for the practices used in the analysis from the QRESEARCH database shows
reasonably similar findings (see Table 50 in Chapter 6: QRESEARCH analysis of secular
trends in outcome measures). The PINCER trial practices had relatively low proportions
(29% vs. 35%) of patients aged 75 years and older on ACE inhibitors or loop diuretics with
no U&E monitoring in the previous 15 months. The PINCER trial practices had relatively high
proportions of patients on methotrexate that had not had FBC and LFT checked within the
previous three months (10.5% and 10.0% respectively vs. 6.0% and 6.2%).
Practices taking part in the PINCER trial and QRESEARCH practices appeared to be quite
similar in terms of list size and demographic characteristics (see Table 46 in section 6.3.1).
Compared with UK data from 1st April 200747 practices participating in the PINCER trial had
slightly higher median (interquartile range) list sizes: simple feedback arm 6438 (3834,
9707); pharmacist intervention arm 6295 (2911, 9390); UK practices 5582 (3235 to 8781).
Both the PINCER and QRESEARCH samples had similar age distribution to the UK
population according to figures from the Office for National Statistics48.
The prevalence of asthma in both practice samples (11.4% in QRESEARCH and 10.9% in
PINCER) was similar. These figures are lower than the prevalence quoted in the Health
Survey for England 2001 where 15% of those aged 16 and older were reported to have ever
had “doctor diagnosed asthma” (as recalled by the respondents)49.
Patient Safety Research Portfolio: PINCER Trial 50
The prevalence is however higher than the UK prevalence of 5.7% from the national Quality
and Outcomes Framework (2007-08)50: This is probably because the QoF data exclude
“patients who were prescribed no asthma related drugs in the previous 12-months”. The
prevalence of peptic ulcer in both samples was close to UK national prevalence (1.6% in
PINCER and QRESEARCH vs. 1.4%)51.
Patient Safety Research Portfolio: PINCER Trial 51
3 Chapter 3: Pincer economic analysis
Patient Safety Research Portfolio: PINCER Trial 52
3.1 Introduction
We have undertaken a two-stage economic analysis from the perspective of a payer within
the English NHS: a within-trial analysis of cost per error avoided and a modelling analysis of
economic impact of error reduction.
The principal objective of the within-trial analysis was to identify and value the resource use
associated with the interventions used in the trial, in relation to changes in error rates
between intervention and control practices. The principal objectives of the modelling analysis were to:
• Identify and value the impact on patients’ health status of the interventions;
• Identify and value the resource use associated with reduced prescribing errors in general
practice;
• Assess the relative value for money of the interventions.
We report the methods and results for the within trial analysis here; the results of the
modelling analysis will be reported separately, although we do outline our approach to the
modelling analysis in this chapter.
3.2 Methods
3.2.1 Recruitment of patients
For the purposes of the economic analysis, the general practices recruited to the study were
asked to write to all patients identified through baseline data collection who appeared in the
numerator of one of our outcome measures (i.e. they had potentially been subjected to
errors in prescribing or medication monitoring). In the accompanying patient information
leaflet, patients were given information about the study and were asked to give consent for
the research team to access their medical records. Patients were asked to sign a consent
form and to return this to the study team. Copies of letters sent to patients along with
information leaflet and consent forms are provided in Appendix 1.
Patient Safety Research Portfolio: PINCER Trial 53
For Outcome 6 (prescribing warfarin with no record of INR in the previous 12 weeks), we
identified some practices that keep their records of international normalised ratio (INR)
results for monitoring anticoagulation therapy separate from their main practice computer
system and thus appeared to have very high proportions of patients not having INRs
checked according to the computer searches we undertook. In these cases, we did not write
to patients to seek consent to access their records because it is likely that the majority were
not at risk.
3.2.2 Perspective
We undertook the economic analysis from the perspective of the funder of the pharmacist
intervention or simple feedback intervention (such as the English NHS) in terms of the direct
costs of providing an intervention to reduce prescribing errors in general practice.
3.2.3 Comparators and key parameters under investigation
The evaluation compared the pharmacist-led intervention with simple feedback. Figure 2
illustrates the comparators and the probabilistic events that are associated with each
strategy in the within-trial analysis.
Patient Safety Research Portfolio: PINCER Trial 54
Figure 2. A decision analytic model of pharmacist intervention versus simple feedback in patients at risk of error
Patient at risk of error
no error
error
Pharmacistintervention
Simple feedback
error
no error
For the purposes of the within trial analysis of cost per error avoided, we examined the
differences in costs of the pharmacist intervention compared with simple feedback, in the
context of error rate reduction.
3.2.4 Outcomes
The primary outcome was the number of errors detected by the report generation process in
both the pharmacist intervention and simple feedback arms. The outcome associated with
the intervention and control arms is the probability of error detected by the practice at six-
months and 12-months after the intervention.
We incorporated data on Outcomes 1, 2, 3, 5, 7 and 8 (see Table 1). We decided not to
incorporate data for the economic analysis for Outcomes 6, 9 and 10, because of the
problems we had with data ascertainment (see section 2.2.7.1); in addition, the numbers of
patients identified for Outcome 4 were too low to allow for meaningful within-trial economic
analysis and so this outcome measure was also not included.
Patient Safety Research Portfolio: PINCER Trial 55
3.2.5 Costs
Costs were obtained from the perspective of the NHS in terms of the direct costs of providing
an intervention to reduce prescribing errors in general practice.
In this cluster trial, costs could have been incurred at both the patient and cluster (practice)
level. Randomising by cluster can lead to imbalances between treatment arms in practice or
patient level factors, including resource use. The costs measured at practice level were the
costs of setting-up and delivering the intervention. The costs measured at the patient level
were any costs of delivering the intervention that can be linked to individual patients. In the
within-trial analysis, all costs were incurred at practice level, so correction for clustering was
not required.
3.2.6 Simple feedback arm resource use
The simple feedback arm required the researchers to go back into the practices at set time
periods and extract patient data from the GP systems; this is the only cost that is associated
with the simple feedback arm of the PINCER trial.
These report generation costs were also incurred by the pharmacist intervention arm.
If practices put some effort into correcting patients’ problems then this would have been a
cost in the simple feedback arm and the pharmacist intervention arm, but these data were
not collected in either arm.
3.2.6.1 Pharmacist intervention resource use
The pharmacist intervention comprised the following stages: a training session; facilitated
meetings; monthly meetings and practice feedback meetings; plus time spent in each
practice outside meetings following up errors. We discuss the cost implications of these
components of the intervention in turn below:
Patient Safety Research Portfolio: PINCER Trial 56
• Training session
The initial training session costs included stationery, food and drink, room and equipment
hire/use, trainers’ time, pharmacists’ time, travel and accommodation. These costs can
be seen as the set up costs of the intervention and would be incurred if the intervention
were rolled out into clinical practice. Training costs were allocated to intervention
practices according to list size. This was calculated by deriving the total training cost for
the 36 practices, and then allocating a portion of that training cost to a practice based on
the list size.
• Facilitated meetings
The aim of the facilitated meeting was to provide a strategic overview of the initiative and
to maximise homogeneity of the pharmacist intervention. In clinical practice, a facilitated
meeting would equate to a strategic practice meeting. Facilitated meeting costs were
allocated to intervention practices according to list size. This was calculated by deriving
the total facilitated meeting cost for the 36 practices, and then allocating a portion of that
cost to a practice based on the list size.
• Monthly meetings
The aim of the monthly meeting between practice pharmacists and the study co-
ordinator was to deal with operational issues within individual practices. Monthly
meetings between the project co-ordinator and the pharmacists would equate to
operational practice meetings, and, in practice, would be added onto other PCT team
pharmacist meetings. Monthly meeting costs were allocated to pharmacist intervention
practices according to list size.
• Practice feedback sessions
The aim of the feedback session was to provide each practice with feedback and support
on management of errors, using root cause analysis to look at systems. Practice
feedback sessions were usually 15-60 minutes, with up to three feedback sessions per
practice. Practice feedback session costs were allocated to the pharmacist intervention
practices according to how many were carried out.
• Other time spent by PINCER pharmacists on intervention
PINCER pharmacists also spent time working on the intervention outside the meetings
listed above. Costs of time spent per error detected were calculated and added to the
cost for each practice.
Patient Safety Research Portfolio: PINCER Trial 57
3.2.6.2 Unit costs
• Costs of consumables and room hire
Actual local unit costs were used (2008 costs, written communication), and are assumed
to reflect unit costs of items that would be consumed in practice.
• Staff costs
Hourly wage was calculated using average annual gross salary plus employers on costs.
Annual wages were obtained from the individual people involved. The annual wage is
presumed to be based on working 37.5 hours per week, for 44 weeks a year. Therefore
the annual gross wage, plus employers’ on costs, was divided by 1500 (2008 costs).
• Construction of total costs associated with intervention delivery
The following costs were allocated to each practice on a per practice (weighted by list
size) basis: training; facilitated meetings; and monthly meetings.
The following costs were allocated to each practice using individual practice data:
- Practice feedback session costs: combination of pharmacist costs
- Other time spent by PINCER pharmacists on the intervention.
The cost of generating the reports was added to the pharmacist intervention practice’s
costs. This generated a total intervention cost per practice.
3.2.7 Economic analysis
An economic evaluation was carried out to generate the cost per detected error avoided,
from the perspective of the English NHS, comparing the pharmacist-led intervention with
simple feedback.
The study was not powered to detect differences in costs because there is no prior study
upon which to base a power calculation. Error rates in practices in both groups were
followed up for six- and 12-months following the completion of the intervention in each
practice. The time horizon for the within-trial analysis was the length of the intervention i.e.
12 weeks in the pharmacist intervention practices. The costs measured at practice level
were the costs of setting up and delivering the intervention.
Patient Safety Research Portfolio: PINCER Trial 58
Incremental cost-effectiveness ratios (ICERs) were calculated for differences in error rates
between the simple feedback and pharmacist-led interventions. If the lower cost intervention
was also associated with better outcomes than the more costly comparator, this was treated
as the dominant intervention. In this scenario, incremental ratios would not be calculated for
this intervention, since its use would lead to both net savings and greater benefits. ICERs
were calculated if the higher cost intervention was associated with better outcomes. The
Base list-size was scaled downwards for regression; the coefficient therefore reflects the
marginal increase in errors from, a predicted mean of 33.69 per practice, of an additional
100 patients. The variables for number of GPs and at-risk list-size are not statistically
significant when base list-size is included, suggesting that they are all representing the
overall catchment of the practice. Neither area-level deprivation nor QOF scores were
statistically significant, nor particularly large.
Besides using information criteria to select specifications and to choose between Poisson
and negative binomial regression models, standard approaches to testing for independence
in the errors were used, including fitting covariates to the residuals and fitting residuals to the
fitted values. This supported the models above as appropriate approaches.
Patient Safety Research Portfolio: PINCER Trial 65
3.3.2 Costs
3.3.2.1 Simple feedback arm resource use
In total, three reports were run in each practice (baseline, six-months and 12-months)
costing a total of £92.84 per practice at six-months follow-up, and £139.26 per practice at
12-months follow-up (see Table 11 below for details).
Table 11. Resource use and cost associated with generating reports
Cost item Cost/£ Source of unit cost
Running the query 5.16 Assistants hourly wage* Printing the report 41.26 Assistants hourly wage* Total cost per report 46.42 *Hourly wage was calculated based on working 37.5 hours a week, for 44 weeks a year. The amount of weeks worked per year is based on 8 weeks off a year due to holiday and sick leave.
From discussions with researchers, we estimated running queries took two hours and report
printing took 15 minutes. These times varied greatly for a number of different reasons. The
time it took to print the report depended purely on the speed of the printer. The time to run
the query however varied greatly between practices, and this was not based on the size of
the practices. Key reasons included the speed of the system in the practice, how many
people were using the system at the time the query was run and whether the system
crashed before completion. If the system crashed before finishing the query, then the query
would have to be run again from the start. For this reason, a flat rate was assumed for the
time taken to run the computer queries based on the time it should take without any
problems occurring.
3.3.2.2 Training session costs
Training sessions were held for the pharmacists running the interventions across the 36
intervention practices. Training session costs are summarised in Table 12.
Patient Safety Research Portfolio: PINCER Trial 66
Table 12. Training costs
Cost item Cost/£ Source of unit cost
Preparation time 1851.30 Participants hourly wage* Stationery costs 278.06 Stationery order forms Food and drink 736.70 Hospitality service statement Room hire 650.00 Primary Care Information Services (PRIMIS+) Equipment hire 450.00 PRIMIS+ Assistants’ time 1751.46 Assistants hourly wage* Pharmacist time 3420.33 Pharmacists hourly wage* Travel costs 795.41 Mileage rate as of Oct 2009 (Manchester University rate) Accommodation 195.00 University rates Total costs 9933.26 *Hourly wage was calculated based on working 37.5 hours a week, for 44 weeks a year. The amount of weeks worked per year is based on eight weeks off a year due to holiday and sick leave.
3.3.2.3 Preparation for monthly meetings and quarterly facilitated meetings
The set up costs for both monthly meetings and quarterly facilitated meetings included
preparation time and stationery costs. These costs are summarised in Table 13, and were
allocated to practice by list size.
Table 13. Preparation costs
Cost item Cost/£ Source of unit cost
Preparation time 82.52 Participants hourly wage* Stationery 20.37 University costs Total costs 102.89 *Hourly wage was calculated based on working 37.5 hours a week, for 44 weeks a year. The amount of weeks worked per year is based on eight weeks off a year due to holiday and sick leave.
3.3.2.3.1 Facilitated meeting costs
Five quarterly facilitated meetings were held for the pharmacists running the interventions
across the 36 intervention practices. The costs for running these ‘facilitated meetings’ are
summarised in Table 14.
Patient Safety Research Portfolio: PINCER Trial 67
Table 14. Facilitated meeting costs
Cost item Cost/£ Source of unit cost
Room hire and catering 753.05 PRIMIS+ room hire Assistants’ time 531.22 Assistants hourly wage* Pharmacist time 3335.89 Pharmacists hourly wage* Pharmacist travel costs** 2278.65 Mileage rate, Oct 2009 (Manchester University) Accommodation 78.00 Staff expenses claim form Total costs 6976.81 *Hourly wage was calculated based on working 37.5 hours a week, for 44 weeks a year. The amount of weeks worked per year is based on eight weeks off a year due to holiday and sick leave. **Pharmacists travel costs includes the mileage that was claimed for travelling, but also how much they were paid during their travel time to the meeting
3.3.2.3.2 Monthly meeting costs
Twelve monthly meetings were held for the pharmacists running the interventions across the
36 intervention practices. Monthly meeting costs are summarised in Table 15.
Table 15. Monthly meeting costs
Cost item Cost/£ Source of unit cost
Room hire and catering 75.00 Invoice/Price list from venue Assistants’ time 186.72 Assistants hourly wage* Pharmacist time 687.68 Pharmacists hourly wage* Pharmacist travel costs** 1046.90 Mileage rate Oct 2009 (Manchester University) Total costs 1996.30 *Hourly wage was calculated based on working 37.5 hours a week, for 44 weeks a year. The amount of weeks worked per year is based on 8 weeks off a year due to holiday and sick leave. **Pharmacists travel costs includes the mileage that was claimed for travelling, but also how much they were paid during their travel time to the meeting.
3.3.2.3.3 Practice feedback session costs
Between one and three practice feedback sessions were held for each of the 36 intervention
practices. The length of time spent per practice was not recorded, but was estimated by the
pharmacists to be about one hour. Therefore, each practice was allocated the costs for a
practice feedback session costs as summarised in Table 16.
Patient Safety Research Portfolio: PINCER Trial 68
Table 16. Practice feedback session costs
Cost item Cost/£ Source of unit cost
Pharmacist time 22.07 Pharmacist hourly wage Total costs per practice 794.52
3.3.2.3.4 Time spent by pharmacists dealing with errors
Of 2037 detected errors, the time spent dealing with these was recorded for 1889 (see Table
17. The mean time spent dealing with each error was 23.3 minutes (median 18.4 minutes,
range 0-180 minutes) as shown in Table 17.
Table 17. Details of time spent dealing with errors
*N=number of cases †Percentage of cases identified for outcome measure where recommendations made ‡Percentage of cases identified for outcome measure where actions completed **Percentage of recommended actions where an action was completed (including alternatives to the recommended actions)
85
Table 27. Number of actions recommended and completed (%) in “at clinical risk” cases, by outcome measure
Outcome measure Number (%) of at risk cases where actions recommended and completed Total no. of actions
other action 2 (2.2) 2 (2.2) - No action recommended 10 (11.2) 5 (5.6) - No action completed - 8 (9.0) - Unknown outcome - 1 (1.1) - Total number of actions 110 95 77.6 *Action was completed in more cases than it was recommended
Pharmacists most commonly recommended:
• NSAIDs be stopped in 37 (41.6%) of the 89 patients. This recommendation was
completed in 73% of these patients. Where pharmacists felt that stopping an
NSAID might be unacceptable, they recommended:
- Adding a proton pump inhibitor to current therapy in 29 (32.6%) of cases. This
recommendation was completed in 48.3% of these patients.
- Adding a screen message to the patient’s record advising prescribers to avoid
using NSAIDs in the future and adding the previous peptic ulcer to the
patients significant history (so that it was more visible to prescribers). These
were the most commonly completed actions in 29 (32.6%) of the 89 patients.
Patient Safety Research Portfolio: PINCER Trial 91
• In 7 (7.9%) patients the history of peptic ulceration was unclear and pharmacists
recommended that the coding for peptic ulceration be removed (if appropriate).
This action was completed in 9 (10.1%) of cases (in some cases, GPs completed
actions which the pharmacists had not recommended).
4.3.6.2 Outcome 2: Prescribing beta-blockers to patients with a history of asthma
Pharmacists recommended 17 different types of action in 433/535 (80.9%) patients.
Pharmacists often made multiple recommendations for patients identified for
Outcome 2, where if the first recommendation was unsuitable, an alternative
recommendation was immediately available to the prescriber e.g. review beta-
blocker, or if not suitable then increase frequency of asthma monitoring. Pharmacists
recommended that no action be taken for 85 (15.9%) of the 535 patients. Actions
were completed in 296 (55.3%) patients. Details of all actions recommended and
completed are summarised in Table 33 below.
Patient Safety Research Portfolio: PINCER Trial 92
Table 33. Actions recommended and completed by pharmacists for patients identified by Outcome 2
Actions Number (%) recommended
(n=535 patients)
Number (%) completed
(n=535 patients)
% recommended
actions completed
Review beta-blocker 280 (52.3) 127 (23.7) 45.4 Beta-blocker stopped - 60 (11.2) 21.4 Beta-blocker to be reviewed in the future
- 36 (6.7) 12.9
Beta-blocker changed to bisoprolol
- 23 (4.3) 8.2
Outcome following review
Weaning off beta-blocker - 8 (1.5) 2.9 Recommend asthma review/monitoring 179 (33.5) 68 (12.7) 38.0 Counsel patient about risks of continuing medication
54 (10.1) 18 (3.4) 33.3
Correct coding error e.g. recode diagnosis as asthma resolved
52 (9.7) 50 (9.4) 96.2
Add message to screen re. monitoring asthma with beta-blocker/reason for beta-blocker
Beta-blocker restarted at patient request - 2 (0.4) - Reduce repeat authorisation to 0 to prompt monitoring
- 1 (0.2) -
Other action 22 (4.1) 1 (0.2) - Beta-blocker already stopped 1 (0.2) 8 (1.5) - Insufficient time to review 16 (3.0) 16 (3.0) - no action recommended 85 (15.9) 77 (14.8) - no action completed - 219 (42.0) - Unknown outcome - 56 (10.8) - Form lost - 1 (0. 2) - Total no. actions 800 794 46.0 *Action was completed in more cases than it was recommended
Patient Safety Research Portfolio: PINCER Trial 93
Pharmacists most commonly recommended:
• Reviewing beta-blocker prescribing in 280 (52.3%) patients; this recommendation
was accepted in 45.4% of these patients. These actions included stopping
betablockers (60 (11.2%) patients), changing non-selective beta-blockers to
bisoprolol (23 (4.3%) patients), weaning patients off betablockers (8 (1.5%)
patients) and agreeing to review the betablockers at the patient’s next routine
appointment (36 (6.7%) patients).
• That patients either have an asthma review (if overdue) or more frequent asthma
monitoring in 179 (33.5%) patients; this action was completed in 38% of these
patients.
• Counselling about the potential risks of continuing the beta-blocker, and what
action to take if problems occurred, in 54 (10.1%) patients; this action was
completed in 33.3% of these patients.
• Removing the diagnosis code for asthma (or recoding as asthma resolved) in 52
(9.7%) patients where the history of asthma was unconvincing; this action was
completed in 96.2% of these patients.
4.3.6.3 Outcome 3: Monitoring renal function and electrolytes in patients aged 75 years and older prescribed an angiotensin converting enzyme inhibitor or a loop diuretic long-term
Pharmacists recommended 9 different types of action for 509/561 (90.7%) patients
and that no action be taken for 47 (8.5%) patients. Actions were completed in 458
(81.6%) patients. Details of all actions recommended and completed are summarised
in Table 34 below.
Patient Safety Research Portfolio: PINCER Trial 94
Table 34. Actions recommended and completed by pharmacists for patients identified by Outcome 3
Actions Number (%) recommended
(n=561 patients)
Number (%) completed
(n=561 patients)
% recommended
actions completed
Arrange blood test 492 (88.5) 434 (78.2) 88.4 Add read codes (eg blood test) 58 (10.4) 54 (9.7) 87.7 Screen message to monitor bloods at an appropriate interval
8 (1.4) 10 (1.8) 93.1
Recommend medication review 2 (0.4) 1 (0.2) 50.0 Review diuretic prescription 2 (0.4) 3 (0.6) 150.0* Review monitoring arrangements 1 (0.2) 1 (0.2) 100.0 Obtain blood result from secondary care and read code
1 (0.2) 1 (0.2) 100.0
Discuss blood results with GP 1 (0.2) - - Contact clinic and request regular results via lablink
1 (0.2) - -
Diuretic stopped - 2 (0.4) - Letter sent to patient reminding them of need for regular blood results
- 1 (0.2)
Other action - 1 (0.2) No action recommended 47 (8.5) 46 (8.3) 97.8 No action completed - 46 (8.3) - Patient declined bloods - 7 (1.3) - Patient not contactable - 1 (0.2) - Unable to bleed and decided not to pursue further
- 1 (0.2) -
Unknown outcome - 4 (0.7) - Form lost - 2 (0.4) - Total number of actions 566 508 89.8 *Action was completed in more cases than it was recommended
Pharmacists most commonly recommended that:
• A blood test be arranged in 492 (88.5%) patients; this was completed in 88.4% of
these patients.
• Existing blood test results be Read coded in the electronic record in 58 (10.4%)
patients; this was completed in 87.7% of these patients
Patient Safety Research Portfolio: PINCER Trial 95
4.3.6.4 Outcome 4: Prescribing combined hormonal contraceptive preparations in women with a past medical history of venous or arterial thrombosis
Pharmacists recommended two different types of action for four patients and that no
action be taken for one of the five patients. Actions were completed in four patients.
Details of all actions recommended and completed are summarised in Table 35
below.
Table 35. Actions recommended and completed by pharmacists for patients identified by Outcome 4
Actions Number (%) recommended (n = 5 patients)
Number (%) completed
(n = 5 patients)
% recommended actions
completed Correct coding error 3 (60) 3 (60.0) 100.0 Stop COC 2 (40) 2 (40.0) 100.0 No action 1 (20) 1 (20.0) 100.0 Total number of actions 5 5 100.0
Pharmacists recommended that:
• The diagnosis of thrombosis be removed from 3 (60%) patients’ electronic
records where the diagnosis was unclear or had subsequently been found to be
incorrect; this action was completed in all these patients.
• The combined oral contraceptive be stopped in 2 (40%) patients; this action was
completed in both these patients.
4.3.6.5 Outcome 5: Monitoring full blood count and/or liver function tests in patients receiving methotrexate
Pharmacists recommended 13 different types of action for 131/181 (72.4%) patients
and that no action be taken for 50/181 (27.6%) patients. Actions were completed in
112 (61.9%) patients. Details of all actions recommended and completed are
summarised in Table 36 below.
Patient Safety Research Portfolio: PINCER Trial 96
Table 36. Actions recommended and completed by pharmacists for patients identified by Outcome 5
Actions Number (%) recommended
(n=181 patients)
Number (%) completed
(n=181 patients)
% recommended
actions completed
Arrange blood test 56 (30.9) 41 (22.7) 73.2 Add read codes e.g. blood test result 41 (22.7) 32 (17.7) 78.0 Obtain blood result from secondary care and read code 39 (21.5) 38 (21.0) 97.4
Contact clinic and request regular results via lablink or letter (correct GP code to allow lab linking)
28 (15.5) 22 (12.2) 78.6
Monitor exceptions with search template 25 (13.8) 25 (13.8) 100.0
Add screen message to monitor bloods at appropriate interval 19 (10.5) 21 (11.6) 110.5*
Review monitoring arrangements 11 (6.1) 12 (6.6) 109.1* Prescribe folic acid 4 (2.2) 4 (2.2) 100.0 Send letter to patient reminding of need for regular blood test 3 (1.7) 2 (1.1) 66.6
Stop methotrexate 2 (1.1) 3 (1.6) 150.0* Alter dose instructions for methotrexate 1 (0.6) 1 (0.6) 100.0
Recommend medication review 1 (0.6) - - Discuss blood results with GP 1 (0.6) - - Patient removed from practice list - 1 (0.6) - other action 3 (1.7) 1 (0.6) 33.3 Form lost 1 (0.6) 1 (0.6) - no action completed - 26 (14.4) - No action recommended 50 (27.6) 50 (27.6) - Unknown outcome - 5 (2.8) - Total number of actions 234 203 86.8 *Action was completed in more cases than it was recommended
Pharmacists most commonly recommended that:
• Blood tests be arranged in 56 (31.3%) patients; this action was completed in
73.2% of these patients
• Existing blood test results be Read coded on the electronic record in 41 (22.9%)
patients this action was completed in 78.0% of these patients.
• Blood test results be obtained from the specialist clinic monitoring 39 (21.8%) of
patients and read coded on their electronic record; this action was completed in
97.4% of these patients.
Patient Safety Research Portfolio: PINCER Trial 97
• The clinic responsible for laboratory monitoring of 28 (15.6%) patients be
requested to send the results via lab link or letter on a regular basis to the
practice; this recommendation was accepted in 78.6% of these patients.
• A search template be set up to identify patients who have not had their bloods
monitored within an appropriate interval in 25 (14%) patients; this action was
completed in all patients.
• A screen message be added to the electronic record of 19 (10.6) patients
reminding prescribers to monitor bloods at an appropriate interval; this action was
completed in all these patients, and an additional 2 patients.
4.3.6.6 Outcome 6: Monitoring INR in patients receiving warfarin
Pharmacists recommended 11 different types of action for 70/213 (32.9%) patients
and that no action be taken for 141 (66.5%) of 213 patients, and actions were
completed in 66 (31.0%) patients. Details of all actions recommended and completed
are summarised in Table 37 below.
Patient Safety Research Portfolio: PINCER Trial 98
Table 37. Actions recommended and completed by pharmacists for patients identified by Outcome 6
Actions Number (%) recommended
(n=213 patients)
Number (%) completed
(n=213 patients)
% recommended
actions completed
Obtain blood result from secondary care and read code
Add screen message to monitor bloods at an appropriate interval
1 (0.5) 2 (0.9) 200.0*
Record monitoring arrangements on medical record
1 (0.5) 6 (2.8) 600.0*
Ask patient to contact practice with INR result (Self monitoring)
1 (0.5) 1 (0.5) 100.0
Recommend medication review 1 (0.5) 1 (0.5) 100.0 other action 1 (0.5) 0 0 Warfarin already stopped 1 (0.5) - - no action completed - 8 (3.8) - No action recommended 143 (67.1) 141 (66.2) - Unknown outcome - 6 (2.8) - Total number of actions 126 123 97.6 *Action was completed in more cases than it was recommended
Pharmacists most commonly recommended that:
• Blood test results be obtained from the specialist clinic monitoring 28 (13.2%) of
patients and Read coded on their electronic record; this action was completed in
all these patients and one additional patient.
• Existing blood test results be Read coded on the electronic record in 24 (11.3%)
patients this action was completed in all these patients and one additional patient.
• The arrangements for monitoring 22 (10.4%) patients INR be confirmed and
recorded on the electronic record; this action was completed in all these patients
and one additional patient.
• The clinic responsible for monitoring 20 (9.4%) patients’ INR be requested to
send the results via lab link; this recommendation was accepted in 15 (75.0%) of
these patients
Patient Safety Research Portfolio: PINCER Trial 99
• Blood tests be arranged in 13 (6.1%) patients; this action was completed in
76.9% of these patients.
4.3.6.7 Outcome 7: Monitoring lithium levels in patients receiving lithium
Pharmacists recommended 8 different types of action for 70/99 (70.7%) patients and
that no action be taken for 29 (29.3%) patients. Actions were completed in 63
(63.6%) patients. Details of all actions recommended and completed are summarised
in Table 38 below.
Table 38. Actions recommended and completed by pharmacists for patients identified by Outcome 7
Actions Number (%) recommended (n=99 patients)
Number (%) completed
(n=98 patients)
% recommended
actions completed
Arrange blood test 46 (46.5) 40 (40.4) 87.0 Add read codes (e.g. blood test) 16 (16.2) 12 (12.1) 75.0 Obtain blood result from secondary care and read code
The total time spent assessing cases, making recommendations and changes was
732.6 hours (97.7 working days); equivalent to 2.7 working days per practice (based
on a standard NHS pharmacist contract of 7.5 hour days).
Pharmacists working in small practices (list size <2500) spent a median of 30
minutes on each case (IQR 15, 30) (max 120). The total time they spent assessing
cases, making recommendations and changes was 34.6 hrs (4.6 working days or 1.2
days per practice).
Pharmacists working in medium-sized practices (list size 2500-6000) spent a median
of 15 minutes on each case (IQR 10, 30) (max 180). The total time they spent
assessing cases, making recommendations and changes was 153.5 hrs (20.5
working days or 1.6 days per practice).
Pharmacists working in large practices (list size >6000) spent a median of 20 mins
on each case (IQR 10, 30) (max 150). The total time they spent assessing cases,
making recommendations and changes was 544.5 hrs (72.6 working days or 3.8
days per practice).
Patient Safety Research Portfolio: PINCER Trial 105
4.4 Discussion
The summary data have shown that pharmacists made a broad range of
recommendations in order to reduce the risk of harm to individual patients. Many of
these recommendations would have implications for the future management of these
patients, and in some cases, other patients within the practices.
4.4.1 Strengths and limitations
The summary data recorded by the pharmacists give us a broad overview of the
types of recommendations made by pharmacists for individual patients, the outcomes
of these recommendations and the time pharmacists spent on each case. This allows
us to assess how many of the recommendations made by pharmacists were
implemented in the practices at the individual patient level, and how much
pharmacist time was devoted to individual patient interventions. In addition, from this
data it is possible to predict which interventions are most likely to be accepted by
general practice staff.
The summary data do not, however, give us detail about the pharmacists’
recommendations and why they were made, or help us understand why some
recommendations were not accepted. Also, the data do not help us to understand
what role the pharmacists played in the practices when they were not working on
individual patient interventions. Given that the vast majority of pharmacist time
appears to have been spent in other duties, this is a significant limitation of the
summary data in terms of understanding the role of the pharmacist in the trial. A
detailed analysis of the pharmacist case record forms and general action forms
should provide greater understanding of the role of the pharmacist within the practice
and why some recommendations were not accepted.
It should be noted that there are small differences in numbers of patients identified in
the pharmacist reports and those included in the main trial analysis. This is partly due
to pharmacists not recording information on all patients identified by the computer
searches, and partly due to them sometimes including additional patients that they
had identified. In addition, in the main trial, the process of data cleaning removed
Patient Safety Research Portfolio: PINCER Trial 106
small numbers of patients (identified by the practice-level computer searches)
because they did not fit the outcome measure criteria.
4.4.2 Specificity of outcome measures for identifying patients at clinical risk of harm
Pharmacists judged that nearly three-quarters of the cases identified by the
electronic searches were at clinical risk of harm, suggesting that the outcome
measures may be a useful way of targeting pharmacists work to patients at a high
risk of harm from medicines management problems. However, the proportion of
patients considered at clinical risk of harm varied greatly between outcome measures
with 90% or more patients identified by Outcomes 1, 3, and 8 judged to be at clinical
risk, whilst less than a quarter of patients identified by Outcome 6 were judged to be
at clinical risk. However, the majority of these patients (114) were registered in one
practice which had a parallel recording system for patients’ INRs which was not
identified in the electronic searches. Therefore, excluding these data, 50 (50.5%) of
99 patients were considered to be at clinical risk by the pharmacists. Problems with
the compatibility of Outcome 9 with changes to clinical computer systems meant that
only one-third of patients identified were judged to be at clinical risk.
4.4.3 Pharmacists’ recommendations
Pharmacists made recommendations to improve medicines management in three-
quarters of the cases identified, and actions were completed in almost two-thirds of
the cases identified. The number of recommendations made per case varied, with
half of cases receiving only one recommendation. Where multiple recommendations
were made, these were often of the form “I recommend action A, but if this is not
suitable/accepted, then please consider action B”. This could be why the level of
acceptance for the pharmacists’ recommendations was comparatively low for
Outcome 2 (around one-third of recommendations were accepted).
Pharmacists recommended actions in more cases where they considered the patient
to be at clinical risk (87.8% of “at clinical risk cases” compared to 74.5% of all cases).
In addition, actions were completed in more cases where patients were considered to
be at clinical risk (73% of “at clinical risk cases” compared to 61.5% of all cases).
Patient Safety Research Portfolio: PINCER Trial 107
Pharmacists’ recommendations were targeted to the outcome measure being
addressed, although there were recommendations which overlapped and would be
applicable to a wide range of clinical situations. These include:
• Using screen alerts to highlight risky clinical situations such as a history of peptic
ulcer, or diagnosis of asthma.
• Ensuring important diagnoses are Read coded in the patients’ significant history
(these are then readily available to prescribers in the patients’ summary screen).
• Stopping high risk medications such as NSAIDs or betablockers. Or, where this
was not deemed clinically feasible, adding a prophylactic medication, increasing
the frequency of monitoring for adverse effects, or counselling patients about the
risks of continuing the medication and warning signs of adverse effects to monitor
for e.g. shortness of breath.
• Altering dose instructions for high risk medications.
• Removing incorrect diagnosis codes to avoid medications being inappropriately
withheld.
• Arranging blood tests for patients where tests are overdue.
• Read coding existing test results so they can be readily viewed on the electronic
clinical system.
• Setting up systems to ensure regular reporting of blood test results from
specialist monitoring clinics to GP practices (important where shared care
arrangements are in place). This could be via letter (requiring manual Read
coding) or by ensuring that results were sent via lab link (requiring specialist
clinics and laboratories to have the correct GP practice code recorded).
• Setting up monthly search templates to highlight patients where monitoring is
overdue, or using screen alerts to highlight appropriate monitoring intervals for
high risk medications.
• Confirming monitoring arrangements (and recording these on the electronic
clinical system) for patients managed under shared care agreements.
Many of these interventions were not predicted before the start of the study. Instead,
they developed from pharmacists’ experience of working with the GPs and learning
from each other. This highlights the importance of providing a forum where
pharmacists can learn from each other when engaging in new roles.
Patient Safety Research Portfolio: PINCER Trial 108
As might be predicted from the broad range of different recommendations made, the
time spent resolving problems in each case varied widely (from 0 to 180 minutes).
However, pharmacists reported spending a median of 20 minutes on each case. This
included the time needed to assess each case, make recommendations, and
implement any agreed changes. The median time spent on each case varied
depending on the outcome measure (from 10 minutes to 30 minutes) and practice list
size (30 minutes in small practices, 15 minutes in medium practices, and 20 minutes
in large practices).
The comparatively short duration of time required to assess and resolve medicines
management problems suggests that the PINCER trial pharmacist role could be
incorporated into existing primary care and general practice pharmacists’ roles. It is
important to remember, however, that in addition to the time spent working directly on
individual cases, pharmacists duties included organising and attending meetings,
liaising with practice staff, and reviewing systems of work. Therefore, the total
commitment of time required by a pharmacist to implement the intervention will be
greater than 3 days per practice.
Although Outcome 2 (beta-blockers in asthma) had the lowest percentage of
completed actions, it was the most time consuming of the outcome measures.
Pharmacists spent over 36 days reviewing 520 patients (median of 30 minutes per
patient), and made recommendations in four-fifths of these patients. In contrast, for
Outcome 3 (monitoring of renal function and electrolytes in patients prescribed ACE
inhibitors or diuretics) pharmacists spent 27 days reviewing 552 patients (median 15
minutes per patient) and recommended actions in nine-tenths of patients. In
Outcome 2, actions were completed in two fifths of patients, compared to four-fifths
of patients for Outcome 3. Numerically, in Outcome 2, these actions were equivalent
to two-thirds of the recommended actions, but only one-third of the recommended
actions were completed (the remainder included alternative actions or actions which
were accepted and would be completed in the future). In Outcome 3, over four-fifths
of the recommended actions were completed.
Before the study began, we predicted that Outcome 2 would be the most difficult for
pharmacists to address because of the complexity of assessing the cases and lack of
clear guidelines on how to manage patients (which reflects the inadequate
information available on the relative risks and benefits or using beta-blockers in
Patient Safety Research Portfolio: PINCER Trial 109
patients with a history of cardiovascular disease). This is reflected in the time taken
to review the cases and percentage of cases where actions were completed.
4.4.4 Further research
The summary data have given a broad overview of the pharmacists’ interventions in
the general practices. In order to fully understand the role of the pharmacist within
the practice, however, a further analysis of the detailed information recorded on
individual cases and on general action plans within practices is needed. In addition,
further information on the pharmacists’ role may be gleaned from the pharmacists’
diaries and interviews. A qualitative analysis of these data sources is likely to be
helpful in understanding why the pharmacist intervention has been successful in
reducing the numbers of patients at risk of medication errors.
Patient Safety Research Portfolio: PINCER Trial 110
5 Chapter 5: Qualitative evaluation of the PINCER trial
Patient Safety Research Portfolio: PINCER Trial 111
5.1 Introduction
A qualitative evaluation study was running parallel to the main RCT. The aim here
was to obtain a more detailed understanding of the trial interventions by focusing on
the experiences of key stakeholders. It is hoped that this will complement quantitative
findings and contribute to a more in-depth appreciation of the social and
organisational context in which the interventions are delivered.
5.1.1 Why qualitative evaluation?
Several contextual factors can influence effectiveness of complex RCTs which might
be neglected in examining numbers alone. Here, social and organisational aspects in
trial practices have to be considered in particular as they might be crucial in affecting
outcomes and in addressing issues of generalisability60.
The value of qualitative methods investigating experiences of key players, effects on
individuals and perceived feasibility are increasingly recognised in complementing
RCTs20, 61-67
A central component of qualitative evaluation of complex interventions is a focus on
the experiences of key stakeholders in aiding the interpretation of quantitative data.
These experiences also formed the basis for exploration in the current study
exploring issues of generalisability, acceptability and the trial’s potential for
widespread implementation.
Both positive and negative views of key stakeholders were actively sought in order to
gain a comprehensive insight into the trial interventions. Two waves of telephone
interviews (brief and in-depth) and multidisciplinary focus groups formed the core of
the study. These were conducted throughout the delivery period of the trial.
In outlining both method and results of the qualitative evaluation of the PINCER trial,
it is hoped that the potential of embedding longitudinal qualitative evaluations within
complex RCTs will become apparent to the reader. Several issues relating to both
the practicalities of conducting such studies (especially with regards to sampling and
data collection) as well as emerging issues from the viewpoints of those involved will
Patient Safety Research Portfolio: PINCER Trial 112
be discussed in detail. Furthermore, an attempt will be made to outline possible
solutions for refinement of the trial interventions and concrete recommendations for a
potential roll-out. The research will then be applied to the wider innovation literature.
5.1.2 The organisational context
The present study draws on principles from diffusion of innovations literature, which
provides a valuable conceptual framework of how innovations are adopted by
individuals over time and how they spread through organisations68, 69.
Research into the diffusion of innovations in healthcare is increasing but most
evidence is coming from industry or other service organisations. In particular, primary
care has received little attention, although it was identified as one of the key areas in
the NHS improvement plan70. Most existing research has focussed on adoption
behaviours of individual healthcare professionals (mostly General Practitioners).71
However, it has been argued that “implementation efforts focusing on the individual
physician with a single strategy are unlikely to be successful. Rather, implementation
efforts must use multiple strategies that take into account of multiple characteristics
of the guideline, practice organisation, and external environment” (p. 172)72.
Pharmacists’ routine employment in general practice as well as the utilization of the
full potential of information technology in the healthcare setting is yet to be
established. Therefore, the delivery of the PINCER trial interventions is likely to be
perceived as innovations by key stakeholders. Diffusion of innovation theory can
provide a theoretical background of how specific aspects of the interventions can
either facilitate of inhibit the success of the project, and how the results obtained from
the qualitative component of the trial can contribute to its widespread implementation
(if found to be successful). In particular, characteristics of the primary care
environment that make it more receptive to change can be examined in more detail.
Conversely, areas that need extra attention for diffusion to occur can be identified. If
the interventions are found to be ineffective, the results from the current study can be
used to design possible alternatives. Finally, the results may point towards more
general characteristics that facilitate the adoption of innovations within the primary
care context. The findings can then be utilised to help inform facilitators/barriers of
change in other innovations within the primary care context, which have yet to be
implemented.
Patient Safety Research Portfolio: PINCER Trial 113
The main components of the current study consisted of a combination of telephone
interviews and focus groups. The initial brief interviews aimed at identifying possible
early facilitators and/or barriers that may be important to take into account during the
future roll-out of the interventions. The in-depth telephone interviews were conducted
in order to generate an in-depth appreciation of the acceptability and effectiveness of
the interventions under study (especially from the views of trial pharmacists). The
focus groups explored potential roll-out, the refinement of the trial interventions,
alternative interventions and their acceptability.
5.2 Methods
In order to develop a suitably rounded understanding of the pertinent issues, at the
levels of individuals, processes and underlying theory, both negative and positive
views from all key stakeholders were sought.
Qualitative data was collected through one-to-one, audio-taped, semi-structured
telephone interviews and focus groups. Additional data was collected from four
pharmacist meetings facilitated by the research team, notes of practices meetings
made by pharmacists during the delivery of the intervention, and six pharmacist
diaries.
The initial phase of brief telephone interviews took place at the early stages of the
interventions, the in-depth interviews were conducted when the interventions were
well underway and the focus groups were conducted when the interventions had
been delivered.
Altogether, 20 interviews were conducted in the initial phase and 32 in the second
phase.
Interviews lasted between 7 and 60 minutes. Issues addressed in interviews included
general perceptions of prescribing safety in general practice, experiences and
opinions of the PINCER trial, expectations for the project, sustainability of the
interventions, and opinions on the potential roll-out of the intervention.
Six focus groups were conducted altogether lasting between 22 and 68 minutes. The
emphasis here was on the wider usability and the potential roll-out of the PINCER
Patient Safety Research Portfolio: PINCER Trial 114
trial exploring possible alternative interventions and associated models (including a
discussion of the strengths and limitations of each alternative approach).
Detailed interview schedules and focus group topic guides can be found in Appendix
7.
5.2.1 Participants
In order to obtain a sufficiently rounded understanding of the trial interventions and
possible early facilitators and barriers, a variety of key stake holders was purposively
sampled from both intervention sites (Nottingham and Manchester). These included
trial pharmacists (interviewed at three different time-points during the delivery of the
interventions), GPs, practice managers, nurses, administrative staff, PCT prescribing
leads, community pharmacists, and members of the research team* involved in
delivering the interventions.
Detailed participant information for each qualitative data collection phase can be
found in Table 43-Table 45.
* Please note: these consisted of researchers running the searches and liaising with practices
Patient Safety Research Portfolio: PINCER Trial 115
Table 43. Participant information brief interviews
Gender Intervention Arm Location Occupation
PharNottBi1 F Nottingham Pharmacist ManBi2 F Pharmacist Intervention Manchester Practice Manager ManBi3 M Pharmacist Intervention Manchester GP PharNottBi4 F Nottingham Pharmacist NottBi5 F Pharmacist Intervention Nottingham GP ManBi6 M Simple Feedback Manchester GP NottBi7 M Pharmacist Intervention Nottingham Practice Manager PharManBi8 F Manchester Pharmacist PharManBi9 M Manchester Pharmacist NottBi10 M Simple Feedback Nottingham GP NottBi11 F Simple Feedback Nottingham Practice Manager PharNottBi12 F Nottingham Pharmacist PharManBi13 F Manchester Pharmacist NottBi14 M Nottingham Prescribing Lead ManBi15 M Manchester Prescribing Lead NottBi16 F Simple Feedback Nottingham GP ManBi17 M Manchester Researcher NottBi18 M Nottingham Researcher NottBi19 M Pharmacist Intervention Nottingham GP ManBi20 F Simple Feedback Manchester Practice Manager
Patient Safety Research Portfolio: PINCER Trial 116
Table 44. Participant information in-depth interviews
Gender Intervention Arm
Location Occupation
PharManDI1 F Manchester Pharmacist PharManDI2 M Manchester Pharmacist PharNottDI3 F Nottingham Pharmacist PharNottDI4 F Nottingham Pharmacist PharNottDI5 F Nottingham Pharmacist PharManDI6 F Manchester Pharmacist CommPharmManPIDI7 M Manchester Community
Pharmacist PracManNottPIDI8 M Pharmacist
Intervention Nottingham Practice Manager
PractManManPIDI9 F Pharmacist Intervention
Manchester Practice Manager
NurNottPIDI10 F Pharmacist Intervention
Nottingham Practice Nurse
PractManNottSFDI11 M Simple Feedback Nottingham Practice Manager PractManManSFDI12 F Simple Feedback Manchester Practice Manager PractManNottSFDI13 M Simple Feedback Practice Manager PractManManPIDI14 F Pharmacist
Intervention Manchester Practice Manager
PractManNottPIDI15 F Pharmacist Intervention
Nottingham Practice Manager
PharManEIDI16 (Exit Interview)
F Manchester Pharmacist
GPManPIDI17 M Pharmacist Intervention
Manchester GP
GPNottPIDI18 F Pharmacist Intervention
Nottingham GP
GPNottSFDI19 M Simple Feedback Nottingham GP GPManSFDI20 M Simple Feedback Manchester GP NurManSFDI21 F Simple Feedback Manchester Practice Nurse GPManSFDI22 M Simple Feedback Manchester GP GPNottSFDI23 F Simple Feedback Nottingham GP PCTNottDI24 F Nottingham Prescribing lead CommPharmNottDI25 M Nottingham Community
Pharmacist PCTNottDI26 F Nottingham Prescribing lead PharNottEIDI27 (Exit Interview)
F Nottingham Pharmacist
PharManEIDI28 (Exit Interview)
F Manchester Pharmacist
PCTManDI29 M Manchester Prescribing lead PharManEIDI30 (Exit Interview)
M Manchester Pharmacist
PharNottEIDI31 (Exit Interview)
F Nottingham Pharmacist
PharNottEIDI32 (Exit Interview)
F Nottingham Pharmacist
Patient Safety Research Portfolio: PINCER Trial 117
Table 45. Participant information focus groups
Participants
Pharmacist Focus Group (3 from Nottingham, 1 from Manchester)
4 PINCER Trial pharmacists, 3 female and one male
Focus Group pharmacist intervention practice 1, Nottingham
7 participants: practice manager (f), assistant practice manager (f), 4 GPs (3m, 1f), 1 practice nurse (f)
Focus Group pharmacist intervention practice 2, Nottingham
6 participants: practice manager (f), 1 administrative staff (f), 1 practice nurse (f), 3 GPs (1m, 2f)
Focus Group simple feedback practice 1, Nottingham
6 participants: practice manager (f), F2 doctor (f), 2 GPs (1m, 1f), medical student (m), PINCER pharmacist (f)
Focus Group simple feedback practice 2, Nottingham
4 participants: practice manager (f), Deputy Medical Director/GP Nottinghamshire County Teaching PCT (m), 2 Data quality officers (f)
PCT focus group, Manchester 4 participants: Community Medical Advisor, Senior Medicines Management Individual, GP tutor, Member of the Local Pharmaceutical Committee/Community Pharmacist (all m)
PCT interview, Nottingham Senior Member of PCT (f)
5.2.2 Data analysis
Interviews and focus groups were transcribed verbatim. Broad themes and sub-
themes were identified employing thematic analysis using NVivo7 software to aid the
coding process73. Transcripts and notes were analysed one by one, creating themes
and sub-themes until no new themes emerged. This resulted in a general framework
capturing the essence of the data collected for each stage of data collection. Careful
attention was paid to the comparison and integration of different professional groups
and intervention arms. This was accomplished through outlining negative cases in
particular (i.e. those that do not fit well within the structure).
Credibility of the data and the analysis was enhanced by close involvement of the
extended research team, and the local principal investigator in particular. Results of
the brief interviews were fed back to pharmacists at a meeting and a second
qualitative researcher re-coded brief and in-depth interview transcripts and gave
thorough feedback on the report. This resulted in minor amendments.
Patient Safety Research Portfolio: PINCER Trial 118
Data obtained from different sources was triangulated in the analysis by paying
particular attention to comparing themes identified across different sources,
participants and geographical locations.
5.3 Findings and discussion
Diagrams of emerging results from different phases can be viewed in the Appendix 7.
In line with the aims of the qualitative evaluation, the main findings relate to
facilitators and barriers to the successful implementation of the interventions. The
second part of the results relates to the potential roll-out and possible alternatives.
The results are framed in a generally positive view of the trial amongst participants.
5.3.1 Facilitators, barriers and associated conditions
Altogether, a greater number of facilitators than barriers were identified, which may
be due to extensive development and piloting work on the intervention and
preparation by the research team.
5.3.1.1 Practice attitude
5.3.1.1.1 Willingness to learn
Practice staffs’ willingness to listen, learn and to accept change was identified as a
facilitator for the successful implementation of the trial.
“Oh yes, I don’t think it will make me feel, well it will make me feel good that
somebody’s pointing out to me that what am I doing is not right and I should be
really looking at, to ways and things so that we don’t commit the same mistakes
again.”
(GP, Simple feedback, Manchester, ManBi6)
Patient Safety Research Portfolio: PINCER Trial 119
GPs from both pharmacist intervention and simple feedback practices appeared
grateful that their mistakes were picked up on and expressed positive views towards
learning how to improve their practice as opposed to being defensive or threatened.
Willingness to learn as an individual facilitator for the adoption of innovations has
been identified in previous studies74, 75. However, QOF might to a certain degree
contribute to developing this as there are significant financial incentives. Willingness
to learn may also be explained in terms of what has been referred to as receptive
context76, 77. Receptive context can be divided into individual receptivity and
organisational receptivity, whereby the willingness to consider change contributes to
a higher degree of receptivity78.
5.3.1.1.2 Perceived value of the interventions, pharmacists and research in general
The trial was generally positively received by all involved. Participants referred most
frequently to the educational value of pharmacist intervention/simple feedback and
the trial’s potential to improve patient safety in this context.
The perceived value of research in general further reinforced this positive attitude in
practices.
This can be viewed in terms of what Rogers refers to as relative advantage and
compatibility79. Relative advantage, is the extent to which the innovation is seen as
better than current practice, fitting in well with interviewees’ perceived educational
value of the interventions. Compatibility, on the other hand, is the extent of
agreement between the innovation and individual (or organisational) values and
“(…) you find out something and we are doing it and know intentionally it will be a
good thing to know that, why we shouldn’t be doing that. (…) Yeah, well it will be
effective because you are flagging the patients out who’ve been prescribed
perhaps inappropriately or unintentionally the things they shouldn’t prescribe
where they can cause more complications to them. (…) What will I, will be
actually alert, you know, next time we prescribe other things (…)”
(GP, Simple feedback, Manchester, ManBi6)
Patient Safety Research Portfolio: PINCER Trial 120
beliefs. Patient safety is clearly an organisational priority, making the PINCER trial
interventions compatible.
In the healthcare setting, studies investigating the predictive power of these two
innovation attributes and adoption behaviour have been mixed80-82. Although some
studies have suggested that diffusion of innovations in healthcare is slow if it involves
acquiring new skills80, the PINCER trial clearly supports the view that adoption is
more influenced by the perceived benefits for patients (i.e. safety)81.
5.3.1.1.3 Perceived appropriateness of the trial’s design and outcome measures
Participants viewed the design of the trial and its outcome measures as appropriate.
Typical statements from interviews would include:
However, participants frequently mentioned issues with outcome number 2 (patients
with a computer recorded history of asthma receiving beta blockers). It was felt that
here risk assessments had to be made based on individual patient cases and that in
some instances GPs decided to continue the beta-blocker.
“I think that’s, then obviously [name of the principal investigator] has done his
homework and we realize that those areas you know, the nine most current ones
but there are different issues in terms of erm, prescribing safety that we see.”
(Pharmacist, Nottingham, NottBi14)
Patient Safety Research Portfolio: PINCER Trial 121
Similar issues were found with outcome number 1 (patients with a history of peptic
ulcer being prescribed NSAIDS).
The group of researchers implementing the PINCER trial may be viewed as what
Rogers describes as the change agency. It is the change agency’s aim to implement
the innovation into the organisation with a focus on the collective goals of the social
system (here to improve prescribing safety). Few studies have investigated the role
of the change agency in healthcare innovation and the current study adds to the
sparse evidence base in this area by pointing to the important role of individual
adopters’ trust in the change agency’s abilities in successful implementation of
healthcare innovation83, 84. There are also some implications surrounding the issue of
the potential roll-out of the interventions – if the change agency changes then so
might an individual’s perceptions of competency, possibly leading to reduced
adoption rates (assuming that the perceived competency of the change agency is a
strong facilitator).
5.3.1.1.4 Perceived value of pharmacists in primary care
It also became evident from participants’ accounts that the practice’s attitude towards
and appreciation of pharmacists’ was important.
“Outcome Measure 2- 10 patients identified
GPs felt it was difficult to comment without knowing the identity of the patients and
their history. The issue of risk/ benefit for patients with CHD was raised. Also
discussion around patients identified as having ‘history of asthma’ which may have
arisen when notes were summarised based on eg. a single prescription many years
ago for a salbutamol inhaler prescribed for a severe chest infection.” (From
pharmacist feedback sessions)
“Asthma/betablockers (measure 2) caused most conversation as always. Less
common ground here & some disagreements between Drs which will, I suspect,
lead to mixed success re patient changes.” (Pharmacist diary, Pharmacist 4)
Patient Safety Research Portfolio: PINCER Trial 122
This also involved taking an interest in the trial and the pharmacist's work. A lack of
thereof was often expressed in terms of “not being bothered”.
A lack of engagement often resulted in pharmacists chasing practice staff to get
things done such as filling in action plans. Pharmacist sometimes concluded that
practices were relatively happy for them to do the work, whilst wanting to have as
little as possible work.
Trial pharmacists may be viewed as change agents. According to Rogers, these are
individuals “who influence clients’ innovation decisions in a direction deemed
desirable by a change agency (p. 335)”79. The change agent (the pharmacist) is
typically enlisted by the change agency (the research team) to bring about the
desired changes. However, the role of the change agent in healthcare innovations
has been poorly researched. Our study supports Roger’s notion of the importance of
the change agent’s credibility, the importance of the approach and the extent to
which the change agent works through opinion leaders (discussed below). We have
Pharm 1: Well especially when you’ve spent an awful long time looking at perhaps an
hour at a patient for, you know, an asthma Beta-blocker and you’ve gone through
those notes
Pharm 3: And they’ve said I’m not changing it.
Pharm 2: God yes, when they say I’m not changing it.
Pharm 1: I know, I could chew on a bone with that answer, I really could.
(Pharmacist facilitated meeting 9 October 2007)
”In my last few weeks in the practice the senior Practice Nurse has on several
occasions expressed her gratitude for the changes she feels I have made in the
practice. For her personally she feels she has learnt an enormous amount about
monitoring and I can sense that she knows “where the patients are at” in terms of
their monitoring” (Pharmacist diary, Pharmacist 2)
Versus
“The Practice Manager is really rude, has made it quite clear that it is an
inconvenience to have me there.” (Pharmacist diary, Pharmacist 1)
Patient Safety Research Portfolio: PINCER Trial 123
found that the perceived value of the change agent’s role and the perceived
competencies can be an important facilitator for adoption. This is in line with the
increasing recognition that pharmacists can make a valuable contribution to the
healthcare team85. Having made these points, it could be argued that the
effectiveness of the pharmacist intervention in our study had relatively little to do with
their role as change agents, and more to do with the practical support they provided.
5.3.1.1.5 GPs’ attitudes
Although most pharmacists reported that GPs had been receptive, some pharmacists
had experienced issues with GPs, which resulted in increased feelings of frustration
and isolation.
Attitudes of GPs were referred to by participants relatively regularly, as a barrier to
the success of the interventions. For example, in some instances there appeared to
be a certain reluctance to change old practices and defensiveness to pharmacists’
suggestions. There was also often a lack of interest by the GPs for the trial.
However, the biggest and most frequently mentioned issue for pharmacists appeared
to be that it was extremely difficult to get GPs to action and return forms issued by
the pharmacist. This was in line with the often generally sparse contact between GPs
and pharmacists due to GPs’ extremely busy work schedule.
“I think the biggest concern from my point of view (…) is that it’s difficult to
manage your time always because you’re constantly dependent on other people’s
actions really. You’re constantly waiting for GPs to review them, you know, people
go on holiday, forget etc.” (Pharmacist, Manchester, PharManDI2)
“Erm, one GP was a bit defensive in the feedback meeting, you know, he sort of
had quite a lot of excuses for things that didn’t really sound very plausible and
when I actually looked into patient records, you know, it wasn’t the reasons he
was giving at all. I think he was just, you know, saying the first thing that came
into his mind in a sort of defensive way, you know, rather than thinking about the
real reasons. Or, you know, just accepting that there were other reasons.”
(Pharmacist, Manchester, PharManDI1)
Patient Safety Research Portfolio: PINCER Trial 124
GPs, in line with previous studies, may be viewed as opinion leaders86. According to
innovation theory, the role of opinion leaders is crucial for the adoption of innovations
locally as their apprehensiveness to change this is likely to influence other potential
adopters86-88.
Although Rogers has argued that ideally the change agent should harness the
influence of opinion leaders, the nature of this relationship remains under-
researched79. In the current study, the pharmacist as the change agent has the
potential to influence opinion leaders, which makes a good relationship between the
two essential for change to occur. If this is not the case and this relationship is
characterised by infrequent contact, power struggles, or the opinion leader’s
resistance to the change agent’s efforts to implement what has been initiated by the
change agency, then the diffusion of the innovation can be inhibited.
5.3.1.2 Other practice context issues/characteristics important in pharmacist intervention practices
5.3.1.2.1 Practice’s previous involvement with pharmacists
Practices’ previous involvement with pharmacists was important for the successful
implementation of pharmacist intervention. This often led to a realisation of how
helpful pharmacists could be in improving prescribing safety.
In line with this, the amount of information individual adopters have about the
innovation has been found to be crucial in facilitating adoption, especially during
Roger’s pre-adoption and early use stage89, 90.
“Yes we’ve, with, our PCT has provided some pharmacy support and we’ve found
that very helpful, they do educational meetings, erm, I think three a year, erm, and
we had a pharmacist coming in and looking at one or two aspects of our
prescribing. And that’s always been very helpful, particularly if they’re highlighting
patients where they’ve come across potential difficult to find interactions or
Patient Safety Research Portfolio: PINCER Trial 159
Table 48 expresses the total numbers of patients at risk of an error, as a proportion
of all registered patients at baseline (i.e. 1 April 2007). We also detail the numbers of
patients with a recorded medication error (numerator) as a proportion of at risk
patient in both the QRESEARCH database and the PINCER dataset. This reveals
broadly comparable overall findings between these datasets.
The proportions of patients on warfarin (and therefore being at risk of not having INR
recorded) was similar in QRESEARCH and PINCER: 1% (n=27783) in QRESEARCH
and 1% (n=3183) in PINCER. The proportion of patients with this recorded
monitoring error varied widely between practices in QRESEARCH, from 0-100%,
reaching 11,896 (42.8%) in the total sample. After removing practices with more
than 60% non-recording of INR, the proportion of patients at risk was 1.1%
(16280/1460170) and the proportion of errors was 8.4% (1368/16280).
Table 48. QRESEARCH and PINCER total numbers for at risk and patients with records of errors
QRESEARCH PINCER Outcome Measure Total number of patients at risk (% of total N of
patients of 2779781)
Total number of patients with errors
(% of patients at risk of the
measure)
Total number of patients at risk (% of total N of
patients of 381561)
Total number of patients
with errors (% of patients at
risk of the measure)
1 Peptic ulcer w/o PPI & NSAID
30204 (1.1) 1182 (3.9) 3798 (1.0) 180 (4.7)
2 Asthma & beta-blockers
324778 (11.7) 8130 (2.5) 39540 (10.4) 1165 (2.9)
3 ACE/ diuretics & lab test
79496 (2.9) 8461 (10.6) 9071 (2.4) 1032 (11.4)
4 Arterial or venous thromboembolism & combined oral contraceptives
27225 (1.0) 223 (0.8) 4872 (1.3) 21 (0.4)
5a Methotrexate & FBC
6424 (0.2) 1435 (22.3) 966 (0.3) 373 (38.6)
5b Methotrexate & LFT
6424 (0.2) 1495 (23.3) 966 (0.3) 357 (37)
7 Lithium & Lithium levels
3245 (0.1) 985 (30.4) 419 (0.1) 199 (47.5)
8 Amiodarone & TFT
4613 (0.2) 2114 (45.8) 493 (0.1) 241 (48.9)
Table 49 shows the median (and IQR) proportions of patients in a practice being at
risk of the errors of interest and the median proportions (and IQR) of patients
Patient Safety Research Portfolio: PINCER Trial 160
experiencing these errors in both the QRESEARCH database and PINCER dataset
at the baseline assessment point. The highest risk of prescribing error was in
patients with asthma: median proportion of patients at risk in a practice was 11.4%
(IQR 10.0-13.1%). The highest risk of monitoring error was in patients aged ≥75
years that were on ACE inhibitors or loop diuretics.
Table 49. QRESEARCH and PINCER median (IQR) proportions of patients at risk in a practice and proportion of patients with records of errors among patients at risk
QRESEARCH PINCER Outcome Measure Proportion of
patients at risk Proportion of
errors in patients at risk
Proportion of patients at risk
Proportion of errors in
patients at risk 1 Peptic ulcer w/o
PPI & NSAID 1.01
(0.73-1.4) 3.45
(1.52-5.71) 1.00
(0.79-1.15) 4.46
(1.6-7.17) 2 Asthma & beta-
blockers 11.39
(9.97-13.13) 2.42
(1.75-3.13) 10.02
(8.81-11.44) 2.88
(2.07-3.54) 3 ACE/ diuretics &
lab test 3
(2.01-3.65) 9.21
(5.16-14.29) 2.31
(1.79-2.74) 11.02
(5.88-18.0) 4 Arterial or venous
thromboembolism & combined oral contraceptives
0.96 (0.71-1.2)
0 (0-0)
1.22 (1.00-1.41)
0 (0-0)
5a Methotrexate & FBC
0.23 (0.15-0.31)
16.7 (3.45-46.7)
0.24 (0.19-0.29)
34.17 (17.78-55.95)
5b Methotrexate & LFT
0.23 (0.15-0.31)
20 (4.55-46.7)
0.24 (0.19-0.29)
33.33 (14.17-50)
6 Warfarin & INR* 1.15 (0.88-1.39)
4.00 (1.17-12.5)
0.98 (0.74-1.14)
5.80 (2.02-11.63)
7 Lithium & Li levels
0.11 (0.06-0.16)
28.57 (12.5-46.61)
0.08 (0.05-0.14)
50 (7.85-72.92)
8 Amiodarone & TFT
0.15 (0.1-0.21)
50 (30-66.67)
0.13 (0.06-0.19)
50 (28.78-75.0)
*Practices with >60% patients with INR not recorded excluded (these practices were excluded in the PINCER trial because they were known not to routinely record INR on their clinical computer system)
Table 50 shows the total number of cases judged to be at clinical risk by outcome
measure in QRESEARCH practices compared with the practices in the PINCER trial.
The distributions of risk in PINCER and QRESEARCH appear similar, but only after
removing warfarin/INR errors.
Patient Safety Research Portfolio: PINCER Trial 161
Table 50. Number (%) of identified cases in QRESEARCH and PINCER practices
Measure QRESEARCH PINCER* All errors excluding warfarin & INR (%)
Total cases identified 24025 (100)# 3568 (100)# 1 Peptic ulcer w/o PPI &
NSAID 1182 (4.9) 180 (5.0)
2 Asthma & beta-blockers
8130 (33.8) 1165 (32.7)
3 ACE/ diuretics & lab test
8461 (35.2) 1032 (28.9)
4 AT/VN & combined oral contraceptives
223 (0.9) 21 (0.6)
5a Methotrexate & FBC 1435 (6.0) 373 (10.5) 5b Methotrexate & LFT 1495 (6.2) 357 (10) 7 Lithium & Li levels 985 (4.1) 199 (5.6) 8 Amiodarone & TFT 2114 (8.8) 241 (6.8) *Total number in PINCER does not include patients with dosage errors #Total number of cases does not include monitoring warfarin/INR errors
6.3.3 Prevalence of the outcome measures and changes over the study period
6.3.3.1 Summary
Table 51 shows the changes in proportion of errors in patients at risk on all the
outcome measures. For prescribing problems (i.e. outcome measures 1,2 and 4),
there was no overall trend over the study period: error rates remained similar for
Outcome 1, but decreased for Outcomes 2 and 4. For monitoring problems (i.e.
Outcomes 3, 5a, 5b, 6, 7 and 8), there was a consistent and significant decrease
almost for all outcome measures over the study period, apart from the lithium
outcome measure where there was a significant increase. The detailed analysis
below includes the distribution of median proportions of errors in practices and
changes between 1st January 2006 and 1st January 2009.
Patient Safety Research Portfolio: PINCER Trial 162
Table 51. Median and IQR for proportion (%) of errors in patients in risk at baseline (i.e. 1st April 2007) and the six-month (i.e. 1st January 2008) and 12-month (i.e. 1st July 2008) assessment points
Median and IQR for proportion of errors in patients in risk
Outcome measure
1st April 2007 1st January 2008 1st July 2008 1 Peptic ulcer w/o PPI
& NSAID 3.45
(1.52-5.71) 3.33
(1.25-5.56) 3.17
(1.25-5.41) 2 Asthma & beta-
blockers 2.42
(1.75-3.13) 2.53*
(1.84-3.29) 2.63 *
(1.92-3.46) 3 ACE/ diuretics & U&E
test 9.21
(5.16-14.29) 7.54 *
(4.17-12.55) 6.53 *
(3.77-10.62) 2a Asthma w/o CHD &
beta blockers 1.55
(1.11-2.17) 1.63 *
(1.14-2.2) 1.67 *
(1.23-2.34) 4 AT/VN & combined
oral contraceptives 0
(0-0) 0
(0-0) 0
(0-0) 5a Methotrexate & FBC 16.67
(3.45-46.67) 13.33 *
(2.38-33.33) 12.83 * (0-30)
5b Methotrexate & LFT 20 (4.55-46.67)
14.29 * (4.08-37.98)
13.64 * (0-33.33)
6 Warfarin & INR# 4.0 (1.17-12.5)
3.85* (1.20-10.9)
3.21* (1.02-12.0)
7 Lithium & Li levels 28.57 (12.5-46.61)
34.58 * (18.18-50)
44.44 * (25-60)
8 Amiodarone & TFT 50 (30-66.67)
33.33 * (20-50)
33.33 * (16.67-50)
C1a At least 1 prescribing problem
2.45 (1.84-3.1)
2.56 * (1.94-3.22)
2.62 * (2-3.37)
C2a At least 1 monitoring problem#
12.44 (7.82-19.01)
10.48 * (7.08-16.31)
9.81 * (6.41-15.19)
C1b At least 2 prescribing problems
0 (0-0)
0 (0-0)
0 (0-0)
C2b At least 2 monitoring problems#
0 (0-3.64)
0 * (0-2.27)
0 * (0-1.18)
*Wilcoxon test of comparison with the baseline, p-value<0.005 # Practices with >60% patients with INR not recorded excluded
6.3.3.1.1 Outcome 1: Patients with a history of peptic ulcer prescribed an NSAID without a PPI
The median percentage of patients with a history of peptic ulcer with a prescription of
proton-pump inhibitors in the previous six-months was 1.0% (IQR 0.7-1.4%) at
baseline. Out of the patients at risk, there was a median of 3.4% (IQR, 1.5-5.7%)
patients who had at least one prescription of a NSAID. Figure 5 shows the
distribution of such errors in QRESEARCH practices.
Patient Safety Research Portfolio: PINCER Trial 163
Figure 5. Percentage of patients prescribed NSAIDs out of patients with history of peptic ulcer without PPI by number of general practices
050
100
150
200
Freq
uenc
y
0 10 20 30 40 50Percentage of patients who had the error
out of patients with history of peptic ulcer without PPIPercentage of patients prescribed NSAIDs
Similar histograms are available for each of the outcome measures of interest, but
have not, with the exception of the INR/warfarin outcome (Figure 14) been included
in this report in the interests of space. Figure 6 shows changes in those at risk of
experiencing an error in relation to NSAID prescribing and those actually
experiencing such an error. Although there was a slight decrease over the study
period, the comparison of key time points (i.e. 1st April 2007, 1st January 2008 and
1st July 2008) did not show significant difference (Wilcoxon test for 1st April 2007
and 1st July 2008 was 0.80, P-value 0.42). Similar graphs are available for each of
the other outcome measures of interest, but these have not been included in this
report in the interests of space.
Patient Safety Research Portfolio: PINCER Trial 164
Figure 6. Changes in proportion of patients prescribed NSAIDs out of patients with history of peptic ulcer without PPI
0
1
2
3
4
perc
enta
ge
Jan06 Jan07 Jan08 Jan09
Median proportion of patientsin a practice at risk of the error (denominator)in a practice with the error (numerator)with the error in patients at risk of the error (outcome measure)
6.3.3.1.11 Outcome C1a: Proportion of patients with at least 1 prescribing problem (i.e. Outcomes 1, 2 and 4) among patients at risk of 1 prescribing problem
The median proportion of patients with at least 1 prescribing problem, in those “at
risk”, in a general practice was 13.3% (IQR 11.7-15.1%) on 1st April 2007. Out of the
patients at risk there were median 2.5% (IQR 1.8-3.1%) who had at least one
prescribing problem. Figure 18 compares the rates of these errors in the two
PINCER arms with those in the QRESEARCH practices at the three assessment
points i.e. baseline, six-months and 12-months.
Patient Safety Research Portfolio: PINCER Trial 176
Figure 18. Comparison of Composite Outcome 1a (i.e. Outcomes 1, 2 and 4) in the two PINCER trial arms and QRESEARCH practices at baseline, six-months and 12-months
6.3.3.1.12 Outcome C2a: Proportion of patients with at least one monitoring problem (i.e. Outcomes 3, 5 (a or b), 6, 7 and 8) among patients at risk of one monitoring problem
The median proportion of patients with at least one monitoring problem, in those “at
risk” in a general practice was 4.5% (IQR 3.6-5.3%) on 1st April 2007 (after removing
practices where the proportion of warfarin users without INR recording was more
than 60%). Out of the patients at risk there were median 12.4% (IQR 7.8-19.0%)
who had at least one monitoring problem. Figure 19 compares the rates of these
errors in the two PINCER arms with those in the QRESEARCH practices at the three
assessment points i.e. baseline, six-months and 12-months.
Patient Safety Research Portfolio: PINCER Trial 177
Figure 19. Comparison of Composite Outcome 2a (i.e. Outcomes 3, 5 (a or b), 6, 7 and 8) in the two PINCER trial arms and QRESEARCH practices at baseline, six-months and 12-months
6.3.3.1.13 Outcome C1b: Proportion of patients with at least two prescribing problems (i.e. Outcomes 1, 2 and 4) among patients at risk of two prescribing problems
The median proportion of patients with at least two prescribing problems in a general
practice was 0.3% (IQR, 0.2% to 0.4%) on 1st April 2007. There were only 7 (1.6%)
practices that had 1 patient with at least 2 prescribing problems.
6.3.3.1.14 Outcome C2b: Proportion of patients with at least two monitoring problems (i.e. Outcomes 3, 5 (a or b), 6, 7 and 8) among patients at risk of two monitoring problems
The median proportion of patients with at least two monitoring problems in a general
practice was 0.45% (IQR 0.32-0.58%) on 1st April 2007 (after removing practices
where the proportion of warfarin users without INR check was more than 60%). Out
of the patients at risk there was a median 0% (IQR 0-3.6%) that had at least two
monitoring problems.
Patient Safety Research Portfolio: PINCER Trial 178
6.3.3.1.15 Summary table
Table 52 summarises the comparison of the rates of errors in the two PINCER trial
arms with the findings in the QRESEARCH practices at the three assessment points
i.e. baseline, six-months and 12-months for the range of outcome measures of
interest (see Table 52).
Patient Safety Research Portfolio: PINCER Trial 179
Table 52. Comparison of rates of errors for all Outcomes in the two PINCER trial arms and QRESEARCH practices at the at baseline, six-months and 12-months
Assessment Point
Outcome Measure Group Baseline 6 Months
12-months
S 4.7 4.3 3.8 P 4.8 2.8 3.3
1 Patients with a history of peptic ulcer who have been prescribed a NSAID without a PPI (%) Q 3.5 3.3 3.2
S 3.0 3.0 2.9 P 2.8 2.5 2.6
2 Patients with asthma who have been prescribed a beta-blocker (%)
Q 2.4 2.5 2.6 S 10.2 8.2 7.8 P 12.6 5.3 5.8
3 Patients aged ≥75 years prescribed an ACE inhibitor or a loop diuretic long-term without a check of their renal function and electrolytes in the previous 15 months (%) Q 9.2 7.5 6.5
S 1.9 1.8 1.9 P 1.9 1.6 1.6
2a Patients with asthma who did not have CHD who have been prescribed a beta-blocker (%) Q 1.6 1.6 1.7
S 0.6 0.3 0.5 P 0.2 0.1 0.2
4 Women with a past medical history of thrombosis who have been prescribed the combined oral contraceptive pill (%) Q 0 0 0
S 41.8 31.3 35.1 P 35.4 24.7 24.5
5a Patients receiving methotrexate for at least three months who have not had a recorded full blood count within the previous three months (%) Q 16.7 13.3 12.8
S 38.1 29.7 33.7 P 35.8 24.5 25.2
5b Patients receiving methotrexate for at least three months who have not had a recorded liver function test within the previous three months (%) Q 20.0 14.3 13.6
S 6.6 4.8 3.9 P 5.8 3.0 4.1
6 Patients receiving warfarin for at least three months who have not had a recorded check of their INR within the previous 12 weeks (%) Q 4.0 3.9 3.2
S 45.1 39.8 41.3 P 50.0 35.3 31.8
7 Patients receiving lithium for at least three months who have not had a recorded check of their lithium levels within the previous three months (%) Q 28.6 34.6 44.4
S 51.4 45.1 37.3 P 46.3 33.5 34.3
8 Patients receiving amiodarone for at least six-months who have not had a thyroid function test within the previous six-months (%) Q 50.0 33.3 33.3
S 3.0 2.9 2.8 P 2.8 2.3 2.4
C1a Patients with at least one prescribing problem (%)
Q 2.5 2.6 2.6 S 15.0 11.7 11.3 P 16.0 8.4 8.8
C2a Patients with at least one monitoring problem (%)
Patient Safety Research Portfolio: PINCER Trial 180
6.4 Discussion
6.4.1 Main findings
Undertaking this additional analysis using the QRESEARCH database has been
important for two main reasons. First, it has demonstrated that the baseline
characteristics and error rates in the 72 PINCER practices were broadly comparable
to those found in practices throughout the UK. We are thus confident that the errors
we chose to focus on are problems facing most general practices; the practices that
enrolled into the study were not therefore peculiar in this respect. This observation
suggests that the external validity of our findings is likely to be high (this also being
suggested by our qualitative data). Second, we have found that there appears to be
some overall improvement in monitoring error rates (with the exception of Outcome
7), but not prescribing errors, as a result of secular trends and that any reductions in
monitoring errors seen in the simple feedback arm are therefore likely, to a large
extent, to be explained by this phenomenon rather than by the simple feedback
intervention per se. This work therefore provides additional – albeit indirect –
evidence on the effectiveness of the pharmacist-led IT-based intervention when
compared to the simple feedback intervention.
6.4.2 Strengths and limitations
Our work has several strengths; most notably the attempt to interpret the trial results
in the context of assessing secular trends. Our analyses demonstrate that
QRESEARCH and PINCER practices were comparable in many key respects
thereby offering some reassurance about the likely generalisability of these findings.
This analysis of the QRESEARCH database is substantially larger and has greater
statistical power than most previous studies on prescribing errors in general practice.
It should also be noted that this work is based on computer-recorded prescribing and
monitoring data collected prospectively and any bias from misclassification is unlikely
because the level of accuracy and completeness on medical records in general
practices has been shown to be high145.
Nevertheless, there are limitations. As one might expect with a database analysis,
not all patients fulfilling the criteria for being numerators in the outcome measures will
Patient Safety Research Portfolio: PINCER Trial 181
have been subject to a medication error. For example, for the prescribing errors, it is
possible that in some cases there was a justification for what appears to be
hazardous prescribing, or that miscoding may have been the underlying issue. In the
case of the monitoring errors, lack of recording of blood test results will have resulted
in spuriously high proportions of at risk patients appearing to be subject to an error.
Given that we selected only practices with electronic links to local laboratories, this is
unlikely to have had a major impact for outcome measures where GPs take the main
responsibility for monitoring. For medications where there are shared care
arrangements with secondary care, or where GPs have stand-alone systems for
recording INR results, it is likely that there were spuriously high proportions of
monitoring “errors” in some practices. In these cases, patients may have had
monitoring done, but the results may not have been recorded on the general practice
EMIS computer system. The medications potentially most affected by these issues
are methotrexate, warfarin, lithium and possibly amiodarone. It is also important to
emphasise that direct comparisons between PINCER and QRESEARCH practices
was not possible because the QRESEARCH practices were a (large) convenience
sample that was not randomly selected.
Patient Safety Research Portfolio: PINCER Trial 182
7 Chapter 7: General discussion
Patient Safety Research Portfolio: PINCER Trial 183
7.1 What do the findings tell us?
The PINCER trial and related studies have shown that:
• A complex pharmacist led IT-based intervention is effective at reducing the
prevalence of patients at risk from prescribing and monitoring errors.
• The pharmacist-led intervention has a 95% probability of being considered cost-
effective if the decision-makers ceiling willingness to pay reaches £75 (6 months)
or £85 (12 months) per error avoided.
• The trial pharmacists judged that over 70% of patients identified by the outcome
measures were at clinical risk (over 80% for the primary outcome measures).
• A number of factors are likely to have contributed to the success of the trial,
including involvement of key individuals in the practice, support for pharmacists in
their roles and support from PCTs.
• Our large parallel GP database study helped in interpretation of trial findings in
two main ways: first, we were able to demonstrate that the errors we focused on
are being replicated in practices throughout England; and second, we were able
to demonstrate that the improvements in monitoring outcomes achieved in the
simple feedback (control) arm may have been the result of secular trends.
In the rest of this section we discuss the effectiveness of the pharmacist-led
intervention.
The levels of reduction of risk for the pharmacist intervention arm compared with the
simple feedback arm (as represented by odds ratios) were appreciable at six-months
follow-up for the three primary outcome measures and also for the secondary
outcome measures. The differences were most marked for Outcomes 1 and 3 and
the composite monitoring outcome measure (Outcomes 3, 5, 6, 7 and 8): reduction in
odds of each outcome of 42%, 49% and 44% respectively. These reductions were
less marked for Outcome 2 and the composite prescribing outcome measure (i.e.
Outcomes 1, 2 and 4): reduction in odds of each outcome of 27% and 29%
respectively.
Patient Safety Research Portfolio: PINCER Trial 184
It is likely that one of the reasons for the differences seen in the monitoring outcome
measures was due to it being relatively straightforward for pharmacists to arrange for
patients to have relevant blood tests. For example, for Outcome 3 (monitoring
patients aged 75 years and older on ACE inhibitors and loop diuretics) almost 90% of
recommendations to arrange blood test were completed (see Table 34).
Nevertheless, it would also have been reasonably easy for practices in the simple
feedback arm of the trial to arrange blood tests for patients at risk. Although the
practices in this arm appear to have had reductions in patients at risk of monitoring
errors over time, these trends were largely mirrored in the QRESEARCH practices
that had no involvement in the trial. Therefore, it would seem that any changes noted
in the simple feedback arm of the trial were more likely to be associated with secular
trends towards better blood test monitoring rather than due to the intervention itself.
This suggests that in the context of our trial, simple feedback to practices had little or
no impact on improving prescribing safety. This is not surprising given the results
from previous studies of feedback to clinicians33 and indicates that a more active
intervention, such as the one used in the PINCER trial, is required.
The size of the differences found in proportions of patients at risk of receiving
NSAIDs without PPI cover in patients with a history of peptic ulcer were probably due
to a number of factors. Firstly, there is little justification for prescribing in these
circumstances. Secondly, the solutions are relatively straightforward and include the
prescription of a PPI to reduce the risk of bleeding associated with the NSAID, or
trying a different type of analgesic. The fact that trial pharmacists reported that nearly
80% of their recommendations were completed in relation to this outcome measure
(see Table 32) supports the idea that dealing with these patients was relatively non-
contentious and straightforward. For example, 73% of recommendations to stop an
NSAID were completed (see Table 32). At 12-months post-intervention, however,
the pharmacist-led intervention was no longer effective. This suggests that practices
would have either have:
• Restarted patients on NSAIDs (where these had been stopped as a result of the
intervention)
• Not continued with the PPI cover for patients on NSAIDs (where PPIs had been
started as a result of the intervention), or
Patient Safety Research Portfolio: PINCER Trial 185
• Started prescribing NSAIDs without PPI cover to patients with a history of peptic
ulcer who were not being prescribed NSAIDs at the baseline data collection.
Whatever the reason, it suggests that there was dropping off in the effectiveness of
the pharmacist-led intervention. Therefore, it cannot be assumed that the
intervention, as it stands, would result in long-term reductions in patients at risk from
this medication error.
The smaller reductions in proportions of patients with asthma being prescribed beta-
blockers are probably explained by this being a more challenging problem for
pharmacists to deal with. While the pharmacists judged that over 80% of these
patients were at clinical risk, their recommended actions were completed in only 46%
of cases (see Table 33). In particular, recommendations to stop a beta-blocker were
completed in only 21% of cases (see Table 33).
Possible reasons why GPs were less inclined to address recommendations in
relation to this outcome measure include:
• Scepticism over whether the patient was at risk from the beta-blocker (for
example in terms of the patient having relatively mild asthma and not currently
being affected adversely by the beta-blocker)
• The patient being on the beta-blocker for a clinically important indication
• Difficulty in finding an alternative to the beta-blocker
In order to investigate the possibility that the patient was on beta-blockers for an
important clinical indication (i.e. the second bullet above), when we excluded patients
with coronary heart disease from this outcome measure, the differences between the
intervention arms were no longer statistically significant at six-months post-
intervention (see Table 6). This may be because the proportions of patients being
prescribed beta-blockers in this group were smaller at baseline (see Table 4). Also,
we did not exclude other patients, such as those with heart failure, where the benefits
of beta-blockers may outweigh the risks.
Nevertheless, despite the various factors limiting the size of change seen for this
outcome measure, a statistically significant difference between the intervention
groups was still noted at 12-months post-intervention. This suggests that the
Patient Safety Research Portfolio: PINCER Trial 186
pharmacist intervention general practices manage to maintain some of the changes
that had been introduced such as stopping the prescribing of beta-blockers to a small
proportion of patients with asthma.
Overall, while the findings of the study show that the pharmacist-led intervention was
effective at reducing the prevalence of patients at risk from certain prescribing and
monitoring errors compared with simple feedback, the size and duration of the effect
will be influenced by a number of factors. These may include the perceived clinical
importance of different outcome measures, the ease with which changes can be
made, and whether or not mechanisms are in place for maintaining these changes.
On the basis of our findings for Outcome 1 (i.e. prescription of NSAIDs to patients
with a history of peptic ulcer and no PPI cover), our findings indicate that it cannot be
assumed that a once-off pharmacist-led intervention will lead to long-term changes to
the prevalence of medication errors.
Also, it needs to be acknowledged that our study deliberately focused on potential
medication errors rather than adverse events and therefore we cannot be certain that
the pharmacist-led intervention will lead to a reduction in patient-harm. Nevertheless,
a strong argument can be made for focusing on the measurement of errors rather
than adverse events when assessing the quality of clinical practice, as the former
relate most closely to actions that are within the control of healthcare
professionals146. Further information on the potential of the pharmacist-led
intervention to reduce patient morbidity will be available from a modelling economic
analysis (based on the trial findings in conjunction with literature on links between
hazardous prescribing/inadequate medication monitoring and the costs of associated
patient morbidity).
7.2 What made the pharmacist-led intervention effective?
Shortly before applying for funding for the PINCER trial, we conducted a systematic
review and meta-analysis which showed some evidence of effectiveness for
pharmacist-led medication reviews and educational programs using academic
detailing to improve general practice prescribing8.
In particular, this review and other studies showed that:
Patient Safety Research Portfolio: PINCER Trial 187
• Pharmacist-led interventions can lead to resolution of medication-related
problems in 55-93% of patients27-31.
• Educational outreach is a moderately powerful tool for changing professional
behaviour32.
• Multifaceted interventions aimed at different barriers to change are more effective
than single interventions33.
Nevertheless, since the start of our study, there have been a number of important
publications that have questioned the effectiveness of pharmacist-led interventions in
general practice. For example, the HOMER trial set out to determine whether home-
based medication review by pharmacists among older people would affect hospital
readmission rates147. The researchers found an increase in hospital admissions and
no improvement in quality of life or death rate. More recently, the RESPECT trial
showed no benefit from community pharmacist involvement in moderating drug
management (pharmaceutical care) in older people in general practice148. Indeed,
the authors, drawing upon their knowledge of the literature and a recent systematic
review149 argue that rigorous studies “provide no evidence to support the roll-out in
primary care pharmacist led medication review in general, or pharmaceutical care in
particular”148.
Given the conflicting evidence for the effectiveness of pharmacist-led interventions in
primary care it is important to reflect on why the PINCER trial pharmacist intervention
proved effective.
Firstly, we used an educational outreach approach which is known to be a
moderately powerful intervention for changing professional behaviour32. Pharmacists
involved in the trial received training on the use of these techniques and the evidence
base for the outcome measures used in the trial. Of relevance to Outcome 1 in the
PINCER trial (see Table 1), May21 reported a reduction in NSAID prescribing as a
result of educational outreach and suggested their programme contributed to a 70%
reduction in hospital admissions due to gastro-intestinal adverse events.
Secondly, we focused on specific examples of hazardous prescribing or
inadequacies in medication monitoring and this may have increased our ability to
impact on and detect change compared with the use of more generalised measures.
Patient Safety Research Portfolio: PINCER Trial 188
Thirdly, the pharmacists in the study worked with the practices, had access to patient
records for contextual information, and were able to provide practical support in
making changes to patients’ medications and organising blood tests.
Fouthly, the intervention was multifaceted and aimed simultaneously to tackle
different barriers to change; such interventions are known to be more effective than
single interventions33.
Fifthly, our embedded qualitative study (see Chapter 5: Qualitative evaluation of the
PINCER trial) identified a number of factors that are likely to have contributed to the
success of the intervention (these were not present in all practices) including:
• The perceived value of the intervention.
• The perceived value of pharmacists in primary care.
• The perceived appropriateness of the outcome measures.
• Having an initial meeting between the pharmacist and members of the practice.
• Having a link person within the practice for the pharmacist to work with (in most
cases this was the practice manager).
• Willingness of practices to accommodate the pharmacist.
• Willingness of practices to engage in the intervention.
• The non-threatening, constructive and friendly approach of trial pharmacists.
• Involvement of a wide range of staff within general practices, including doctors,
nurses and administrative staff.
• Co-operation and support from PCTs.
The competence of the pharmacists themselves was also an important factor
although it is worth noting that the pharmacists came from a range of backgrounds
and they were not unusual in their levels of qualification (see Table 22).
Thus, there were many factors that contributed to the effectiveness of the
pharmacist-led intervention. A major factor was the ability of pharmacists to facilitate
change in prescribing and medication monitoring of individual patients; evidence of
pharmacists teaching others how to avoid making errors was more limited.
It should be noted, that there may have been factors that limited the comparative
effectiveness of the simple feedback arm of the trial. For example, the educational
Patient Safety Research Portfolio: PINCER Trial 189
materials provided (see Appendix 2) might have appeared daunting to practitioners in
the simple feedback arm (where there was no additional support from a pharmacist);
conveying the messages in a simpler and clearer way might have been more
effective.
7.3 How well did the outcome measures perform?
The outcome measures were based upon patterns of prescribing and medicines
management that were known to be associated with patient harm and/or were
contrary to expert opinion7-13. Our analysis of reports from the trial pharmacists
indicates that over 70% of patients identified by the outcome measures were
considered at clinical risk. The percentages considered to be at clinical risk by
pharmacists for primary Outcomes 1, 2 and 3 were 90%, 81% and 94% respectively.
Nevertheless, some patients were identified as a result of computer coding errors
(8% and 10% for Outcomes 1 and 2 respectively) and for other reasons that did not
put the patient at clinical risk. Relatively few were identified as a result of information
being available, but not coded in the clinical records.
Overall, these finding suggest that in the majority of cases the outcome measures
are effective at picking up patients at clinical risk. The main exception to this was for
Outcome 6 (see Table 1) for practices using stand-alone systems for recording INR
results on patients prescribed warfarin. This is because, in these practices, the
majority of patients appeared to be at risk only because their INR results had not
been recorded on the practice computer (as noted in Section 2.2.7.1, these practices
were not included in the main trial analysis for this outcome measure).
One of the reasons why the primary outcome measures were selected was because
pilot work using the QRESEARCH database indicated that the numbers of patients
identified, as a proportion of those at risk, was sufficiently high to allow for a feasible
number of practices to be recruited according to our sample size calculations. This
allowed for demonstration of proof-of-principle that the complex pharmacist-led
intervention could be effective.
Apart from the composite outcome measures, the numbers of patients identified by
the secondary outcome measures were relatively small compared with the primary
Patient Safety Research Portfolio: PINCER Trial 190
outcome measures, particularly Outcomes 2 and 3. This may account for the fact that
few statistically significant differences were noted between the intervention groups for
most of the secondary outcome measures.
In contrast, the composite outcome measures contained large numbers and
demonstrated statistically significant differences between the intervention groups at
both six- and 12-months follow-up. These outcome measures were included in the
trial at the suggestion of referees who reviewed the grant application. The
combination of different types of medication errors makes sense in that each type is
likely to have similar underlying causes and the methods for tackling these errors are
also likely to be similar.
Outcomes 9 and 10 (see Table 1) required extraction of dosage instructions and it
was not possible to do this for one of the GP computer systems used by practices in
our study. This may limit the use of such outcome measures in future studies.
Overall, the outcome measures used in the study performed reasonably well
although there were issues in relation to Outcome 4 (numbers very small); Outcome
6 (INRs not recorded on the clinical computer system in some practices), and
Outcomes 9 and 10 (dosage instructions cannot be reliably extracted from all GP
computer systems).
7.4 Policy implications
Since the publication of An organisation with a memory1 and Building a safer NHS for
patients3 the UK Government has demonstrated a strong commitment to reducing
errors in the NHS. Also, while it is acknowledged that there may still be a need to
understand more about medication errors and the reasons for their occurrence3, 4, the
priority now must be to find effective, acceptable and sustainable ways of preventing
patients from being harmed as a result of such errors.
The PINCER trial has shown that a complex pharmacist-led IT-based intervention
can significantly reduce the numbers of patients at risk from clinically important
prescribing and monitoring errors. The intervention appears to be acceptable to
general practices, feasible in terms of the skills of pharmacists, and of relatively low
cost per error avoided. The intervention would be suitable for roll-out using suitably
Patient Safety Research Portfolio: PINCER Trial 191
trained PCT pharmacists or community pharmacists. The involvement of pharmacists
in such an intervention would be consistent with the Government’s aim to build on the
strengths of pharmacy150. The intervention would fit in particularly well with the PCT
pharmacist role where pharmacists already have well-developed working
relationships with general practices. Indeed, it is possible that pharmacists with such
established working relationships with general practices would be even more
effective than the pharmacists employed in the PINCER trial. Also, with increasing
numbers of pharmacists becoming independent prescribers, this could enhance the
ability of pharmacists to intervene to improve patient safety without needing general
practitioners to action necessary changes.
Any roll-out would need to take account of all the elements of the PINCER
intervention that are likely to have contributed to its success; we have no evidence to
indicate that a watered-down version would be successful. Also, consideration would
need to be given to maintaining the benefits of the intervention, for example by
having the pharmacist revisit the practice at six-monthly intervals. In addition, further
evidence would be needed to indicate whether the intervention is likely to reduce
patient harm. Also, consideration should be given to the likely benefits over and
above those available from computerised clinical decision support151.
If the intervention were to be rolled out then it would be important for this to be
evaluated. A Phase IV trial20 would be an appropriate approach and could work well if
PCTs were randomised to start the intervention in a phased way, so that those
starting the intervention later would act as controls, i.e. use of a step-wedged
design152.
The National Patient Safety Agency (NPSA) is, we believe, an appropriate body for
promoting the roll-out of the PINCER trial intervention, particularly as the organisation
had a pivotal role in the initiation of the study.
7.5 Suggestions for further research
As outlined above, an evaluation of a national roll-out of the PINCER trial intervention
would be an appropriate topic for further research.
Patient Safety Research Portfolio: PINCER Trial 192
Before then, it would be useful to undertake further work aimed at optimising the
intervention and considering further development of the outcome measures. With
respect to optimising the intervention, the key point to note is that we were not able to
eliminate the errors of interest; whilst our results were encouraging; there is still
clearly scope for further improvement. In relation to extending this work, there is also
the need formally to consider extending the intervention to encompass a broader
range of prescribing and medication-related monitoring errors.
We already have a lot of information about the actions taken by the trial pharmacists
and the factors associated with the success of the intervention. Nevertheless, we
have not had time to evaluate diaries recorded by the trial pharmacists. It would be
useful to examine these using qualitative research techniques with the aim of finding
out whether they contain additional information that would be helpful in the further
development and roll-out of the intervention.
As outlined in Section 7.3, while most of the outcome measures performed well in the
study, some might not be suitable for use in a national roll-out (particularly Outcomes
9 and 10 – see Table 1). In any future study, it would make sense to retain the
primary outcome measures so that the findings could be compared with the PINCER
trial. It would also be worth considering developing the composite outcome measures
further. For example, it would be possible to include within these outcome measures
additional prescribing and monitoring errors.
There is also a need to update our systematic review and meta-analysis to
incorporate findings from this new additional primary care-based trial8. There is in
parallel a need for a more interpretive critique of these trial data using a realist
perspective, which could usefully draw on findings from our qualitative work.
We also suggest that there is ongoing monitoring of national trends in the errors
investigated using large general practice databases.
Finally, in view of the conflicting evidence on the effectiveness of pharmacist
interventions in primary care it would be worth reviewing the different studies to try to
determine the elements most likely to be associated with success or failure.
Patient Safety Research Portfolio: PINCER Trial 193
7.6 Recommendations
As a result of this study, we have two main recommendations:
• Further developmental work to optimise and consider extending the PINCER
intervention.
• Planning for a national roll-out of the PINCER intervention – preferably led by the
NPSA – with this occurring in the context of a national independent evaluation.
Patient Safety Research Portfolio: PINCER Trial 194
8 Chapter 8: Conclusions
Patient Safety Research Portfolio: PINCER Trial 195
Compared with simple feedback, the pharmacist-led intervention resulted in
reductions in proportions of patients at risk of prescribing and monitoring errors for
the primary outcome measures and the composite secondary outcome measures at
six-months and (with the exception of the NSAID/peptic ulcer outcome measure), 12-
months post-intervention. There were no differences in death rates between the two
treatment arms.
The pharmacist-led intervention has a 95% probability of being considered cost-
effective if the decision-makers ceiling willingness to pay reaches £75 (6 months) or
£85 (12 months) per error avoided.
Analysis of data recorded by trial pharmacists indicated that over 70% of cases
identified by the outcome measures were considered at clinical risk (over 80% for
each of the primary outcome measures). Pharmacists recommended actions in three
quarters of cases identified by the electronic searches and these recommendations
were tailored to the outcome measures and individual patients. General practitioners
were reported to have accepted around two-thirds of pharmacists’ recommendations.
The qualitative analysis identified a number of factors that are likely to have
contributed to the success of the pharmacist-led intervention. These factors, which
include involvement of key individuals in the practice, support for pharmacists in their
roles and support from PCTs, need to be considered in any roll-out of the
intervention.
Baseline estimates of the frequency of errors were similar in PINCER trial practices
and practices contributing to the national QRESEARCH database. Examining
changes in outcome measures in QRESEARCH practices over the time that the trial
took place showed statistically significant reductions in the proportion of patients at
risk of monitoring errors for all of the monitoring outcome measures. Informal
comparison with PINCER trial practices at six- and 12-months post-intervention
suggest that any apparent improvements in monitoring outcome measures in the
simple intervention arm practices may have been associated more with secular
trends than intervention itself.
Overall, the main trial and associated studies have shown the PINCER trial
pharmacist-led intervention to be effective and cost-effective at reducing medication
errors whilst also being acceptable to general practices.
Patient Safety Research Portfolio: PINCER Trial 196
9 Chapter 9: Additional information
Patient Safety Research Portfolio: PINCER Trial 197
9.1 Trial organisation
Professor Avery has had overall responsibility for the day-to-day management of the
trial and for the conduct of the trial in the area around Nottingham. Professor Avery
led the Trial Management Group.
Dr Sarah Rodgers was the trial coordinator from the start of the trial to June 2009.
Professor Cantrill had overall responsibility for the conduct of the trial in the area
around Manchester.
Professor Elliott had responsibility for the economic analysis with Matthew Franklin
and Matthew Boyd assisting.
Dr Sarah Armstrong was the trial statistician with Professor Kendrick also having a
major role in the planning of the statistical analysis. Both Dr Armstrong and Professor
Kendrick undertook the statistical analyses for the main trial outcome measures.
Additional statistical advice was provided by Professors Prescott and Sheikh from
The University of Edinburgh.
Professor Sheikh had overall responsibility for the conduct of the qualitative analysis.
Professor Hippisley-Cox had overall responsibility for the analysis of outcome
measures using data from QRESEARCH practices.
9.2 Trial Management Group
The Trial Management Group has met on a quarterly basis throughout the study to
help ensure that all trial activities were organised according to the protocol and, as
far as possible, within the timescales set out in the original application for funding.
The Trial Management Group consisted of all the authors of this report with the
exception of Matthew Boyd, Julia Hippisley-Cox, Caroline Morris, Scott Murray, Koen
Putman and Yana Vinogradova.
Patient Safety Research Portfolio: PINCER Trial 198
9.3 Trial Steering Committee
The Trial Steering Committee (TSC) has monitored and supervised the trial and
advised on any proposed amendments’ to the protocol. The Trial Steering Committee
was headed by Professor Philip Hannaford. Professor Martin Buxton and Professor
Marjorie Weiss were the other external members of the committee. The TSC and
agreed to operate within the framework suggested in the MRC Guidelines for good
clinical practice in clinical trials153
9.4 Data Monitoring and Ethics Committee
The Data Monitoring and Ethics Committee (DMEC) was headed by Professor
Richard Baker. Other external members of the committee were Professor Christine
Bond and Professor Peter Donnan. The trial statistician reported to the DMEC, which
will was responsible for reviewing the data from the trial. The DMEC agreed to
operate within the framework suggested in the MRC Guidelines for good clinical
practice in clinical trials153
9.5 Ethical aspects of the trial
The trial was conducted according to the Helsinki Declaration154, the Good Clinical
Practice Guidelines155 and NHS Research Governance requirements.
Patients agreeing for the study team to access their clinical records were provided
written informed consent in a form designed for such purpose. Patients were able to
refuse to continue participating in the study at any time after providing their consent.
Data from patients has been kept confidential and use of the data has been limited to
the purposes stipulated in the protocol.
The study was approved by Nottingham 2 Research Ethics Committee (Reference:
05/Q2404/26). All staff involved in data collection had approval from the appropriate
local NHS research and development offices.
Patient Safety Research Portfolio: PINCER Trial 199
9.6 Study timeline
Trial start: 1 April 2006
Start of baseline data collection and interventions in general practices: August 2006
End of interventions in general practices: February 2008
End of 12-month follow-up data collection: April 2009
Start of data analysis: May 2009
Study end date: 31st January, 2010
Duration: 3.6 years
9.7 Authors contributions
AJA, who has made substantial contributions to the conception and design of the
study, was co-responsible for the overall administration and direction of the project,
the analysis and interpretation of data and has given the final approval of this report.
JAC and AS are also co-responsible for the overall design, administration and
direction of the study.
SR was the Trial Co-ordinator and was responsible for the day-to-day management
of the trial up until June 2009. She was involved in the design of the Quest Browser
queries and the piloting of the data extraction methods. She had a major role in
formatting the report.
JAC, AS, SA, RE, RH, DK, CJM, SM, RJP and KC also participated in the design of
the project: SA, DK, RJP and AS had a major role in designing the statistical analysis
for the trial. The analysis was undertaken by SA and DK.
Patient Safety Research Portfolio: PINCER Trial 200
ME had a major role in the day-to-day running of the trial at the sites in Staffordshire
and Central and Eastern Cheshire under the direction of Professor Cantrill. Under the
direction of Professor Avery, he undertook the processing and cleaning of data for
the main trial outcome measures. He contributed to economic analysis by piloting
and undertaking data extractions and by providing data from the main trial for the
economics team. He also provided comparative data for the QRESEARCH study. He
assisted in the formatting of the report.
LT helped to coordinate the trial at the sites in Staffordshire and Central and Eastern
Cheshire under the direction of Professor Cantrill.
RE has led on the design of the economic analysis with assistance from Koen
Putman, Matthew Boyd and Matthew Franklin.
AS, SM and KC have led on the design of the qualitative analysis and KC wrote
Chapter 5: Qualitative evaluation of the PINCER trial.
JHC had overall responsibility for the QRESEARCH analysis and undertook a
considerable amount of work on this; YV did most of the analysis of the
QRESEARCH data and wrote the first draft for Chapter 6: QRESEARCH analysis of
secular trends in outcome measures; AJA, ME and SR made significant contributions
to the QRESARCH study which was overseen by the TMG with particular input from
SA and DK.
RH did the analysis of reports from the trial pharmacists and wrote Chapter 4:
Analysis of data recorded by PINCER trial pharmacists
Glen Swanwick and Tom Turner provided useful advice on the research ethics
committee application and on materials sent to general practices and patients. They
attended most Trial Management Group meetings and gave constructive comments
on the final report.
Patient Safety Research Portfolio: PINCER Trial 201
9.8 Acknowledgements
We thank:
• Richard Lilford and colleagues from the Patient Safety Research Portfolio and
Members of the Trial Steering Committee and Data Monitoring and Ethics
Committee who provided extremely valuable advice and support throughout the
course of the study
• The primary care trusts, general practices and patients involved in the study.
• PCT research and development leads, pharmacy leads, and other key individuals
who helped to facilitate the study including Rachel Illingworth, Trevor Allen,
Susan Noyce, Cathy Quinn, Andrew Riley and Gail Thomas.
• Tom Goodwin for acting as line manager to the trial pharmacists.
• The trial pharmacists: Stacey Sadler, Christine Butler, Sadaf Qureshi, Lisa
Dutton, Reena Vedi and Robert Mason.
• Stacey Sadler for help in developing data extraction protocols for the economic
study.
• Emmanuel Atsu Dodor and Brian Serumaga for help with extraction of data for
the economic study and also for data input.
• Ed Longridge for help with data extractions.
• Julia Hippisley-Cox for providing data from the QRESEARCH database
(www.qresearch.org) for conducting sample size calculations.
• Clive Morris, Peter Bond, Mark Poole and colleagues from The Computer Room
(www.tcrnottingham.com) for their input concerning data extraction from general
practices using Quest Browser software
• April McCambridge and Clare Randall for assistance in formatting this report.
• Sharon Mills for administrative support throughout the trial.
• Sadaf Qureshi for entering the summary data collected by the pharmacists;
Caroline Mulvaney and Sherie Smith for double checking the data entry, and
Stacey Sadler for collating the pharmacist demographic data for this part of the
project
• Koen Putman, Lieven Annemans and Nick Verhaeghe for their input to the
modelling economic analysis
Patient Safety Research Portfolio: PINCER Trial 202
• The National Primary Care Research and Development Centre at the University
of Manchester provided practice-level data on deprivation from The National
Primary Care Database.
• Dr Casey Quinn for contributing to a re-analysis of the economic data.
• The referees for the time they spent reviewing our draft report, and for comments
that have helped to improve the final version.
9.9 Source of funding
Patient Safety Research Program of the UK Department of Health.
Patient Safety Research Portfolio: PINCER Trial 203
10 References
Patient Safety Research Portfolio: PINCER Trial 204
1. Department of Health. An organisation with a memory: report of an expert
group on learning from adverse events in the NHS. London: Department of Health2000.
2. Kohn L, Corrigan J, Donaldson M. To err is human-building a safer health system. Washington DC: Committee on Quality of Health Care in America, Institute of Medicine1999.
3. Department of Health. Building a safer NHS for patients: implementing an organisation with a memory. London: Department of Health2000.
4. Smith J. Building a safer NHS for patients: improving medication safety. London: Department of Health2004.
5. The National Coordinating Council for Medication Error Reporting and Prevention. Available from: http://www.nccmerp.org (Accessed 10th March 2004). Available from: http://www.nccmerp.org (Accessed 10th March 2004).
6. Reason J. Human error: models and management. British Medical Journal. 2000 Mar;320:768-70.
7. Avery AJ, Sheikh A, Hurwitz B, Smeaton L, Chen Y-F, Howard RL, et al. Safer medicines management in primary care. British Journal of General Practice. 2002;52 (Quality Suppl): S17-S22.
8. Royal S, Smeaton L, Avery AJ, Hurwitz B, Sheikh AI. Interventions in primary care to reduce medication related adverse events and hospital admissions: systematic review and meta-analysis. Quality & Safety in Health Care. 2006;15:23-31.
9. Howard RL, Avery AJ, Slavenburg S, Royal S, Pipe G, Lucassen P, et al. Which drugs cause preventable admissions to hospital? A systematic review. British Journal of Clinical Pharmacology. 2007;63:136-47.
10. Howard RL, Avery AJ, Howard PD, Partridge M. Investigation into the reasons for preventable drug related admissions to a medical admissions unit: observational study. Quality & Safety in Health Care. 2003 Aug;12:280-5.
11. Chen YF, Avery A, Neil K, Johnson C. Assessing the Occurrence and Preventability of prescribing potentially hazardous/contraindicated drug combinations in general (family) practice. Pharmacoepidemiology & Drug Safety. 2001;10:(Supplement 1):S53.
12. Shah SNH, Aslam M, Avery AJ. A survey of prescription errors in general practice. Pharmaceutical Journal. 2001;267:860-2.
13. Joint Formulary Committee. British National Formulary. 46th ed. London: British Medical Association and Royal Pharmaceutical Society of Great Britain; 2003.
14. Leape LL, Bates DW, Cullen DJ, Cooper J, Demonaco HJ, Gallivan T, et al. Systems analysis of adverse drug events. ADE Prevention Study Group. Journal of the American Medical Association. 1995 Jul;274:35-43.
15. Dean B, Schachter M, Vincent C, Barber N. Causes of prescribing errors in hospital inpatients: a prospective study. Lancet. 2002 Apr;359:1373-8.
16. Gurwitz JH, Field TS, Harrold LR, Rothschild J, Debellis K, Seger AC, et al. Incidence and preventability of adverse drug events among older persons in the ambulatory setting. Journal of the American Medical Association. 2003 Mar;289:1107-16.
17. MIQUEST Morbidity Information Query and Export. Available from: http://www.connectingforhealth.nhs.uk/systemsandservices/data/miquest. Available from: http://www.connectingforhealth.nhs.uk/systemsandservices/data/miquest.
18. Morris CJ, Cantrill JA, Bate JR. How the use of preventable drug-related morbidity indicators can improve medicines management in primary care. Pharmaceutical Journal. 2003;271:682-6.
Patient Safety Research Portfolio: PINCER Trial 205
19. Morris CJ, Rodgers S, Hammersley VS, Avery AJ, Cantrill JA. Indicators for preventable drug related morbidity: application in primary care. Quality & Safety in Health Care. 2004 Jun;13:181-5.
20. Medical Research Council. MRC’s framework for the development and evaluation of RCT’s for complex interventions (Available from: www.mrc.ac.uk). London: Medical Research Council2000 April.
21. May FW, Rowett DS, Gilbert AL, McNeece JI, Hurley E. Outcomes of an educational-outreach service for community medical practitioners: non-steroidal anti-inflammatory drugs. Medical Journal of Australia. 1999;170:471-4.
22. Wald H, Shojania KG. Root cause analysis. In: Making healthcare safer: A critical analysis of patient safety practices Evidence report number 43. Rockville, MD: Agency for Healthcare Research and Quality; 2001.
23. Freemantle N, Nazareth I, Eccles M, Wood J, Haines A. A randomised controlled trial of the effect of educational outreach by community pharmacists on prescribing in UK general practice. British Journal of General Practice. 2002 Apr;52:290-5.
24. Avery AJ, Rodgers S, Cantrill JA, Armstrong S, Elliott R, Howard R, et al. Protocol for the PINCER trial: a cluster randomised trial comparing the effectiveness of a pharmacist-led IT-based intervention with simple feedback in reducing rates of clinically important errors in medicines management in general practices. Trials. 2009 1 May;10:28.
25. National Patient Safety Agency. Methotrexate IT requirement specification. Available from: http://www.npsa.nhs.uk/nrls/alerts-and-directives/alerts/oral-methotrexate/. 2006; Available from: http://www.npsa.nhs.uk/nrls/alerts-and-directives/alerts/oral-methotrexate/.
26. Jamtvedt G, Young JM, Kristoffersen DT, O'Brien MA, Oxman AD. Audit and feedback: effects on professional practice and health care outcomes. Chichester, UK: The Cochrane Library2004.
27. Hanlon JT, Weinberger M, Samsa GP, Schmader KE, Uttech KM, Lewis IK, et al. A randomized, controlled trial of a clinical pharmacist intervention to improve inappropriate prescribing in elderly outpatients with polypharmacy. American Journal of Medicine. 1996 Apr;100:428-37.
28. Fish A, Watson MC, Bond CM. Practice-based pharmaceutical services: a systematic review. International Journal of Pharmacy Practice. 2002;10:225-33.
29. Granås AG, Bates I. The effect of pharmaceutical review of repeat prescriptions in general practice. International Journal of Pharmacy Practice. 1999;7:264-75.
30. Mackie CA, Lawson DH, Campbell A, Maclaren AG, Waigh R. A randomised controlled trial of medication review in patients receiving polypharmacy in general practice. Pharmaceutical Journal. 1999;263:R7.
31. Krska J, Cromarty JA, Arris F, Jamieson D, Hansford D, Duffus PRS, et al. Pharmacist-led medication review in patients over 65: a randomized, controlled trial in primary care. Age & Ageing. 2001;30:205-11.
32. Thomson O'Brien MA, Oxman AD, Davis DA, Haynes RB, Freemantle N, Harvey EL. Educational outreach visits: Effects on professional practice and health care outcomes (Cochrane review). The Cochrane Library, Issue 1. Chichester, UK: John Wiley & Sons Ltd; 2004.
33. Grimshaw JM, Shirran L, Thomas R, Mowatt G, Fraser C, Bero L, et al. Changing Provider Behavior: An Overview of Systematic Reviews of Interventions. Medical Care. 2001;39:II-2-II-45.
34. Elashoff JD. nQuery Advisor®. Version 6.0 Software. Los Angeles: CA; 2005.
Patient Safety Research Portfolio: PINCER Trial 206
35. Kerry SM, Bland JM. Statistics notes: The intracluster correlation coefficient in cluster randomisation. British Medical Journal. 1998 May 9, 1998;316:1455-60.
36. Department of Communities and Local Government. Indices of Deprivation 2004. Available from: http://www.communities.gov.uk/archived/general-content/communities/indicesofdeprivation/216309/. Available from: http://www.communities.gov.uk/archived/general-content/communities/indicesofdeprivation/216309/.
37. Department of Health. Quality and Outcomes Framework (QOF). Available from: http://www.dh.gov.uk/en/Healthcare/Primarycare/Primarycarecontracting/QOF/index.htm (accessed 16 February 2009). [updated 16th February 2009]; Available from: http://www.dh.gov.uk/en/Healthcare/Primarycare/Primarycarecontracting/QOF/index.htm (accessed 16 February 2009).
38. Assmann SF, Pocock SJ, Enos LE, Kasten LE. Subgroup analysis and other (mis)uses of baseline data in clinical trials. Lancet. 2000 Mar;355:1064-9.
39. Ukoumunne OC, Gulliford MC, Chinn S, Sterne JAC, Burney PGJ. Methods for evaluating area-wide and organisation-based interventions in health and health care: a systematic review. Health Technology Assessment. 1999;3:doi:10.3310/hta050.
40. Pocock SJ, Assmann SE, Enos LE, Kasten LE. Subgroup analysis, covariate adjustment and baseline comparisons in clinical trial reporting: current practice and problems. Statistics in Medicine. 2002 Oct;21:2917-30.
41. Hernández AV, Steyerberg EW, Habbema JD. Covariate adjustment in randomized controlled trials with dichotomous outcomes increases statistical power and reduces sample size requirements. Journal of Clinical Epidemiology. 2004 May;57:454-60.
42. Hauck WW, Anderson S, Marcus SM. Should we adjust for covariates in nonlinear regression analyses of randomized trials? Controlled Clinical Trials. 1998 Jun;19:249-56.
43. Hollis S, Campbell F. What is meant by intention to treat analysis? Survey of published randomised controlled trials. British Medical Journal. 1999 September 11, 1999;319:670-4.
44. Shih WJ. Problems in dealing with missing data and informative censoring in clinical trials. Current Control Trials in Cardiovascular Medicine. 2002;3:4.
45. StataCorp LP. Stata data analysis and statistical Software. Special Edition Release 10.1 ed. College Station, Texas: Stata; 2008.
46. Rural and Urban Area Classification 2004: An Introductory Guide. Available from: http://www.statistics.gov.uk/geography/nrudp.asp (Accessed January 2010). [(Accessed January 2010)].
47. The Quality and Outcomes Framework. Available from: http://www.ic.nhs.uk/statistics-and-data-collections/audits-and-performance/the-quality-and-outcomes-framework.
48. National Statistics Online. Population estimates for UK, England and Wales, Scotland and Northern Ireland. http://www.statistics.gov.uk/statbase/Product.asp?vlnk=15106. London: Office of National Statistics.
49. British Thoracic Society. The Burden of Lung Disease: A statistics report from the British Thoracic Society 2006. Available from: http://www.erpho.org.uk/Download/Public/15381/1/BurdenLungDisease2006.pdf (accessed 5 January 2010). London: British Thoracic Society.
50. Quality and Outcomes Framework 2007-8 (Go to national level tables 2007/8-prevalence.xls). Available from http://www.ic.nhs.uk/statistics-and-data-collections/supporting-information/audits-and-performance/the-quality-and-
Patient Safety Research Portfolio: PINCER Trial 207
outcomes-framework/qof-2007/08/data-tables (accessed 5 January 2010). Leeds: The Health and Social Care Information Centre.
51. Wrong Diagnosis: Statistics by Country for Peptic Ulcer. Available from: http://wrongdiagnosis.com/p/peptic_ulcer/stats-country.htm.
52. Barber JA, Thompson SG. Analysis of cost data in randomized trials: an application of the non-parametric bootstrap. Statistics in Medicine. 2000 Dec;19:3219-36.
53. Hilbe JM. Negative binomial regression. New York: Cambridge University Press. ISBN-13: 9780521857727; 2007.
54. Fenwick E, Claxton K, Sculpher M. Representing uncertainty: the role of cost-effectiveness acceptability curves. Health Economics. 2001;10:779-87.
55. Flynn TN, Peters TJ. Cluster randomized trials: Another problem for cost-effectiveness ratios. International Journal of Technology Assessment in Health Care. 2005;21:403-9.
56. Netten A, Dennett J, editors. Unit costs of community care 2007. Kent, Canterbury: Personal Social Services Research Unit; 2007.
57. Wooldridge J. Econometric Analysis of Cross Section and Panel Data. Boston: MIT Press; 2002.
58. De Rijdt T, Willems L, Simoens S. Economic effects of clinical pharmacy interventions: A literature review. American Journal of Health System Pharmacy. 2008 June 15, 2008;65:1161-72.
59. Karnon J, Campbell F, Czoski-Murray C. Model-based cost-effectiveness analysis of interventions aimed at preventing medication error at hospital admission (medicines reconciliation). Journal of Evaluation in Clinical Practice. 2009;15:299-306.
60. Lindsay B. Randomized controlled trials of socially complex nursing interventions: creating bias and unreliability? Journal of Advanced Nursing. 2004;45:84-94.
61. Green J, Britten N. Qualitative research and evidence based medicine. British Medical Journal. 1998 Apr;316:1230-2.
62. National Institutes of Health. Workshop on Research Designs for Complex, Multi-level Health Interventions and Programs. US: National Institutes of Health2004.
63. World Health Organization. Health Promotion Evaluation: Recommendations for Policy Makers. Copenhagen: WHO Working Group on Health Promotion Evaluation1999.
64. Campbell M, Fitzpatrick R, Haines A, Kinmonth AL, Sandercock P, Spiegelhalter D, et al. Framework for design and evaluation of complex interventions to improve health. British Medical Journal. 2000 Sep;321:694-6.
65. Bradley F, Wiles R, Kinmonth AL, Mant D, Gantley M. Development and evaluation of complex interventions in health services research: case study of the Southampton heart integrated care project (SHIP). The SHIP Collaborative Group. British Medical Journal. 1999 Mar;318:711-5.
66. Van Meijel B, Gamel C, Swieten-Duijfjes B, Grypdonck MHF. The development of evidence-based nursing interventions: methodological considerations. Journal of Advanced Nursing. 2004;48:84-92.
67. Barber N, Franklin BD, Cornford T, Klecun E, Savage E. Safer, Faster, Better? Evaluating Electronic Prescribing. Report to the Patient Safety Research Programme. London: Policy Research Programme of the Department of Health 2006.
68. Rogers E. Diffusion of innovations. New York: Free Press1983. 69. Greenhalgh T, Robert G, Macfarlane F, Bate P, Kyriakidou O. Diffusion of
Innovations in Service Organizations: Systematic Review and Recommendations. The Milbank Quarterly. 2004;82:581.
Patient Safety Research Portfolio: PINCER Trial 208
70. Department of Health. The NHS Improvement Plan: Putting people at the heart of public services. London: Department of Health 2004.
71. Wensing M, van der Weijden T, Grol R. Implementing guidelines and innovations in general practice: which interventions are effective? . British Journal of General Practice. 1998;48:991-7.
72. Solberg LI, Brekke ML, Fazio CJ, Fowles J, Jacobsen DN, Kottke TE, et al. Lessons from experienced guideline implementers: attend to many factors and use multiple strategies. Joint Commission Journal on Quality Improvement. 2000;26:171-88.
73. Coffey A, Atkinson P. Making Sense of Qualitative Data: Complementary Research Strategies. Thousand Oaks, London: Sage; 1996.
74. Songer AD, Young R, Davis K. Social architecture for sustainable IT implementation in AEC/EPC In: Coetzee G, Boshoff F, editors. Proceedings of IT in Construction in Africa 2001; Mpumalunga, South Africa2001.
75. Carroll DL, Greenwood R, Lynch K, Sullivan JK, Ready CH, Fitzmaurice JB. Barriers and Facilitators to the Utilization of Nursing Research. Clinical Nurse Specialist. 1997;11:207-12.
76. Bate SP, Robert G, MacLeod H. Report on the 'Breakthrough' Collaborative Approach to Quality and Service Improvement in Four Regions of the NHS. A research based evaluation of the Orthopaedic Services Collaborative within the Eastern, South and West, South East, and Trent Regions Birmingham: Health Services Management Centre, University of Birmingham2002.
77. Pettigrew A, McKee L. Shaping Strategic Change. Making change in large organisations. London: Sage; 1992.
78. Huy QN. Emotional capability, emotional intelligence and radical change. Academy of Management Review. 1999;24:325-45.
79. Rogers E. Diffusion of Innovations. New York: The Free Press1995. 80. Adler PS, Kwon SW, Singer JMK. The "Six-West" Problem: Professionals and
the Intraorganizational Diffusion of Innovations, with Particular Reference to the Case of Hospitals LA: University of Southern California, Marshall School of Business.2003.
81. Wejnert B. Integrating models of diffusion of innovations: A conceptual framework. Annual Review of Sociology. 2002;28:297-326.
82. McNulty T, Ferlie E. Reengineering health care. Oxford: Oxford University Press2002.
83. Stetler CB, Legro MW, Rycroft-Malone J, Bowman C, Curran G, Guihan M, et al. Role of "external facilitation" in implementation of research findings: a qualitative evaluation of facilitation experiences in the Veterans Health Administration. Implementation Science. 2006;1:23.
84. Meyers PW, Sivakumar K, Nakata C. Implementation of Industrial Process Innovations: Factors, Effects, and Marketing Implications. Journal of Product Innovation Management 1999;16:295-311.
85. Brown G. Assessing the clinical impact of pharmacists' interventions. American Journal of Hospital Pharmacy. 1991;48:2644-7.
86. Locock L, Dopson S, Chambers D, Gabbay J. Understanding the role of opinion leaders in improving clinical effectiveness. Social Science & Medicine. 2001;53:745-57.
87. Fitzgerald L, Ferlie E, Hawkins C. Innovation in healthcare: how does credible evidence influence professionals? Health & Social Care in the Community. 2003;11:219-28.
88. Fitzgerald L, Ferlie E, Wood M, Hawkins C. Interlocking Interactions, the Diffusion of Innovations in Health Care. Human Relations. 2002 December 1, 2002;55:1429-49.
89. Hall GE, Hord SM. Change in Schools. Albany, New York: State University of New York Press; 1987.
Patient Safety Research Portfolio: PINCER Trial 209
90. Hall GE, Wallace RC, Dossett WA. A Developmental Conceptualization of the Adoption Process within Educational Institutions. Austin, Texas: Research and Development Center for Teacher Education, University of Texas; 1973.
91. NHS Modernisation Agency. Spread and Sustainability of Service Improvement: Factors identified by staff leading modernisation programmes. Research into practice Report No. 4: Overview of early research findings. London: Department of Health2003.
92. Gosling AS, Westbrook JI, Braithwaite J. Clinical Team Functioning and IT Innovation: A Study of the Diffusion of a Point-of-care Online Evidence System. Journal of the American Medical Informatics Association. 2003;10:244-51.
93. Riley BL, Taylor SM, Elliott SJ. Determinants of implementing heart health promotion activities in Ontario public health units: a social ecological perspective. Health Education Research. 2001 August 1, 2001;16:425-41.
94. Riley BL. Dissemination of heart health promotion in the Ontario Public Health System: 1989-1999. Health Education Research. 2003 February 1, 2003;18:15-31.
95. Grimshaw JM, Thomas RE, MacLennan G, Fraser C, Ramsay CR, Vale L, et al. Effectiveness and efficiency of guideline dissemination and implementation strategies. International Journal of Technology Assessment in Health Care. 2005;21:149.
96. Rashman L, Hartley J. Leading and learning? Knowledge transfer in the Beacon Council Scheme. Public Administration. 2002;80:523-42.
97. Greenhalgh T, Robert G, Bate P, Kyriakidou O, Macfarlane F, Peacock R. How to Spread Good Ideas - A systematic review of the literature on diffusion, dissemination and sustainability of innovations in health service delivery and organisation. Report for the National Co-ordinating Centre for NHS Service Delivery and Organisation R & D (NCCSDO)2004.
98. Mesler MA. Boundary encroachment and task delegation: clinical pharmacists on the medical team. Sociology of Health & Illness. 1991;13:310-31.
99. Hawkins P, Winter J. Mastering Change: Learning the Lessons of the Enterprise in Higher Education Initiative. Sheffield: DfEE; 1997.
100. Knowles MS. The Modern Practice of Adult Education. New York Cambridge Books; 1980.
101. Oandasan I, Reeves SC. Key elements for interprofessional education. Part 1: The learner, the educator and the learning context. Journal of Interprofessional Care. 2005;19:21-38.
102. Taylor SM, Elliott SJ, Robinson K, Taylor S. Community-based heart health promotion: perceptions of facilitators and barriers. Canadian Journal of Public Health 1998;89:406-9.
103. Ham C. Improving the performance of health services: the role of clinical leadership. The Lancet. 2003;361:1978-80.
104. Thompson GN, Estabrooks CA, Degner LF. Clarifying the concepts in knowledge transfer: a literature review. Journal of Advanced Nursing. 2006;53:691-701.
105. Dopson S, Fitzgerald L, Ferlie E, Gabbay J, Locock L. No magic targets. Changing clinical practice to become more evidence based. Health Care Management Review. 2002;37:35-47.
106. Gerrish K, Clayton J. Promoting evidence-based practice: an organizational approach. Journal of Nursing Management. 2004;12:114-23.
107. Cotter JJ, Welleford EA, Vesley-Massey K, Thurston MO. Town and gown: collaborative community-based research and innovation. Family & Community Health. 2003;26:329-37.
Patient Safety Research Portfolio: PINCER Trial 210
108. Evashwick C, Ory M. Organizational characteristics of successful innovative health care programs sustained over time. Family & Community Health. 2003;26:177-93.
109. Yetton P, Sharma R, Southon G. Successful IS innovation: the contingent contributions of innovation characteristics and implementation process. Journal of Information Technology. 1999;14:53-68.
110. Leonard-Barton D, Deschamps I. Managerial influence in the implementation of new technology. Management Science. 1988;34:1252-65.
111. Zmud RW. An examination of 'Push-Pull' theory applied to process innovation in knowledge work. Management Science. 1984;30:727-38.
112. Green PL. Improving clinical effectiveness in an integrated care delivery system. Journal for Healthcare Quality. 1998;20:4-8.
113. Kripalani S, LeFevre F, Phillips CO, Williams MV, Basaviah P, Baker DW. Deficits in Communication and Information Transfer Between Hospital-Based and Primary Care Physicians: Implications for Patient Safety and Continuity of Care. Journal of the American Medical Association. 2007 February 28, 2007;297:831-41.
114. Hobbs FR, Erhardt L. Acceptance of guideline recommendations and perceived implementation of coronary heart disease prevention among primary care physicians in five European countries: the Reassessing European Attitudes about Cardiovascular Treatment (REACT) survey. Family Practice. 2002;19:596-604.
115. Gustafson DH, Sainfort F, Eichler M, Adams L, Bisognano M, Steudel H. Developing and testing a model to predict outcomes of organizational change. Health Service Research. 2003;38:751-76.
116. Grimshaw JM, Thomas RE, MacLennan G, Fraser C, Ramsay CR, Vale L, et al. Effectiveness and efficiency of guideline dissemination and implementation strategies. Health Technology Assessment 2004;8:iii-72.
117. Lee TT. Adopting a personal digital assistant system: application of Lewin's change theory. Journal of Advanced Nursing. 2006;55:487-96.
118. Miller RH, Sim I. Physicians' Use Of Electronic Medical Records: Barriers And Solutions. Health Affairs. 2004;23:116-26.
119. Rousseau N, McColl E, Newton J, Grimshaw JM, Eccles MP. Practice based, longitudinal, qualitative interview study of computerised evidence based guidelines in primary care. British Medical Journal. 2003 February 8, 2003;326:314.
120. Doolan DF, Bates DW. Computerized Physician Order Entry Systems In Hospitals: Mandates And Incentives. Health Affairs. 2002;21:180-8.
121. Wong HJ, Legnini MW, Whitmore HH. The diffusion of decision support systems in healthcare: are we there yet? Journal of Healthcare Management. 2000;45:240-9.
122. Bodenheimer T, Grumbach K. Electronic Technology: A Spark to Revitalize Primary Care? Journal of the American Medical Association. 2003 July 9, 2003;290:259-64.
123. Moyer CA, Stern DT, Dobias KS, Cox DT, Katz SJ. Bridging the electronic divide: patient and provider perspectives on e-mail communication in primary care. American Journal of Managed Care. 2002;8:427-33.
124. Kasje WN, Denig P, Haaijer-Ruskamp FM. Specialists' expectations regarding joint treatment guidelines for primary and secondary care. International Journal for Quality in Health Care 2002;14:509-18.
125. Patterson ES, Nguyen AD, Halloran JP, Asch SM. Human Factors Barriers to the Effective Use of Ten HIV Clinical Reminders. Journal of the American Medical Informatics Association. 2004;11:50-9.
Patient Safety Research Portfolio: PINCER Trial 211
126. Mittman BS, Tonesk X, Jacobson PD. Implementing clinical practice guidelines: social influence strategies and practitioner behavior change. QRB: Quality Review Bulletin. 1992;18:413-22.
127. Dopson S, Miller R, Dawson S, Sutherland K. Influences on clinical practice: the case of glue ear. Quality & Safety in Health Care. 1999 June 1999;8:108-18.
128. Hughes CM, McCann S. Perceived interprofessional barriers between community pharmacists and general practitioners: a qualitative assessment. British Journal of General Practice. 2003; 53:600-6.
129. McGettigan P, Golden J, Fryer J, Chan R, Feely J. Prescribers prefer people: The sources of information used by doctors for prescribing suggest that the medium is more important than the message. British Journal of Clinical Pharmacology. 2001;51:184-9.
130. Ash J. Organizational Factors that Influence Information Technology Diffusion in Academic Health Sciences Centers. Journal of the American Medical Informatics Association 1997;4:102-9.
131. Ash JS, Bates DW. Factors and forces affecting EHR system adoption: Report of a 2004 ACMI discussion. Journal of the American Medical Informatics Association. 2005;12:8-12.
132. Department of Health. Our NHS our future: NHS next stage review. Available from: http://www.dh.gov.uk/en/Healthcare/OurNHSourfuture/index.htm (Last accessed: 10 December 2008). 2008.
133. Preece J. The use of computers in general practice. London: Churchill Livingstone; 2000.
134. Bates DW, Gawande AA. Improving Safety with Information Technology. New England Journal of Medicine 2003;348:2526-34.
135. Hunt DL, Haynes RB, Hanna SE, Smith K. Effects of Computer-Based Clinical Decision Support Systems on Physician Performance and Patient Outcomes: A Systematic Review. Journal of the American Medical Association. 1998;280:1339-46.
136. Walton RT, Harvey E, Dovey S, Freemantle N. Computerised advice on drug dosage to improve prescribing practice (Cochrane Review). Chichester, UK: John Wiley; 2004.
137. Kaushal R, Shojania KG, Bates DW. Effects of computerized physician order entry and clinical decision support systems on medication safety: a systematic review. Archives of Internal Medicine. 2003;163:1409-16.
138. Fernando B, Savelyich B, Avery A, Sheikh A, Bainbridge M, Horsfield P, et al. Prescribing safety features of general practice computer systems: evaluation using simulated test cases. British Medical Journal. 2004;328:1171-2.
139. Department of Health. Delivering 21st century IT support for the NHS: National strategic programme. London: Department of Health2002.
140. van der Sijs H, Aarts J, Vulto A, Berg M. Overriding of Drug Safety Alerts in Computerized Physician Order Entry. Journal of the American Medical Informatics Association. 2006 Mar–Apr;13:138-47.
141. Gray S, Woolfrey S, Copeland R, Gill D, Dennett G. Evaluating the potential impact of community pharmacy interventions on patient care in Northumberland. Quality in Primary Care. 2004;12:47-51.
142. Zermansky AG, Petty DR, Raynor DK, Freemantle N, Vail A, Lowe CJ. Randomised controlled trial of clinical medication review by a pharmacist of elderly patients receiving repeat prescriptions in general practice. British Medical Journal. 2001 Dec;323:1340-3.
143. Department of Health. Contractual framework for community pharmacy. Available from: http://www.dh.gov.uk/en/Healthcare/Medicinespharmacyandindustry/Communitypharmacy/Communitypharmacycontractualframework/index.htm (last
Patient Safety Research Portfolio: PINCER Trial 212
accessed 11 December 2008). 2008; Available from: http://www.dh.gov.uk/en/Healthcare/Medicinespharmacyandindustry/Communitypharmacy/Communitypharmacycontractualframework/index.htm (last accessed 11/12/08).
144. Edmunds J, Calnan MW. The reprofessionalisation of community pharmacy? An exploration of attitudes to extended roles for community pharmacists amongst pharmacists and General Practioners in the United Kingdom. Social Science & Medicine. 2001;53:943-55.
145. Hippisley-Cox J, Pringle M, Cater R, Wynn A, Hammersley V, Coupland C, et al. The electronic patient record in primary care - regression or progression? A cross sectional study British Medical Journal. 2003;326.
146. Lilford RJ, Brown CA, Nicholl J. Use of process measures to monitor the quality of clinical practice. BMJ. 2007 September 29, 2007;335:648-50.
147. Holland R, Lenaghan E, Harvey I, Smith R, Shepstone L, Lipp A, et al. Does home based medication review keep older people out of hospital? The HOMER randomised controlled trial. British Medical Journal. 2005;330:293.
148. RESPECT Trial Team, Richmond S, Morton V, Cross B, Wong ICK, Russell I, et al. Effectiveness of shared pharmaceutical care for older patients: RESPECT trial findings (for info the abridged version appeared in the BJGP 2010;59:14-20). British Journal of General Practice 2009:DOI: 10.3399/bjgp09X473295.
149. Holland R, Desborough J, Goodyer L, Hall S, Wright DJ, Loke Y. Does pharmacist-led medication review help to reduce hospital admissions and deaths in older people? A systematic review and meta-analysis British Journal of Clinical Pharmacology. 2008;65:303-16.
150. Department of Health. Pharmacy in England. Building on strengths - delivering the future. Norwich: The Stationary Office2008.
151. Schedlbauer A, Prasad V, Mulvaney C, Phansalkar S, Stanton W, Bates DW, et al. What Evidence Supports the Use of Computerized Alerts and Prompts to Improve Clinicians' Prescribing Behavior? Journal of the American Medical Informatics Association. 2009 July 1, 2009;16:531-8.
152. Brown CA, Lilford RJ. The stepped wedge trial design: a systematic review. BMC Medical Research Methodology. 2006 Nov;8:54.
153. Medical Research Council. MRC Guidelines for good clinical practice in clinical trials. London: Medical Research Council1998.
154. World Medical Association. World Medical Association Declaration of Helsinki. Available from: http://www.wma.net/e/policy/b3.htm. 2008; Available from: http://www.wma.net/e/policy/b3.htm.
155. European Union Commission Directive 2005/28/EC. Available from: http://eur-lex.europa.eu/LexUriServ/LexUriServ.do?uri=OJ:L:2005:091:0013:0019:EN:PDF. 2005; Available from: http://eur-lex.europa.eu/LexUriServ/LexUriServ.do?uri=OJ:L:2005:091:0013:0019:EN:PDF.
Patient Safety Research Portfolio: PINCER Trial 213
Appendix 1: Letters to general practices, information leaflets and consent forms
The PINCER Trial: A cluster randomised trial to determine the effectiveness, costs/benefits and acceptability of a
pharmacist-led, IT-based intervention compared with simple feedback in reducing rates of clinically important
instances of potentially hazardous prescribing and medicines management in general practice
Practice Introductory Letter Version 2.1, February 2005
Appendix 1.1: Practice introductory letter University Letterhead
Practice
Address
Date
Dear Dr Name
The PINCER Trial
We are writing to ask if your practice would be willing to participate in a research project
that has been funded by the Department of Health as part of their Patient Safety
Research Programme.
Research done at the Universities of Manchester and Nottingham has shown that some
patients are at risk from hazardous prescribing or infrequent therapeutic monitoring in
general practice. We have developed methods for identifying these patients using
searches of GP computer systems and pilot studies have shown that practices find this
information useful in improving patient care.
In the PINCER trial we want to find out whether an intensive pharmacist-led intervention
can reduce rates of potentially hazardous prescribing more effectively than giving simple
feedback about patients at risk. The study is being conducted by the Universities of
Nottingham, Manchester and Edinburgh and we hope to recruit 68 general practices. The
study has been granted ethical approval by the Nottingham Research Ethics Committee
and organisational approval by Broxtowe & Hucknall PCT.
Please find enclosed an information sheet which explains the background to the study,
requirements for participation and what would be expected of the practice during the
course of the study. We would be grateful if you would read the information sheet and
return the enclosed reply slip in the pre-paid envelope provided, indicating whether or not
you might be interested in participating.
The PINCER Trial: A cluster randomised trial to determine the effectiveness, costs/benefits and acceptability of a
pharmacist-led, IT-based intervention compared with simple feedback in reducing rates of clinically important
instances of potentially hazardous prescribing and medicines management in general practice
Practice Introductory Letter Version 2.1, February 2005
If you are interested in participating, a member of the research team (Sarah Rodgers or
Sharon Mills) will telephone you to arrange a meeting to discuss the study in more detail
and address any questions or concerns you may have. If we don’t hear from you within
two to three weeks Sarah or Sharon will give your practice a ring.
Yours sincerely
Professor Tony Avery Dr Sarah Rodgers
Chief Investigator Trial Co-ordinator
cc Practice Partners and Practice Manager
The PINCER Trial: A cluster randomised trial to determine the effectiveness, costs/benefits and acceptability of a
pharmacist-led, IT-based intervention compared with simple feedback in reducing rates of clinically important
instances of potentially hazardous prescribing and medicines management in general practice
Practice Introductory Letter Version 2.1, February 2005
REPLY SLIP
Practice Details
We are willing / not willing* to meeting with a researcher to discuss the PINCER trial in
more detail.
* Please delete as applicable
Name and designation of practice representative we can contact to organise a
meeting:
……………………………………………………………………………………………
Practice representative telephone number:
……………………………………………………………………………………………
Please return this reply slip using the prepaid envelope provided to:
Dr Sarah Rodgers
PINCER Trial Co-ordinator
FREEPOST MID 17779
Division of Primary Care
13th Floor, Tower Building
University Park
Nottingham
NG7 2RD
The PINCER Trial: A cluster randomised trial to determine the effectiveness, costs/benefits and acceptability of a
pharmacist-led, IT-based intervention compared with simple feedback in reducing rates of clinically important
instances of potentially hazardous prescribing and medicines management in general practice
Practice Information Sheet Version 1.1, February 2005
Appendix 1.2: Practice information sheet
The PINCER Trial
(A cluster randomised trial to determine the effectiveness, costs/benefits and
acceptability of a pharmacist-led, IT-based intervention compared with simple
feedback in reducing rates of clinically important instances of potentially hazardous
prescribing in general practice)
Your practice is being invited to take part in the above study. Please take time to
read this information leaflet and discuss it with other practice members before
returning the reply slip. At this stage we are only asking whether you think you may
be willing to participate. If you express an interest then you will be given the
opportunity to meet with a member of the research team to raise any questions or
concerns that you may have as a result of reading this information.
Thank you for taking the time to read this leaflet.
Purpose of the study The purpose of this study is to determine the effectiveness, costs/benefits and
acceptability of a pharmacist-led, multi-dimensional intervention (IT-based audit, the
provision of evidence-based clinical information to medical staff, direct liaison with
patients) compared with IT-based audit and simple feedback alone in reducing the
rates of specified clinically significant instances of potentially hazardous prescribing
in general practice.
Why has my practice been chosen? Your practice has been chosen because you are located within a PCT that has given
R&D approval to the study. Your practice is also within a 50 mile radius of the
University of Nottingham, one of the sites from which the study is being run.
The PINCER Trial: A cluster randomised trial to determine the effectiveness, costs/benefits and acceptability of a
pharmacist-led, IT-based intervention compared with simple feedback in reducing rates of clinically important
instances of potentially hazardous prescribing and medicines management in general practice
Practice Information Sheet Version 1.1, February 2005
Does my practice have to take part? It is up to you and your colleagues to decide whether you wish to take part. If you
decide to take part you are still free to withdraw at any time and without giving a
reason. If you do take part you will be given a further copy of this information sheet,
and your consent form.
What will happen if we decide to take part? If you decide to take part, your practice will be randomly allocated to one of the two
arms of the trial (simple feedback or pharmacist intervention). All practices,
irrespective of which arm of the study they are randomised to, will be visited by a
researcher who will use Quest Browser software (www.tcr.i12.com ) to extract data
on patients at risk of medication-related injury from medications such as non-
inhibitors, diuretics, amiodarone, lithium, methotrexate and warfarin. For an average
sized practice, our pilot studies suggest that around 40 patients will be identified from
these computer searches. Quest Browser software works with MIQUEST and has
been used successfully by PCTs and practices for extracting data from GP computer
systems with the aim of monitoring and improving quality of care.
In this study, the data extracted from GP computer systems will be used in two ways.
Firstly, a member of your practice will be shown how to access information about
those patients thought to be at risk of medication-related injury so that you can use
this information to help improve
The PINCER Trial: A cluster randomised trial to determine the effectiveness, costs/benefits and acceptability of a
pharmacist-led, IT-based intervention compared with simple feedback in reducing rates of clinically important
instances of potentially hazardous prescribing and medicines management in general practice
Practice Information Sheet Version 1.1, February 2005
patient care (the research team will not have access to this patient-specific data).
Secondly, the data will be automatically anonymised by the Quest Browser software
and sent in an encrypted form to a secure email address at the University of
Nottingham. Please note: All issues related to the anonymity of patient data and
security of data during this process have been rigorously tested in a pilot study.
Practices allocated to the simple feedback arm of the trial will receive computerised
feedback on patients who are exposed to instances of potentially hazardous
prescribing, along with brief written educational materials explaining the importance
of each event. The practice will be asked to try and make changes to patients’
medications within 12 weeks. Practices in the pharmacist intervention arm will
have a suitably experienced and trained pharmacist working with them intensively, on
a part-time basis, over a 12 week period. The pharmacist will arrange an initial
meeting with members of the practice team to discuss the computer-generated
feedback. They will take an educational outreach (‘academic detailing’) approach and
employ some of the principles of root cause analysis (if appropriate). The pharmacist
will then work alongside practice staff to agree on the best way forward for
addressing the problems identified (including dealing directly with affected patients)
and for preventing further problems in the future. The pharmacist will not make changes to any patient’s medication without the agreement of both the patient and their GP. In both arms of the trial the computerised searches of the clinical
system will be repeated at six-months and 12-months after the end of the intervention
period and this information will be sent in an anonymised and encrypted form to the
University of Nottingham. Please note: the pharmacists will hold a full employment
contract with a local PCT and pharmacists will not make direct contacts with patients
unless those patients have given informed consent.
In both arms of the trial we would like practices to send out pre-prepared information
about the study to patients. This information will be carefully worded to try to avoid
generating any concerns. We will ask you to try to avoid sending the information out
to certain groups of vulnerable patients (e.g. those with cognitive impairment or
terminal illness).
For the patients contacted about the study, we will request their consent for a
member of the research team to access their records 12-months after the completion
The PINCER Trial: A cluster randomised trial to determine the effectiveness, costs/benefits and acceptability of a
pharmacist-led, IT-based intervention compared with simple feedback in reducing rates of clinically important
instances of potentially hazardous prescribing and medicines management in general practice
Practice Information Sheet Version 1.1, February 2005
of the study in your practice. The reason for requesting access to patients’ records is
find out if there are any differences in the use of healthcare resources between the
two arms of the trial (Please note: the member of the research team will hold an
honorary contract with the PCT and will treat all patient information confidentially). In
the pharmacist intervention arm of the trial we shall also ask patients to give their
consent to be contacted by the pharmacist.
In order to find out what practices think to the interventions, we plan to undertake a
small number of telephone interviews and focus groups with practice clinical and
administrative staff from the (expected) 68 practices involved in the trial. Staff in your
practice may be approached to ask if they are willing to participate in ONE of these
activities. These will be audio-taped, with consent, and transcribed.
What are the possible disadvantages or risks of taking part? Occasionally, MIQUEST queries can cause general practice systems to run slowly.
However, we have developed and piloted the searches extensively and envisage that
there will be minimal disruption to your practice’s normal routines.
Involvement in the study will take up some time for members of your practice. We
have, however, piloted the study and believe that it should not be too time-consuming
for most practices. We are able to pay a nominal sum of £100 to cover your
administrative costs.
What are the possible benefits of taking part? During the study, patients who are at risk from potentially hazardous prescribing will
be identified. All practices involved in the study will have the opportunity to check
these patients and to decide whether to take corrective action. In the pharmacist
intervention arm, practices will receive extra help in the form of education and
support.
Will the practices’ participation in the study remain confidential? All information which leaves the practice will be anonymised so that neither the
practice nor the individual patients can be recognised from it.
The PINCER Trial: A cluster randomised trial to determine the effectiveness, costs/benefits and acceptability of a
pharmacist-led, IT-based intervention compared with simple feedback in reducing rates of clinically important
instances of potentially hazardous prescribing and medicines management in general practice
Practice Information Sheet Version 1.1, February 2005
What will happen to the results of this study? The results of this study will help to inform Government health policy on medicines
management in primary care. A report will be publicly available through the
Department of Health. The results of this study will be published in relevant journals
and presented at conferences. No individual or practice will be identifiable in any of
the published material.
Who is organising and funding this research? The research is being organised by the Division of Primary Care, University of
Nottingham in collaboration with the School of Pharmacy and Pharmaceutical
Sciences, University of Manchester and the Division of Community Health Sciences,
University of Edinburgh.
The study has been funded by the Patient Safety Research Programme of the
Department of Health.
Who has reviewed the study? This study has been reviewed favourably by the Nottingham Research Ethics
Committee and organisational approval has been obtained from Broxtowe and
Hucknall PCT.
Contact Details For further information about this study please contact either:
Trial Co-ordinator: Dr Sarah Rodgers, Division of Primary Care, 13th Floor, Tower
Building, University Park, Nottingham NG7 2RD. Tel: 0115 846 6937; Fax: 0115
The PINCER Trial: A cluster randomised trial to determine the effectiveness, costs/benefits and acceptability of a
pharmacist-led, IT-based intervention compared with simple feedback in reducing rates of clinically important
instances of potentially hazardous prescribing and medicines management in general practice
Practice Consent Form Version 1.1, February 2005
Appendix 1.3: Practice consent form
The PINCER Trial
Chief Investigator: Professor Tony Avery
Practice Details
General Practice Consent to Participate in Study Please complete the following: Please delete as applicable Have you read and understood the information sheet? YES / NO
Have you had an opportunity to ask questions and discuss this study? YES / NO Have you received satisfactory answers to all your questions? YES / NO Have you received enough information about the study? YES / NO
Do you understand that you are free to withdraw from the study
- at any time? YES / NO
- without giving a reason for withdrawing? YES / NO Who explained the details of this study to you?............................................................. The practice agrees to take part in this study. YES / NO Name of practice representative:…………………..……………………………………….. Designation of practice representative:…………………………………………………….. Signed:………………………………………………….…… Date:……………….. Name of researcher: …………………………….…………………………………………… Signed:.………………………………………………………. Date:………………..
Helping your GP to review your medicines:
The PINCER Trial: A cluster randomised trial to determine the effectiveness, costs/benefits and acceptability of a
pharmacist-led, IT-based intervention compared with simple feedback in reducing rates of clinically important
instances of potentially hazardous prescribing and medicines management in general practice
Patient Invite Letter Version 3.2, June 2006
Appendix 1.4: Patient invitation letter GP Practice Headed Paper
Dear (name of patient)
Our surgery is taking part in a research project organised by the Universities of
Nottingham, Manchester and Edinburgh and we are writing to you to see if you would
be willing to let a researcher look at your medical records.
We have enclosed an information sheet with this letter to tell you what the study is
about and what will happen should you choose to take part. If you want to ask any
questions about the study before deciding whether or not to take part, then please
ring Dr Sarah Rodgers at the University of Nottingham on 0115 8466937, who will be
pleased to help you.
Please take time to read the leaflet and discuss the study with other people if you
wish. Once you have decided whether or not to take part, please complete the
enclosed consent form and return it in the postage paid envelope provided.
Please remember that it is completely up to you whether or not you take part. If you
decide you do not want to take part, this will not affect the care you receive from the
practice.
Yours sincerely
Dr (name) and partners
Helping your GP to review your medicines
The PINCER Trial: A cluster randomised trial to determine the effectiveness, costs/benefits and acceptability of a
pharmacist-led, IT-based intervention compared with simple feedback in reducing rates of clinically important
instances of potentially hazardous prescribing and medicines management in general practice
Patient Information Sheet Pharmacist intervention arm - Version 3.2, June 2006
Appendix 1.5: Patient information sheet pharmacist intervention arm University letterhead Helping your GP to review your medicines You are being invited to take part in a research study. Before you decide whether to take part, it is important for you to understand why the research is being done and what it will involve. Please take time to read the following information carefully and discuss it with others if you wish. Ask us if there is anything that is not clear or if you would like more information. Take time to decide whether or not you wish to take part. Thank you for reading this information sheet.
What is the purpose of the study? Your GP surgery is using a computer programme to help find patients who may need their medicines reviewing. The aim of the study is to find out whether the information from the computer helps GPs to review patients’ medicines, or whether it is better when a pharmacist helps out.
To do this we are going to look at two groups of general practices. In “Group One”, a pharmacist will work with the GP to help review patients’ medicines. In “Group Two” the GP will be provided with the information from the computer, but will have no pharmacist to help them. Your GP surgery is in “Group One”.
Why have I been chosen? The computer programme that is being used by your GP surgery suggests that you may need your medicines reviewing. Your GP will decide whether any action needs to be taken. The research team would like to find out whether any changes are made to your medicines, or whether any blood tests are done, as a result of your practice being involved in this study. We would also like to know whether it makes any difference to the way you use the health service. In order to find out more about this a pharmacist will look at your medical records and possibly contact you to discuss your medicines, if your GP thinks this is a good idea.
The pharmacist will have spoken with your GP about whether any changes are needed to your medicines or whether you need any blood tests. In some cases it will be possible to speak with you on the telephone about these changes; in other cases the pharmacist will invite you to the GP surgery, or arrange a visit if you are unable to get to the surgery.
Any changes made to your medicines will be agreed with your doctor before they take place.
If at any time you would prefer to speak directly with your doctor or a nurse at your GP surgery, the pharmacist will arrange this for you.
Helping your GP to review your medicines
The PINCER Trial: A cluster randomised trial to determine the effectiveness, costs/benefits and acceptability of a
pharmacist-led, IT-based intervention compared with simple feedback in reducing rates of clinically important
instances of potentially hazardous prescribing and medicines management in general practice
Patient Information Sheet Pharmacist intervention arm - Version 3.2, June 2006
What will happen to me if I take part? If you choose to take part in this study a researcher from the University of Nottingham will look at your medical records at your GP surgery in around 15 month’s time. The researcher will have been trained to deal with your records confidentially. This means that: • they will not talk to anyone about you • they will not write your name down on any form that they use for collecting
information • they will not take any information out of the practice that would allow anyone to
know that you have been involved in the study Information will be collected from your medical records about the medicines that you have used, any tests that you have had done and how many times you have visited the doctor, nurse or any other person dealing with your health care. Information will be recorded from around one year ago (this is one year before the study started in your general practice) until the time that the researcher visits the practice to look at your records. Do I have to take part? It is up to you to decide whether or not to take part. If you decide to take part you are still free to withdraw at any time, and without giving a reason. If you decide not to take part, or to withdraw from the study at a future date, this will not affect the standard of care you receive. What are the possible disadvantages of taking part? There are no disadvantages to taking part in this study What are the possible benefits of taking part? Allowing a researcher to look at your medical records will help the research team to find out whether the information from the computer helps GPs to review patients’ medicines, or whether it is better when a pharmacist helps out. Involving the pharmacist may help to make sure that if any changes are needed to your medicines, these will happen. Even if you choose not to take part in this study, your GP may decide to suggest changes to your medicines, or a blood test, and this may be of benefit to you. Will information in my medical records remain confidential? All information which is collected about you during the course of the research will remain confidential. What do I have to do? Complete and return the enclosed consent form, in the postage paid envelope provided, indicating whether you wish to take part in this study or not.
Helping your GP to review your medicines
The PINCER Trial: A cluster randomised trial to determine the effectiveness, costs/benefits and acceptability of a
pharmacist-led, IT-based intervention compared with simple feedback in reducing rates of clinically important
instances of potentially hazardous prescribing and medicines management in general practice
Patient Information Sheet Pharmacist intervention arm - Version 3.2, June 2006
What will happen to the results of the research study? The results of the study will be published in medical journals and will be presented at conferences. There is no possibility that any individual person or doctor’s surgery could be identified in any report or article that is published. Who is organising and funding the research? The research is organised by the Division of Primary Care, University of Nottingham in collaboration with the School of Pharmacy and Pharmaceutical Sciences, University of Manchester and Division of Community Health Sciences, University of Edinburgh. The research is funded by the Department of Health. The official name for the study is the “PINCER trial”. Your doctor is not being paid for including you in this study. Who has reviewed the study? This study has been reviewed by the ethics committee for your local area and by the Nottingham research ethics committee which governs research studies taking place in a number of different areas. It has also been approved by your local Primary Care Trust. Contact for Further Information If you wish to ask any questions about this study before deciding to take part, please contact one of the following people, who would be pleased to help you: PINCER Trial Co-ordinator: Dr Sarah Rodgers, Division of Primary Care, 13th Floor, Tower Building, University Park, Nottingham, NG7 2RD. Tel 0115 8466937; Fax 0115 8466904 email: [email protected] or Chief Investigator: Professor Tony Avery, Head of Division of Primary Care, School of Community Health Sciences, University of Nottingham Medical School, Nottingham, NG7 2UH. Tel 0115 8230209; Fax: 0115 8230528 email: [email protected]
Thank you once again for taking the time to read through this information and considering taking part in this study.
Helping your GP to review your medicines
The PINCER Trial: A cluster randomised trial to determine the effectiveness, costs/benefits and acceptability of a
pharmacist-led, IT-based intervention compared with simple feedback in reducing rates of clinically important
instances of potentially hazardous prescribing and medicines management in general practice
Patient Information Sheet Simple feedback arm- - Version 3.2, June 2006
Appendix 1.6: Patient information sheet simple feedback arm University letterhead Helping your GP to review your medicines You are being invited to take part in a research study. Before you decide whether to take part, it is important for you to understand why the research is being done and what it will involve. Please take time to read the following information carefully and discuss it with others if you wish. Ask us if there is anything that is not clear or if you would like more information. Take time to decide whether or not you wish to take part. Thank you for reading this information sheet. What is the purpose of the study? Your GP surgery is using a computer programme to help find patients who may need their medicines reviewing. The aim of the study is to find out whether the information from the computer helps GPs to review patients’ medicines, or whether it is better when a pharmacist helps out.
To do this we are going to look at two groups of general practices. In “Group One”, a pharmacist will work with the GP to help review patients’ medicines. In “Group Two” the GP will be provided with the information from the computer, but will have no pharmacist to help them. Your GP surgery is in “Group Two”. Why have I been chosen? The computer programme that is being used by your GP surgery suggests that you may need your medicines reviewing. Your GP will decide whether any action needs to be taken. The research team would like to find out whether any changes are made to your medicines, or whether any blood tests are done, as a result of your practice being involved in this study. We would also like to know whether it makes any difference to the way you use the health service. In order to find out more about this we are asking if you would allow a member of the research team to look at your medical records. Do I have to take part? It is up to you to decide whether or not to take part. If you decide to take part you are still free to withdraw at any time, and without giving a reason. If you decide not to take part, or to withdraw from the study at a future date, this will not affect the standard of care you receive. What will happen to me if I take part? If you choose to take part in this study a researcher from the University of Nottingham will look at your medical records at your GP surgery in around 15 month’s time. The researcher will have been trained to deal with your records confidentially. This means that:
Helping your GP to review your medicines
The PINCER Trial: A cluster randomised trial to determine the effectiveness, costs/benefits and acceptability of a
pharmacist-led, IT-based intervention compared with simple feedback in reducing rates of clinically important
instances of potentially hazardous prescribing and medicines management in general practice
Patient Information Sheet Simple feedback arm- - Version 3.2, June 2006
• they will not talk to anyone about you • they will not write your name down on any form that they use for collecting
information • they will not take any information out of the practice that would allow anyone to
know that you have been involved in the study Information will be collected from your medical records about the medicines that you have used, any tests that you have had done and how many times you have visited the doctor, nurse or any other person dealing with your health care. Information will be recorded from around one year ago (this is one year before the study started in your general practice) until the time that the researcher visits the practice to look at your records. What are the possible disadvantages of taking part? There are no disadvantages to taking part in this study. What are the possible benefits of taking part? Allowing a researcher to look at your medical records will help the research team to find out whether the information from the computer helps GPs to check patients’ medicines, or whether it is better when a pharmacist helps out. Even if you choose not to take part in this study, your GP may decide to suggest changes to your medicines, or a blood test, and this may be of benefit to you. Will information in my medical records remain confidential? All information which is collected about you during the course of the research will remain confidential. What do I have to do? Complete and return the enclosed consent form, in the postage paid envelope provided, indicating whether you wish to take part in this study or not.
What will happen to the results of the research study? The results of the study will be published in medical journals and will be presented at conferences. There is no possibility that any individual person or doctor’s surgery could be identified in any report or article that is published. Who is organising and funding the research? The research is organised by the Division of Primary Care, University of Nottingham in collaboration with the School of Pharmacy and Pharmaceutical Sciences, University of Manchester and Division of Community Health Sciences, University of Edinburgh. The research is funded by the Department of Health. The official name for the study is the “PINCER trial”. Your doctor is not being paid for including you in this study.
Helping your GP to review your medicines
The PINCER Trial: A cluster randomised trial to determine the effectiveness, costs/benefits and acceptability of a
pharmacist-led, IT-based intervention compared with simple feedback in reducing rates of clinically important
instances of potentially hazardous prescribing and medicines management in general practice
Patient Information Sheet Simple feedback arm- - Version 3.2, June 2006
Who has reviewed the study? This study has been reviewed by the ethics committee for your local area and by the Nottingham research ethics committee which governs research studies taking place in a number of different areas. It has also been approved by your local Primary Care Trust. Contact for Further Information If you wish to ask any questions about this study before deciding to take part, please contact one of the following people, who would be pleased to help you: PINCER Trial Co-ordinator: Dr Sarah Rodgers, Division of Primary Care, 13th Floor, Tower Building, University Park, Nottingham, NG7 2RD. Tel 0115 8466937; Fax 0115 8466904 email: [email protected] or Chief Investigator: Professor Tony Avery, Head of Division of Primary Care, School of Community Health Sciences, University of Nottingham Medical School, Nottingham, NG7 2UH. Tel 0115 8230209; Fax: 0115 8230528 email: [email protected] Thank you once again for taking the time to read through this information and considering taking part in this study.
Helping your GP to review your medicines
The PINCER Trial: A cluster randomised trial to determine the effectiveness, costs/benefits and acceptability of a
pharmacist-led, IT-based intervention compared with simple feedback in reducing rates of clinically important
instances of potentially hazardous prescribing and medicines management in general practice
Patient consent form - Pharmacist intervention arm Version 3.2, June 2006
Appendix 1.7: Patient consent form pharmacist intervention arm University letterhead Helping your GP to review your medicines Principal Investigator: Professor A J Avery Please complete the following: Please put a
circle round your answers
Have you read and understood the information sheet? YES / NO
Have you had an opportunity to ask questions and discuss this study? (if you have any questions you wish to ask, please contact one of the people listed on your information sheet) YES / NO
Have you received satisfactory answers to all your questions? YES / NO Have you received enough information about the study? YES / NO Do you understand that you are free to withdraw from the study:
at any time? YES / NO
without giving a reason for withdrawing? YES / NO
and without affecting your future medical care? YES / NO
I agree to allow a responsible employee from the University of Nottingham to view my medical notes YES / NO as part of the above study Name (please print)………….…………………………..………………………….. Signed……………………………………………………………..Date……………. Please return in the enclosed postage paid envelope to: Dr Sarah Rodgers, PINCER Trial Co-ordinator, FREEPOST MID 17779, Division of Primary Care, 13th Floor, Tower Building, University Park, Nottingham NG7 2RD.
Helping your GP to review your medicines
The PINCER Trial: A cluster randomised trial to determine the effectiveness, costs/benefits and acceptability of a
pharmacist-led, IT-based intervention compared with simple feedback in reducing rates of clinically important
instances of potentially hazardous prescribing and medicines management in general practice
Patient consent form – Simple feedback arm Version 3.2, June 2006
Appendix 1.8: Patient consent form simple feedback arm University of Nottingham letterhead Helping your GP to review your medicines Principal Investigator: Professor A J Avery Please complete the following: Please put a
circle round your answers
Have you read and understood the information sheet? YES / NO
Have you had an opportunity to ask questions and discuss this study? (if you have any questions you wish to ask, please contact one of the people listed on your information sheet) YES / NO
Have you received satisfactory answers to all your questions? YES / NO Have you received enough information about the study? YES / NO Do you understand that you are free to withdraw from the study:
at any time? YES / NO
without giving a reason for withdrawing? YES / NO
and without affecting your future medical care? YES / NO
I agree to allow a responsible employee from the University of Nottingham to view my medical notes YES / NO as part of the above study Name (please print)………….…………………………..………………………….. Signed……………………………………………………………..Date……………. Please return in the enclosed postage paid envelope to: Dr Sarah Rodgers, PINCER Trial Co-ordinator, FREEPOST MID 17779, Division of Primary Care, 13th Floor, Tower Building, University Park, Nottingham NG7 2RD.
Patient Safety Research Portfolio: PINCER Trial
Appendix 2: Written educational materials
PINCER trial evidence base for NSAIDs and gastrointestinal bleeding Updated on 22nd June 2006 Version 2d
Appendix 2.1: NSAIDs and gastrointestinal bleeding
What are the risks of gastrointestinal injuries with NSAIDS? NSAIDs are responsible for 3,500 hospital admissions and 400 deaths from ulcer bleeding each year in the UK.1,2 Symptomatic ulceration is thought to occur in between 1% and 4% of patients treated with NSAIDs.3 A number of factors increase the risk of gastrointestinal bleeds including age and previous history of peptic ulcer. The latter has been shown to increase the risks of further ulceration and/or gastrointestinal bleeds between three- and thirteen-fold in patients prescribed non-selective NSAIDs.3,4 What are the relative gastrointestinal risks of non-selective NSAIDs The Committee on Safety of Medicines (CSM) advice in the British National Formulary lists the relative safety of seven non-selective NSAIDs in relation to upper GI side-effects (see table 1).5 The CSM advises that the NSAIDs associated with low risk are generally preferred. The lowest recommended dose should be initiated and not more than one oral NSAID should be used at a time.
Table 1. Relative gastrointestinal safety of non-selective NSAIDs
Drug Risk of serious upper gastrointestinal side effects
What advice is available regarding the prescribing of NSAIDs in patients with a history of a peptic ulcer? All NSAIDs (including selective inhibitors of COX-2) are contra-indicated in patients with active peptic ulceration and non-selective NSAIDs in patients with a history of peptic ulcers.5 Patients with a history of gastrointestinal ulceration or bleeding have between a 3 and 13-fold increase in their risk of bleeding on an NSAID.3,4 In addition, the combination of NSAIDs and low-dose aspirin may increase the risk of gastrointestinal side-effects and this combination should only be used if absolutely necessary.4 How can the risk of gastrointestinal bleeding with NSAIDs be reduced? Reviews of randomised controlled trials have found that misoprostol, proton pump inhibitors (PPIs) and double dose H2 receptor antagonists are effective at preventing chronic NSAID related endoscopic gastric and duodenal ulcers.6,7 Only misoprostol 800 micrograms per day has been directly shown to reduce the risk of ulcer complications such as perforation haemorrhage, but it’s usefulness is limited by diarrhoea. Lower doses of misoprostol are less effective and are still associated with diarrhoea. A review by Jacobsen and Phillips stated that in patients with a history of
Patients with a history of peptic ulcer should not be prescribed NSAIDs without gastrointestinal protection
PINCER trial evidence base for NSAIDs and gastrointestinal bleeding Updated on 22nd June 2006 Version 2d
ulcer complications associated with NSAID therapy, neither cox-2 selective inhibitors nor PPIs may be effective in the secondary prophylaxis of ulcer complications. The safest approach in these high-risk patients may be to avoid NSAID therapy altogether.7
What place do COX-2 selective inhibitors have? COX-2 selective inhibitors have been shown to have a reduced risk of gastrointestinal events compared to non-selective NSAIDs.4,5,6, However, rofecoxib and valdecoxib have recently been withdrawn from the market following concerns about their cardiovascular safety profile. This is likely to be a class effect, and hence COX-2 selective inhibitors are now contraindicated in patients with established ischaemic heart disease, cerebrovascular disease, and moderate or severe heart failure. The balance of gastrointestinal and cardiovascular risk should be considered for all patients, especially those with risk factors for cardiovascular disease and those taking low dose aspirin.8 However, COX-2 selective inhibitors still have a role to play in patients at high risk of gastrointestinal ulceration, who do not have cardiovascular disease, or risk factors for it. These patients should be prescribed the lowest effective dose of COX-2 selective inhibitor for the shortest necessary time period. References 1. Langman, MJS. Ulcer complications associated with anti-inflammatory drug use. What is the extent of the disease burden? Pharmacoepi Drug Safety 2001;10:13 - 9 2. Hawkey, CJ & Langman MJS. Non-steroidal anti-inflammatory drugs: overall risks and management. Complementary roles for COX-2 inhibitors and proton pump inhibitors. Gut 2003;52:600 - 8 3. Cryer B. Management of NSAID-associated upper gastrointestinal problems. JMCP 2005; 11 (supplement 2): S2 – S9. 4. Laine L et al. Stratifying the risk of NSAID-related upper gastrointestinal clinical events: results of a double-blind outcomes study in patients with rheumatoid arthritis. Gastroenterology 2002;123:1006 - 12 5. Joint Formulary Committee. British National Formulary, 49th Edition. London: British Medical Association and The Royal Pharmaceutical Society of Great Britain, 2005. 6. Rostom A et al. Prevention of NSAID-induced gastroduodenal ulcers. The Cochrane Database of Systematic Reviews 2002, Issue 4. 7. Jacobsen RB & Phillips BB. Reducing clinically significant gastrointestinal toxicity associated with Nonsteroidal Antiinflammatory Drugs. Ann Pharmacother 2004; 38: 1469 - 81 8. Committee on Safety of Medicines. Updated advice on the safety of selective COX-2 inhibitors. Letter to healthcare professionals on 17th February 2005. Available from http://www.mhra.gov.uk/home/idcplg?IdcService=SS_GET_PAGE&ssDocName=CON1004250&ssSourceNodeId=227&ssTargetNodeId=221 (accessed 20th March 2006)
PINCER trial evidence base for betablockers in asthma Updated 28th September 2005 Version 5
Appendix 2.2: Betablockers in asthma
Traditionally, β-blockers have not been used in asthmatic patients because of the risk of bronchoconstriction. However, β-blockers are becoming increasingly useful in patients with cardiovascular disease, and the pressure to use them in asthmatics is increasing. Following case reports of bronchoconstriction in asthmatics caused by β-blockers, some resulting in death, the Committee on Safety of Medicines issued the following advice: “…β-blockers, even those with apparent cardioselectivity, should not be used in patients with asthma or a history of obstructive airways disease, unless no alternative treatment is available. In such cases the risk of inducing bronchospasm should be appreciated and appropriate precautions taken.”
β-blockers vary in their affinity for β 1- and β2-adrenoceptors, and are divided into two groups, cardioselective, and non-cardioselective (table 1). The majority show little selectivity for one receptor over the other, except for bisoprolol (14-fold greater affinity for β1-adrenoceptors) and timolol, sotalol and propranolol (26-fold, 12-fold, and 8-fold greater affinity for β2-adrenoceptors, respectively).
Table 1. Cardioselective and non-cardioselective betablockers
Do beta-blockers cause bronchoconstriction in asthmatics? Small-scale safety studies, detailed in table 1, confirm that non-cardioselective beta-blockers do cause bronchoconstriction, which can be severe in some asthmatics. A Cochrane review of short-term cardioselective beta-blocker use in reversible airways disease found a statistically significant 7.5% reduction in FEV1 with single-doses of beta-blockers, which was responsive to β2-agonist therapy (4.63% increase in FEV1). However, they did not find a statistically significant increase in respiratory symptoms, compared to placebo.1 There are also a small number of case reports of β-blockers causing bronchoconstriction in patients with a past-history of asthma.2
Do beta-blocker eye drops cause bronchoconstriction in asthmatics? A number of studies, detailed in table 2, have shown that topical timolol eye drops cause bronchoconstriction, and reduce the efficacy of bronchodilator therapy. Betaxolol eye drops do not appear to have this effect. As there are safe alternatives available, the use of timolol eye drops should be avoided in asthmatics.
Cardioselective beta-blockers1 (relative selectivity for β1-
Betablockers should be avoided in asthmatics (or those with a past history of asthma) unless there is no alternative.
PINCER trial evidence base for betablockers in asthma Updated 28th September 2005 Version 5
Should beta-blockers be used in patients with asthma? The use of non-cardioselective β-blockers should be avoided in asthmatics and probably those with a past history of asthma, due to the high risk of bronchoconstriction. However, short-term use of cardioselective β-blockers may be safe in patients with mild to moderate asthma. In patients with cardiovascular disease and mild to moderate asthma, it may be reasonable to start therapy with a low dose of cardioselective β-blocker, and titrate up according to response. These patients should be monitored frequently for signs of exacerbation, as there is limited evidence for long-term treatment with β-blockers in this patient group. Also, there is insufficient data to confirm the safety of cardioselective β-blockers in patients with severe asthma, and hence their use should be avoided. Table 1. Summary of studies of the effects of non-cardioselective beta-blockers on airway function in asthmatics.
Beta-blocker Effect on airways Type of study
Carvedilol5 6/12 patients with asthma withdrew from therapy secondary to wheezing.
Open-label study of carvedilol in patients with CHF and COPD or asthma.
Oxprenolol6 Worsening of airways obstruction in 6/11 patients without airways disease, and 7/12 patients with bronchitic asthma.
Double-blind controlled trial in COAD and non-COAD patients
Pindolol7 Pindolol caused a significant total decrease in FEV1 compared to placebo in > 50% of patients.
Placebo controlled study in asthmatics.
Pindolol8
No significant reduction in pulmonary function at rest or on exercise with Pindolol. However, a trend towards a reduction in airway function was observed.
Safety trial in mild to moderate, controlled asthmatics.
Propranolol9 Worsening of pulmonary function following propranolol 40mg, lasting for over four hours compared to placebo (p<0.01)
Sotalol10 Sotalol induced a significant reduction in FEV1.
Placebo controlled, double blind, single-dose, crossover study in asthmatics.
Timolol11
Asthmatic patients suffered bronchoconstriction following topical timolol eye drops, accompanied by a 32% reduction in FEV1. No change was seen in non-asthmatics.
Double blind, randomised, cross over trial in mild asthmatics and non-asthmatics
Timolol & Betaxolol12
Significant reduction in FEV1 seen with timolol eye drops, but no change seen with betaxolol eye drops
Double blind, randomised, cross over trial in patients with reactive airway disease
Timolol & Betaxolol13
Significant reduction in FEV1 seen with timolol, and reduction in response to bronchodilator. No change seen with betaxolol.
Double blind cross over study in asthmatics
References 1. Salpeter S et al. Cardioselective beta-blockers for reversible airway disease (Cochrane
Review). In: The Cochrane Library, Issue 4, 2003. Chichester, UK: John Wiley & Sons, Ltd.
2. Dart RA et al. Treatment of Systemic Hypertension in Patients With Pulmonary Disease: COPD and Asthma. Chest 2003; 123: 222-43
3. Baker JG. The selectivity of β-adrenoceptor antagonists at the human β1, β2 and β3 adrenoceptors. Br J Pharmacol 2005; 144: 317-322.
4. Joint Formulary Committee. British National Formulary, 49th Edition. London: British Medical Association and Royal Pharmaceutical Society of Great Britain, 2005.
5. Kotylar E et al. Tolerability of Carvedilol in patients with heart failure and concomitant chronic obstructive pulmonary disease or asthma. J Heart & Lung Trans 2002; 21: 1290-5.
PINCER trial evidence base for betablockers in asthma Updated 28th September 2005 Version 5
6. Addis GJ and Thorp JM. Effects of Oxprenolol on the airways on normal and bronchitic subjects. Eur J Clin Pharmacol 1976; 9: 259-63.
7. Sue DY et al. Beta-adrenergic blockade with Pindolol (LB-46) in mild to moderate asthma. Chest 1981; 80: 537-42.
8. Giulekas D et al. Influence of Pindolol on asthmatics and effect of bronchodilators. Respiration 1986; 50: 158 - 66.
9. Nordstrom LA et al. Effect of propranolol on respiratory function and exercise function in patients with chronic obstructive lung disease. Chest 1975; 67: 287 - 92.
10. Devereux G et al. Adverse effects of a single dose of (+)-sotalol in patents with mild stable asthma. Br J Clin Pharmacol 1998; 46: 79-82.
11. Bohm E and Fabel H. Changes in lung function following administration of eye drops containing Timolol, metipranolol, Pindolol and pilocarpine in healthy probands and patients with mild bronchial asthma. Klin Wochen 1987; 65: 920 - 4.
12. Schoene RB et al. Effects of topical betaxolol, timolol, and placebo on pulmonary function in asthmatic bronchitis. Am J Ophthalmol 1984; 97: 86 - 92.
13. Dunn TL et al. The effect of topical ophthalmic instillation of timolol and betaxolol on lung function in asthmatic subjects. Am Rev Resp Dis 1986; 133:264 - 8.
PINCER Trial evidence base for monitoring ACE inhibitors Updated on 21st September 2005 Version 3
Why monitor urea and electrolytes during ACE Inhibitor therapy? ACE Inhibitors are known to cause renal dysfunction and hyperkalaemia, to varying degrees. 1,2 However, they are also known to improve outcomes in a variety of cardiovascular conditions such as congestive cardiac failure, post-myocardial infarction and renal failure etc. Therefore, the benefits of treatment with ACE Inhibitors outweigh the risks in most cases. However, monitoring urea and electrolytes may reduce the risk of severe morbidity or mortality due to renal dysfunction and hyperkalaemia with ACE inhibitors. How many patients will develop renal dysfunction or hyperkalaemia? The proportion of patients who have suffered from renal dysfunction or hyperkalaemia during trials with ACE-Inhibitors is shown in table 1. In the first month of treatment, around 1% of patients experienced renal dysfunction or hyperkalaemia.3 This proportion increased with the duration of treatment, with over 8% of patients experiencing renal dysfunction after four years of treatment. Hence, there is an ongoing risk of developing renal dysfunction with continuing treatment, and renal function should be monitored at intervals (see below). Do all patients experiencing renal dysfunction or hyperkalaemia need to stop treatment with ACE Inhibitors?
Table 1 shows that not all patients who experienced renal dysfunction or hyperkalaemia required cessation of their ACE inhibitor. Some patients were controlled by dose reduction, or changes in other medication (e.g. cessation of drugs which can exacerbate renal dysfunction or hyperkalaemia). The NICE guideline for the treatment of congestive heart failure advises that:6 An increase in creatinine to 50% above baseline (or 200µmol/L) and a rise in
potassium to ≤ 5.9mmol/L is acceptable. If serum potassium rises to ≥ 6.0mmol/L or creatinine to >100% above baseline
(or >350µmol/L) then the ACE inhibitor should be stopped, and specialist advice sought.
How often should patients taking ACE Inhibitors have their urea and electrolytes monitored? The NICE guidelines for CCF6 state that stable patients with proven heart failure should be monitored every 6 months. In addition, urea and electrolytes should be checked prior to initiation of ACE-inhibitors, and following each significant dose increase.7 Other guidelines recommend that urea and electrolytes are checked annually, once a stable dose of ACE Inhibitor has been achieved.8
Patients aged 75 years and older taking ACE Inhibitors should have their urea and electrolytes monitored at least every 15 months
PINCER Trial evidence base for monitoring ACE inhibitors Updated on 21st September 2005 Version 3
Table 1. Proportion of patients suffering from renal dysfunction and/or hyperkalaemia in studies of ACE-inhibitors
Drug Renal dysfunction and hyperkalaemia Hyperkalaemia
Trial, Duration of study ACEI Placebo ACEI Placebo
Captopril ELITE, 48 weeks.4 0.8%dis 1.6%dis
Enalapril SOLVD, 40 months.5 1.2%*ob (0.7%)*dis
0.4%ob (0.1%)dis
Lisinopril ATLAS, 4 weeks.3 1.4%dis
Lisinopril <10mg daily ATLAS, 4 years.3 7.9%ob
(2.3%)dis
Lisinopril >30mg daily ATLAS, 4 years.3 8.4%ob
(2.4%)dis
Mixed Systematic review, average 35 months.1 5.2%*ob 3.6%*ob
Mixed Systematic review, average 30 days.2 1.3%*ob 0.6%*ob
* p<0.05 and/or significant difference between ACE inhibitor and placebo. dis Treatment discontinued as a result of renal dysfunction and/or hyperkalaemia ob Observed cases of renal dysfunction and/or hyperkalaemia
References 1. Flather MD et al. Long-term ACE-inhibitor therapy in patients with heart failure or left-
ventricular dysfunction: a systematic overview of data from individual patients. The Lancet, 2000; 355:1575-81.
2. ACE Inhibitor Myocardial Infarction Collaborative Group. Indications for ACE Inhibitors in the Early Treatment of Acute Myocardial Infarction: Systematic Overview of Individual Data From 100,000 Patients in Randomized Trials. Circulation, 1998; 97:2202-12.
3. Massie B et al. Toleration of high doses of angiotensin-converting enzyme inhibitors in patients with chronic heart failure. Results from the ATLAS trial. Arch Int Med 2001; 161:165-171.
4. Pitt B et al. Randomised controlled trial of losartan versus captopril in patients over 65 with heart failure (Evaluation of Losartan in the Elderly Study, ELITE). Lancet, 1997; 349:747-52.
5. Kostis JB et al. Adverse effects of enalapril in the Studies of Left Ventricular Dysfunction (SOLVD). SOLVD Investigators. Am Heart J 1996; 131:350-5.
6. National Collaborating Centre for Chronic Conditions. Chronic Heart Failure: Management of chronic heart failure in adults in primary and secondary care. Clinical guideline 5. 2003. London, National Institute for Clinical Excellence. Available from http://www.nice.org.uk/pdf/Full_HF_Guideline.pdf (accessed 1st June 2005)
7. Centre for Health Services Research and Medicines Evaluation Group. Prophylaxis for patients who have experienced a myocardial infarction: Drug treatment, cardiac rehabilitation and dietary manipulation. April 2001. National Institute for Clinical Excellence. Available from http://www.nice.org.uk/pdf/clinicalguidelinemiguidancenice.pdf (accessed 1st June 2005).
8. North West Medicines Information Service. Monitoring Drug Therapy. North West Drug Information Letter, 2002;120: 1.
PINCER trial evidence base for monitoring diuretics Updated on 21st September 2005 Version 4
Appendix 2.4: Monitoring Diuretics
Why monitor urea & electrolytes with loop and thiazide diuretics? Loop and thiazide diuretics are known to cause a dose-related reduction in sodium and potassium, as well as causing renal dysfunction through dehydration. Traditionally, thiazide diuretics have been associated with a higher risk of causing electrolyte disturbances. However, thiazide diuretics are now used in lower doses (i.e. bendroflumethiazide 2.5mg daily) for hypertension, and the risk of electrolyte disturbance is much lower than previously. Patients taking a combination of a loop and thiazide diuretics are the most likely to suffer a clinically important electrolyte disturbance. How frequently do diuretics cause electrolyte disturbances? Studies show varying frequencies of electrolyte disturbance, depending on the diuretic used, other medication taken by the patient, and the patient group studied. Table 1 shows frequencies up to 9.1% with serum sodium levels <130mmol/L2, and ranging from 2% to 5.6% with serum potassium levels ≤ 3.0mmol/L.1-4 In a large community-based cohort study, diuretics were the second most important group of drugs associated with preventable adverse drug events.5 Despite the wide range of frequencies of electrolyte disturbance shown, table 1 confirms that this is an important problem, where up to 9% of patients are at risk of morbidity as a result of electrolyte disturbance.2
How frequently do diuretics cause renal dysfunction? There is very little data on the frequency of renal dysfunction in patients taking diuretics. This is because patients are often taking other medication which will increase the risk of renal dysfunction (e.g. ACE Inhibitors or NSAIDs). Which patients have the highest risk of electrolyte disturbance? Elderly female patients, patients with liver cirrhosis and those with severe cardiac failure complicated by secondary hyperaldosteronism are at the highest risk of electrolyte disturbance. Patients taking digoxin or QT interval prolonging drugs, and those with serious organic heart disease are the most likely to experience arrhythmias as a result of hypokalaemia.6
How often should urea and electrolytes be monitored? There are no strict guidelines for monitoring electrolytes with diuretics. However, the NICE guidelines for Congestive Heart Failure recommend that patients should have urea and electrolytes taken 6 monthly at minimum.7 In addition, urea and electrolytes should be checked following dose changes and when patients are unstable (patients may require daily monitoring of urea and electrolytes when they are unstable). Patients being treated for CHF appear to be at the highest risk of electrolyte disturbance as they are often elderly, have poor renal function, and are taking higher doses of diuretics. Patients being treated for hypertension are usually prescribed low doses of thiazide diuretics, and are at a lower risk of electrolyte disturbance. However, patients still require their urea and electrolytes to be checked following initiation of treatment, dose changes and at regular intervals to ensure there has not been a progressive change in urea and electrolytes. There are no strict guidelines as to when this regular check should be done, but an annual check is often suggested.8
Patients aged 75 years and older taking diuretics should have their urea and electrolytes monitored at least every 15 months
PINCER trial evidence base for monitoring diuretics Updated on 21st September 2005 Version 4
Table 1. Frequency of electrolyte disturbance in patients taking diuretics Drugs studied Frequency of
hyponatraemia Frequency of hypokalaemia
Summary of study participants
Notes
Loop or Thiazide diuretics, with or without potassium sparing diuretics or potassium supplements1
11.2% <135mmol/L 0% <125mmo/L
13.7% <3.5mmol/L 5.6% ≤3.0mmol/L
Retrospective review of 161 nursing-home residents taking diuretics
No significant difference in prevalence of hypokalaemia seen between those taking or not taking potassium sparing diuretics or potassium supplements
Loop or Thiazide diuretics, with or without potassium sparing diuretics or potassium supplements2
29.2% <135mmol/L 9.1% <130mmol/L
20.1% <3.5mmol/L 4.0% <3.0mmol/L
353 patients taking diuretics out 929 patients consecutively admitted to a geriatric hospital
Of those not taking diuretics: 22.5% had serum sodium <135mmol/L and 20.1% had serum potassium <3.5mmol/L
Hydrochlorothiazide 50mg daily4
56% 3.0 – 3.5mmol/L 2.3% <3.0mmol/L
447 hypertensive patients
Data from literature review – original paper not seen.
Loop or Thiazide diuretics 4
24.9% <3.5mmol/L
870 patients taking loop or Thiazide diuretics in Sweden
Data from literature review – original paper not seen.
Loop diuretics3 4% <3.5mmol/L 2% <3.0mmol/L
1110 patients with normokalaemia on hospital admission, started on loop diuretics, not taking potassium supplements, potassium sparing diuretics or ACEI’s, with hypokalaemia on discharge.
Patients aged 75 years and over had a mean drop of 0.11mmol/L in potassium levels, compared to a drop of 0.01mmol/L in patients aged <75 years.
References 1. Clark BG et al. Female preponderance in diuretic-associated hypokalemia: a retrospective
study in seven long-term care facilities. J Am Geriatr Soc 1982; 30:316-321. 2. Byatt CM, et al. Diuretics and electrolyte disturbances in 1000 consecutive geriatric
admissions. J R Soc Med 1990; 83:704-708. 3. Zuccala G et al. Older age and in-hospital development of hypokalemia from loop
diuretics: Results from a multicenter survey. J Gerontol A Biol Sci Med Sci 2000; 55:M232-M238.
4. Greenberg A. Diuretic complications. Am J Med Sci 2000; 319:10-24. 5. Gurwitz JH, et al. Incidence and preventability of adverse drug events among older
persons in the ambulatory setting. JAMA 2003; 289:1107-1116. 6. McInnes G. Diuretics. In:. Dukes M, Aronson J. Meyler's Side Effects of Drugs. Elsevier
Science, 2000: 656-682. 7. National Collaborating Centre for Chronic Conditions. Chronic Heart Failure: Management
of chronic heart failure in adults in primary and secondary care. Clinical guideline 5. 2003. London, National Institute for Clinical Excellence. Available from http://www.nice.org.uk/pdf/Full_HF_Guideline.pdf (accessed 1st June 2005)
8. Knight EL & Avorn J. Quality Indicators for appropriate medication use in vulnerable elders. Ann Intern Med 2001;135:703-710.
PINCER Trial evidence base for combined oral contraceptives and previous thrombosis Updated 22nd August 2005 Version 4
Appendix 2.5: Combined Oral Contraceptives and Thrombosis
Combined oral contraceptives (COCs) are associated with an increased risk of thrombosis. Women with risk factors for thrombosis (see overleaf) are at an increased risk of thrombosis whilst taking a COC. The greatest risk factor for thrombosis is a previous history of thrombosis, and this represents an absolute contraindication to the use of COCs. If a woman is receiving warfarin, then the use of a COC can be considered, but when warfarin therapy ceases, the COC should stop also.1
What is the risk of venous thromboembolism with COC use? Venous thromboembolism (VTE) is thought to occur in 5 per 100,000 healthy non-pregnant women each year. The risk of VTE in pregnancy is much greater at 60 cases per 100,000 pregnancies per year. The risk with COCs lies between these figures, with levonorgestrel and norethisterone containing COCs associated with 15 cases per 100,000 women per year and desogestrel and gestodene containing COCs possibly having a higher risk at 25 cases per 100,000 women per year.2,3 This represents a three to five fold increase in VTE risk with COC use which becomes apparent within four months of starting and returns to that of non users within three months of discontinuation.3 Although there is an increased risk of VTE with COC use, it is still less than the risk of VTE in pregnancy. The magnitude of risk with topical contraceptives is not known.
What is the risk of myocardial infarction or stroke (arterial thrombosis) with COC use? The risk of myocardial infarction in young, healthy, non-smoking women taking COCs containing between 20mcg and 35mcg oestrogen is not raised.4 However, there appears to be a 2 to 3-fold increase in risk of ischaemic stroke for women who are smokers, and a 10-fold in crease in risk of MI.1, 5 There is a 1.5 fold increase in risk of ischaemic stroke in young, healthy women taking COCs, however, the baseline risk in this population is so low, the increase is not clinically significant. Women with risk factors such as increasing age, hypertension, migraine and/or smoking have at least an additional 3-fold increase in risk of haemorrhagic and ischaemic stroke with COCs, which is clinically significant.1, 4
What effect does oestrogen and progestogen content have on the thrombotic potential of COCs? The increased risk in thrombosis results from the oestrogenic effects of the COCs. Hence, high doses of oestrogen (>35 micrograms/day) are associated with a higher risk. To confuse matters further, progestogens can effect the oestrogenic activity. Levonorgestrel and norethisterone (second generation progestogens) have an antioestrogenic effect, whilst desogestrel and gestodene (third generation progestogens) do not. This is thought to be why the risk of VTE is slightly higher with third generation COCs, than second generation COCs.
Combined oral contraceptives are contraindicated in patients with a past history of venous or arterial thrombo-embolism
PINCER Trial evidence base for combined oral contraceptives and previous thrombosis Updated 22nd August 2005 Version 4
When should combined oral contraceptives be avoided? Women with a past history of, or two or more risk factors for, venous thromboembolism or arterial thrombosis, should not be prescribed COCs.2
Risk factors for venous thromboembolism include: • Past history of venous thromboembolism • Family history of venous thromboembolism in first degree relative aged under
45 years (avoid contraceptives containing desogestrel or gestodene) or if known prothrombotic coagulation abnormality e.g. factor V Leiden or antiphospholipid antibodies (including lupus anticoagulation)
• Obesity: body mass index above 30kg/m2 (avoid if body mass index above 39kg/m2)
• Long-term immobilisation e.g. in a wheelchair (avoid if confined to bed or leg in a plaster cast)
• Varicose veins (avoid during sclerosing treatment or where definite history of thrombosis)
Risk factors for arterial thrombosis include: • Past history of arterial thrombosis • Family history of arterial disease in first degree relative aged under 45 years
(avoid if atherogenic lipid profile) • Diabetes mellitus (avoid if diabetes complications present) • Hypertension: blood pressure above systolic 140 mmHg and diastolic 90 mmHg
(avoid if blood pressure above systolic 160 mmHg and diastolic 100 mmHg) • Smoking (avoid if smoking 40 or more cigarettes daily) • Age over 35 years (avoid if over 50 years) • Obesity (avoid if body mass index above 39 kg/m2) • Migraine: contra-indicated in migraine with typical focal aura; severe migraine
regularly lasting over 72 hours despite treatment; migraine treated with ergot derivatives; use with caution in migraine without focal aura; migraine controlled with 5HT1 agonist
Providing that women are informed of, and accept the relative risks of venous and arterial thrombosis, a joint decision on which kind of oral contraceptive to use should be made between the prescriber and the woman. The decision should be based on an individual’s medical history and any contra-indications.
References 1. John Guillebaud. Your questions answered. Contraception. Fourth Edition. 2004. Churchill Livingstone, London. 2. Joint National Formulary Committee. British National Formulary, 49th Edition. London: British Medical Association and The Royal Pharmaceutical Society of Great Britain, 2005. 3. Faculty of Family Planning and Reproductive Health Care Clinical Effectiveness Unit. FFPRHC Guidance (October 2003): First Prescription of Combined Oral Contraception. Journal of Family Planning and Reproductive Health Care 2003; 29: 209-223 4. Hannaford P. Cardiovascular Events Associated With Different Combined Oral Contraceptives: A Review Of Current Data. Drug Saf 2000; 22: 361-71 5. Rosenberg L et al. Low-Dose Oral Contraceptive Use and the Risk of Myocardial Infarction. Arch Int Med 2001; 161: 1065 – 70.
The PINCER trial evidence base for methotrexate dosage interval and monitoring Updated on 28th September 2005 Version 4
Appendix 2.6: Methotrexate dosageinterval and monitoring
What are the risks associated with methotrexate? Methotrexate has a range of potentially serious, dose related side effects, including;1 • Significant elevations in liver enzymes which can progress to atrophy, necrosis
and cirrhosis • Haematological toxicities e.g. leucopenia, thrombocytopenia and anaemia • Gastrointestinal toxicities e.g. nausea, vomiting and diarrhoea In addition, methotrexate can also cause a pneumonitis (not thought to be dose-related). Why should methotrexate be prescribed weekly not daily? Early trials with methotrexate showed that longterm toxicity of the liver was less common with weekly dosing than with daily dosing (e.g. 17.5mg weekly vs 2.5mg daily).2 Acute toxicity is less common at low doses of methotrexate (≤ 15mg per week). Of 25 deaths and 26 episodes of serious morbidity identified by the NPSA in England over a ten-year period, methotrexate prescribed daily rather than weekly was the most common error.3 Great care needs to be taken to avoid this very preventable prescribing error, which can result in severe toxicity or death. This issue is of such significance that the NPSA have released a patient safety alert about prescribing of methotrexate (see www.npsa.nhs.uk). Why should methotrexate be closely monitored? The severity of adverse effects such as liver and haematological toxicity can be minimised if they are caught early. A review of 673 patients taking methotrexate at a Staffordshire clinic between 1986 and 1999 found that 244 (36%) stopped taking methotrexate following adverse effects (including 36 (5.3%) gastrointestinal symptoms; 37 (5.5%) abnormal LFTs; 25 (3.7%) low white cell counts), 117 (48%) patients restarted treatment. 102 (15.2%) had potentially serious and 12 (1.8%) had life threatening side effects. Only one patient died as a direct result of methotrexate therapy.4 Patients were closely monitored by the clinic, and the potential severity of many side effects was reduced by early identification. When should methotrexate be monitored? The CSM advises that patients being treated with low dose, weekly, methotrexate, have full blood count, renal and liver function tests checked before starting treatment and repeated weekly until therapy is stabilised, thereafter patients should be monitored every 2–3 months.5 The British Society for Rheumatology recommends more frequent monitoring. Once therapy is stabilised full blood count and liver function tests should be undertaken fortnightly until six weeks after the last increase in dose, and providing they are stable, monthly thereafter.6
Prescriptions for methotrexate should specify a weekly dosing interval
The PINCER trial evidence base for methotrexate dosage interval and monitoring Updated on 28th September 2005 Version 4
References 1. Pharmacia Ltd. Summaries of Product Characteristics for Matrex. Electronic Medicines
Compendium . Last updated 2nd November 2004. (Available from www.medicines.org.uk; accessed 1st June 2005).
2. Kevat S et al. Hepatotoxicity of methotrexate in rheumatic diseases. Med Toxicol Adverse Drug Exp 1988; 3: 197-208.
3. National Patient Safety Association. Toward the safer use of methotrexate. National Patient Safety Association, London, 2004.
4. Kinder AJ et al. The treatment of inflammatory arthritis with methotrexate in clinical practice: treatment duration and incidence of adverse drug reactions. Rheumatology 2005; 44: 61 - 6.
5. Joint Formulary Committee. British National Formulary, 49th Edition. British Medical Association and The Royal Pharmaceutical Society of Great Britain, London, 2005.
6. British Society for Rheumatology. National guidelines for the monitoring of second line drugs. 2000 (Available from http://www.rheumatology.org.uk/guidelines/clinicalguidelines, accessed 1st June 2005).
PINCER trial evidence base for frequency of warfarin monitoring Updated on 17th August 2005 Version 3
Appendix 2.7: Monitoring the INR of patients taking warfarin
What proportion of patients suffer bleeding complications during oral anticoagulant therapy? The proportion of patients suffering any bleeding complication whilst on oral anticoagulants varies between studies, ranging from 4%1 to 18%.2 Major bleeding complications range from 2%3 to 11%4, depending on the study. Randomised controlled trials (RCTs) show a lower rate of bleeding than observational studies, this may be a reflection of tighter INR control in RCTs, and the inclusion of patients with a lower baseline risk of bleeding. What proportion of time are patients’ INRs within the recommended therapeutic range? The proportion of time when patients’ INRs are within the recommended therapeutic range ranges from 32%5 to 68%4 of patient years, depending on the study. Patients newly started on warfarin spend less time in the recommended therapeutic range than patients that have been taking warfarin for at least 3 months.1 More frequent INR monitoring results in more time spent within the therapeutic range.4 What are the risk factors for bleeding in patients taking oral anticoagulation? Numerous risk factors for bleeding have been identified in patients receiving oral anticoagulation. These include: Alcohol abuse2 Concomitant disease: Chronic renal insufficiency2,6, Serious heart disease6,
Cerebrovascular disease6 Previous gastrointestinal bleeding2 INR raised on last test7 or INR >3.58 Patients in their first year of oral anticoagulation1 Indication for anticoagulation6 Concomitant medications9 Aged >85 years8 Infrequent monitoring
This list is not exhaustive, and other risk factors do exist. For instance, the prescription of drugs which have the potential to increase the efficacy of warfarin, will increase the risk of a raised INR, and therefore the risk of bleeding. How can the risk of bleeding in patients taking oral anticoagulation be reduced? Studies have shown that the risk of bleeding is associated with an INR outside the therapeutic range, and the higher the INR7,8,10, the greater the risk of bleeding. In addition, specific indications for anticoagulation and concomitant diseases will increase the risk of bleeding in individual patients. Although these conditions are not contraindications to anticoagulation, they should be treated as reasons for caution with anticoagulation. Less frequent testing of the INR is associated with less time spent in the therapeutic range.4 This means that patients are more likely to have a raised INR, and an increased risk of bleeding complications. By increasing the frequency of INR monitoring in high risk patients e.g. newly started on oral anticoagulation, INR raised on last test, introduction of interacting drugs etc. the risk of major bleeding should be reduced.
Patients treated with warfarin should have their INR monitored at least every 12 weeks
PINCER trial evidence base for frequency of warfarin monitoring Updated on 17th August 2005 Version 3
How frequently should patients taking warfarin have their INR monitored? Specific guidance is available for the frequency of INR monitoring. The BNF states that it is essential for the INR to be determined daily or on alternate days in early days of treatment, then at longer intervals (depending on the response) then up to every 12 weeks.11 The British Society of Haematology concur in their guidelines that once stabilised the frequency of monitoring can be extended up to an interval of 12 weeks.12 However, The Scottish Intercollegiate Network’s guidelines for antithrombotic therapy are more cautious, suggesting that a well stabilised patient may only need an INR check every four to eight weeks.13
References 1. Copland M, et al. Oral anticoagulation and hemorrhagic complications in an elderly
population with atrial fibrillation. Arch Intern Med 2001; 161: 2125-2128. 2. McMahan DA, et al. Risk of major hemorrhage for outpatients treated with warfarin. J Gen
Intern Med 1998; 13(5):311-316. 3. Hollowell J, et al. The incidence of bleeding complications associated with warfarin
treatment in general practice in the United Kingdom. Br J Gen Pract 2003; 53: 312-314. 4. Palareti G, et al. Bleeding complications of oral anticoagulant treatment: an inception-
cohort, prospective collaborative study (ISCOAT). Italian Study on Complications of Oral Anticoagulant Therapy. Lancet 1996; 348:423-428.
5. Beyth R, et al. A multicomponent intervention to prevent major bleeding complications in older patients receiving warfarin. Ann Intern Med 2000; 133:687-695.
6. Levine M, et al. Haemorrhagic complications of anticoagulant treatment. Chest 1992; 102:352s-363s.
7. Hylek EM, et al. Prospective study of the outcomes of ambulatory patients with excessive warfarin anticoagulation. Arch Intern Med 2000; 160:1612-1617.
8. Fang MC, et al. Advanced age, anticoagulation intensity, and risk for intracranial hemorrhage among patients taking warfarin for atrial fibrillation. Ann of Int Med 2004; 141:745-752.
10. Hylek EM. Complications of oral anticoagulant therapy: bleeding and nonbleeding, rates and risk factors. Seminars in Vascular Medicine 2003; 3:271-278.
11. Joint Formulary Committee. British National Formulary. 49th Edition. London: British Medical Association and The Royal Pharmaceutical Society of Great Britain, 2005.
12. British Society of Haematology. Guidelines on Oral Anticoagulation, Third Edition. British Journal of Haematology 1998; 101:374-387.
13. Scottish Intercollegiate Guidelines Network. Antithrombotic Therapy. SIGN publication number 36. 1999 Available from http://www.sign.ac.uk/pdf/sign36.pdf (Accessed 1st June 2005).
The PINCER trial evidence base for monitoring lithium Updated on 17th August 2005 Version 2a
Appendix 2.8: Lithium monitoring
What are the risks associated with lithium therapy? Lithium therapy has a narrow therapeutic range (0.4 to 1.0mmol/L 12 hours post dose)1 and is associated with potentially serious, dose-dependent, side effects including: cardiac arrhythmias; ataxia; seizures; thyroid dysfunction; nausea, vomiting and diarrhoea; nephrogenic diabetes insipidus and renal impairment.2 Chronic toxicity increases the risk of severe neurotoxicity.3 A survey of 10,615 patients aged over 65 years taking lithium found that 413 (3.9%) were admitted to hospital at least once with lithium toxicity between 1992 and 2001. Of these hospitalisations, 5.4% were attributed to the recent introduction of a loop diuretic or angiotensin converting enzyme inhibitor.4 A number of drugs can interfere with the renal excretion of lithium, and careful monitoring is necessary. How frequently should lithium levels be monitored? Guidance on the frequency of monitoring lithium levels varies. The BNF states that serum lithium concentration should be measured every three months in patients on stabilised regimes.5 The SPCs for Priadel® liquid6 (lithium citrate) and tablets2 (lithium carbonate) and Li-Liquid® 7 (lithium citrate) state that after stabilisation monitoring should not normally exceed three months. The SPC for Liskonum® 8 (lithium carbonate) advises that levels are checked a minimum of once every two months after stabilisation, whilst that for Camcolit® 9 (lithium carbonate) specifies monthly monitoring. Guidelines from Southdowns NHS Trust also recommend monitoring lithium levels in stable patients every three months10 whilst a review in the drugs and therapeutics bulletin recommends monitoring every three to six-months once therapy is stable (but more frequently in elderly patients).1 References 1. Anonymous. Using lithium safely. Drugs & Therapeutics Bulletin 1999; 37(3):22-24. 2. Sanofi Synthelabo. Summary of Product Characteristics for Priadel® tablets.
(Available from http://emc.medicines.org.uk/, last updated 24th November 2004, accessed 1st June 2005).
3. Oakley PW et al. Lithium toxicity: an iatrogenic problem in susceptible individuals. Australian and New Zealand Journal of Psychiatry 2001; 35(6):833-840.
4. Juurlink DN et al. Drug-induced lithium toxicity in the elderly: a population-based study. Journal of the American Geriatrics Society 2004; 52:794-798.
5. Joint Formulary Committee. British National Formulary, 49th Edition. British Medical Association and The Royal Pharmaceutical Society of Great Britain, London, 2005.
6. Sanofi Synthelabo. Summary of Product Characteristics for Priadel® liquid. (Available from http://emc.medicines.org.uk/, last updated 17th September 2004, accessed 1st June 2005).
7. Rosemont Pharmaceuticals Ltd. Summary of Product Characteristics for Li-Liquid®. (Available from http://emc.medicines.org.uk/, last updated 20th August 2004, accessed 1st June 2005)
8. GlaxoSmithKline UK. Summary of Product Characteristics for Liskonum®. (Available from http://emc.medicines.org.uk/, last updated 2nd December 2004, accessed 1st June 2005).
9. Norgine Ltd. Summary of Product Characteristics for Camcolit®. Available from http://emc.medicines.org.uk/, last updated 16th May 2005, accessed 1st June 2005).
10. Sutherland J. Lithium monitoring. Southdowns Health, 2002. (Available from http://www.ukppg.org.uk/02-05-lithium-monitoring.rtf, accessed 1st June 2005)
During lithium therapy, levels should be checked every three months
PINCER trial evidence base for monitoring thyroid function with amiodarone Updated 17th August 2005 Version 3
Appendix 2.9: Monitoring Thyroid Function with Amiodarone
How common are hypo- and hyperthyroidism with amiodarone? Studies show that thyroid dysfunction is relatively common with amiodarone, occurring in up to one-third of patients. The proportion of patients suffering from hypothyroidism with amiodarone ranges from 1 to 32% in the reported studies, but is usually around 3% in randomised controlled trials.1-4 There is a similarly wide range for the proportion of patients suffering from hyperthyroidism with amiodarone (1% to 23%), but again, in randomised controlled trials, usually around 1% of patients are affected. 1-4 More detail of these studies is shown in Table1. What are the risk factors for the development of thyroid dysfunction? The incidence of hypo- and hyperthyroidism is dependent on the dietary intake of iodine. In areas with low iodine intake, hyperthyroidism is more prevalent. However, in countries with a high iodine intake e.g. UK, hypothyroidism is more prevalent.5,6 Other risk factors for thyroid dysfunction are thought to be: • Dose of amiodarone – the lower the dose, the lower the risk.5 However, not all
studies support dose as a risk factor.2,7 • Pre-existing thyroid disease as a risk factor for hypothyroidism.6 • Female sex as a risk factor for hypothyroidism.5-7 When should thyroid function be monitored? Since pre-existing thyroid dysfunction is a risk factor for hypothyroidism with amiodarone, it is advisable to test thyroid function before initiating treatment. Thyroid function tests should be repeated after 3 months, and if symptoms suggestive of thyroid disease occur. Thyroid dysfunction can occur at any time during treatment with amiodarone and it is advisable to continue monitoring thyroid function at intervals throughout therapy. The summary of product characteristics for amiodarone (Cordarone X) and the BNF advise 6 monthly monitoring.8,9 Thyroid dysfunction has been reported to occur within 2 months of starting amiodarone therapy, and as long as 2 months after amiodarone has stopped.6,7 It is thought that thyroid dysfunction continues to be a risk for months after amiodarone has been stopped.10 References 1. Harjaj KJ, et al. Effects of amiodarone on thyroid function. Ann Intern Med 1997; 126:63-
73. 2. Vorperian VR, et al. Adverse effects of low dose amiodarone: a meta-analysis. J Am Coll
Cardiol 1997; 30:791-8. 3. Cairns JA, et al. Randomised trial of outcome after myocardial infarction in patients with
frequent or repetetive ventricular premature depolarisations: CAMIAT. Lancet 1997; 349:675-82.
4. Julian DG, et al. Randomised trial of effect of amiodarone on mortality in patients with left-ventricular dysfunction after recent myocardial infarction: EMIAT. Lancet 1997; 349:667-74.
5. Thorne SA, et al. Amiodarone associated thyroid dysfunction: Risk factors in adults with congenital heart disease. Circulation 1999; 100:149-54.
6. Tavackoli S, et al. Amiodarone-induced thyrotoxicosis. Am J Med Sci 1997; 314:97-100. 7. Martino E, et al. The effects of amiodarone on the thyroid. Endocr Rev 2001; 22:240-54.
Thyroid function should be checked before starting amiodarone, and every six-months during treatment
PINCER trial evidence base for monitoring thyroid function with amiodarone Updated 17th August 2005 Version 3
8. Sanofi Synthelabo. Specific Product Characteristics: Cordarone X (Amiodarone). Available from: http://emc.medicines.org.uk/. Last updated 31 May 2004. Accessed 5 Apr. 2005
9. Joint Formulary Committee. British National Formulary. 49th edition. London: British Medical Association and The Royal Pharmaceutical Society of Great Britain, 2005.
10. Bartalena L, et al. Diagnosis and management of amiodarone-induced thyrotoxicosis in Europe: results of an international survey among members of the European Thyroid Association. Clin Endocrinol (Oxf) 2004; 61:494-502.
PINCER trial evidence base for monitoring thyroid function with amiodarone Updated 17th August 2005 Version 3
Table 1. Proportion of patients suffering hyper- or hypothyroidism with amiodarone.
Number of patients: Study Taking
amiodarone Suffering
hypothyroidismSuffering
hyperthyroidismNotes
Tavackoli et al (1997)6
2461 7% (9% subclinical)
5% (16% subclinical)
Review of 20 English-language studies
Thorne et al (1999)5 92 15% 21%
Survey of patients with congenital heart defects taking amiodarone for more than 6months.
Harjai et al (1997)1 NA 1% to 32% 1% to 23%
Summary of previous studies in review paper.
Vorperian et al2
738 (amiodarone)
727 (placebo)
27 (3.7%) amiodarone 3 (0.4%) placebo
Meta-analysis of four RCTs looking at the side effects of Amiodarone. Significant difference in the occurrence of thyroid toxicity between amiodarone and placebo (p <0.001)
Cairns et al (1997)3
606 (amiodarone)
596 (placebo)
20 (3.3%) amiodarone
1 (0.2%) placebo
4 (0.6%) amiodarone
4 (0.7%) placebo.
RCT comparing 606 patients on amiodarone with 596 patients on placebo. Significant difference between occurrence of hypothyroidism (p<0.05), but no significant difference for occurrence of hyperthyroidism)
Julian et al (1997)4
743 (amiodarone)
743 (placebo)
11 (1.5%) amiodarone 0 placebo
12 (1.6%) amiodarone
4 (0.5%) placebo
RCT comparing 743 patients on amiodarone with 743 patients on placebo.
PINCER trial evidence base for dosing amiodarone Updated on 17th August 2005 Version 2
Appendix 2.10: Amiodarone dosing
Dose Related Side Effects of Amiodarone Amiodarone has a broad range of toxicities, many of which are related to the daily dose, or cumulative dose administered. These include pulmonary fibrosis, gastrointestinal effects, neuropathies, and thyroid and hepatic dysfunction (Table 1).1 Table1. Dose related toxicities of amiodarone1-7
Organ system Toxicity Relation to dose
Lung Pulmonary fibrosis Related to daily dose
Nausea, anorexia, constipation
Gastrointestinal
Hepatic dysfunction
Related to daily dose
Central Nervous System Ataxia, paraesthesias, peripheral polyneuropathy, sleep disturbance, impaired memory
Related to daily dose
Thyroid Hyperthyroidism or hypothyroidism
Related to cumulative dose
Skin Blue discolouration Related to cumulative dose
Mechanisms of Thyroid Toxicity Amiodarone has a high iodine content (two atoms per molecule) and is structurally related to thyroid hormones.4 The type of thyroid toxicity caused by amiodarone largely depends on two factors:7 Dietary intake of iodine (high in developed countries, low in developing countries) Underlying thyroid disease
In patients with a high iodine intake, the high iodine content of amiodarone inhibits the production of triiodothyronine, causing a drop in levels of 20-25%. If a patient has a predisposition to hypothyroidism or hyperthyroidism (e.g. subclinical disease), then the amiodarone will likely cause progression to either hyper- or hypothyroidism. In patients with a low dietary iodine intake, the increased iodine consumption can stimulate production of triiodothyronine, resulting in hyperthyroidism. Hypothyroidism caused by amiodarone can be safely treated with thyroxine, and pre-existing hypothyroidism does not represent a contraindication to starting amiodarone. However, hyperthyroidism will often necessitate withdrawal of amiodarone and treatment of the hyperthyroidism; Amiodarone is contraindicated in pre-existing hyperthyroidism.1
The lowest possible dose of amiodarone should be used to avoid unnecessary toxicity
PINCER trial evidence base for dosing amiodarone Updated on 17th August 2005 Version 2
Loading Doses Amiodarone has a long half-life and its onset of action can be delayed when used orally. Hence, a loading dose is used.1 There are two commonly used regimens: • 200mg three times daily for seven days, 200mg twice daily for seven days, then
200mg once daily as maintenance.1 • 400mg three times daily for seven days, then 200mg daily as maintenance. Because amiodarone should be started in hospital, knowledge of these loading regimens may be limited in primary care, and patients may be inadvertently continued on inappropriately high doses once they are discharged to home. Continuing higher doses increases the risk of serious toxicity.8 Maintenance Doses The maintenance dose of amiodarone for the majority of patients is 200mg daily. However, it is good practice to use the minimum dose which controls the arrhythmia, which can be as little as 50mg daily.1,9,10 In contrast, some patients will need up to 400mg daily to control their arrhythmia, however this is rare, and the need for the increased dose should be regularly reviewed.
References 1. Sanofi Synthelabo. Specific Product Characteristics: Cordarone X (Amiodarone).
Available from: http://emc.medicines.org.uk/. Last updated 31 May 2004. Accessed 5 Apr. 2005
2. Goldschlager N, et al. Practical guidelines for clinicians who treat patients with amiodarone. Practice Guidelines Subcommittee, North American Society of Pacing and Electrophysiology. Arch Intern Med 2000; 160:1741-8.
3. Stelfox HT, et al. Monitoring amiodarone's toxicities: recommendations, evidence, and clinical practice. Clin Pharmacol Ther 2004; 75:110-22.
4. Bouvy ML, et al. Amiodarone-induced thyroid dysfunction associated with cumulative dose. Pharmacoepidemiology & Drug Safety 2002; 11:601-6.
5. Heger JJ, et al. Relationships between amiodarone dosage, drug concentrations, and adverse side effects. Am Heart J 1983; 106:931-5.
6. Adams GD, et al. Amiodarone-induced pneumonitis. Assessment of risk factors and possible risk reduction. Chest 1988; 93:254-63.
7. Klein I, et al. Mechanisms of Disease: Thyroid Hormone and the Cardiovascular System. N Engl J Med 2001; 344:501-9.
8. Morady F, et al. Long-term efficacy and toxicity of high-dose amiodarone therapy for ventricular tachycardia or ventricular fibrillation. Am J Cardiol 1983; 52:975-9.
9. Mahmarian JJ, et al. Exploring the minimal dose of amiodarone with antiarrhythmic and hemodynamic activity. Am J Cardiol 1994; 74:681-6.
10. Lee KL, et al. Long-term low-dose amiodarone therapy in the management of ventricular and supraventricular tachyarrhythmias: efficacy and safety. Clin Cardiol 1997; 20:372-7.
Patient Safety Research Portfolio: PINCER Trial
Appendix 3: Protocol for dealing with serious adverse events in the pincer trial
Background Below is a list of serious adverse events that might occur in study practices in patients identified by the PINCER Trial outcome measures. Outcome measure
Potential adverse event
1 Serious GI bleed in a patient with a history of peptic ulcer receiving a non-selective NSAID without PPI cover
2 Serious asthma attack in a patient with a history of asthma who has been prescribed a beta-blocker
3 Admission to hospital with a serious electrolyte disturbance or dehydration in a patient aged 75 years and older who has been prescribed an angiotensin converting enzyme inhibitor (ACEI) or a loop diuretic long-term who has not had a recorded check of their renal function and electrolytes in the previous 15 months
4 Venous or arterial thrombosis in a woman with a past medical history of venous or arterial thrombosis who has been prescribed a combined hormonal contraceptive (CHC)
5 Serious haematological or liver problem in a patient receiving methotrexate for at least three months who has not had a recorded full blood count and / or liver function test within the previous three months
6 Serious bleed associated with high INR, or thromboembolic event associated with low INR, in a patient receiving warfarin for at least three months who has not had a recorded check of their international normalised ratio (INR) within the previous 12 weeks
7 Lithium toxicity in a patient receiving lithium for at least 3 months who has not had a recorded check of their lithium levels within the previous 3 months
8 Thyrotoxicosis in a patient receiving amiodarone for at least 6 months who has not had a thyroid function test within the previous 6 months
9 Toxic effects from methotrexate overdose in a patient receiving prescriptions of methotrexate without instructions that the drug should be taken weekly
10 Toxic effects from amiodarone overdose in a patient receiving prescriptions of amiodarone for at least one month without instructions to take a dose of 200mg or less per day
Given that the outcome measures are based on identifying patients at risk from a serious adverse event, rather than adverse events themselves, the study team will not automatically be made aware of all patients suffering such events. In some cases we will learn of adverse events, if they occur. For example, we intend to collect information on adverse events for the health economic analysis, but this will take place only for those patients giving prior consent (currently 30-40% of patients are giving consent to be involved in this part of the study). Also, for these patients, data collection will take place at least one year after the intervention has been completed in a particular practice. In general practices receiving pharmacist intervention, it is possible that the pharmacists will come across patients who have suffered a serious adverse event. Overall, it is clear that we do not have a reliable way of identifying all serious adverse events involving patients identified by the PINCER Trial outcome measures. The main reason for this (as outlined above) is that the trial was designed to investigate changes in proportions of patients at risk rather than adverse events themselves.
Also, we decided to use anonymised data in order to increase the generalisability of the results and not to adversely affect the relationship between general practices and their patients. Assuming that it would not be appropriate to alter the study protocol to include obtaining information on individual patients without their consent, we suggest that the protocol for dealing with serious adverse events should relate only to those adverse events that the study team is made aware (e.g. through the study pharmacists or the health economic analysis). Protocol It is the responsibility of general practices to deal appropriately with serious adverse events involving their patients. This includes:
• Prompt action to deal with the adverse event, which might include referral to hospital
• An explanation to the patient of what has gone wrong and why, including admission of fault if an error has occurred
For serious adverse events that come to the attention of study pharmacists, or the study team (through viewing patients’ records as part of the health economic analysis), we will ensure that information about these events is fed back to the practices with a request that they deal with the information through their usual mechanisms of handling significant events (e.g. discussion at a significant events audit meeting). If study pharmacists, or member of the study team, have very serious concerns about the performance of a practice in relation to an adverse event, they will discuss this with the Chief Investigator to agree on the most appropriate course of action, which may include a formal report to PCT Clinical Governance Lead. Any such actions will be recorded in project files and the DMEC (Data Monitoring and Ethics Committee for the trial) will be provided with an anonymised report.
Professor Tony Avery February 2007
Patient Safety Research Portfolio: PINCER Trial
Appendix 4: Mortality data letter
The PINCER Trial: A cluster randomised trial to determine the effectiveness, costs/benefits and acceptability of a pharmacist-led, IT-based intervention compared with simple feedback in reducing rates of clinically important instances of potentially hazardous prescribing and medicines management in general practice PINCER exception list request letter Version 2, May 2009
University letterhead Practice Manager Practice Name Address Date Dear Practice Manager Re: The PINCER Trial I am writing to thank your practice for taking part in the PINCER Trial and to ask for your help in reporting our findings. Would you be able to check the list of names from our initial audit dated Baseline date to see if any of your patients deceased or left the practice on or before date 12-months post end of intervention, please? The names will be inside the PINCER practice file on a sheet headed ‘Exceptions’. We only need to know how many PINCER patients died or left during that 15 month period – we do not need to know any of their personal details (e.g. names, identification numbers, etc.). We would be very grateful if you could complete the enclosed ‘PINCER patient numbers’ sheet and return it in the pre-paid addressed envelope. If you need any help locating the original audit contact Martin Eden on 0161 275 8356 or [email protected] . Thanks again for all your help over the past couple of years. Yours sincerely
Professor Tony Avery PINCER Trial Chief Investigator
Practice Code
The PINCER Trial: A cluster randomised trial to determine the effectiveness, costs/benefits and acceptability of a pharmacist-led, IT-based intervention compared with simple feedback in reducing rates of clinically important instances of potentially hazardous prescribing and medicines management in general practice PINCER exception list request letter Version 2, May 2009
PINCER Patient Numbers
Please enter the relevant number of patients in each of the yellow boxes below. Use ‘Not applicable’ if none of your patients died or left your practice
Number of patients identified on Baseline date at your practice
99
Number of those identified patients who left your practice between Baseline date and date 12-
months post end of intervention
Number of those identified patients who died between
Baseline date and date 12-months post end of intervention
Practice Code Please complete and return this sheet using the pre-paid addressed envelope provided to:
Martin Eden School of Pharmacy and Pharmaceutical Sciences 1st Floor, Stopford Building University of Manchester Oxford Road Manchester M13 9PL
Patient Safety Research Portfolio: PINCER Trial
Appendix 5: Analyses adjusted only for stratum and for stratum and baseline medication-related problems and sub-group analyses
Appendix 5.1: Prevalence of prescribing and monitoring problems at 6 months follow-up by treatment arm (with subgroup analyses and interactions shown)
Outcome Simple feedback arm (%)
Pharmacist intervention arm (%)
Odds ratio (95% CI)* ICC
Primary outcome measures History of peptic ulcer with NSAID and without PPI prescription/History of PU without PPI prescription
86/2014 (4.3) 51/1852 (2.8) 0.64 (0.43, 0.93) p=0.02 n=3866 (S) 0.63 (0.42, 0.95) p=0.03 n=3434 (S,B) 0.58 (0.38, 0.89) p=0.01 n=3434 (S,B,D,T) **Interaction with list size (S) p=0.91 **Interaction with list size (S,B) p=1.00 **Interaction with deprivation (S) p=0.59 **Interaction with deprivation (S,B) p=0.38
0.017 1.02x10⁻⁶ 4.68x10⁻⁷
Asthmatics prescribed a beta-blocker/Asthmatics
658/22224 (3.0) 499/20312 (2.5) 0.83 (0.71, 0.98) p=0.03 n=42536 (S) 0.76 (0.62, 0.94) p=0.01 n=39235 (S,B) 0.73 (0.58, 0.91) p=0.006 n=39235 (S,B,D,T) **Interaction with list size (S) p=0.82 **Interaction with list size (S,B) p=0.41 **Interaction with deprivation (S) p=0.29 **Interaction with deprivation (S,B) p=0.54
0.014 2.39x10⁻⁷ 3.50x10⁻⁷
Aged ≥ 75 on long term ACEI or diuretics without U&E in last 15 months/ Aged ≥ 75 on long term ACEI or diuretics
436/5329 (8.2) 255/4851 (5.3) 0.69 (0.45, 1.06) p=0.099 n=10180 (S) 0.54 (0.35, 0.82) p=0.006 n=8185 (S,B) 0.51 (0.34, 0.78) p=0.003 n=8185 (S,B,D,T) **Interaction with list size (S) p=0.56 **Interaction with list size (S,B) p=0.90 **Interaction with deprivation (S) p=0.48 **Interaction with deprivation (S,B) p=0.43
0.16 0.15 0.14
Outcome Simple feedback arm (%)
Pharmacist intervention arm (%)
Odds ratio (95% CI)* ICC
Secondary outcome measures Asthmatics without a CHD code prescribed a beta-blocker/ Asthmatics without a CHD code (excludes those without a CHD code at 6 months)
Women with a past history of venous or arterial thrombosis who have been prescribed the combined oral contraceptive pill/ Women with a past history of venous or arterial thrombosis
Patients prescribed lithium for at least 3 months who have not had lithium level in the last 3 months/patients prescribed lithium for at least 3 months
Patients prescribed amiodorone for at least 1 month who are prescribed a dose of more than 200mg daily/patients prescribed amiodarone for at least 1 month
1/228 (0.4) 1/228 (0.4) 0.96 (0.06, 15.55), p=0.97, n=456 (S) Not calculable (S,B) Not calculable (S,B,D,T)
2.1x10⁻⁵
Patients with at least one prescribing problem/patients at risk of at least one prescribing problem
* adjusted for randomisation stratum (S), baseline prevalence of errors (B), deprivation (D), training status (T) ** includes interaction between treatment arm and continuous covariate
Appendix 5.2: Prevalence of prescribing and monitoring problems at 12-months follow-up by treatment arm (with subgroup analyses and interactions shown)
Outcome Simple feedback arm (%)
Pharmacist intervention arm (%)
Adjusted odds ratio* (95% CI) ICC
Primary outcome measures History of peptic ulcer with NSAID and without PPI prescription/History of PU without PPI prescription
78/2035 (3.8) 61/1852 (3.3)
0.87 (0.62, 1.23) p=0.43, n=3887 (S) 0.93 (0.62, 1.41) p=0.75, n=3331 (S,B) 0.91 (0.59, 1.39) p=0.65, n=3331 (S,B,D,T) **Interaction with list size (S) p=0.76 **Interaction with list size (S,B) p=0.61 **Interaction with deprivation (S) p=0.52 **Interaction with deprivation (S,B) p=0.36
7.94x10⁻⁷ 6.75x10⁻⁷ 6.54x10⁻⁷
Asthmatics prescribed a beta-blocker/Asthmatics
692/23520 (2.9) 545/21359 (2.6) 0.87 (0.73, 1.03) p=0.11, n=44879 (S) 0.77 (0.63, 0.95) p=0.02, n=39221 (S,B) 0.78 (0.63, 0.97) p=0.02 n=39221 (S,B,D,T) **Interaction with list size (S) p=0.77 **Interaction with list size (S,B) p=0.85 **Interaction with deprivation (S) p=0.21 **Interaction with deprivation (S,B) p=0.19
0.02 0.009 0.008
Aged ≥ 75 on long term ACEI or diuretics without U&E in last 15 months/ Aged ≥ 75 on long term ACEI or diuretics
452/5813 (7.8) 306/5242 (5.8) 0.72 (0.49, 1.06) p=0.10, n=11055 (S) 0.60 (0.39, 0.90) p=0.02, n=7848 (S,B) 0.63 (0.41, 0.95) p=0.03, n=7848 (S,B,D,T) **Interaction with list size (S) p=0.50 **Interaction with list size (S,B) p=0.37 †Interaction with deprivation (S) p=0.78 †Interaction with deprivation (S,B) p=0.88
0.13 0.14 0.13
Outcome Simple feedback arm (%)
Pharmacist intervention arm (%)
Adjusted odds ratio* (95% CI) ICC
Secondary outcome measures Asthmatics without a CHD code prescribed a beta-blocker/ Asthmatics without a CHD code
Women with a past history of venous or arterial thrombosis who have been prescribed the combined oral contraceptive pill/ Women with a past history of venous or arterial thrombosis
Patients prescribed lithium for at least 3 months who have not had lithium level in the last 3 months/patients prescribed lithium for at least 3 months
Patients prescribed methotrexate without instructions that the drug should be taken weekly/patients prescribed methotrexate
13/309 (4.2) 0/271 (0.0) Not calculable (S) Not calculable (S,B) Not calculable (S,B,D,T)
Patients prescribed amiodorone for at least 1 month who are prescribed a dose of more than 200mg daily/patients prescribed amiodarone for at least 1 month
1/231 (0.4) 1/232 (0.4) 0.95 (0.06, 15.45), p=0.97, n=463 (S) Not calculable (S,B) Not calculable (S,B,D,T)
1.07x10⁻⁵
Patients with at least one prescribing problem/patients at risk of at least one prescribing problem
* adjusted for randomisation stratum (S), baseline prevalence of errors (B), deprivation (D), training status (T) ** includes interaction between treatment arm and continuous covariate † includes interaction between treatment arm and covariate dichotomis
Patient Safety Research Portfolio: PINCER Trial
Appendix 6: Pharmacist record forms
Pincer Trial Pharmacist Record Form Version 2, June 2006
Pharmacist Record Forms
Trial
Name of Pharmacist:
Practice:
Code number:
Pincer Trial Pharmacist Record Form Version 2, June 2006
Outcome Measures
Primary Outcome Measures 1 Patients aged 16 and over with a history of peptic ulcer who have been prescribed a non-selective NSAID
• More specifically, those with a computer-coded diagnosis of peptic ulcer disease, at least six-months prior to data collection, who have a computer record for one or more prescriptions for a non-selective NSAID in the six-months prior to data collection who have NOT also had a prescription for a PPI within that six-month period
2 Patients aged 16 and over with asthma who have been prescribed a beta- blocker:
• More specifically those with a computer-coded diagnosis of asthma, at least six-months prior to data collection, who have a computer record of one or more prescriptions for a beta-blocker (oral or eye drops) in the six-months prior to data collection
3 Patients aged 75 years and older who have been prescribed an ACE inhibitor or a loop diuretic long-term who have NOT had a
computer-recorded check of their renal function and electrolytes in the previous 15 months: • More specifically, long-term prescribing implies a first prescription for an ACE inhibitor or a loop diuretic at least 15 months before
the time of data collection and at least one prescription in the six-months beforehand
Secondary outcome measures Contraindicated prescribing 4 Women with a past medical history of venous or arterial thrombosis who have been prescribed the combined oral contraceptive pill Inadequate monitoring 5 Patients receiving methotrexate for at least three months who have not had a recorded full blood count and/or liver function test within
the previous three months 6 Patients receiving warfarin for at least three months who have not had a recorded check of their INR (International Normalised Ratio)
within the previous 12 weeks 7 Patients receiving lithium for at least 3 months who have not had a recorded check of their lithium levels 8 Patients receiving amiodarone for at least 6 months who have not had a thyroid function test within the previous 6 months Dosing problems 9 Patients receiving prescriptions of methotrexate without instructions that the drug should be taken weekly 10 Patients receiving prescriptions of amiodarone for at least one month without instructions to take a dose of 200mg or less per day
Pincer Trial Pharmacist Record Form Version 2, June 2006
Pharmacist Record Form – summary sheet
*patient’s unique number within the practice Codes for action recommended/completed: 1 Correct coding error 7 Arrange blood tests 2 Add codes (e.g. blood test results) 8 Alter dose instructions for methotrexate 3 Add PPI 9 Alter dose instructions for amiodorone 4 Stop NSAID 10 Other action not specified above 5 Stop beta blocker 11 No action 6 Stop combined oral contraceptive pill
Reason for patient being identified by Quest Browser search (please tick)
Date
Patient ID*
Age
Gender (M/F)
Initials GP
Outcome Measure Number Coding
error Info available in
records but not coded
Patient “at risk”
other
Action recommended by pharmacist
Action completed
Time taken (mins)
Pharmacist initials
and date completed
Pincer Trial Pharmacist Record Form Version 2, June 2006
Pharmacist Record Form – action plan for each patient Practice code: Date: Patient ID: Initials pharmacist: Outcome measure number: Initials GP: Action recommended by pharmacist: please write in the box below
GP comments (optional): please write in the box below
Action taken (including who took action and time taken) or reason for no action: please write in the box below
Time taken:
Pincer Trial Pharmacist Record Form Version 2, June 2006
Patient Contact Form
Practice code: Initials pharmacist: Patient ID: Initials GP: Outcome measure number: Type of contact: please tick Letter please attach anonymised copy Date:
Telephone call Date:
Personal contact please indicate: Date:
GP
Pharmacist
Practice Nurse Summary of contact:
Pincer Trial Pharmacist Record Form Version 2, June 2006
Pharmacist Record Form – general action plan Practice code: Initials pharmacist: Action taken: please write in the box below giving the date of the action, the action taken, the job title of the person who took the action and the time taken
Date Action taken and by whom Time taken
Patient Safety Research Portfolio: PINCER Trial
Appendix 7: Interview schedules and focus group topic guides for qualitative study
Appendix 7.1: Interview Schedules Brief Interviews Introduction (used for all telephone interviews):
• Thanks a lot for taking part in this part of the PINCER trial. The interview should take no longer than … minutes.
• Brief reminder of the aims • Do you have any questions about the study or do you feel the information you
received is sufficient? • And you are still ok with the interview being audio-taped and transcribed? • The transcripts will be anonymised, anything you say during the interview will
be confidential, you can ask for the interview to be stopped at any time
Please note: Theses schedules/topic guides were used as guidance only and not in all interviews all of the topics were covered as participants were encouraged to raise issues important to them.
Pharmacists 1. In your opinion, which are the main issues in prescribing safety in general
practice? 2. Is there anything that particularly appeals to you in this project? What? Why? 3. In your opinion, what are the positive and negative aspects of the PINCER
trial? (Any concerns/problems? Which aspect is running particularly smoothly/effectively? Why?)
4. What do you feel about the outcome measures that have been chosen for the trial?
5. What is your experience of the training? (Did the training prepare you for the task? Is there anything that you would have done differently in the training?)
6. How do you feel the PINCER trial is working so far? (What is your experience of the PINCER trial? How was it to be introduced in the practice? How is your relationship with the practice staff? How do you feel received in the practice?)
7. Do you feel the PINCER trial will be effective in reducing prescribing errors in general practice? (If it works, why do you think this will be? If it doesn’t work, why do you think this will be? Do you think after you left things will be kept up?)
8. Is there anything that you would have done differently in implementing the PINCER trial? (Thinking about what has been happening in the practice and your role during the intervention period)
9. What are your expectations of this project? (What do you think it will achieve/lead to?)
10. How do you see your role in bringing this about? (Do you think you can contribute to these expectations with your behaviour?)
11. If the PINCER trial was shown to be effective, what do you think will help to make it work if it is to be rolled-out on a larger scale? (Across England)
12. How do you think practices can be motivated to implement interventions like the PINCER trial?
13. If after the study has finished, you were offered a pharmacist post similar to that in the PINCER trial, would you want to do the job? Why/why not?
14. Is there anything else that you would like to say? Do you have any suggestions?
GPs – Pharmacist Intervention Arm 1. In your opinion, which are the main issues in prescribing safety in general
practice? 2. What is your sense of what the PINCER trial is? 3. Is there anything that particularly appeals to you in this project? What? Why? 4. In your opinion, what are the positive and negative aspects of the PINCER
trial? (Any concerns/problems? What aspect is running particularly smoothly/effectively? Why?)
5. What do you feel about the outcome measures that have been chosen for the trial?
6. What is your involvement in the PINCER trial? (Do you have regular contact with the pharmacists?)
7. How do you feel the PINCER trial is working so far? (What is your experience of working with the pharmacists? How does the PINCER trial affect your day-to-day work as a GP?) (Workload)
8. Do you feel the PINCER trial will be effective in reducing prescribing errors in general practice? (If it works, why do you think this will be? If it doesn’t work, why do you think this will be?)
9. In your opinion, does the PINCER trial affect the work-dynamics in your practice? If so, how?
10. Is there anything that you would have done differently in implementing the PINCER trial? (Thinking about what has been happening in the practice and your role during the intervention period)
11. What are your expectations of this project? (What do you think it will achieve/lead to?)
12. How do you see your role in bringing this about? (Do you think you can contribute to these expectations with your behaviour?)
13. If the PINCER trial was shown to be effective, what do you think will help to make it work if it is to be rolled-out on a larger scale? (Across England)
15. How do you think practices can be motivated to implement interventions like the PINCER trial?
16. If after the study has finished, you were offered a pharmacist service similar to that being provided in the PINCER trial, would you or your practice want to use the service? Why/why not?
17. Is there anything else that you would like to say? Do you have any suggestions?
GPs – Simple Feedback Arm
1. In your opinion, which are the main issues in prescribing safety in general practice?
2. What is your sense of what the PINCER trial is? 3. Is there anything that particularly appeals to you in this project? What? Why? 4. In your opinion, what are the positive and negative aspects of the PINCER
trial? (Any concerns/problems? What aspect is running particularly smoothly/effectively? Why?)
5. What do you feel about the outcome measures that have been chosen for the trial?
6. What is your involvement in the PINCER trial? (Have you read the educational material? Have you had a look at the potentially at-risk patients identified/reviewed their medication?)
7. How do you feel the PINCER trial is working so far? (How does the PINCER trial affect your day-to-day work as a GP?) (Workload)
8. Do you feel the PINCER trial will be effective in reducing prescribing errors in general practice? (If it works, why do you think this will be? If it doesn’t work, why do you think this will be?)
9. In your opinion, does the PINCER trial affect the work-dynamics in your practice? If so, how? (Is everyone working on it together?)
10. Is there anything that you would have done differently in implementing the PINCER trial? (Thinking about what has been happening in the practice and your role during the intervention period)
11. What are your expectations of this project? (What do you think it will achieve/lead to?)
12. How do you see your role in bringing this about? (Do you think you can contribute to these expectations with your behaviour?)
13. If the PINCER trial was shown to be effective, what do you think will help to make it work if it is to be rolled-out on a larger scale? (Across England)
14. How do you think practices can be motivated to implement interventions like the PINCER trial?
15. If after the study has finished, you were offered a service similar to that being provided in the PINCER trial, would you or your practice want to use it? Why/why not?
16. Is there anything else that you would like to say? Do you have any suggestions?
Practice Managers - Pharmacist Intervention Arm
1. In your opinion, which are the main issues in prescribing safety in general practice?
2. What is your sense of what the PINCER trial is? 3. Is there anything that particularly appeals to you in this project? What? Why? 4. In your opinion, what are the positive and negative aspects of the PINCER
trial? (Any concerns/problems? What aspect is running particularly smoothly/effectively? Why?)
5. What do you feel about the outcome measures that have been chosen for the trial?
6. What is your involvement in the PINCER trial? (Do you have regular contact with the pharmacists?)
7. How do you feel the PINCER trial is working so far? (What is your experience of working with the pharmacists? How does the PINCER trial affect your day-to-day work as a practice manager? How does the PINCER trial affect the day-to-day work of others in the practice e.g. reception staff?) (Workload)
8. Do you feel the PINCER trial will be effective in reducing prescribing errors in general practice? (If it works, why do you think this will be? If it doesn’t work, why do you think this will be?)
9. In your opinion, does the PINCER trial affect the work-dynamics in your practice? If so, how? (Is everyone working on it together?)
10. Is there anything that you would have done differently in implementing the PINCER trial? (Thinking about what has been happening in the practice and your role during the intervention period)
11. What are your expectations of this project? (What do you think it will achieve/lead to?)
12. How do you see your role in bringing this about? (Do you think you can contribute to these expectations with your behaviour?)
13. If the PINCER trial was shown to be effective, what do you think will help to make it work if it is to be rolled-out on a larger scale? (Across England)
14. How do you think practices can be motivated to implement interventions like the PINCER trial?
15. If after the study has finished, you were offered a pharmacist service similar to that being provided in the PINCER trial, would you or your practice want to use the service? Why/why not?
16. Is there anything else that you would like to say? Do you have any suggestions?
Practice Managers – Simple Feedback Arm
1. In your opinion, which are the main issues in prescribing safety in general practice?
2. What is your sense of what the PINCER trial is? 3. Is there anything that particularly appeals to you in this project? What? Why? 4. In your opinion, what are the positive and negative aspects of the PINCER
trial? (Any concerns/problems? What aspect is running particularly smoothly/effectively? Why?)
5. What do you feel about the outcome measures that have been chosen for the trial?
6. What is your involvement in the PINCER trial? (Have you read the educational material? Have you had a look at the potentially at-risk patients identified?)
7. How do you feel the PINCER trial is working so far? (How does the PINCER trial affect your day-to-day work as a practice manager? How does the PINCER trial affect the day-to-day work of others in the practice e.g. reception staff?) (Workload)
8. Do you feel the PINCER trial will be effective in reducing prescribing errors in general practice? (If it works, why do you think this will be? If it doesn’t work, why do you think this will be?)
9. In your opinion, does the PINCER trial affect the work-dynamics in your practice? If so, how? (Is everyone working on it together?)
10. Is there anything that you would have done differently in implementing the PINCER trial? (Thinking about what has been happening in the practice and your role during the intervention period)
11. What are your expectations of this project? (What do you think it will achieve/lead to?)
12. How do you see your role in bringing this about? (Do you think you can contribute to these expectations with your behaviour?)
13. If the PINCER trial was shown to be effective, what do you think will help to make it work if it is to be rolled-out on a larger scale? (Across England)
14. How do you think practices can be motivated to implement interventions like the PINCER trial?
15. If after the study has finished, you were offered a service similar to that being provided in the PINCER trial, would you or your practice want to use it? Why/why not?
16. Is there anything else that you would like to say? Do you have any suggestions?
NHS Prescribing Leads (or similar)
1. In your opinion, which are the main issues in prescribing safety in general practice?
2. How would you address prescribing safety issues in general practice? 3. Are you aware that the PINCER trial is taking place? (Are you involved in it? If
yes, How?) 4. What is your sense of what the PINCER trial is? 5. Is there anything that particularly appeals to you in this project? What? Why?
6. Do you feel the PINCER trial will be effective in reducing prescribing errors in general practice? (If it works, why do you think this will be? If it doesn’t work, why do you think this will be?)
7. What do you feel about the outcome measures that have been chosen for the trial?
8. In your opinion, is there anyone or anything that could hinder the progress of the PINCER trial? (Or keep it from running smoothly?)
9. What are your expectations of this project? (What do you think it will achieve/lead to?)
10. How do you see your role in bringing this about? (Do you think you can contribute to these expectations with your behaviour?)
11. If the PINCER trial was shown to be effective, what do you think will help to make it work if it is to be rolled-out on a larger scale? (Across England)
12. How do you think practices can be motivated to implement interventions like the PINCER trial?
13. If after the study has finished, you were offered a pharmacist service similar to that being provided in the PINCER trial, would you want to use the service? Why/why not?
14. Is there anything else that you would like to say? Do you have any suggestions?
Researchers
1. How do you feel the PINCER trial is working so far? (How is it to go into practices?)
2. How do the practices appear to receive the trial? (Intervention arm differences?)
3. How is your relationship with the practice staff? (How do you feel received in the practices?)
4. Any concerns/problems? (logistical (organisational, planning), technical (computer)
5. How do problems affect the practice staff? 6. How to problems affect you/your work? 7. Are things getting better with time? How? 8. Which aspect is running particularly smoothly/effectively? 9. What are the motivations to take part for practices in your opinion? 10. Is there anything else that you would like to say? Do you have any
suggestions?
Appendix 7.2: Interview Schedules In-depth Interviews Community pharmacists [Modify questions depending on if they know about PINCER or not, do they welcome or resent trial? How can trial be integrated into community pharmacy?] Questions relating to the PINCER trial:
1. Were you aware that the PINCER trial is taking place? (Are you involved in it? If yes, How?)
2. Is there anything that particularly appeals to you in this project? What? Why? (Do you feel the trial adequately addresses issues surrounding prescribing safety?)
3. Do you feel the PINCER trial will be effective in reducing prescribing errors in general practice? (If it works, why do you think this will be? If it doesn’t work, why do you think this will be?)
4. How do you feel about the outcome measures of the trial? (After initial answer can focus on beta blocker and asthma in particular: risks and benefits of beta-blockers, how does that influence prescribing behaviour? Try to get specific examples)
5. In your opinion, is there anything that could hinder the progress of the PINCER trial? (Or keep it from running smoothly?) potential problems?
6. What are your expectations of this project? (In what way will outcomes of the trial (or the trial itself) affect you as a community pharmacist and/or pharmacists in general?)
7. Do you think the interventions will make a long term impact on prescribing behaviour? Why? Why not? (What will help to keep things up in practices long-term? What will hinder the long-term success of the interventions (if found to be successful)?)
8. How is the relationship between community pharmacists and PINCER trial pharmacists? (e.g. are there any territorial issues?)
Roll-out of the PINCER trial:
9. If the PINCER trial was shown to be effective, what do you think will help to roll it out in other practices? (Across England)
10. If the PINCER was to be rolled out, which other things could pharmacists do/look at in practices (beyond the outcome measures of the trial)? Do you need a pharmacist to do these things? Who else could do them?
11. If the trial was to be rolled out, do you think community pharmacists could incorporate some of the functions of the PINCER trial pharmacists in their current role? (What would have to be done to make this possible? e.g. more resources, more training)
12. If the trial was to be rolled out, who would be the employing authority for pharmacists working on the trial?
More general questions:
13. From your perspective, what influences prescribing safety in general practice? (How is the issue addressed by the PCT? How is it developing?)
14. How do you see the role of pharmacists developing within primary care? (What can help to make pharmacists a more integral part of the primary care team? Do you feel they are?)
15. How would you describe the relationship between pharmacists and GPs (both community and PCT pharmacists – is there a difference?)?
16. Is there anything else that you would like to say? Do you have any suggestions?
GPs and Nurses – Pharmacist Intervention Arm Questions relating to the PINCER trial:
1. Could you tell me how your practice decided to get involved in this project? (How does the trial benefit the practice?)
2. How do you feel about the outcome measures of the trial? (after initial answer can focus on beta blocker and asthma in particular: risks and benefits of beta-blockers, how does that influence prescribing behaviour? try to get specific examples)
3. When you had a look at the patients identified – did the outcome measures of the trial still make sense to you? (Why? Why not?)
4. What is your involvement/role in the PINCER trial? (Do you have regular contact with the pharmacists? For what reasons do you tend to see the pharmacist? How is it working with a pharmacist?)
5. How do you feel the PINCER trial is working so far? (Any concerns/problems with the trial? Why? How can problems be addressed/dealt with? How does the PINCER trial affect your day-to-day work as a GP?)
6. Do you feel the PINCER trial will be effective in reducing prescribing errors in general practice? (If it works, why do you think this will be? If it doesn’t work, why do you think this will be?)
7. In your opinion, does the PINCER trial affect the work-dynamics in your practice? If so, how? (Is everyone working on it together?)
8. How important is the role of the pharmacist in the trial? (keeping in mind that there is also a simple feedback arm, do you feel your practice could have done it without the pharmacist? Do you feel that this kind of work could be done by someone else? Who? Practice nurse, GPs? How could that be made possible?)
9. Have you had a pharmacist working in your practice before? How do you think this influences the outcome of the trial?
10. Is there anything that you would have done differently in implementing the PINCER trial? (Thinking about what has been happening in the practice and your role during the intervention period)
11. Are there things that the pharmacist is doing in your practice that are not trial related? Which are these?
12. Do you think things will be kept up after the pharmacist has left? (What will help to keep things up long-term? What will hinder the long-term success of the intervention (if found to be successful)?)
13. What are your expectations of this project? [can leave out if no time] Roll-out of the PINCER trial:
14. If the PINCER trial was shown to be effective, what do you think will help to roll it out in other practices? (Across England)
15. How do you think practices can be motivated to participate in trials like the PINCER?
16. If the PINCER was to be rolled out, which other things could pharmacists do/look at in practices (beyond the outcome measures of the trial)? (How could the pharmacists’ time be used most effectively?)
17. If after the study has finished, you were offered a service similar to that being provided in the PINCER trial, would you or your practice want to use the service? Why/why not?
More general questions: 18. From your perspective, what influences prescribing safety in general
practice? (How is the issue addressed by your practice? How is it developing?)
19. The literature has shown that in certain circumstances GPs can feel threatened by pharmacists’ expanding clinical role – how do you feel about this? (inter-professional boundaries) e.g. Mark A. Mesler (1991) ‘Boundary encroachment and task delegation: clinical pharmacists on the medical team.’ Sociology of Health & Illness 13 (3), 310–331
20. How do you see the role of pharmacists developing within primary care? (What can help to make pharmacists a more integral part of the primary care team? Do you feel they are?)
21. Is there anything else that you would like to say? Do you have any suggestions?
GPs and Nurses – Simple Feedback Arm Questions relating to the PINCER trial:
1. Could you tell me how your practice decided to get involved in this project? (How does the trial benefit the practice?)
2. How do you feel about the outcome measures of the trial? (after initial answer can focus on beta blocker and asthma in particular: risks and benefits of beta-blockers, how does that influence prescribing behaviour? try to get specific examples)
3. When you had a look at the patients identified – did the outcome measures of the trial still make sense to you? (Why? Why not?)
4. What is your involvement/role in the PINCER trial? (Have you read the educational material? Have you had a look at the potentially at-risk patients identified/reviewed their medication?)
5. How do you feel the PINCER trial is working so far? (Any concerns/problems with the trial? Why? How can problems be addressed/dealt with? How does the PINCER trial affect your day-to-day work as a GP?)
6. Do you feel the PINCER trial will be effective in reducing prescribing errors in general practice? (If it works, why do you think this will be? If it doesn’t work, why do you think this will be?)
7. In your opinion, does the PINCER trial affect the work-dynamics in your practice? If so, how? (Is everyone working on it together?)
8. Is there anything that you would have done differently in implementing the PINCER trial? (Thinking about what has been happening in the practice and your role during the intervention period)
9. Do you think things will be kept up after the project has finished? (What will help to keep things up long-term? What will hinder the long-term success of the intervention (if found to be successful)?)
10. What are your expectations of this project? Roll-out of the PINCER trial:
11. If the PINCER trial was shown to be effective, what do you think will help to roll it out in other practices? (Across England)
12. How do you think practices can be motivated to participate in trials like the PINCER?
13. If after the study has finished, you were offered a service similar to that being provided in the PINCER trial, would you or your practice want to use the service? Why/why not? (Was simple feedback useful or has it thrown up more questions than answers? Would you want to receive pharmacist intervention?)
More general questions:
14. From your perspective, what influences prescribing safety in general practice? (How is the issue addressed by your practice? How is it developing?)
15. The literature has shown that in certain circumstances GPs can feel threatened by pharmacists’ expanding clinical role – how do you feel about this? (inter-professional boundaries) e.g. Mark A. Mesler (1991) ‘Boundary encroachment and task delegation: clinical pharmacists on the medical team.’ Sociology of Health & Illness 13 (3), 310–331
16. How do you see the role of pharmacists developing within primary care? (What can help to make pharmacists a more integral part of the primary care team? Do you feel they are?)
17. Is there anything else that you would like to say? Do you have any suggestions?
Trial Pharmacists Questions relating to the PINCER trial:
1. How are things going now that you have worked on the trial for a while? 2. Any concerns/problems? (How can these be addressed/dealt with? Are there
any issues that you feel might influence the results of the trial?) 3. Which aspect is running particularly smoothly/effectively? Why? (identify
conditions) 4. What do you feel about the outcome measures now that you have worked on
the trial for a while? (after initial answer can focus on beta blocker and asthma in particular: risks and benefits of beta-blockers, how does that influence prescribing behaviour? try to get specific examples)
5. How is your relationship with the practice staff? How do you feel received in the practice? Does the relationship/your role change with time?
6. How do you feel you are integrating into the practice teams? (What can help to make you a more integral part of the primary care team?)
7. How would you describe the relationship between pharmacists and GPs? (in general and in the trial)
8. What do practices think about the trial? 9. Is your workspace in the practices (accommodation) appropriate? Does the
way you are accommodated in the practice affect your performance/work/outcome of trial? (What could be done to improve things?)
10. If you encounter a problem during your work on the trial, where do you go? 11. How do you see the GPs role in the trial? How is their attitude/involvement? 12. How do you see your role in the trial? 13. How do you see the practice manager’s role in the trial? 14. Anyone else you can think of, who is crucial for the implementation of the
trial? (could you rank?) 15. What do you feel is the crucial “ingredient” of the trial? (What are the
differences between pharmacist intervention and simple feedback?) 16. What other (unanticipated) effects do/might the interventions have on
prescribing safety in practices (those that are not related to the outcome measures)? (these can be either positive or negative)
17. Do you think the intervention will make a long term impact on prescribing behaviour? Why? Why not? (Will things be kept up in practices after you left? What will help to keep things up in practices long-term? What will hinder the long-term success of the intervention?
18. Any advice for someone who just started working as a pharmacist for the PINCER trial? (Capture aspect of time – what would have helped? Do things get easier over time? What have you learned?)
19. Are there things that you are doing in the practices that are not trial related? Which are these?
20. What difference will the results of the trial make for future developments in prescribing safety?
Possible roll-out:
21. How was your job profile reconfigured while working for the PINCER? Would there be anything that you would like to see included in the job profile if the trial is to be rolled out?
22. If the PINCER was to be rolled out, would it be appropriate to broaden the remit of the pharmacists beyond the outcome measures of the trial?
23. If the trial was to be rolled out, who would be the employing authority for pharmacists?
24. If the trial was to be rolled out, do you think community pharmacists could incorporate some of the functions of the PINCER trial pharmacists in their current role? (What would have to be done to make this possible? e.g. more resources, more training)
More general questions:
25. From your perspective, what influences prescribing safety in general practice? (How is the issue addressed by the PCT? How is it developing?)
26. How do you see the role of pharmacists developing within primary care? (In what way does the PINCER influence these developments?)
27. Is there anything else that you would like to say? Do you have any suggestions?
Practice Managers - Pharmacist Intervention Arm Questions relating to the PINCER trial:
1. Why did your practice decide to get involved in this project? (How does the trial benefit the practice?)
2. What is your involvement/role in the PINCER trial? (Do you have regular contact with the pharmacists? How does the PINCER trial affect your day-to-day work as a practice manager?)
3. What is the GPs role in the PINCER trial? (How does it affect them? Are they heavily involved in it? Do they have regular contact with the pharmacist? How are they getting on with the pharmacist?)
4. How is the trial received by the GPs? How are the GPs reacting to seeing the list of patients identified/the pharmacist’s recommendations?
5. How do you feel the PINCER trial is working so far? (Any concerns/problems with the trial? Why? How can problems be addressed/dealt with? How does the PINCER trial affect the day-to-day work of others in the practice e.g. reception staff?)
6. Do you feel the PINCER trial will be effective in reducing prescribing errors in general practice? (If it works, why do you think this will be? If it doesn’t work, why do you think this will be?)
7. In your opinion, how important is the role of the pharmacist in the trial? (keeping in mind that there is also a simple feedback arm, do you feel your practice could have done it without the pharmacist? Do you feel that this kind of work could be done by someone else? Who? Practice nurse, GPs? How could that be made possible?)
8. Have you had a pharmacist working in your practice before? How do you think this influences the outcome of the trial?
9. In your opinion, does the PINCER trial affect the work-dynamics in your practice? If so, how? (Is everyone working on it together?)
10. Is there anything that you would have done differently in implementing the PINCER trial? (Thinking about what has been happening in the practice and your role during the intervention period)
11. How is the pharmacist accommodated in the practice? 12. Are there things that the pharmacist is doing in your practice that are not trial
related? Which are these? 13. Do you think things will be kept up after the pharmacist has left? (What will
help to keep things up long-term? What will hinder the long-term success of the intervention (if found to be successful)?)
14. What are your expectations of this project? Roll-out of the PINCER trial:
15. If the PINCER trial was shown to be effective, what do you think will help to roll it out in other practices? (Across England)
16. How do you think practices can be motivated to participate in trials like the PINCER?
17. If the PINCER was to be rolled out, which other things could pharmacists do/look at in practices (beyond the outcome measures of the trial)? (How could the pharmacists’ time be used most effectively?)
18. If after the study has finished, you were offered a pharmacist service similar to that being provided in the PINCER trial, would you or your practice want to use the service? Why/why not?
More general questions:
19. What does your practice do to address issues of prescribing safety? (Are there systems in place? What are they? Which are the main areas for improvement?)
20. How do you see the role of pharmacists developing within primary care? (What can help to make pharmacists a more integral part of the primary care team? Do you feel they are?)
21. Is there anything else that you would like to say? Do you have any suggestions?
Practice Managers – Simple Feedback Arm Questions relating to the PINCER trial:
1. Why did your practice decide to get involved in this project? (How does the trial benefit the practice?)
2. What is your involvement/role in the PINCER trial? (Have you read the educational material? Have you had a look at the potentially at-risk patients identified? How does the PINCER trial affect your day-to-day work as a practice manager?)
3. In your opinion, what is the GPs role in the PINCER trial? (How does it affect them? Are they heavily involved in it?)
4. How is the trial received by the GPs? How are the GPs reacting to seeing the list of patients identified?
5. How do you feel the PINCER trial is working so far? (Any concerns/problems with the trial? Why? How can problems be addressed/dealt with? How does the PINCER trial affect the day-to-day work of others in the practice e.g. reception staff?)
6. Do you feel the PINCER trial will be effective in reducing prescribing errors in general practice? (If it works, why do you think this will be? If it doesn’t work, why do you think this will be?)
7. In your opinion, does the PINCER trial affect the work-dynamics in your practice? If so, how? (Is everyone working on it together?)
8. Is there anything that you would have done differently in implementing the PINCER trial? (Thinking about what has been happening in the practice and your role during the intervention period)
9. Do you think things will be kept up after the trial has finished? (What will help to keep things up long-term? What will hinder the long-term success of the intervention (if found to be successful)?)
10. What are your expectations of this project? Roll-out of the PINCER trial:
11. If the PINCER trial was shown to be effective, what do you think will help to roll it out in other practices? (Across England)
12. How do you think practices can be motivated to participate in trials like the PINCER?
13. If after the study has finished, you were offered a service similar to that being provided in the PINCER trial, would you or your practice want to use the service? Why/why not? (Was simple feedback useful or has it thrown up more questions than answers? Would you want to receive pharmacist intervention?)
More general questions:
14. What does your practice do to address issues of prescribing safety? (Are there systems in place? What are they? Which are the main areas for improvement?)
15. How do you see the role of pharmacists developing within primary care? (What can help to make pharmacists a more integral part of the primary care team? Do you feel they are?)
16. Is there anything else that you would like to say? Do you have any suggestions?
NHS Prescribing Leads (or similar) Questions relating to the PINCER trial:
1. Were you aware that the PINCER trial is taking place? (Are you involved in it? If yes, How?)
2. Do you feel the PINCER trial will be effective in reducing prescribing errors in general practice? (Do you feel the trial adequately addresses issues surrounding prescribing safety?)
3. How do you feel about the outcome measures of the trial? (after initial answer can focus on beta blocker and asthma in particular: risks and benefits of beta-blockers, how does that influence prescribing behaviour? Try to get specific examples)
4. If applicable: how do you feel the interventions are received by (a) practices and (b) pharmacists (c) others in the PCT?
5. Are there or do you anticipate any problems with the trial (design and/or how it is received by key players)?
6. Do you think the interventions will make a long term impact on prescribing behaviour? Why? Why not? (What will help to keep things up in practices long-term? What will hinder the long-term success of the interventions (if found to be successful)?)
Roll-out of the PINCER trial: 7. If the PINCER trial was shown to be effective, what do you think will help to
roll it out in other practices? (Across England) (How do you see the PCT’s role in this?)
8. How do you think practices can be motivated to participate in trials like the PINCER?
9. If the PINCER was to be rolled out, which other things could pharmacists do/look at in practices (beyond the outcome measures of the trial)? (How could the pharmacists’ time be used most effectively? Do you need a pharmacist to do these things? Who else could do them?)
10. If the trial was to be rolled out, who would be the employing authority for pharmacists working on the trial? PCT’s, practices themselves? How can you make this possible?
11. If the trial was to be rolled out, do you think community pharmacists could incorporate some of the functions of the PINCER trial pharmacists in their current role? (What would have to be done to make this possible? e.g. more resources, more training)
More general questions:
12. From your perspective, what influences prescribing safety in general practice? (How is the issue addressed by the PCT? How is it developing?)
13. How do you see the role of pharmacists developing within primary care? (What can help to make pharmacists a more integral part of the primary care team? Do you feel they are?)
14. Is there anything else that you would like to say? Do you have any suggestions?
Trial Pharmacists –Exit Interviews
1. Could you tell me about how you've come to decide to leave? 2. What are your reasons for leaving? (Anything to do with the nature of your
work for the PINCER or external?) 3. Is there anything that could have been done early on to prevent you from
leaving? 4. What has been good/enjoyable/satisfying for you in your time working as a
PINCER pharmacist? 5. What has been frustrating/difficult/upsetting to you in your time working as a
PINCER pharmacist? Is this job boring? 6. How could the PINCER team/trial have enabled you to make fuller use of your
capability and potential? 7. Do you think that pharmacists should be doing this job or could it be done by
others e.g. admin staff? Who else could do it? Why? How could this be made possible? Discuss alternative models!!! pros and cons – any other suggestions?
8. What training would you have liked or needed that you did not get? What difference would that have made?
9. How could the team/trial have enabled you to have made better use of your time?
10. What suggestion would you make to improve working conditions of PINCER pharmacists?
11. How did reality differ from your expectations of working as a PINCER pharmacist (when you applied)?
12. Would you apply again for a job like this? Why/why not? (Short term contract – does that make a difference?)
13. Can I ask where you are going (if you have decided)? (Why are you going there?)
14. Is there anything else that you would like to say?
Appendix 7.3: Topic Guides Focus Groups PINCER Trial pharmacists 5 min - Introduction, welcome from organiser & ground rules
• The purpose of the group today is to discuss your experiences/opinions of the PINCER trial and to discuss potential alternative interventions to reduce prescribing errors in primary care
• What you say is confidential and whatever views you express will be anonymised so that no one outside of this room will know who has said what.
• You should therefore treat information and views expressed in this room as confidential
• Please feel free to say what you want and feel free to discuss comments or add your own experiences
• Please allow others to have their say (even if you disagree) • With your consent the discussions will be recorded so that we can analyse
them later, but the data will be anonymised • It’s not so much a question and answer session as a forum for discussion • I may need to stop a discussion if going over time in order to get all topics
discussed 10 Minutes GROUP INTRODUCTIONS Researcher and participants (names and professions) Record names/positions State the two topics to keep the structure of the discussion 30 - 40 Minutes TOPIC 1 – the wider usability of the trial Rationale: The trial has included two ways of reducing medication errors (pharmacist intervention and simple feedback) but there may be other more effective ways to achieve this. We have some concerns regarding the sustainability of the PINCER models and therefore want to explore alternatives. Question 2: In your opinion, how might the trial interventions be modified or adapted in order to maximise their effectiveness when implemented in routine general practice? Prompts Do you think the interventions are fine as they are or is there anything that could be changed? What would need to be changed and why? 30 - 40 Minutes TOPIC 2 – possible alternative interventions Question 3: What alternative interventions/strategies might be both acceptable to you and effective in reducing prescribing errors in general practice? Prompts Can they think of any themselves? Introduce our four potential models:
1. Simple feedback: practices themselves setting up and conducting searches on a monthly basis (and, crucially, act on the results), based on written educational material, within this scenario, modified simple feedback versions may be possible, e.g. simple feedback with incentives (e.g. money) to motivate practices to implement and drive change or remote access to a pharmacist (potential of electronic health records)
2. Training practice staff to provide relevant clinical input: clinical staff (e.g. nurses) within the practice may provide this clinical input, this may be possible through attending additional training courses, but would probably need additional incentives, trained clinical staff may then work in collaboration with admin staff, healthcare assistants or technicians
3. Pharmacist intervention: may take a number of different forms e.g. PINCER pharmacists going into practices as in the trial (employed by the practices themselves or the PCT or both), community pharmacists, the introduction of the electronic health record/summary care record may facilitate a remote solution for both
4. Partial pharmacist input: a designated person driving change is necessary. This may either come from inside the practice or outside the practice. This person does, however, not necessarily need to have a clinical background – there may be a potential role for admin staff, healthcare assistants or technicians. Clinical input is needed for some aspects of the intervention. There may be a potential role for pharmacists (PCT or community) in an advisory capacity – this may also be done remotely (e.g. on the phone or computer) - if this would be the case less resources would have to be spent on training
What are the strengths and limitations of each alternative approach? Which model would you pick if you had to chose? 5 Minutes CLOSURE All know what I am trying to do - anything else to add? Pharmacist Intervention Practices 5 min - Introduction, welcome from organiser & ground rules as above 5 Minutes GROUP INTRODUCTIONS Researcher and participants (names, professions and involvement in trial if applicable) Record names/positions State the 3 topics to keep the structure of the discussion: • experiences and opinions of the PINCER trial • the wider usability of the trial • possible alternative interventions 15 Minutes TOPIC 1 – experiences and opinions of the PINCER trial How would you describe your experiences of being involved with the trial? (positive and negative) 15 Minutes TOPIC 2 – the wider usability of the trial
Rationale: The trial has included two ways of reducing medication errors (pharmacist intervention and simple feedback) but there may be other more effective ways to achieve this. We have some concerns regarding the sustainability of the PINCER models and therefore want to explore alternatives. Do you think the interventions are fine as they are or is there anything that could be changed or adapted to maximise their effectiveness? What would need to be changed and why? 20 Minutes TOPIC 3 – possible alternative interventions What alternative interventions/strategies might be both acceptable to you and effective in reducing prescribing errors in general practice? Prompts: Can they think of any themselves? Introduce our four potential models: (emerged from interviews with those involved in trial) What are the strengths and limitations of each alternative approach? • Remote pharmacist input – potential of electronic health records • Community pharmacists taking over some of the functions of PINCER
pharmacists • Partial pharmacist input with technicians, healthcare assistants or admin staff
taking over some functions of PINCER pharmacists (interviewees stated that especially monitoring outcome measures would not require a pharmacist but clinical input is needed for some aspects of the intervention e.g. beta-blockers)
• Training clinical staff to provide relevant clinical input (might then work in collaboration with admin staff, technicians or healthcare assistants)
Which model would you pick if you had to chose? We did a focus group with PINCER pharmacists and they favoured a flexible option with the approach taken tailored to individual practices (potentially lead by clusters), when pushed they stated that they would prefer the community pharmacist model, or a collaboration of community pharmacists and PCT pharmacists. How do you feel about this? Closure as above PCT Focus Group As above except TOPIC 3 – possible alternative interventions What alternative interventions/strategies might be both acceptable to you and effective in reducing prescribing errors in general practice? Prompts: Can they think of any themselves? Introduce our four potential models: (emerged from interviews with those involved in trial) What are the strengths and limitations of each alternative approach? • Remote pharmacist input – potential of electronic health records • Community pharmacists taking over some of the functions of PINCER
pharmacists • Partial pharmacist input with technicians, healthcare assistants or admin staff
taking over some functions of PINCER pharmacists (interviewees stated that especially monitoring outcome measures would not require a pharmacist but clinical input is needed for some aspects of the intervention e.g. beta-blockers)
• Training clinical staff to provide relevant clinical input (might then work in collaboration with admin staff, technicians or healthcare assistants)
Which model would you pick if you had to chose? We did a focus group with PINCER pharmacists and they favoured a flexible option with the approach taken tailored to individual practices (potentially lead by clusters), when pushed they stated that they would prefer the community pharmacist model, or a collaboration of community pharmacists and PCT pharmacists. Practices not so keen on Community Pharmacist option but thought PCT pharmacist option was ok – felt they needed some input on specific issues/problems to focus on. How do you feel about this? Simple Feedback Practices and PCT Interview As above except TOPIC 3 – possible alternative interventions What alternative interventions/strategies might be both acceptable to you and effective in reducing prescribing errors in general practice? Prompts: Can they think of any themselves? Introduce our potential models: (emerged from interviews with those involved in trial) What are the strengths and limitations of each alternative approach and how could each be put into practice? • Remote pharmacist input – potential of electronic health records • Community pharmacists taking over some of the functions of PINCER
pharmacists • Partial pharmacist input with technicians, healthcare assistants or admin staff
taking over some functions of PINCER pharmacists (interviewees stated that especially monitoring outcome measures would not require a pharmacist but clinical input is needed for some aspects of the intervention e.g. beta-blockers)
• Incorporate into existing role of PCT pharmacist • Cluster based flexible approach Which model would you pick if you had to chose? Focus on practicalities of implementing these models - need to come up with concrete recommendations
Appendix 7.4: Graphical representation of results Brief interviews
Interviewees were asked what they perceived to be the main issues in prescribing
safety in general practice. Other perceived issues frequently mentioned included the
data quality of patient records, the lack of integration between primary and secondary
care and medication side effects.
Participants were also asked about their expectations of the trial. Here, across
participants, the most commonly mentioned issue was the trial’s potential to improve
prescribing safety. All pharmacists had the expectation that the trial would raise the
profile of pharmacists in general practice.
Diagrams summarising facilitators/barriers and themes and sub-themes identified
can be viewed in Figure 1 and Figure 2 below. Here, the green circles are the
facilitators identified, backed up with extracts from participants’ accounts. The brown
boxes are conceptual categories designed to facilitate the reader’s understanding.
Arrows indicate to what extend identified themes are grounded in the data (the
thicker the arrow, the more participants mentioned the theme). An attempt was made
to follow a similar conceptual structure in both diagrams.
Figure 1. Visual presentation of facilitators
Figure 2. Visual presentation of barriers
In-depth interviews The analysis of in-depth interviews resulted in themes and sub-themes capturing the context in which the interventions were most and least likely to work. In addition, the analysis has identified issues to consider if the outcome interventions were rolled out and helped to gain an insight into potential alternative components of the interventions. Although the focus of this analysis was on the pharmacist intervention arm, the results can easily be applied to the simple feedback arm. A diagram summarising the results obtained in the in-depth qualitative phase can be viewed in Figure 3. Here, red circles are conceptual categories of the trial design, implementation and potential roll-out whilst the other boxes are backed up by citations in the qualitative data. Arrows indicate to what extent identified themes are grounded in the data (the thicker the arrow, the more participants mentioned the theme).
Figure 3. Visual presentation of the results obtained in the in-depth qualitative phase
Organisation and planning
Impl
emen
tatio
n
Roll-out
Outcome measuresCourse of the project - timing Feedback of performance
Money
Computer systemsPharmacist job construction
Practice workloadPharmacist meetings
Accommodation of pharmacist
Practice context Key players
Integration of pharmacist
Practice meetings
Practice characteristics
Practice attitudePersonalities Patients
Pharmacist characteristics
Practice manager
GPs
Nurses
Admin staff
Who else could deliver (parts of) the intervention?
Community pharmacistsAdmin staff
Pharmacy technician
Employing authority
PCTPractices themselves
Both?
Outcome measures(Drop some and include others)
Motivate practices through e.g. emphasis on best practice,
financial incentives,making it compulsory, documenting benefits,
sharing positive experiences
Need support from
PCT and im
proved comm
unication with secondary care throughout
Focus groups GPs usually dominated the focus group discussion in practices. Some administrative
staff hardly spoke at all during the focus groups. This may be due to their limited
involvement in the trial.
The analysis resulted in themes and sub-themes capturing models (with both
strengths and weaknesses) of a potential roll-out of the PINCER trial. A diagram
summarising the results obtained in focus groups can be viewed in Figure 4.
Elements of this visual representation will be discussed in detail in the results
section.
Figure 4. Graphical presentation of the results obtained in focus groups
Macro context (the need to develop wider systems)
Ideally flexibility but the following concrete models were considered
Outcome measures (generally viewed positively, specific suggestions on other outcome measures, external input as