Integrated technique assessment based on the pinch analysis approach for the design of production networks Jutta Geldermann * , Martin Treitz, Otto Rentz French-German Institute for Environmental Research (DFIU/IFARE), University of Karlsruhe (TH), Hertzstr. 16, D-76187 Karlsruhe, Germany Abstract Integrated Process Design aims at a holistic approach to process design, retrofitting, and operations planning. Cost and energy ‘‘targets’’ (i.e. the minimum possible values for these objectives) can be calculated based on pinch technol- ogy, which defines the enthalpy at which the hot and cold process streams are separated by the minimum temperature difference in heat exchanger networks. This approach is well established in process engineering and has recently been expanded to mass pinch analysis. The combination of engineering, process integration and Operations Research allows the consideration of a variety of economic and environmental process attributes for an integrated technique assessment, as a case study in the sector of automotive serial coating shows. Ó 2005 Elsevier B.V. All rights reserved. Keywords: Environment; Energy; VOC (volatile organic compound); Process optimisation; Pinch technology 1. Introduction Integrated technique assessment requires holis- tic approaches, considering impacts to all environ- mental media (air, water, land) and energy consumption, as requested by the IPPC-Directive (96/61/EG) on Integrated Pollution Prevention and Control. ‘‘Best Available Techniques’’ (BAT) are being determined in a cross-media evaluation of all implemented and emerging techniques in rel- evant industrial sectors including environmental, social and economic aspects (EC, 1996; Gelder- mann and Rentz, 2001). Likewise, environmental management consequently depends on managing these numerous criteria simultaneously (Gelder- mann and Rentz, 2005). While BAT are techno-economically character- ised for each industrial sector individually, the 0377-2217/$ - see front matter Ó 2005 Elsevier B.V. All rights reserved. doi:10.1016/j.ejor.2005.01.015 * Corresponding author. Tel.: +49 721 608 4583; fax: +49 721 758909. E-mail addresses: [email protected](J. Geldermann), [email protected](M. Treitz), [email protected](O. Rentz). URL: http://www-dfiu.wiwi.uni-karlsruhe.de/ (J. Gelder- mann). European Journal of Operational Research xxx (2005) xxx–xxx www.elsevier.com/locate/dsw ARTICLE IN PRESS
Transcript
ARTICLE IN PRESS
European Journal of Operational Research xxx (2005) xxx–xxx
www.elsevier.com/locate/dsw
Integrated technique assessment based on the pinchanalysis approach for the design of production networks
Jutta Geldermann *, Martin Treitz, Otto Rentz
French-German Institute for Environmental Research (DFIU/IFARE), University of Karlsruhe (TH), Hertzstr. 16, D-76187
Karlsruhe, Germany
Abstract
Integrated Process Design aims at a holistic approach to process design, retrofitting, and operations planning. Costand energy ‘‘targets’’ (i.e. the minimum possible values for these objectives) can be calculated based on pinch technol-ogy, which defines the enthalpy at which the hot and cold process streams are separated by the minimum temperaturedifference in heat exchanger networks. This approach is well established in process engineering and has recently beenexpanded to mass pinch analysis. The combination of engineering, process integration and Operations Research allowsthe consideration of a variety of economic and environmental process attributes for an integrated technique assessment,as a case study in the sector of automotive serial coating shows.� 2005 Elsevier B.V. All rights reserved.
consumption, as requested by the IPPC-Directive(96/61/EG) on Integrated Pollution Preventionand Control. ‘‘Best Available Techniques’’ (BAT)are being determined in a cross-media evaluationof all implemented and emerging techniques in rel-evant industrial sectors including environmental,social and economic aspects (EC, 1996; Gelder-mann and Rentz, 2001). Likewise, environmentalmanagement consequently depends on managingthese numerous criteria simultaneously (Gelder-mann and Rentz, 2005).While BAT are techno-economically character-
2 J. Geldermann et al. / European Journal of Operational Research xxx (2005) xxx–xxx
ARTICLE IN PRESS
actual planning and optimisation of emissionreduction techniques aim at further process inte-gration. Currently, Industrial Ecology is emergingas a new field of research focussing on an improve-ment of products and industrial production pro-cesses under ecological aspects (Graedel andAllenby, 2003), while promoting Clean Technolo-gies (Clift and Longley, 1995; Leffland andKaersgaard, 1997). It should be noted, however,that process optimisation and materials reuse havea long tradition in process engineering (Dunn andBush, 2001) and is widely applied in process inten-sification for existing designs (Douglas, 1988).Methodological parallels between process opti-
misation and Operations Research have beenpointed out by several authors. For example, inte-grated production planning for ammonia synthesistakes into account by-products, residues and emis-sion taxes (Penkuhn et al., 1997). Unit operations,modelled by the process simulation software AS-PEN PLUS, are also the basis for a mixed integerlinear programming (MILP) of the recycling pro-cess of demolition wastes and products at the endof their lifetime in the steel industry (Spengler etal., 1997). Other examples are the combined useof Goal Programming (GP) and the AnalyticalHierarchy Process (AHP) for prioritisation of thedifferent goals of process optimisation, which aredemonstrated by a case study on the optimisationof three petrochemical plants (ammonia-, refinery-and polypropylene-plant) influenced by social, eco-nomic and environmental objectives (Zhou et al.,2000). In contrast to these ‘‘as a whole’’ optimisa-tion approaches and centralised-view analyses,agent-based approaches focus on decentralisedinstallations within a supply chain (Garcıa-Floresand Wang, 2002). Using simulation and a forma-lised language between the agents, a batch processfor the manufacture and supply of paints and coat-ings can bemodelled and design implications can beidentified, which highlight agile structures for acompetitive advantage (Garcıa-Flores et al., 2000).These approaches break the optimisation objec-
tive down into its different dimensions and definetargets, which can be used to implement certaintechnological standards. In particular, the optimi-sation of energy use has a long tradition withinchemical and process engineering. Especially exer-
go-economic approaches can be used to analysethe energy flows within the production processand thereby further the transparency of cost devel-opment within the processes of the plant modules(Tsatsaronis et al., 1990; Linnhoff and Turner,1981). Derived from exergy analysis principles,pinch analysis is a systematic approach to tech-no-economic optimisation of the energy require-ments of production networks according to theirunit operations. This approach has for examplebeen applied to the assessment of truck coatingin a plant in North-America (Roelant et al.,2004). The optimisation of plant layouts with re-gard to energy consumption was then further dis-cussed with regard to its environmental andeconomic consequences.The challenge now, is the integration of exergo-
economic approaches and the optimal reuse ofmaterials, e.g. VOCs (volatile organic com-pounds), inclusion into an integrated approachfor process design, not only for large chemicalinstallations, but also for smaller production pro-cesses. Moreover, not only is lowering the energyconsumption the goal of the process improvement,but also efficient materials use, which leads to amulti-criteria problem if more than the calorificvalue of substances is taken into account. How-ever, unlike in heat transfer, that mainly dependson temperature differences of streams, mass trans-fer has additional constraints to consider, likematerial properties or concentrations, which mayinfluence the direct mixing of mass streams.The simultaneous consideration of energy and
mass flow aspects constitutes ‘‘Process IntegrationTechnology’’, which aims at developing systematicapproaches for identifying cost- and resource-effi-cient production options (Dunn and Bush, 2001;El-Halwagi, 1997; Linnhoff, 2002), and could ben-efit from selected approaches of OperationsResearch.In this paper, the serial coating of raw chassis is
investigated. In the following section the pinchanalysis approach and its formulation as a trans-portation problem is outlined, followed by anapplication of the developed methodology to sur-face treatment in the automotive industry in Sec-tion 3. Section 4 discusses the consequences ofintegrated technique assessment.
*Hot,minQ
Enthalpy H [kJ/kg] *Cold,minQ
PinchTminT∆
below the Pinchprocess steps
above the Pinchprocess steps
sectionsink hot
utility sectionsection
sourcesectionutility cold
compositehot
curve
cold composite curve
Temperature T [ºC]
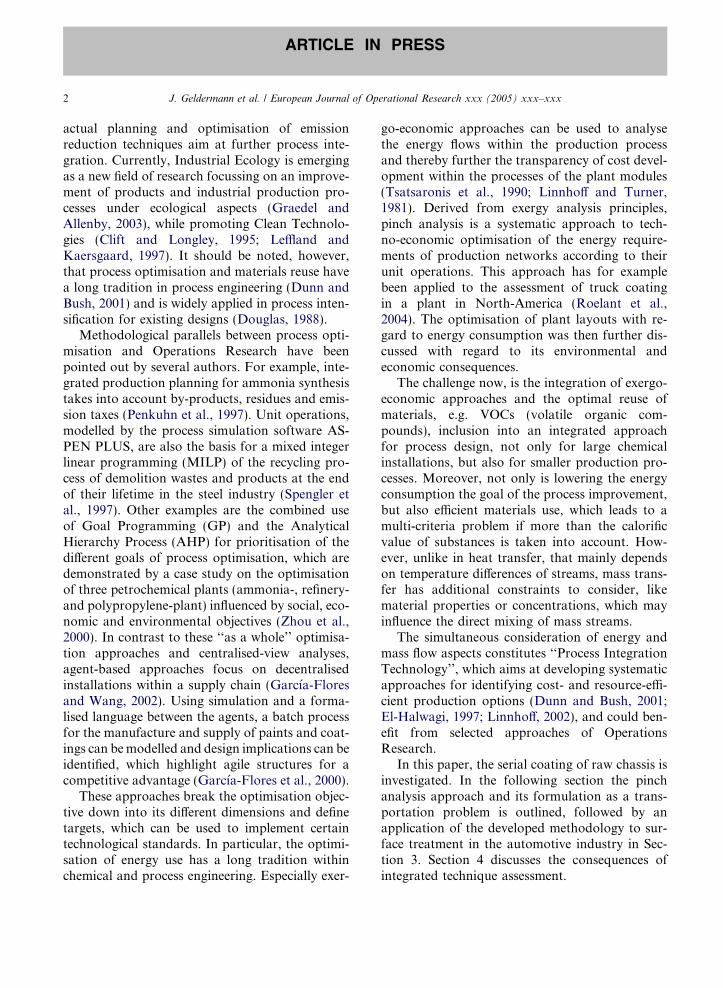
Fig. 1. Composite curves of cold and hot streams with the(H,T)-diagram (adaptal from Radgen, 1996).
J. Geldermann et al. / European Journal of Operational Research xxx (2005) xxx–xxx 3
ARTICLE IN PRESS
2. Systematic approach to optimisation of energy
and material flows
2.1. The pinch analysis approach
For the assessment and optimisation of processsystems with an exergo-economic approach, prom-ising work has been done in recent decades (Tsats-aronis et al., 1990). Much of this work (Linnhoff etal., 1979; Linnhoff and Turner, 1981; Zhang et al.,2000) leads to a formalised integrated approachconsidering energy and mass flows instead ofinvestigating single energy-conversion processes(for instance heat exchangers) independently. Inchemical processes heat is utilised for the opera-tion of reactors and the subsequent thermal sepa-ration of the reaction products. The startingpoint of the pinch point approach was the objec-tive to achieve optimal energy utilisation in a pro-cess by interconnecting material flows requiringheating (so called cold flows, requiring increaseof enthalpy flow) with those requiring cooling (socalled hot flows, requiring decrease of enthalpyflow) and therefore was originally exclusively ori-ented at a minimisation of heat loss. The pinchanalysis is used to calculate the target figures forminimal heat expenditure with a given minimaldriving temperature difference of the heat transfer,which divides the process into two distinct sub-sys-tems at the so called ‘‘pinch point’’, and whoseheat/energy flows can be optimally interconnectedin pairs. Design layouts of the process are therebyidentified and the optimum network of interchang-ers, heaters, coolers with respect to annual operat-ing and capital costs can be calculated.By approximating hot and cold streams as lin-
ear correlations, these curves can be illustrated inenthalpy-temperature diagrams (H,T) as straightlines. Since only changes of enthalpy are relevantand enthalpy has no absolute zero point, the flowscan be moved horizontally in the diagram. Theindividual cold and hot flows are divided into tem-perature intervals, whose limits are chosen so thatone interval boundary lies on every entry and exittemperature. In each temperature interval the indi-vidual cold and hot heat capacity flows are addedand displayed together as lines in the (H,T) dia-gram. Fig. 1 shows a set of hypothetical streams,
each represented by a segment with constant heatcapacity vs. temperature. Together they representthe entire heat balance of the system. Thesemerged curves are referred to as the compositecooling and composite heating curves respectively.The points of discontinuity in the compositecurves indicate the start or the end of one flowor the onset of a phase change (Peters et al., 2003).In order to ensure a heat transfer between cold
and hot flows, the combined curves of the hotmaterial flows must lie over those of the cold flowsin all points, and are thus moved horizontally untilthis condition is met. The constraint set by DTminis defined as the minimal temperature differencebetween the flows. Then the pinch point, wherethe distance between the hot and cold curves isminimal, denotes the possible optimal internalheat transfer between the hot and cold flows.By decreasing DTmin the composite curves can
be shifted closer together where DTmin = 0 is theultimate limit. Q�
Hot;min is the minimal amount ofhot utility demanded for heating, which cannotbe covered by utilising the hot flows, whereasQ�Cold;min represents the amount of heat which mustbe dissipated by external coolers.The process streams on the right side of the
(H,T)-diagram above the pinch temperature re-
4 J. Geldermann et al. / European Journal of Operational Research xxx (2005) xxx–xxx
ARTICLE IN PRESS
quire heating (these streams constitute the heatsink), whereas the process streams below the pinchtemperature would need cooling (these streams arereferred to as the heat source). Additional heatingof Q�
Hot;min would lead to additional cooling ofQ�Cold;min at the end of the process steps. This wouldbe an indication of suboptimal energy use or mis-matched energy demand.A surplus of heat below the pinch point cannot
be balanced with heat demand above the pinch,since energy would have to be transferred againstthe temperature gradient. Incorporating these in-sights, three rules valid for any pinch problemcan be identified (e.g. see Radgen, 1996; Dunnand Bush, 2001; Linnhoff et al., 1979; Linnhoffand Turner, 1981; Peters et al., 2003):
• no heat dissipation above the pinch,• no heat supply below the pinch,• no heat transport across the pinch.
The matching of hot and cold process streamscan be done graphically by plotting the compositecurves or by using optimisation algorithms. Oneapproach is the use of the transportation algo-rithm described in the next section.
2.2. Pinch analysis as a transportation problem
The pinch problem can be solved graphically orwith computer based software, e.g. flow-sheeting-tools such as ASPEN Plus (AspenTech), DIVA(Max Planck Institute for Dynamics of ComplexTechnical Systems) or PROII (SimSci-Esscor—Invensys) which already include algorithms forthe pinch analysis with a repertoire of differentheat exchangers. By linearising the hot and coldflows, the transformation of the pinch probleminto an automated solving procedure as a trans-portation problem from Operations Research canbe demonstrated (Cerda et al., 1983), where effi-cient algorithms exist for solving the ‘‘minimal en-ergy input’’-optimisation problem. The objectivefunction of the general minimisation equation oftransportation problems is stated in Eq. (1).
minxij
Xi
Xj
cij � xij; ð1Þ
where the parameter cij indicates the costs per unittransported material from production site i to cus-tomer j and xij denotes the transported quantity.Analogous to this, the extended objective functionas the minimum utility problem can be stated asfollows:
minqik;jl
XCi¼1
XL
k¼1
XHj¼1
XL
l¼1Cik;jl � qik;jl: ð2Þ
The variable qik,jl (heat transferred) corresponds toxij (material transported). The transport prices cijper unit transported material are translated tothe parameter Cik,jl, which defines the possible ex-changes by weighting possible process flow combi-nations with zero, utility consumption with one,and impossible combinations with an infinitelyhigh value (see Eq. (3)).
Cik;jl ¼
0 for i and j are both process streams
and match is allowed; i:e: k 6 l;
0 for i and j are both utility streams
ði ¼ C; j ¼ HÞ;1 only i or j is a utility stream;
M otherwise; where M is a very large
ðinfiniteÞ number:
8>>>>>>>>>>><>>>>>>>>>>>:
ð3Þ
With the linear approximation of all processstreams within each temperature interval, the com-posite curves are a combination of straight linesaggregated from the different streams in the inter-vals k and l (k, l 2 L) for all cold streams i (i 2 C)and all hot streams j (j 2 H). (Cerda et al., 1983)prove that only corner points (points where at leastone of the composite curves changes its slope) andend points can be potential pinch points. These arethe boundaries of the different intervals k and l ofL. In a preceding step, a set of viable pinch pointscan be identified, in general reducing the size of theinitial problem significantly. Since only points witha change in the slope of the composite curves canbe candidate pinch points, intervals without anychange neither in the mass flow rate nor the heatcapacity can be merged. The distinction is evenmore precise because points on the cold compositecurve are only candidates if the slope becomes flat-ter at this point, whereas points on the hot com-
J. Geldermann et al. / European Journal of Operational Research xxx (2005) xxx–xxx 5
ARTICLE IN PRESS
posite curve are only candidates if the slope is stee-per above the point.The objective function (2) is accompanied by a
series of constraints and assumptions:
XHj¼1
XL
l¼1qik;jl ¼ aik i ¼ 1; 2; . . . ;C; k ¼ 1; 2; . . . ; L;
val k required by cold stream ibjl thermal energy flow in temperature inter-
val l to be removed from hot stream jC cold utility streamC � 1 number of cold process streamsH hot utility streamH � 1 number of hot process streamsL number of intervalscik cold process stream i in temperature inter-
val khjl hot process stream j in temperature inter-
val lCik,jl cost of transferring a single unit of heat
from heat source hjl to heat sink cikqik,jl thermal energy transferred from source hjl
to heat sink cikT temperature
Eq. (4) for example states that the heat requiredby cold stream i in interval k must be transferredfrom any hot stream. In the same manner, Eq.(5) states that the cooling of hot stream j ininterval l must come from any cold stream. This
transferred heat must be nonnegative (Eq. (6)),which ensures that there is no heat moving froma cold stream to a hot stream. Furthermore, thereis the assumption that there is enough cooling (Eq.(7)) and enough heating capacity (Eq. (8)) of theutility streams to satisfy all cooling and heatingrequirements. Additionally, the problem stated as-sumes a given minimum DTmin driving force,implicitly given in the required heat aik and theavailable heat bij per interval k and l respectively.Furthermore, constraints can be chosen in such
a way, that certain energy flow combinations areexcluded, e.g. due to distances from sources tosinks that are too large (for an in-depth descriptionof the application of the transport algorithm to thepinch point analysis see (Cerda et al., 1983)).Moreover, apart from the target function ‘‘mini-mal energy input’’ a minimisation of the costscan also be achieved.
3. Application to serial coating of passenger cars
Surface treatment technologies using solvents,such as the serial coating of cars, can cause a sub-stantial environmental hazard due to the genera-tion of volatile organic compounds (VOCs) andtheir neurotoxic properties. After their release intothe atmosphere, VOCs are subject to photochemi-cal reactions in the presence of nitrogen oxides(NOx) and sunlight, leading to the formation ofphoto-oxidants. Besides PAN (peroxyacetyl ni-trate) and aldehydes, the leading photo-oxidantis tropospheric ozone which primarily causes pho-tochemical smog (so called ‘‘summer smog’’).Moreover, VOCs as neurotoxins have a negativeeffect on health and also on vegetation.Therefore, the European Solvent Directive
1999/13/EC sets VOC emission threshold val-ues—inter alia—for the serial coating of passengercars. Reduction of VOC emissions can be achievedthrough integrated process measures, such as theuse of waterborne coatings with a lower VOC con-tent, or by more efficient flue gas cleaning, throughthe determination of BAT according to the IPPC-Directive 1996/61/EC (Rentz et al., 2003).Basically, a trade-off between reduced VOC-in-
put and energy consumption can be observed.
6 J. Geldermann et al. / European Journal of Operational Research xxx (2005) xxx–xxx
ARTICLE IN PRESS
Consequently, the drying process after coating thecar body is central to the application of the pinchanalysis and the setting of minimal cost and energytargets. In the next sections the technical back-ground and the derived model are illustrated moreprecisely. Firstly, the serial coating of passengercars is outlined, before the drying process is intro-duced in more detail. These conditions are mappedin the model, which is introduced and optimised inthe latter part of this section. In the case study, theenergy and VOC consumption of the different pro-cess steps are analysed and trade-offs are shown.
3.1. Serial coating of passenger cars
Since the appearance of a car is of major con-cern to customers, great importance is attachedto the coating process in the automotive industry.The application of high quality coating is alsoimportant for protecting the car from corrosion,chemical deterioration, weathering, chipping etc.,and for maintaining optimal optical characteristicsas well as faultless and even application. Conse-quently, surface treatment technologies in theautomotive industry are innovative: driven to ahigh standard of quality by customers on the oneside and to a high environmental standard by theIPPC directive on the other.Therefore, the following layer composition is
widely established in Europe: (1) pre-treatment(cleaning, phosphatisation, passivation); (2) catho-dic immersion prime coating (KTL); (3) under-body protection/seam sealing; (4) fillerapplication; (5) top coat application; (6) cavityconservation and if necessary conservation fortransport. In the top coat process step, apart fromsingle layer also double layer compositions (basecoat and clear coat) are applied.These requirements lead to the application of at
least three coordinated coating layers (cf. Fig. 2).After each coating application, forced drying isnecessary, thus requiring energy input and gener-ating solvent emissions.
3.2. Description of the drying process
Although there are differences in coating andtheir dedicated drying processes between different
factories (even within the same company), a com-mon pattern exists. In Germany double-layer topcoats with a base and clear coat instead of sin-gle-layer coats are applied almost exclusively(Rentz et al., 2003).The major environmental impacts during the
drying process are caused by energy consumptionand volatile organic compound emissions fromsolvents in the coating material. The drying pro-cess consists of three independent drying tunnels:The drying tunnel for the cathodic immersionprime coating (KTL) with temperatures of around180 �C, the drying tunnel for the filler applicationat around 165 �C and the drying tunnel for the topcoat with typical temperatures around 140 �C (cf.Fig. 3). These temperatures are mean values andnot values of a specific coating material. More-over, these are the temperatures of the zone whereone temperature level is retained for most of thetime and does not consider the warm-up at thebeginning of the drying tunnel.The assembly line carries the chassis through
the drying tunnels and leads to drying times of50 minutes in the oven after cathodic immersionof the prime coating, 30 minutes in the filler ovenand almost 40 minutes in the top coat oven.The flue gas flow depends on the length of
the drying tunnel, the number of filters (fluegas stream per filter is constant) and furthertechnical process requirements. In generalthere are flue gas streams between 8000 and15,000 Nm3/h.These three drying tunnels use three indepen-
dent thermal incineration facilities. Thermal incin-eration is a proven technology, which offers a safe,reliable, and efficient method for the removal of awide range of VOCs (except halogenated hydro-carbons). They undergo oxidation in a combustionchamber at temperatures between 700 and1000 �C, to a certain extent with the addition offuel. Removal efficiencies up to 99% and evenabove can be achieved. A basic flowsheet is givenin Fig. 4.Delays resulting from malfunctions and down-
times in the production facilities cause an auto-mated shutdown of the heating in the dryingtunnels and an ensuing cooling down of these. In-creased energy consumption due to these down-
Fig. 2. Flowsheet of serial coating of passenger cars (Rentz et al., 2003).
tem
pera
ture
[ ˚C
]
20406080
100120140160180200
10 20 30 40
time [min]
Fig. 3. Run of the temperature curve in the top coat oven.
J. Geldermann et al. / European Journal of Operational Research xxx (2005) xxx–xxx 7
ARTICLE IN PRESS
times, which might be substantial, is not consid-ered in the following model.
3.3. Description of the model
The derived model maps the three drying pro-cess steps and considers their different temperature
requirements. The three former independent dry-ing process steps are mapped as a network. Inter-connections between the air streams are consideredfrom the top coat drying process with high de-mand for drying air, to the filler and the primecoating drying processes with relatively lowerrequirements. These flows are illustrated in
Filler ApplicationApplication
Cathodic ImmersionPrime Coating
Combustion
180˚C
165˚C 140˚C
140˚C 165˚C
800˚C
800˚C
20˚C
20˚C
140˚C
180˚C
5.000 m3/h
10.000 m3/h
15.000 m3/h15.000 m3/h
15.000 m3/h
Basecoat/Topcoat
5.000 m3/h
5.000 m3/h
Chamber
Fig. 5. Model of the drying processes.1
•
HeatExchanger
• Waste gas flowrate [m3/h]
• VOC concentration [mg/m3]
• Temperature [°C]
Combustion Chamber
• Clean gas flow rate[m3/h]
•[mg/m3]
• Temperature [°C]
• Temperature [°C]• Residence time [s]• Design
•• Design
Waste gas
Fuel [m3/h]
VOC concentration
Surface [m2] Clean gas
Fig. 4. General scheme of the thermal incineration process with relevant parameters.
1 Symbols according to DIN Norm 280042 Toluene is one of a broad variety of solvents used inindustrial applications.
8 J. Geldermann et al. / European Journal of Operational Research xxx (2005) xxx–xxx
ARTICLE IN PRESS
Fig. 5. Air, which comes from the top-coat appli-cation, can be used in the drying tunnel of the fillerapplication and then in the drying tunnel of thecathodic immersion coating. Inlet and outlet tem-peratures are the constraints put on the differentflow connections. Fig. 5 only illustrates the coldand hot process streams and not the utility flows.The minimum difference of the driving temper-
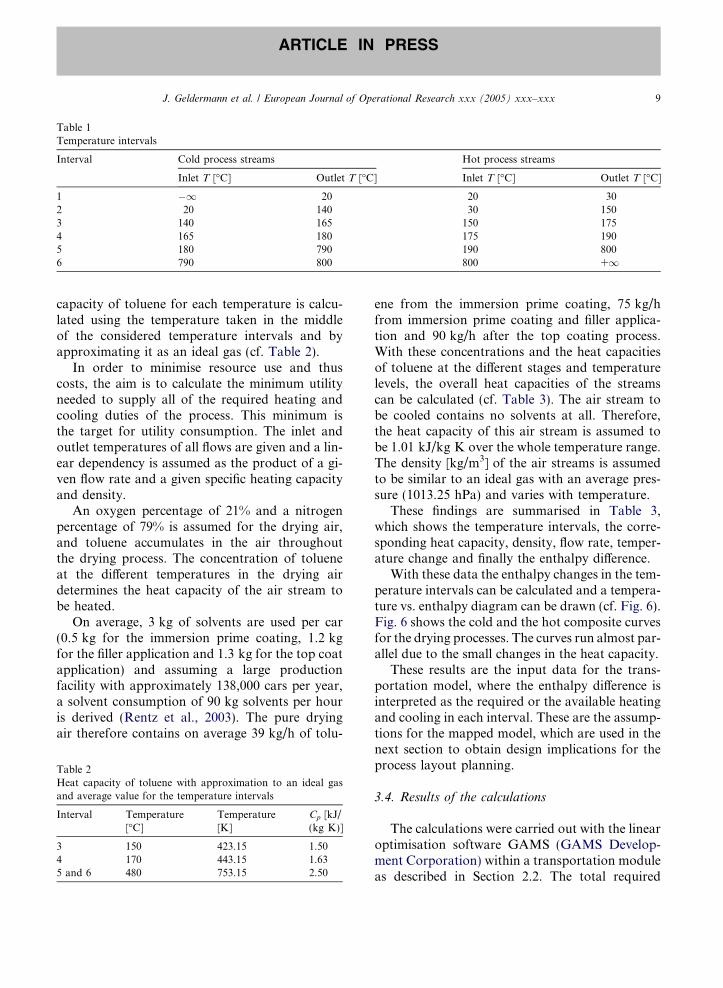
ature of the heat exchanger network is set to 10 �C.This leads to the possible pinch temperatures ofthe inlet and outlet temperatures plus the projectedtemperatures 10 �C below or above these (cf. Ta-ble 1).The temperature intervals start with the re-
quired cooling enthalpy at the lowest temperature(�1 to 20 �C) and end with the required heatingenthalpy at the highest temperature. Since there
is no VOC present in the hot process streams, thesestreams have not been projected, because the slopeof the hot composite curve would not change atthese points. Furthermore, a supply of 5000 m3/hof fresh air is assumed.Toluene is assumed to be the solvent used in the
coating process.2 Since the boiling point of tolueneis at 110.6 �C, only the heat capacity of the gasphase needs to be considered and no phasechanges occur in the considered exchanger system(cooling the hot streams down from 800 �C to20 �C is irrelevant in this case since the air hasbeen purified and is thus solvent free). The heat
Table 1Temperature intervals
Interval Cold process streams Hot process streams
Inlet T [�C] Outlet T [�C] Inlet T [�C] Outlet T [�C]
J. Geldermann et al. / European Journal of Operational Research xxx (2005) xxx–xxx 9
ARTICLE IN PRESS
capacity of toluene for each temperature is calcu-lated using the temperature taken in the middleof the considered temperature intervals and byapproximating it as an ideal gas (cf. Table 2).In order to minimise resource use and thus
costs, the aim is to calculate the minimum utilityneeded to supply all of the required heating andcooling duties of the process. This minimum isthe target for utility consumption. The inlet andoutlet temperatures of all flows are given and a lin-ear dependency is assumed as the product of a gi-ven flow rate and a given specific heating capacityand density.An oxygen percentage of 21% and a nitrogen
percentage of 79% is assumed for the drying air,and toluene accumulates in the air throughoutthe drying process. The concentration of tolueneat the different temperatures in the drying airdetermines the heat capacity of the air stream tobe heated.On average, 3 kg of solvents are used per car
(0.5 kg for the immersion prime coating, 1.2 kgfor the filler application and 1.3 kg for the top coatapplication) and assuming a large productionfacility with approximately 138,000 cars per year,a solvent consumption of 90 kg solvents per houris derived (Rentz et al., 2003). The pure dryingair therefore contains on average 39 kg/h of tolu-
Table 2Heat capacity of toluene with approximation to an ideal gasand average value for the temperature intervals
ene from the immersion prime coating, 75 kg/hfrom immersion prime coating and filler applica-tion and 90 kg/h after the top coating process.With these concentrations and the heat capacitiesof toluene at the different stages and temperaturelevels, the overall heat capacities of the streamscan be calculated (cf. Table 3). The air stream tobe cooled contains no solvents at all. Therefore,the heat capacity of this air stream is assumed tobe 1.01 kJ/kg K over the whole temperature range.The density [kg/m3] of the air streams is assumedto be similar to an ideal gas with an average pres-sure (1013.25 hPa) and varies with temperature.These findings are summarised in Table 3,
which shows the temperature intervals, the corre-sponding heat capacity, density, flow rate, temper-ature change and finally the enthalpy difference.With these data the enthalpy changes in the tem-
perature intervals can be calculated and a tempera-ture vs. enthalpy diagram can be drawn (cf. Fig. 6).Fig. 6 shows the cold and the hot composite curvesfor the drying processes. The curves run almost par-allel due to the small changes in the heat capacity.These results are the input data for the trans-
portation model, where the enthalpy difference isinterpreted as the required or the available heatingand cooling in each interval. These are the assump-tions for the mapped model, which are used in thenext section to obtain design implications for theprocess layout planning.
3.4. Results of the calculations
The calculations were carried out with the linearoptimisation software GAMS (GAMS Develop-ment Corporation) within a transportation moduleas described in Section 2.2. The total required
Table 3Temperature intervals and enthalpy changes within the process
Fig. 6. Composite curves of the cold curve and the hot.
Table 4Heat-transfer-table
Interval Hot process streams
1 2 3
Cold process streams 12 589,144 16,6823 290,608456
Cold utility 59,799
Sum 59,799 589,144 307,290
10 J. Geldermann et al. / European Journal of Operational Research xxx (2005) xxx–xxx
ARTICLE IN PRESS
energy for cooling and heating is 263,914 kJ/h andresults in a pinch point at a temperature of 20 �Cfor the cold flows and 30 �C for the hot flows atthe bottom of the composite curves. The requiredadditional enthalpy is determined by adding theadditional heating for various streams204,115 kJ/h with cooling at the coldest processstream, where no internal process stream is avail-able 59,799 kJ. Table 4 shows the interconnectionbetween the different process streams and theutilities.These results imply that connection of the dif-
ferent drying tunnels and modelling of the differentflows deliver a good insight into the serial coatingof raw chassis. Heat is not only transferred withineach drying tunnel, but also between the differentdrying tunnels.
Hot utility Sum
4 5 6
0605,826
25,709 316,317176,079 4688 180,767
4,247,478 123,197 4,370,67550,521 50,521
59,799
176,079 4,247,478 0 204,115 263,914
J. Geldermann et al. / European Journal of Operational Research xxx (2005) xxx–xxx 11
ARTICLE IN PRESS
Since the separation of VOC from waste gases isusually carried out via thermal condensation, asdescribed in this case study, the pinch analysiscan also be implemented on waste gases containingVOC, as this case study demonstrates, or multi-component VOC (see also Dunn and El-Halwagi,1994; Dunn and Bush, 2001; Parthasarathy andEl-Halwagi, 2000). Thus the reclamation of organ-ic solvents can be translated to a problem of heatexchanger networks. This approach opens the pathto further integrated process enhancements, butwill also lead to trade-offs between the differentobjectives and to a multi-criteria problem. It be-comes obvious, that not only the chemical proper-ties of VOC-emissions (causing photochemicaloxidant formation), but also their calorific valueis of interest in process optimisation. A trade-offbetween reduced VOC-content in paints and in-creased energy consumption for the drying processshould be taken into consideration.
4. Discussion
With the advent of more advanced processmodels and computational power, process inte-gration technologies gain in importance. Variousprocess layout options can be investigated byhelp of unit operations modelling mass and en-ergy flows in parallel. Likewise, the scope ofthe process model can be enhanced graduallyretaining a manageable level of computationalcomplexity.The advantage of the pinch analysis can be seen
in the determination of the theoretical optimumfor a given set of heat and material streams.Zhelev and Semkov (2004) state that pinch
analysis has a little different process modelling ap-proach to classical unit operation modelling—itlooks for firm constraints to deliver design guide-lines. Based on these constraints an idealised max-imum of heat and mass transfer is to be set andaccepted as the so-called target for future design.In the approaches of the pinch analyses dis-
cussed so far, however, only single energy andmaterial flows were regarded. Even the ‘‘Multi-component-VOC-Strategies’’ (Dunn and El-Halwagi, 1994) had only one target figure in
Operations Research terms, in which the processdesign was formulated as a MINLP-Problem(mixed-integer non-linear program) for the mini-misation of the total average annual costs (annu-ity method) of the company�s internal network;the boundary conditions being material and heatbalances, and economics, environment and ther-modynamics being the constraints (Chen et al.,2004).Especially an inter-enterprise application of
process integration technologies may lead to sig-nificant savings in energy and raw material con-sumption, if certain preconditions are fulfilled(such as short distances between plants or thepossibility of storing material in buffer tanks).Then, target values other than those originallysought (e.g. VOC recovery), such as the optimisa-tion of energy consumption and water conserva-tion can come to light. Through the parallelreduction of water use, energy consumption andVOC emissions, a multi-criteria process designproblem for company-wide facility planning mustbe solved, in order to implement efficient recyclingcascades. Resulting conflicting solutions must beevaluated based on a multi-criteria approach.For this purpose the following procedure issuggested:
1. Pinch analysis for the optimal interlinking ofheat flows with heat exchangers.
2. Mass pinch analysis for waste disposal orrelated material flows, in order to minimisematerial use and waste production.
3. Water pinch analysis.4. If there is no overlap between the pinch analy-ses in the process design, all identified recyclingcascades can be realised at once.
5. If overlaps occur, multi-criteria decision sup-port algorithms can be used to derive a prioriti-sation. For this purpose convenient OR models(for instance the Outranking method PROM-ETHEE, Brans et al., 1986; Geldermann andRentz, 2001) can be employed and modified,this requires further research.
The requirements for the implementation of theproposed method are measurable indicators ofmaterial and energy flow, e.g. temperature,
12 J. Geldermann et al. / European Journal of Operational Research xxx (2005) xxx–xxx
ARTICLE IN PRESS
COD3 requirements, VOC concentration or effi-ciency. Thanks to breakthroughs in molecularmodelling, scientific instrumentation, related sig-nal processing and powerful computational tools,in the near future massive progress is expected inchemical engineering, which allows for a ‘‘multi-scale and multi-disciplinary computational chemi-cal engineering modelling and simulation of reallife situations’’ throughout the entire supply chain,beginning at the molecular level and aggregating insubsequent steps to the process level (Charpentier,2002). In addition, this will also introduce newpossibilities for cleaner technologies and environ-mental protection by optimally combining processintegrated emission reduction measures and end-of-pipe technologies challenging also the researchin the field of Operations Research.
5. Summary
Process optimisation, materials reuse and inparticular, the optimisation of energy use have along tradition in process engineering. Tools forintegrated process design now aim at a holistic ap-proach to process design, retrofitting, and opera-tions planning. In a preliminary design, cost andenergy ‘‘targets’’ (i.e. the minimum possible valuesof these objectives) are calculated based on pinchanalysis. This approach can also be applied forthe optimisation of drying processes, as the pre-sented case study from serial automobile coatingshows. The derived model maps the three dryingprocess steps while considering their different tem-perature requirements as a network.From a methodological point of view, the pinch
analysis can be formulated as a classical transpor-tation problem in Operations Research terms.Important for an appropriate mapping of the plantto be examined, is the detailed consideration of thetechnical requirements of the underlying processes.If more than one target (such as energy) is re-garded, or an inter-enterprise application concernsa larger network, the consideration of all possibleinterconnections, however, easily leads to a combi-
3 Chemical oxygen demand.
natorial problem, requiring appropriate ORalgorithms.It can be concluded that the pinch analysis,
combining economic and ecological aspects witha multi-disciplinary approach, makes eco-effi-ciency operational. In combination with appropri-ate Operations Research methods, new insightsinto plant layout planning and emission reductionmeasures can be achieved.
Acknowledgements
This work is part of the PepOn-Project (Inte-grated Process Design for the Inter-Enterprise Plant
Layout Planning of Dynamic Mass Flow Networks)funded by a grant of the VolkswagenStiftung(http://www.volkswagen-stiftung.de/). We wouldlike to thank the VolkswagenStiftung for theirexcellent support of our research.
References
AspenTech: ASPEN PLUS, Boston, MA, USA. Availablefrom: <http://www.aspentech.com/>.
Brans, J.P., Vincke, Ph., Marshal, B., 1986. How to select andhow to rank projects: The PROMETHEE method. Euro-pean Journal of Operational Research 24, 228–238.
Cerda, J., Westerberg, A., Manson, D., Linnhoff, B., 1983.Minimum utility usage in heat exchanger network synthe-sis—a transportation problem. Chemical Engineering Sci-ence 38 (3), 373–387.
Charpentier, J.-C., 2002. The triplet ‘‘molecular processes—product—process engineering’’: The future of chemicalengineering?. Chemical Engineering Science 57, 4667–4690.
Chen, H., Wen, Y., Waters, M., Shonnard, D., 2004. Designguidance for chemical processes using environmental andeconomic assessments. Industrial and Engineering Chemis-try Research 43 (2), 535–552.
Clift, R., Longley, A.J., 1995. Introduction to clean technology.In: Kirkwood, R.C., Longley, A.J. (Eds.), Clean Technol-ogy and the Environment. Chapman Hall, Glasgow, pp.174–198.
Douglas, J.M., 1988. Conceptual Design of Chemical Processes.McGraw-Hill, New York.
Dunn, R.F., Bush, G.E., 2001. Using process integrationtechnology for CLEANER production. Journal of CleanerProduction 9, 1–23.
GAMS Development Corporation: GAMS, Washington, DC,USA. Available from: <http://www.gams.com/>.
Garcıa-Flores, R., Wang, X.Z., 2002. A multi-agent system forchemical supply chain simulation and management support.OR Spectrum 24, 343–370.
Garcıa-Flores, R., Wang, X.Z., Goltz, G.E., 2000. Agent-basedinformation flow for process industries� supply chain mod-elling. Computers and Chemical Engineering 24, 1135–1141.
Geldermann, J., Rentz, O., 2001. Integrated technique assess-ment with imprecise information as a support for theidentification of Best Available Techniques (BAT). ORSpectrum 23, 137–157.
Geldermann, J., Rentz, O., 2005. Multi-criteria analysis for theassessment of environmentally relevant installations. Jour-nal of Industrial Ecology.
Graedel, T., Allenby, B.R., 2003. Industrial Ecology. AT&T.Leffland, K., Kaersgaard, H., 1997. Comparing EnvironmentalImpact Data on Cleaner Technologies. EEA (EuropeanEnvironmental Agency), Copenhagen.
Linnhoff, B., 2002. Systematisches Vorgehen bei Utility Ein-sparung—Beispiele Wasser und Energie, Umweltmanage-ment Symposium, Stuttgart.
Linnhoff, B., Manson, D., Wardle, I., 1979. Understanding heatexchanger networks. Computers and Chemical Engineering3, 295–302.
Linnhoff, B., Turner, J.A., 1981. Heat-recovery networks: Newinsights yield big savings. Chemical Engineering.
Max Planck Institute for Dynamics of Complex TechnicalSystems: DIVA, Magdeburg. Available from: <http://www.mpi-magdeburg.mpg.de/>.
Parthasarathy, G., El-Halwagi, M.M., 2000. Optimum massintegration strategies for condensation and allocation ofmulticomponent VOCs. Chemical Engineering Science 55,881–895.
Penkuhn, T., Spengler, T., Puchert, H., Rentz, O., 1997.Environmental integrated production planning for theammonia synthesis. European Journal of OperationalResearch 97 (2), 327–336.
Peters, M.S., Timmerhaus, K.D., West, R.E., 2003Plant Designand Economics for Chemical Engineers, vol. 5. McGraw-Hill, New York.
Rentz, O., Peters, N.H., Nunge, S., Geldermann, J., 2003.Bericht uber Beste Verfugbare Techniken (BVT) in DenBereichen Der Lack- Und Klebstoffanwendung in Deutsch-land/Reports on the Best Available Techniques (BAT) inthe Sectors of Paint and Adhesive Application in Germany(deutsch/english). VDI-Verlag, Dusseldorf.
Roelant, G., Kemppainen, A.J., Shonnard, D.R., 2004. Assess-ment of the automobile assembly paint process for energy,environment and economic improvement. Journal of Indus-trial Ecology 8 (1–2), 173–191.
SimSci-Esscor—Invensys: PRO II, Carlsbad, CA, USA. Avail-able from: <http://www.simsci.com/products/proii.stm>.
Spengler, T., Puchert, H., Penkuhn, T., Rentz, O., 1997.Environmental integrated production and recycling man-agement. European Journal of Operational Research 97 (2),308–327.
Tsatsaronis, G., Pisa, J.J., Lin, L., 1990. The effect ofassumptions on the detailed exergoeconomic analysis of asteam power plant design configuration, Part 1: Theoreticaldevelopment. In: A Future for energy—Flowers�90: Pro-ceedings of the Florence World Energy Research Sympo-sium, Firence.
Zhang, G., Hua, B., Chen, Q., 2000. Exergoeconomic method-ology for analysis and optimization of process systems.Computers and Chemical Engineering 24 (2–7), 613–618.
Zhelev, T.K., Semkov, K.A., 2004. Cleaner flue gas and energyrecovery through pinch analysis. Journal of Cleaner Pro-duction 12, 165–170.
Zhou, Z., Cheng, S., Hua, B., 2000. Supply chain optimizationof continuous process industries with sustainability consid-erations. Computers and Chemical Engineering 24 (2–7),1151–1158.