Special Publication No. 11-18 Pink Salmon Stock Status and Escapement Goals in Southeast Alaska by Andrew W. Piston and Steven C. Heinl December 2011 Alaska Department of Fish and Game Divisions of Sport Fish and Commercial Fisheries
Transcript
Special Publication No. 11-18
Pink Salmon Stock Status and Escapement Goals in Southeast Alaska
by
Andrew W. Piston
and
Steven C. Heinl
December 2011
Alaska Department of Fish and Game Divisions of Sport Fish and Commercial Fisheries
Symbols and Abbreviations The following symbols and abbreviations, and others approved for the Système International d'Unités (SI), are used without definition in the following reports by the Divisions of Sport Fish and of Commercial Fisheries: Fishery Manuscripts, Fishery Data Series Reports, Fishery Management Reports, and Special Publications. All others, including deviations from definitions listed below, are noted in the text at first mention, as well as in the titles or footnotes of tables, and in figure or figure captions. Weights and measures (metric) centimeter cm deciliter dL gram g hectare ha kilogram kg kilometer km liter L meter m milliliter mL millimeter mm Weights and measures (English) cubic feet per second ft3/s foot ft gallon gal inch in mile mi nautical mile nmi ounce oz pound lb quart qt yard yd Time and temperature day d degrees Celsius °C degrees Fahrenheit °F degrees kelvin K hour h minute min second s Physics and chemistry all atomic symbols alternating current AC ampere A calorie cal direct current DC hertz Hz horsepower hp hydrogen ion activity pH (negative log of) parts per million ppm parts per thousand ppt, ‰ volts V watts W
General Alaska Administrative Code AAC all commonly accepted abbreviations e.g., Mr., Mrs.,
AM, PM, etc. all commonly accepted professional titles e.g., Dr., Ph.D., R.N., etc. at @ compass directions:
east E north N south S west W
copyright corporate suffixes:
Company Co. Corporation Corp. Incorporated Inc. Limited Ltd.
District of Columbia D.C. et alii (and others) et al. et cetera (and so forth) etc. exempli gratia (for example) e.g. Federal Information Code FIC id est (that is) i.e. latitude or longitude lat. or long. monetary symbols (U.S.) $, ¢ months (tables and figures): first three letters Jan,...,Dec registered trademark trademark United States (adjective) U.S. United States of America (noun) USA U.S.C. United States
Code U.S. state use two-letter
abbreviations (e.g., AK, WA)
Mathematics, statistics all standard mathematical signs, symbols and abbreviations alternate hypothesis HA base of natural logarithm e catch per unit effort CPUE coefficient of variation CV common test statistics (F, t, χ2, etc.) confidence interval CI correlation coefficient (multiple) R correlation coefficient (simple) r covariance cov degree (angular ) ° degrees of freedom df expected value E greater than > greater than or equal to ≥ harvest per unit effort HPUE less than < less than or equal to ≤ logarithm (natural) ln logarithm (base 10) log logarithm (specify base) log2, etc. minute (angular) ' not significant NS null hypothesis HO percent % probability P probability of a type I error (rejection of the null hypothesis when true) α probability of a type II error (acceptance of the null hypothesis when false) β second (angular) " standard deviation SD standard error SE variance population Var sample var
SPECIAL PUBLICATION NO. 11-18
PINK SALMON STOCK STATUS AND ESCAPEMENT GOALS IN SOUTHEAST ALASKA
By Andrew W. Piston and Steven C. Heinl
Alaska Department of Fish and Game, Division of Commercial Fisheries, Ketchikan
Development and publication of this manuscript were partially funded through awards AR45800/GR45005 [project #45321] and AR45900/GR45006 [project #45964] from the National Oceanic and Atmospheric Administration, U.S. Department of Commerce, administered by the Alaska Department of Fish and Game; and the Pacific Salmon Treaty Implementation grant #NA10NMF4380300. Statements, findings, conclusions, and recommendations are those of the authors and do not necessarily reflect the views of the National Oceanic and Atmospheric Administration and the U.S. Department of Commerce.
Alaska Department of Fish and Game Division of Sport Fish, Research and Technical Services 333 Raspberry Road, Anchorage, Alaska, 99518-1565
December 2011
The Special Publication series was established by the Division of Sport Fish in 1991 for the publication of techniques and procedures manuals, informational pamphlets, special subject reports to decision-making bodies, symposia and workshop proceedings, application software documentation, in-house lectures, and became a joint divisional series in 2004 with the Division of Commercial Fisheries. Special Publications are intended for fishery and other technical professionals. Special Publications are available through the Alaska State Library, Alaska Resources Library and Information Services (ARLIS) and on the Internet: http://www.adfg.alaska.gov/sf/publications/. This publication has undergone editorial and peer review.
Andrew W. Piston and Steven C. Heinl, Alaska Department of Fish and Game, Division of Commercial Fisheries,
2030 Sea Level Drive, Ketchikan, Alaska 99901, USA
This document should be cited as: Piston, A. W. and S. C. Heinl. 2011. Pink salmon stock status and escapement goals in Southeast Alaska. Alaska
Department of Fish and Game, Special Publication No. 11-18, Anchorage.
The Alaska Department of Fish and Game (ADF&G) administers all programs and activities free from discrimination based on race, color, national origin, age, sex, religion, marital status, pregnancy, parenthood, or disability. The department administers all programs and activities in compliance with Title VI of the Civil Rights Act of 1964, Section 504 of the Rehabilitation Act of 1973, Title II of the Americans with Disabilities Act (ADA) of 1990, the Age Discrimination Act of 1975, and Title IX of the Education Amendments of 1972.
If you believe you have been discriminated against in any program, activity, or facility please write: ADF&G ADA Coordinator, P.O. Box 115526, Juneau, AK 99811-5526
U.S. Fish and Wildlife Service, 4401 N. Fairfax Drive, MS 2042, Arlington, VA 22203 Office of Equal Opportunity, U.S. Department of the Interior, 1849 C Street NW MS 5230, Washington DC 20240
The department’s ADA Coordinator can be reached via phone at the following numbers: (VOICE) 907-465-6077, (Statewide Telecommunication Device for the Deaf) 1-800-478-3648,
(Juneau TDD) 907-465-3646, or (FAX) 907-465-6078 For information on alternative formats and questions on this publication, please contact:
ADF&G Division of Sport Fish, Research and Technical Services, 333 Raspberry Road, Anchorage AK 99518 (907) 267-2375.
LIST OF TABLES.......................................................................................................................................................... i
LIST OF FIGURES ....................................................................................................................................................... ii
LIST OF APPENDICES ............................................................................................................................................... ii
Yakutat Area Escapement Goals ................................................................................................................................... 7 Revision of Situk River Escapement Goal ................................................................................................................ 7
STOCK STATUS .......................................................................................................................................................... 9
Yakutat Area Stock Status ............................................................................................................................................. 9 Southeast Alaska Stock Status ..................................................................................................................................... 10
APPENDIX A: ADF&G SALMON MANAGEMENT AREA AND STOCK GROUP MAPS IN SOUTHEAST ALASKA ................................................................................................................................................................ 21
APPENDIX B: PINK SALMON ESCAPEMENT AND HARVEST IN SOUTHEAST ALASKA .......................... 27
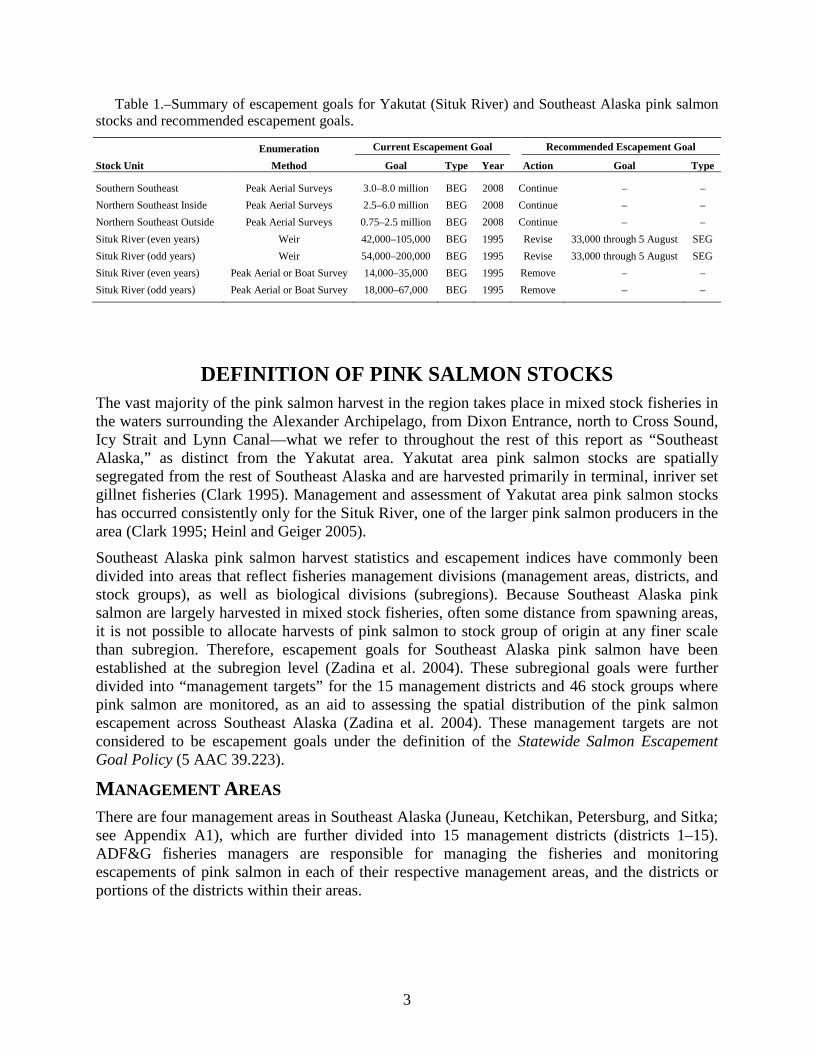
LIST OF TABLES Table Page 1. Summary of escapement goals for Yakutat (Situk River) and Southeast Alaska pink salmon stocks and
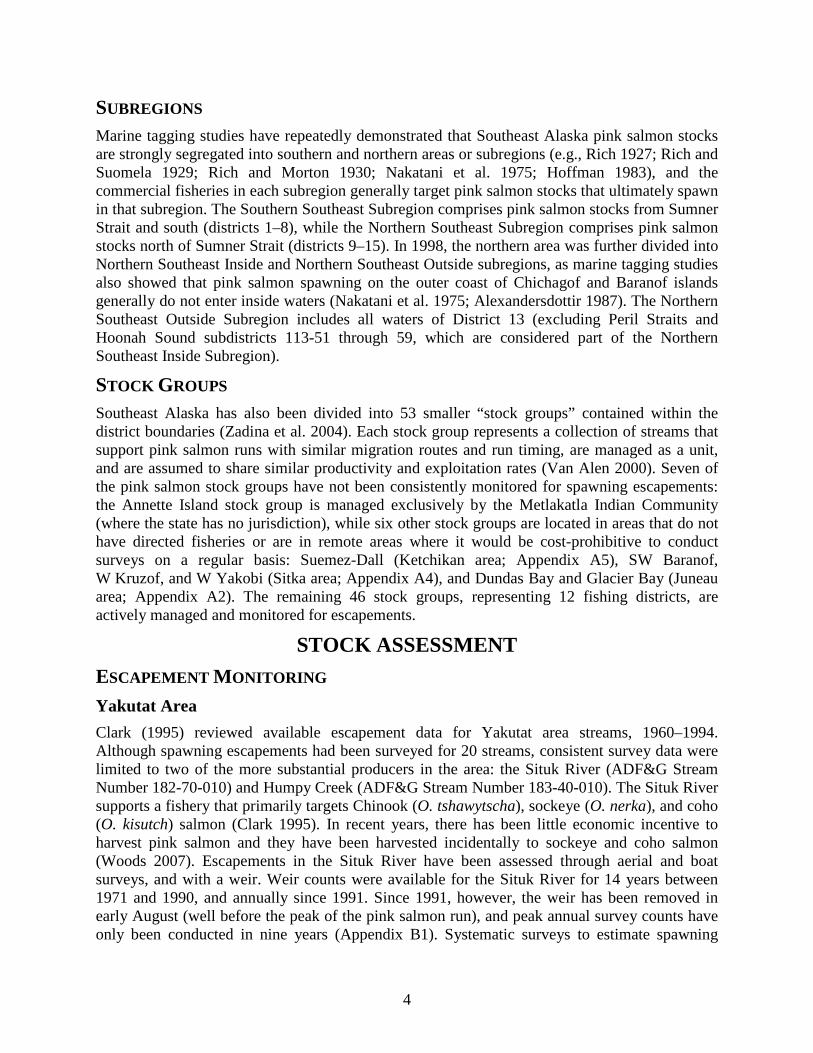
recommended escapement goals. .................................................................................................................... 3 2. Distribution of pink salmon escapement index streams based on the 1960–2010 median escapement
peak survey value by stream. .......................................................................................................................... 6 3. Criteria used to estimate sustainable escapement goals (SEG) using the percentile method. ......................... 8 4. Southeast Alaska pink salmon escapement target ranges by district (in millions), 2001–2010.. .................. 13 5. Southeast Alaska pink salmon escapement target ranges by stock group (in millions), 2001–2010. ............ 14
ii
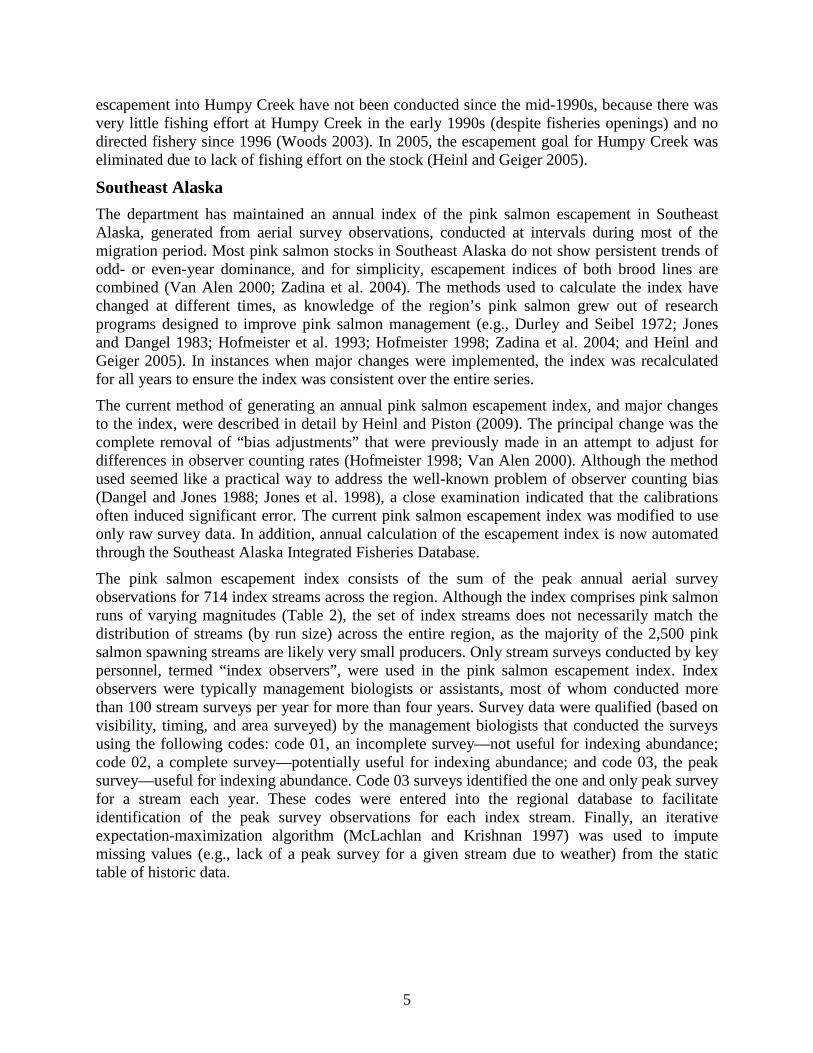
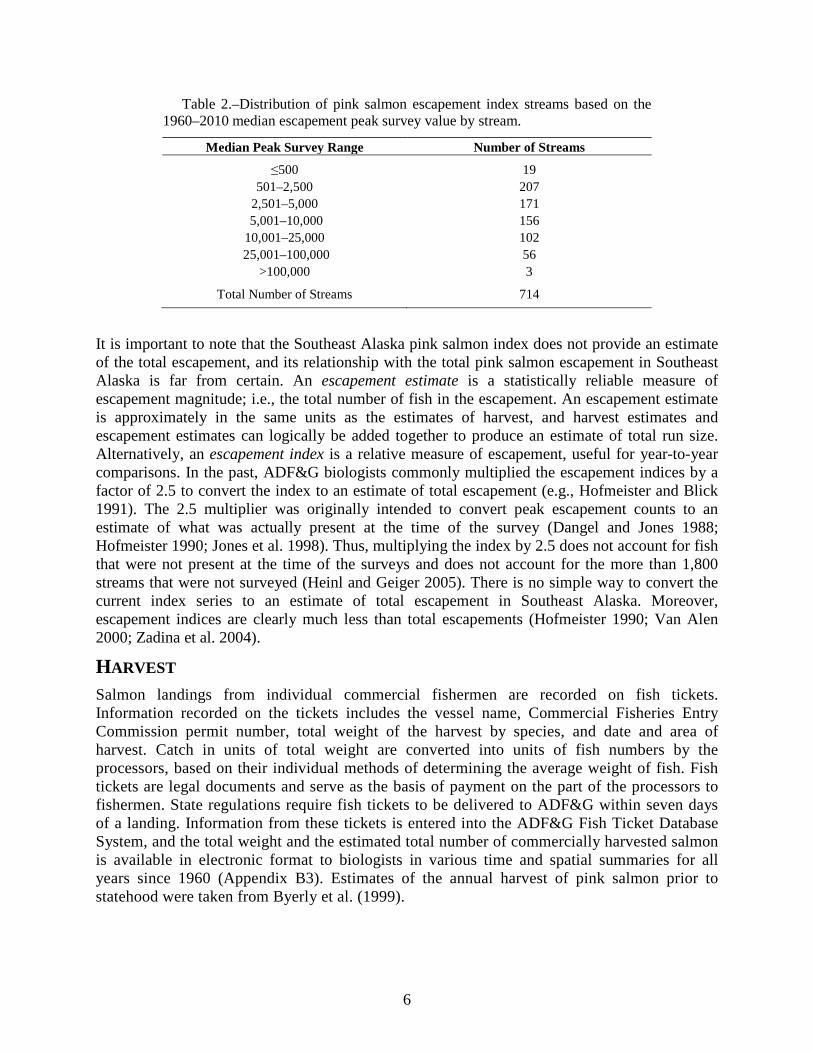
LIST OF FIGURES Figure Page 1. Annual harvest of wild and hatchery-produced pink salmon in Southeast Alaska, 1890–2010.. .................... 2 2. Annual Situk River pink salmon harvest since 1960, and weir-based escapement index for the Situk
River, 1988–2010.. ........................................................................................................................................ 10 3. Annual pink salmon harvest and escapement index for the Southern Southeast Subregion, 1960–2010. ..... 11 4. Annual pink salmon harvest and escapement index for the Northern Southeast Inside Subregion, 1960–
2010. .............................................................................................................................................................. 12 5. Annual pink salmon harvest and escapement index for the Northern Southeast Outside Subregion,
1960–2010 ..................................................................................................................................................... 12 6. Annual pink salmon harvest and the Pacific Decadal Oscillation (PDO) index, 1920–2010. ....................... 17
LIST OF APPENDICES Appendix Page A1. ADF&G salmon management areas in Southeast Alaska. ............................................................................ 22 A2. The ADF&G Juneau salmon management area and associated pink salmon escapement stock groups.
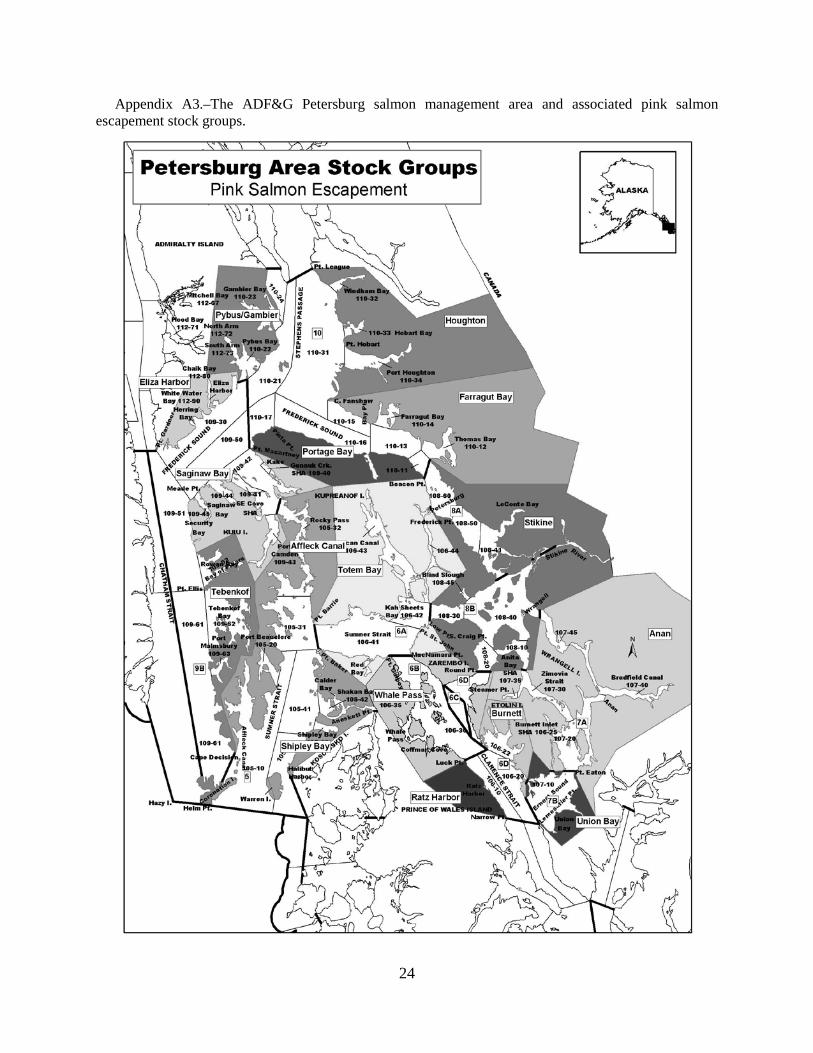
Cross-hatched stock groups indicate areas with no index streams or escapement targets. ............................ 23 A3. The ADF&G Petersburg salmon management area and associated pink salmon escapement stock
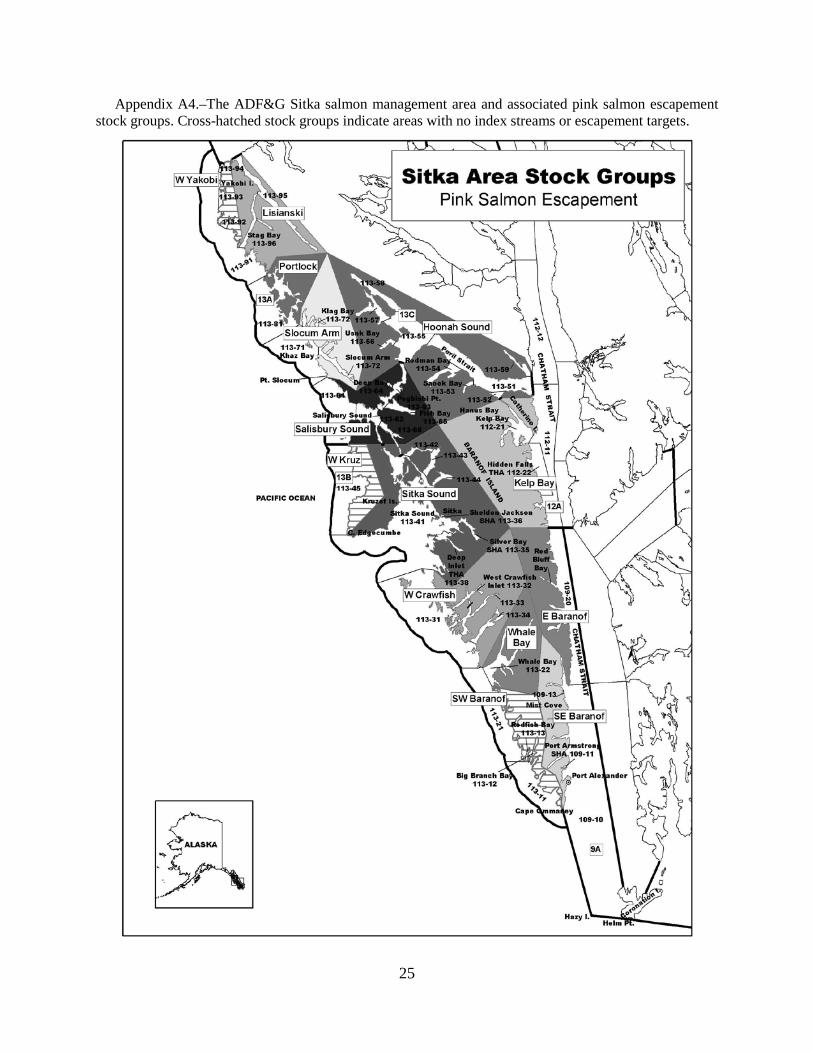
groups. ........................................................................................................................................................... 24 A4. The ADF&G Sitka salmon management area and associated pink salmon escapement stock groups. ......... 25 A5. The ADF&G Ketchikan salmon management area and associated pink salmon escapement stock
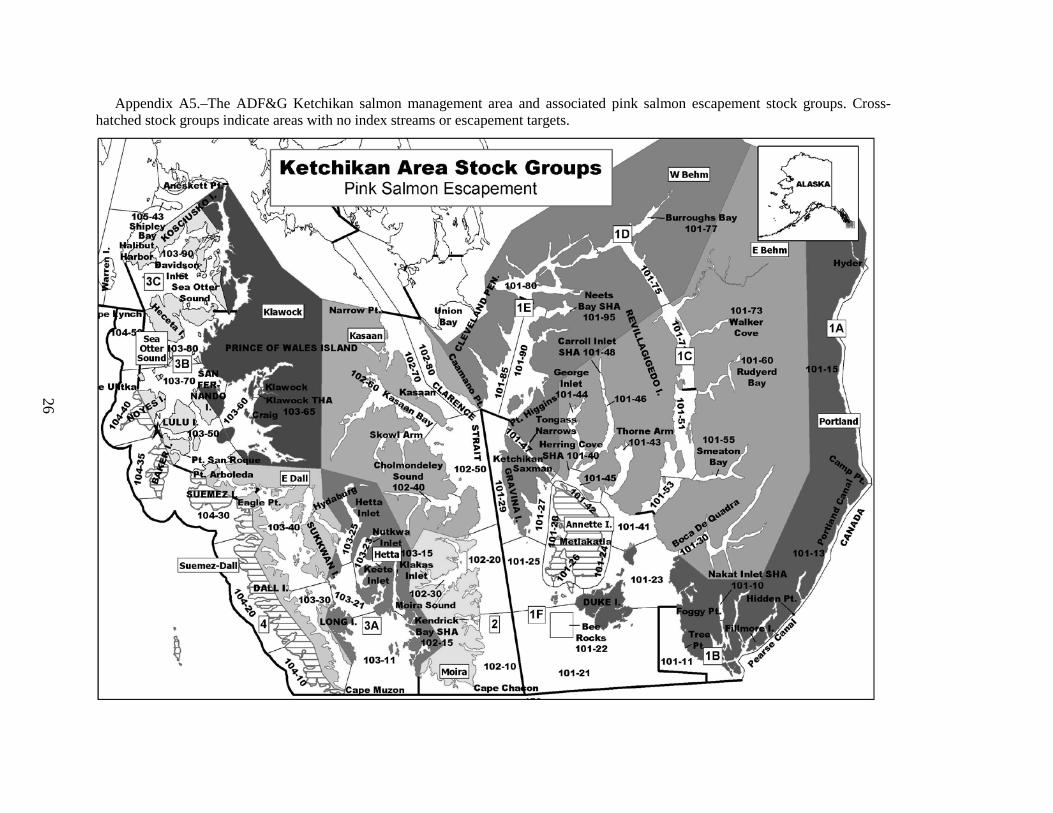
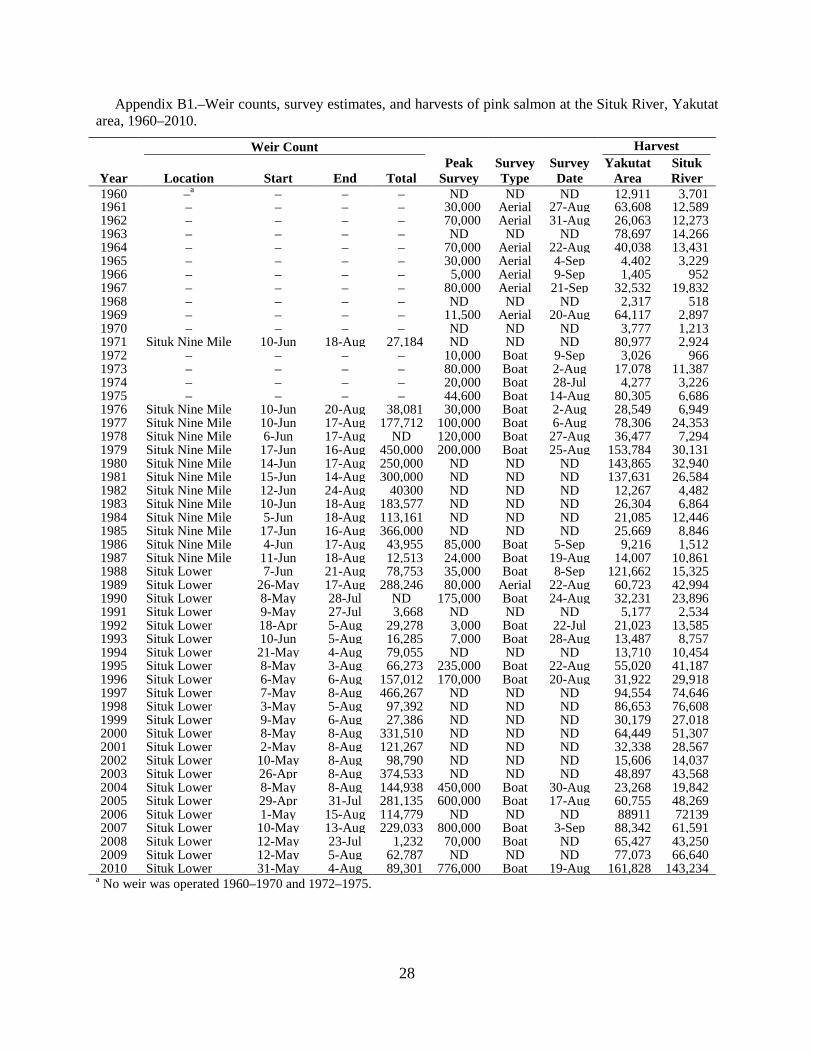
groups. Cross-hatched stock groups indicate areas with no index streams or escapement targets. ............... 26 B1. Weir counts, survey estimates, and harvests of pink salmon at the Situk River, Yakutat area, 1960–
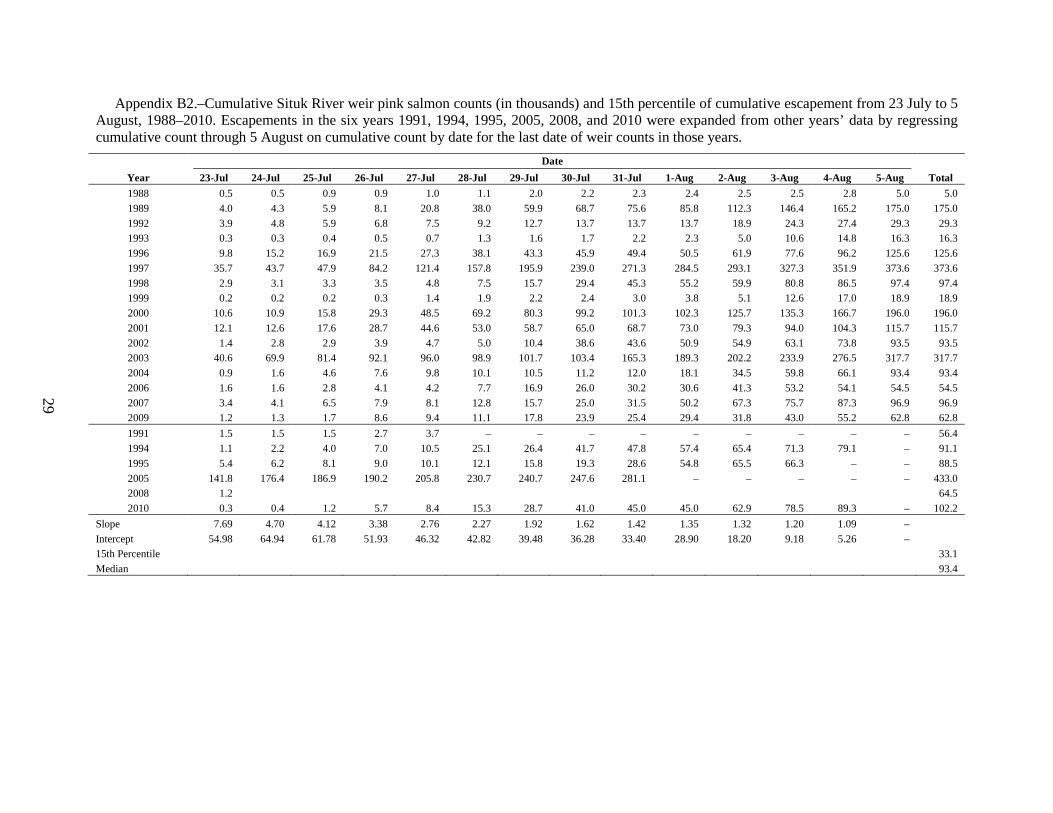
2010. .............................................................................................................................................................. 28 B 2. Cumulative Situk River weir pink salmon counts (in thousands) and 15th percentile of cumulative
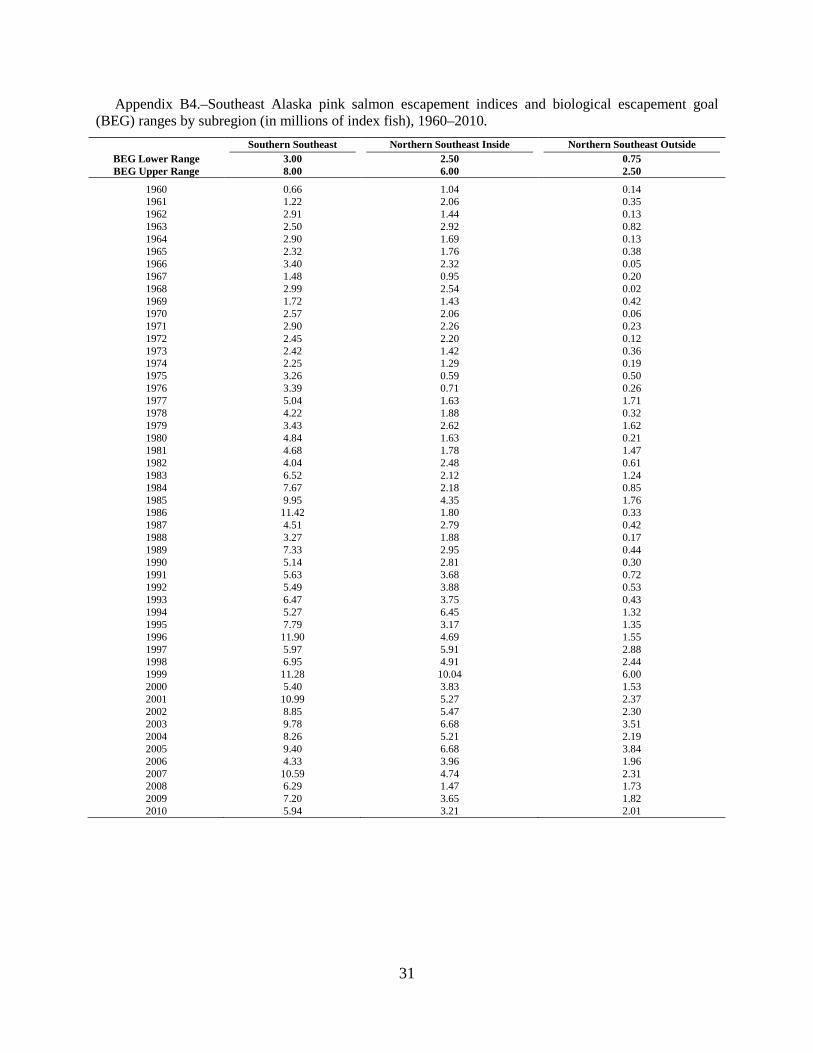
escapement from 23 July to 5 August, 1988–2010. ....................................................................................... 29 B3. Southeast Alaska pink salmon harvest by subregion, 1960–2010. ................................................................ 30 B4. Southeast Alaska pink salmon escapement indices and biological escapement goal (BEG) ranges by
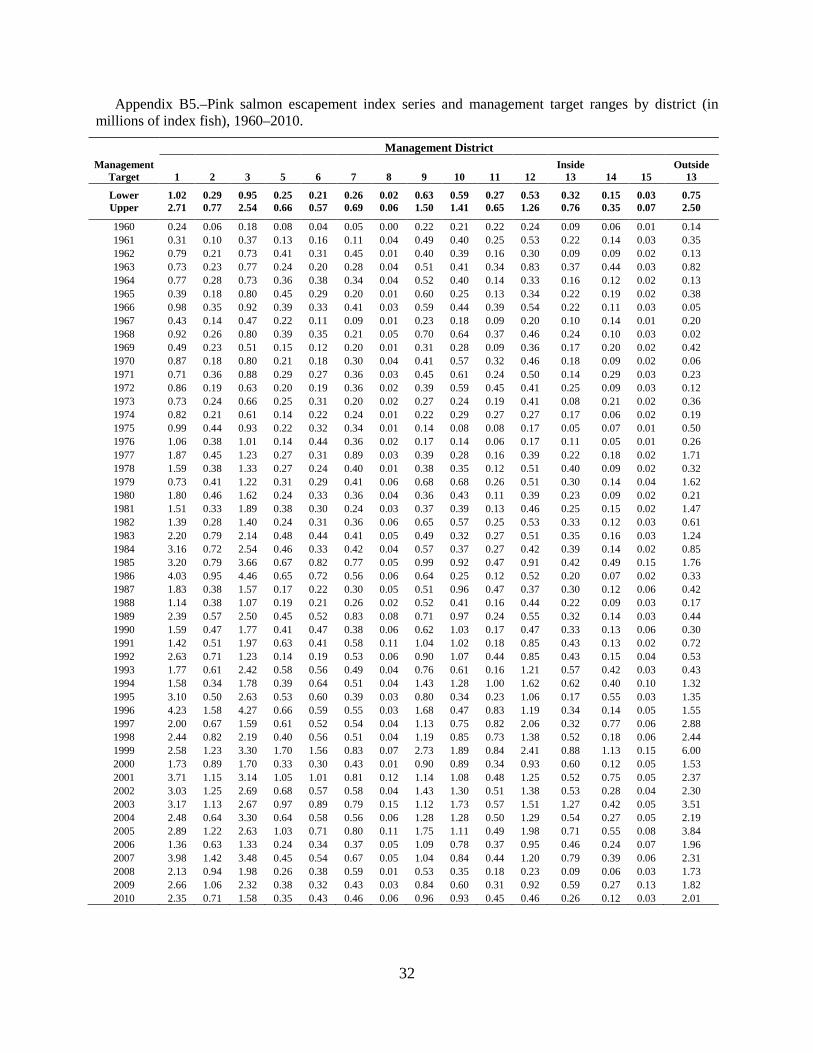
subregion (in millions of index fish), 1960–2010. ........................................................................................ 31 B5. Pink salmon escapement index series and management target ranges by district (in millions of index
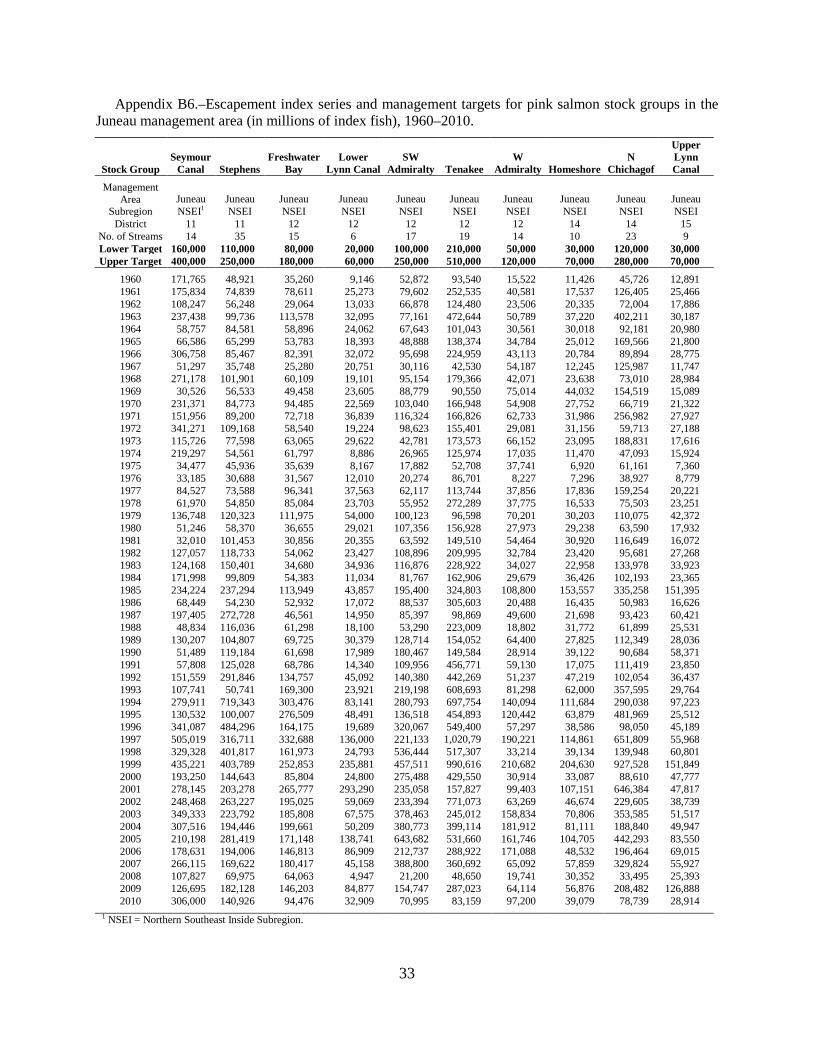
fish), 1960–2010. ........................................................................................................................................... 32 B6. Escapement index series and management targets for pink salmon stock groups in the Juneau
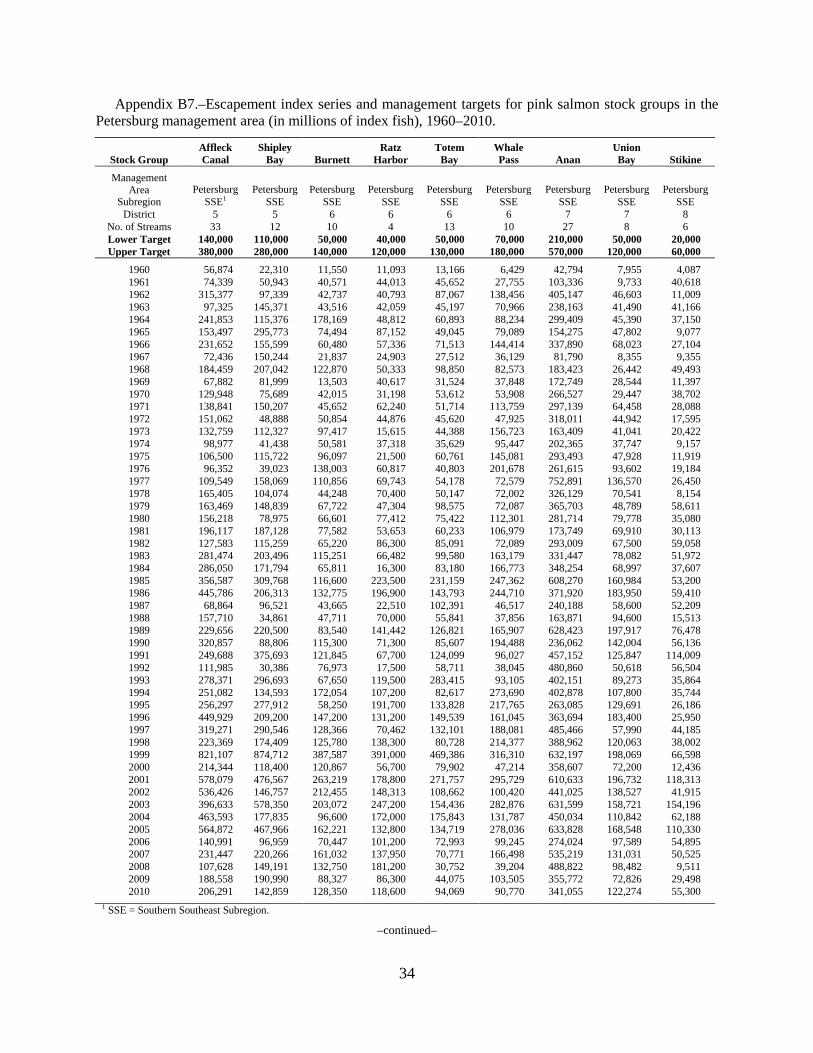
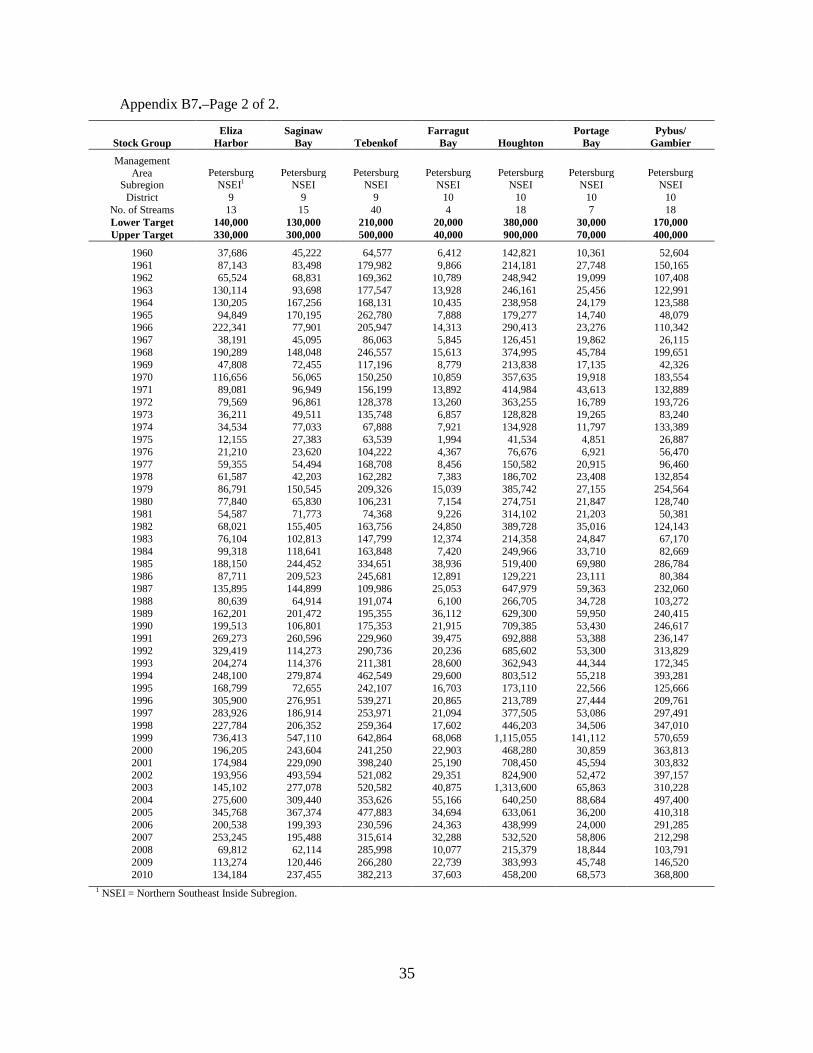
management area (in millions of index fish), 1960–2010. ............................................................................ 33 B7. Escapement index series and management targets for pink salmon stock groups in the Petersburg
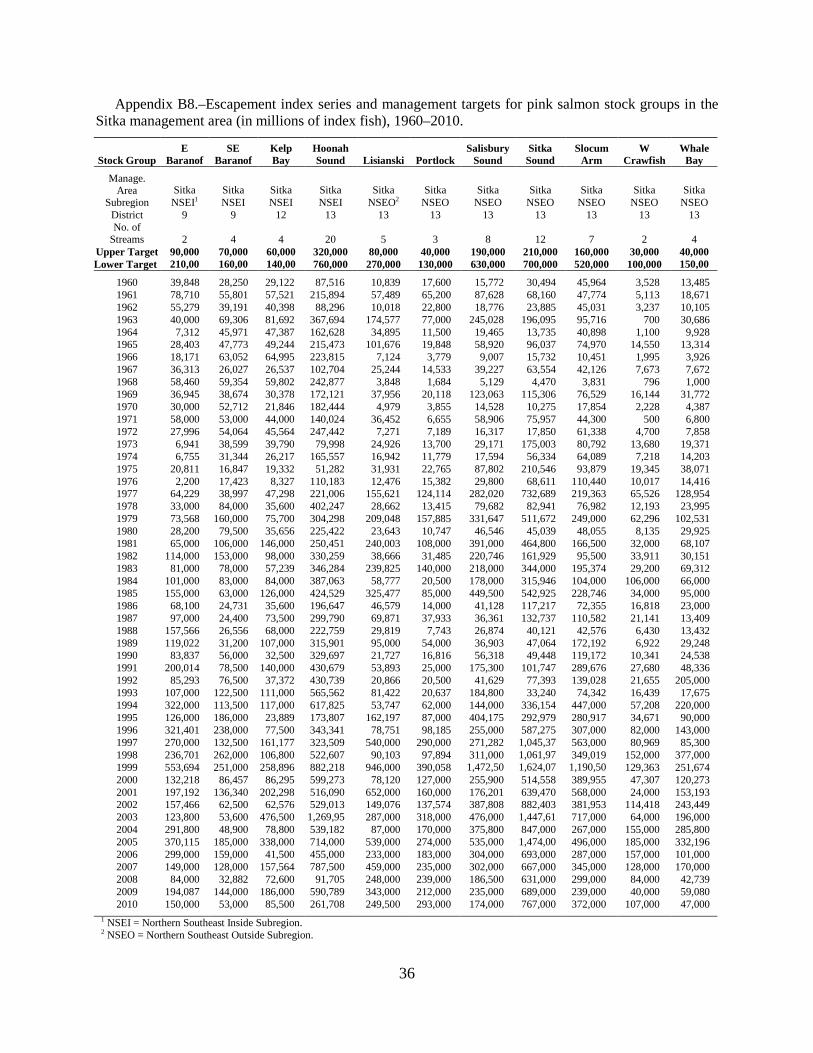
management area (in millions of index fish), 1960–2010. ............................................................................ 34 B8. Escapement index series and management targets for pink salmon stock groups in the Sitka
management area (in millions of index fish), 1960–2010. ............................................................................ 36 B9. Escapement index series and management targets for pink salmon stock groups in the Ketchikan
management area (in millions of index fish), 1960–2010. ............................................................................ 37
1
ABSTRACT Since the 1990s, pink salmon have been harvested in Southeast Alaska at the highest levels since record keeping began in the 20th century, though the annual average harvest over the past 10 years has dropped slightly, largely due to poor even-year runs since 2006. With the exception of 2008, pink salmon escapement indices have been within or above escapement goals in Southeast Alaska, and escapements appear to have been well-distributed throughout the region. For the Situk River, in the Yakutat area, we recommend a new lower bound sustainable escapement goal of 33,000 pink salmon counted through the weir by 5 August. Escapements have been above this recommended goal annually since 1999. We also recommend that standardized peak surveys be conducted annually at the Situk River to provide an index of total escapement that would better track overall trends in abundance and provide the basis of updated escapement goals. At this time, no stocks of pink salmon in Southeast Alaska meet the criteria for stocks of concern as defined by the State of Alaska’s Policy for Management of Sustainable Salmon Fisheries (5 AAC 39.222).
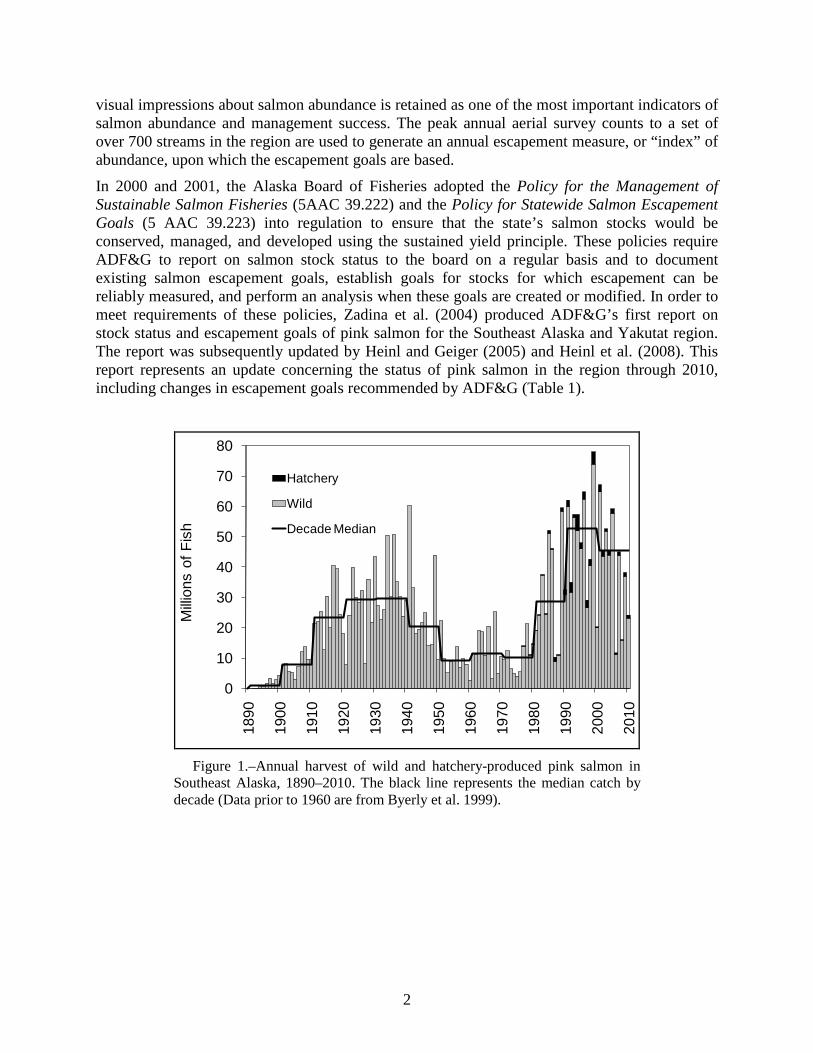
INTRODUCTION Wild pink salmon (Oncorhynchus gorbuscha) spawn in approximately 2,500 short, coastal streams in the Southeast Alaska (Zadina et al. 2004), and support a large and valuable commercial fishing industry (Clark et al. 2006). Pink salmon accounted for an average 72% of all the salmon harvested, by numbers of fish, in Southeast Alaska over the most recent 10-year period, 2001–2010. An average of 40 million fish per year were harvested in the commercial fishery in Southeast Alaska over this same period, with a range of 12 million (2006) to 67 million (2001) fish (Figure 1). The exvessel value of the commercial pink salmon harvest averaged $23 million a year, and ranged between $8 and $35 million, making pink salmon the most valuable species after chum salmon (O. keta) in Southeast Alaska fisheries. The majority of pink salmon harvested in Southeast Alaska commercial fisheries have been taken by purse seine gear (96%), while smaller portions were harvested in drift gillnet (3%), troll, and set gillnet (Yakutat area only) fisheries. Small numbers of pink salmon have been harvested in sport, personal use, and subsistence fisheries. Nearly all of the pink salmon harvested in Southeast Alaska are of wild origin: hatchery-produced pink salmon have contributed an average of only 3% of the total annual harvest since the late 1970s (Figure 1). Escapement goals based on weir counts have been established for the Situk River, one of the larger producers of pink salmon in the Yakutat area1 (Clark 1995; Heinl and Geiger 2005). For the rest of Southeast Alaska, escapement goals have been established for aggregates of pink salmon runs in three broad subregions: the Southern Southeast Subregion, Northern Southeast Inside Subregion, and Northern Southeast Outside Subregion (Zadina et al. 2004; Heinl and Piston 2009).
Pink salmon stocks in Southeast Alaska are managed through extensive inseason monitoring of harvests, fishing effort, and developing escapements (Van Alen 2000; Zadina et al. 2004). Because pink salmon production is broadly dispersed in Southeast Alaska, inseason assessment of escapements has been based on aerial observation. Prior to making decisions about fishing effort, experienced fishery managers fly over many miles of pink salmon spawning habitat and assess whether adequate numbers of salmon are present, and whether the timing of the escapement is consistent with previous patterns. Although the managers fly these surveys to assess inseason abundance and make management decisions, a numerical summary of their 1 The Southeast Alaska area extends from Dixon Entrance to Cape Fairweather; the Yakutat area extends from Cape Fairweather to Cape
Suckling.
2
visual impressions about salmon abundance is retained as one of the most important indicators of salmon abundance and management success. The peak annual aerial survey counts to a set of over 700 streams in the region are used to generate an annual escapement measure, or “index” of abundance, upon which the escapement goals are based.
In 2000 and 2001, the Alaska Board of Fisheries adopted the Policy for the Management of Sustainable Salmon Fisheries (5AAC 39.222) and the Policy for Statewide Salmon Escapement Goals (5 AAC 39.223) into regulation to ensure that the state’s salmon stocks would be conserved, managed, and developed using the sustained yield principle. These policies require ADF&G to report on salmon stock status to the board on a regular basis and to document existing salmon escapement goals, establish goals for stocks for which escapement can be reliably measured, and perform an analysis when these goals are created or modified. In order to meet requirements of these policies, Zadina et al. (2004) produced ADF&G’s first report on stock status and escapement goals of pink salmon for the Southeast Alaska and Yakutat region. The report was subsequently updated by Heinl and Geiger (2005) and Heinl et al. (2008). This report represents an update concerning the status of pink salmon in the region through 2010, including changes in escapement goals recommended by ADF&G (Table 1).
0
10
20
30
40
50
60
70
80
1890
1900
1910
1920
1930
1940
1950
1960
1970
1980
1990
2000
2010
Milli
ons
of F
ish
Hatchery
Wild
Decade Median
Figure 1.–Annual harvest of wild and hatchery-produced pink salmon in
Southeast Alaska, 1890–2010. The black line represents the median catch by decade (Data prior to 1960 are from Byerly et al. 1999).
3
Table 1.–Summary of escapement goals for Yakutat (Situk River) and Southeast Alaska pink salmon stocks and recommended escapement goals.
Enumeration Current Escapement Goal Recommended Escapement Goal
Stock Unit Method Goal Type Year Action Goal Type Southern Southeast Peak Aerial Surveys 3.0–8.0 million BEG 2008 Continue – – Northern Southeast Inside Peak Aerial Surveys 2.5–6.0 million BEG 2008 Continue – – Northern Southeast Outside Peak Aerial Surveys 0.75–2.5 million BEG 2008 Continue – – Situk River (even years) Weir 42,000–105,000 BEG 1995 Revise 33,000 through 5 August SEG Situk River (odd years) Weir 54,000–200,000 BEG 1995 Revise 33,000 through 5 August SEG Situk River (even years) Peak Aerial or Boat Survey 14,000–35,000 BEG 1995 Remove – – Situk River (odd years) Peak Aerial or Boat Survey 18,000–67,000 BEG 1995 Remove – –
DEFINITION OF PINK SALMON STOCKS
The vast majority of the pink salmon harvest in the region takes place in mixed stock fisheries in the waters surrounding the Alexander Archipelago, from Dixon Entrance, north to Cross Sound, Icy Strait and Lynn Canal—what we refer to throughout the rest of this report as “Southeast Alaska,” as distinct from the Yakutat area. Yakutat area pink salmon stocks are spatially segregated from the rest of Southeast Alaska and are harvested primarily in terminal, inriver set gillnet fisheries (Clark 1995). Management and assessment of Yakutat area pink salmon stocks has occurred consistently only for the Situk River, one of the larger pink salmon producers in the area (Clark 1995; Heinl and Geiger 2005).
Southeast Alaska pink salmon harvest statistics and escapement indices have commonly been divided into areas that reflect fisheries management divisions (management areas, districts, and stock groups), as well as biological divisions (subregions). Because Southeast Alaska pink salmon are largely harvested in mixed stock fisheries, often some distance from spawning areas, it is not possible to allocate harvests of pink salmon to stock group of origin at any finer scale than subregion. Therefore, escapement goals for Southeast Alaska pink salmon have been established at the subregion level (Zadina et al. 2004). These subregional goals were further divided into “management targets” for the 15 management districts and 46 stock groups where pink salmon are monitored, as an aid to assessing the spatial distribution of the pink salmon escapement across Southeast Alaska (Zadina et al. 2004). These management targets are not considered to be escapement goals under the definition of the Statewide Salmon Escapement Goal Policy (5 AAC 39.223).
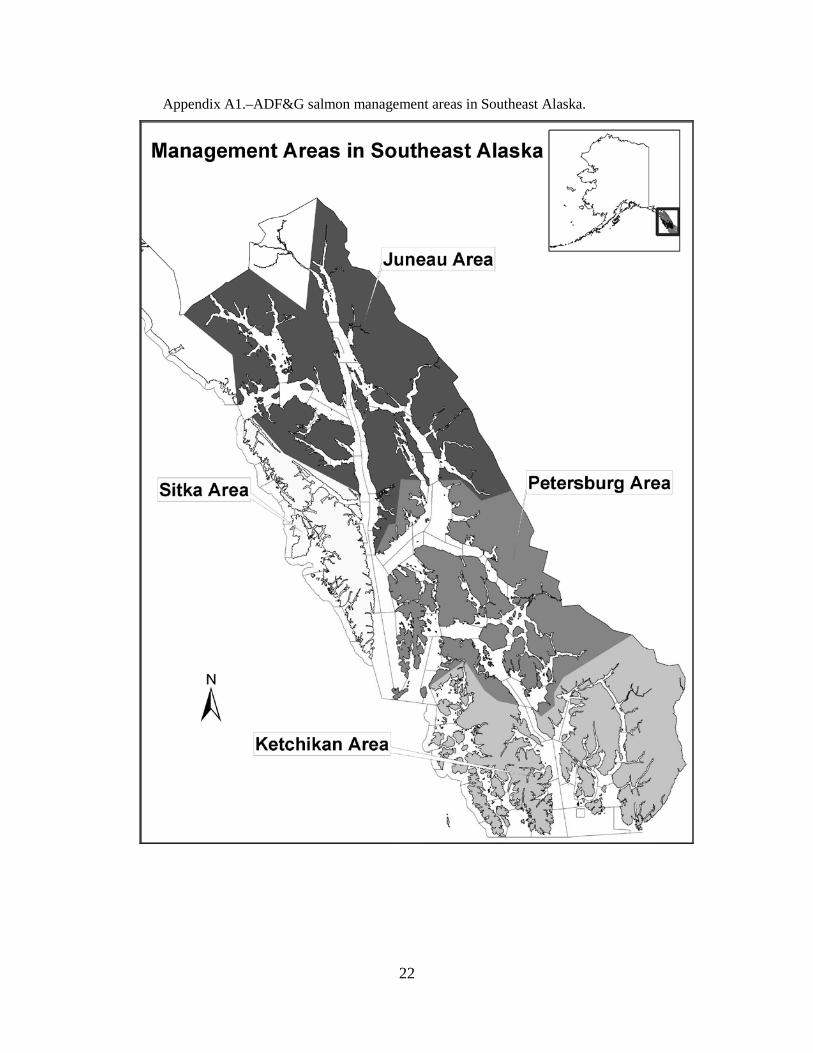
MANAGEMENT AREAS There are four management areas in Southeast Alaska (Juneau, Ketchikan, Petersburg, and Sitka; see Appendix A1), which are further divided into 15 management districts (districts 1–15). ADF&G fisheries managers are responsible for managing the fisheries and monitoring escapements of pink salmon in each of their respective management areas, and the districts or portions of the districts within their areas.
4
SUBREGIONS Marine tagging studies have repeatedly demonstrated that Southeast Alaska pink salmon stocks are strongly segregated into southern and northern areas or subregions (e.g., Rich 1927; Rich and Suomela 1929; Rich and Morton 1930; Nakatani et al. 1975; Hoffman 1983), and the commercial fisheries in each subregion generally target pink salmon stocks that ultimately spawn in that subregion. The Southern Southeast Subregion comprises pink salmon stocks from Sumner Strait and south (districts 1–8), while the Northern Southeast Subregion comprises pink salmon stocks north of Sumner Strait (districts 9–15). In 1998, the northern area was further divided into Northern Southeast Inside and Northern Southeast Outside subregions, as marine tagging studies also showed that pink salmon spawning on the outer coast of Chichagof and Baranof islands generally do not enter inside waters (Nakatani et al. 1975; Alexandersdottir 1987). The Northern Southeast Outside Subregion includes all waters of District 13 (excluding Peril Straits and Hoonah Sound subdistricts 113-51 through 59, which are considered part of the Northern Southeast Inside Subregion).
STOCK GROUPS Southeast Alaska has also been divided into 53 smaller “stock groups” contained within the district boundaries (Zadina et al. 2004). Each stock group represents a collection of streams that support pink salmon runs with similar migration routes and run timing, are managed as a unit, and are assumed to share similar productivity and exploitation rates (Van Alen 2000). Seven of the pink salmon stock groups have not been consistently monitored for spawning escapements: the Annette Island stock group is managed exclusively by the Metlakatla Indian Community (where the state has no jurisdiction), while six other stock groups are located in areas that do not have directed fisheries or are in remote areas where it would be cost-prohibitive to conduct surveys on a regular basis: Suemez-Dall (Ketchikan area; Appendix A5), SW Baranof, W Kruzof, and W Yakobi (Sitka area; Appendix A4), and Dundas Bay and Glacier Bay (Juneau area; Appendix A2). The remaining 46 stock groups, representing 12 fishing districts, are actively managed and monitored for escapements.
STOCK ASSESSMENT ESCAPEMENT MONITORING Yakutat Area Clark (1995) reviewed available escapement data for Yakutat area streams, 1960–1994. Although spawning escapements had been surveyed for 20 streams, consistent survey data were limited to two of the more substantial producers in the area: the Situk River (ADF&G Stream Number 182-70-010) and Humpy Creek (ADF&G Stream Number 183-40-010). The Situk River supports a fishery that primarily targets Chinook (O. tshawytscha), sockeye (O. nerka), and coho (O. kisutch) salmon (Clark 1995). In recent years, there has been little economic incentive to harvest pink salmon and they have been harvested incidentally to sockeye and coho salmon (Woods 2007). Escapements in the Situk River have been assessed through aerial and boat surveys, and with a weir. Weir counts were available for the Situk River for 14 years between 1971 and 1990, and annually since 1991. Since 1991, however, the weir has been removed in early August (well before the peak of the pink salmon run), and peak annual survey counts have only been conducted in nine years (Appendix B1). Systematic surveys to estimate spawning
5
escapement into Humpy Creek have not been conducted since the mid-1990s, because there was very little fishing effort at Humpy Creek in the early 1990s (despite fisheries openings) and no directed fishery since 1996 (Woods 2003). In 2005, the escapement goal for Humpy Creek was eliminated due to lack of fishing effort on the stock (Heinl and Geiger 2005).
Southeast Alaska The department has maintained an annual index of the pink salmon escapement in Southeast Alaska, generated from aerial survey observations, conducted at intervals during most of the migration period. Most pink salmon stocks in Southeast Alaska do not show persistent trends of odd- or even-year dominance, and for simplicity, escapement indices of both brood lines are combined (Van Alen 2000; Zadina et al. 2004). The methods used to calculate the index have changed at different times, as knowledge of the region’s pink salmon grew out of research programs designed to improve pink salmon management (e.g., Durley and Seibel 1972; Jones and Dangel 1983; Hofmeister et al. 1993; Hofmeister 1998; Zadina et al. 2004; and Heinl and Geiger 2005). In instances when major changes were implemented, the index was recalculated for all years to ensure the index was consistent over the entire series.
The current method of generating an annual pink salmon escapement index, and major changes to the index, were described in detail by Heinl and Piston (2009). The principal change was the complete removal of “bias adjustments” that were previously made in an attempt to adjust for differences in observer counting rates (Hofmeister 1998; Van Alen 2000). Although the method used seemed like a practical way to address the well-known problem of observer counting bias (Dangel and Jones 1988; Jones et al. 1998), a close examination indicated that the calibrations often induced significant error. The current pink salmon escapement index was modified to use only raw survey data. In addition, annual calculation of the escapement index is now automated through the Southeast Alaska Integrated Fisheries Database.
The pink salmon escapement index consists of the sum of the peak annual aerial survey observations for 714 index streams across the region. Although the index comprises pink salmon runs of varying magnitudes (Table 2), the set of index streams does not necessarily match the distribution of streams (by run size) across the entire region, as the majority of the 2,500 pink salmon spawning streams are likely very small producers. Only stream surveys conducted by key personnel, termed “index observers”, were used in the pink salmon escapement index. Index observers were typically management biologists or assistants, most of whom conducted more than 100 stream surveys per year for more than four years. Survey data were qualified (based on visibility, timing, and area surveyed) by the management biologists that conducted the surveys using the following codes: code 01, an incomplete survey—not useful for indexing abundance; code 02, a complete survey—potentially useful for indexing abundance; and code 03, the peak survey—useful for indexing abundance. Code 03 surveys identified the one and only peak survey for a stream each year. These codes were entered into the regional database to facilitate identification of the peak survey observations for each index stream. Finally, an iterative expectation-maximization algorithm (McLachlan and Krishnan 1997) was used to impute missing values (e.g., lack of a peak survey for a given stream due to weather) from the static table of historic data.
6
Table 2.–Distribution of pink salmon escapement index streams based on the 1960–2010 median escapement peak survey value by stream.
Median Peak Survey Range Number of Streams ≤500 19
501–2,500 207 2,501–5,000 171
5,001–10,000 156 10,001–25,000 102
25,001–100,000 56 >100,000 3
Total Number of Streams 714
It is important to note that the Southeast Alaska pink salmon index does not provide an estimate of the total escapement, and its relationship with the total pink salmon escapement in Southeast Alaska is far from certain. An escapement estimate is a statistically reliable measure of escapement magnitude; i.e., the total number of fish in the escapement. An escapement estimate is approximately in the same units as the estimates of harvest, and harvest estimates and escapement estimates can logically be added together to produce an estimate of total run size. Alternatively, an escapement index is a relative measure of escapement, useful for year-to-year comparisons. In the past, ADF&G biologists commonly multiplied the escapement indices by a factor of 2.5 to convert the index to an estimate of total escapement (e.g., Hofmeister and Blick 1991). The 2.5 multiplier was originally intended to convert peak escapement counts to an estimate of what was actually present at the time of the survey (Dangel and Jones 1988; Hofmeister 1990; Jones et al. 1998). Thus, multiplying the index by 2.5 does not account for fish that were not present at the time of the surveys and does not account for the more than 1,800 streams that were not surveyed (Heinl and Geiger 2005). There is no simple way to convert the current index series to an estimate of total escapement in Southeast Alaska. Moreover, escapement indices are clearly much less than total escapements (Hofmeister 1990; Van Alen 2000; Zadina et al. 2004).
HARVEST Salmon landings from individual commercial fishermen are recorded on fish tickets. Information recorded on the tickets includes the vessel name, Commercial Fisheries Entry Commission permit number, total weight of the harvest by species, and date and area of harvest. Catch in units of total weight are converted into units of fish numbers by the processors, based on their individual methods of determining the average weight of fish. Fish tickets are legal documents and serve as the basis of payment on the part of the processors to fishermen. State regulations require fish tickets to be delivered to ADF&G within seven days of a landing. Information from these tickets is entered into the ADF&G Fish Ticket Database System, and the total weight and the estimated total number of commercially harvested salmon is available in electronic format to biologists in various time and spatial summaries for all years since 1960 (Appendix B3). Estimates of the annual harvest of pink salmon prior to statehood were taken from Byerly et al. (1999).
7
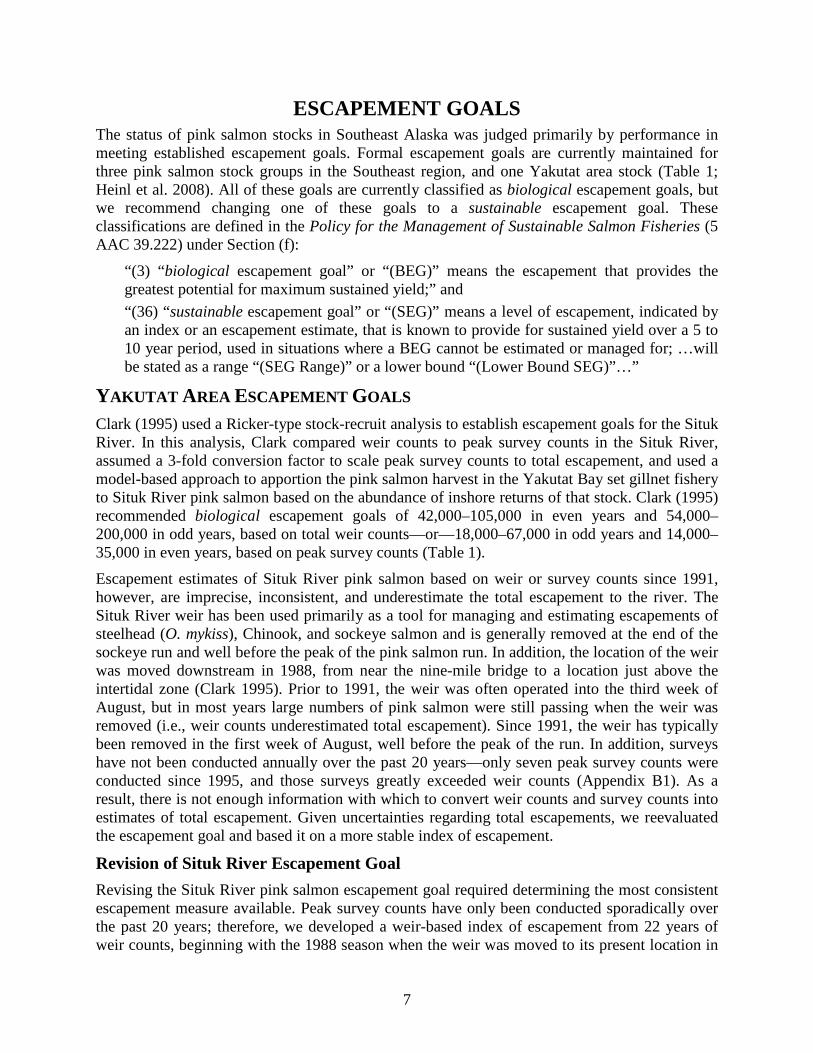
ESCAPEMENT GOALS The status of pink salmon stocks in Southeast Alaska was judged primarily by performance in meeting established escapement goals. Formal escapement goals are currently maintained for three pink salmon stock groups in the Southeast region, and one Yakutat area stock (Table 1; Heinl et al. 2008). All of these goals are currently classified as biological escapement goals, but we recommend changing one of these goals to a sustainable escapement goal. These classifications are defined in the Policy for the Management of Sustainable Salmon Fisheries (5 AAC 39.222) under Section (f):
“(3) “biological escapement goal” or “(BEG)” means the escapement that provides the greatest potential for maximum sustained yield;” and “(36) “sustainable escapement goal” or “(SEG)” means a level of escapement, indicated by an index or an escapement estimate, that is known to provide for sustained yield over a 5 to 10 year period, used in situations where a BEG cannot be estimated or managed for; …will be stated as a range “(SEG Range)” or a lower bound “(Lower Bound SEG)”…”
YAKUTAT AREA ESCAPEMENT GOALS Clark (1995) used a Ricker-type stock-recruit analysis to establish escapement goals for the Situk River. In this analysis, Clark compared weir counts to peak survey counts in the Situk River, assumed a 3-fold conversion factor to scale peak survey counts to total escapement, and used a model-based approach to apportion the pink salmon harvest in the Yakutat Bay set gillnet fishery to Situk River pink salmon based on the abundance of inshore returns of that stock. Clark (1995) recommended biological escapement goals of 42,000–105,000 in even years and 54,000–200,000 in odd years, based on total weir counts—or—18,000–67,000 in odd years and 14,000–35,000 in even years, based on peak survey counts (Table 1).
Escapement estimates of Situk River pink salmon based on weir or survey counts since 1991, however, are imprecise, inconsistent, and underestimate the total escapement to the river. The Situk River weir has been used primarily as a tool for managing and estimating escapements of steelhead (O. mykiss), Chinook, and sockeye salmon and is generally removed at the end of the sockeye run and well before the peak of the pink salmon run. In addition, the location of the weir was moved downstream in 1988, from near the nine-mile bridge to a location just above the intertidal zone (Clark 1995). Prior to 1991, the weir was often operated into the third week of August, but in most years large numbers of pink salmon were still passing when the weir was removed (i.e., weir counts underestimated total escapement). Since 1991, the weir has typically been removed in the first week of August, well before the peak of the run. In addition, surveys have not been conducted annually over the past 20 years—only seven peak survey counts were conducted since 1995, and those surveys greatly exceeded weir counts (Appendix B1). As a result, there is not enough information with which to convert weir counts and survey counts into estimates of total escapement. Given uncertainties regarding total escapements, we reevaluated the escapement goal and based it on a more stable index of escapement.
Revision of Situk River Escapement Goal Revising the Situk River pink salmon escapement goal required determining the most consistent escapement measure available. Peak survey counts have only been conducted sporadically over the past 20 years; therefore, we developed a weir-based index of escapement from 22 years of weir counts, beginning with the 1988 season when the weir was moved to its present location in
8
the lower river. Since the weir has consistently been operated through the first week of August, we used cumulative escapement through 5 August as an index of abundance. The weir was operated through 5 August in 16 of 22 years since 1988. For the six years in which the weir was removed earlier, we estimated the cumulative escapement through 5 August using simple linear regression (Appendix B2).
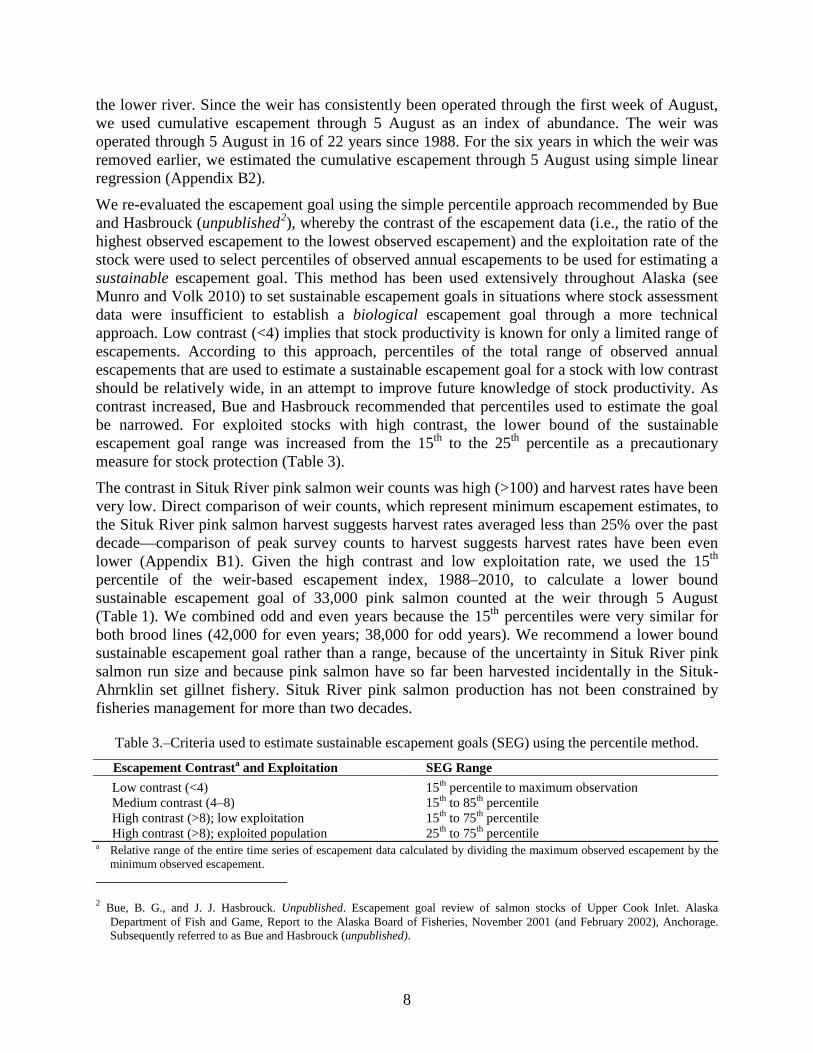
We re-evaluated the escapement goal using the simple percentile approach recommended by Bue and Hasbrouck (unpublished2), whereby the contrast of the escapement data (i.e., the ratio of the highest observed escapement to the lowest observed escapement) and the exploitation rate of the stock were used to select percentiles of observed annual escapements to be used for estimating a sustainable escapement goal. This method has been used extensively throughout Alaska (see Munro and Volk 2010) to set sustainable escapement goals in situations where stock assessment data were insufficient to establish a biological escapement goal through a more technical approach. Low contrast (<4) implies that stock productivity is known for only a limited range of escapements. According to this approach, percentiles of the total range of observed annual escapements that are used to estimate a sustainable escapement goal for a stock with low contrast should be relatively wide, in an attempt to improve future knowledge of stock productivity. As contrast increased, Bue and Hasbrouck recommended that percentiles used to estimate the goal be narrowed. For exploited stocks with high contrast, the lower bound of the sustainable escapement goal range was increased from the 15th to the 25th percentile as a precautionary measure for stock protection (Table 3).
The contrast in Situk River pink salmon weir counts was high (>100) and harvest rates have been very low. Direct comparison of weir counts, which represent minimum escapement estimates, to the Situk River pink salmon harvest suggests harvest rates averaged less than 25% over the past decade—comparison of peak survey counts to harvest suggests harvest rates have been even lower (Appendix B1). Given the high contrast and low exploitation rate, we used the 15th percentile of the weir-based escapement index, 1988–2010, to calculate a lower bound sustainable escapement goal of 33,000 pink salmon counted at the weir through 5 August (Table 1). We combined odd and even years because the 15th percentiles were very similar for both brood lines (42,000 for even years; 38,000 for odd years). We recommend a lower bound sustainable escapement goal rather than a range, because of the uncertainty in Situk River pink salmon run size and because pink salmon have so far been harvested incidentally in the Situk-Ahrnklin set gillnet fishery. Situk River pink salmon production has not been constrained by fisheries management for more than two decades.
Table 3.–Criteria used to estimate sustainable escapement goals (SEG) using the percentile method.
Escapement Contrasta and Exploitation SEG Range Low contrast (<4) 15th percentile to maximum observation
Medium contrast (4–8) 15th to 85th percentile High contrast (>8); low exploitation 15th to 75th percentile High contrast (>8); exploited population 25th to 75th percentile
a Relative range of the entire time series of escapement data calculated by dividing the maximum observed escapement by the minimum observed escapement.
2 Bue, B. G., and J. J. Hasbrouck. Unpublished. Escapement goal review of salmon stocks of Upper Cook Inlet. Alaska
Department of Fish and Game, Report to the Alaska Board of Fisheries, November 2001 (and February 2002), Anchorage. Subsequently referred to as Bue and Hasbrouck (unpublished).
9
SOUTHEAST ALASKA ESCAPEMENT GOALS The first pink salmon escapement goals for Southeast Alaska were set at 5 million for southern Southeast and 3 million for northern Southeast (Valentine et al. 1970). The goals were not the result of a formal statistical analysis; they were instead based on the observation that in southern Southeast, escapement indices of less than 4 million had produced fair to poor returns, escapements in excess of 4 million generally produced good returns, and a southern Southeast escapement index that exceeded 5 million (1966) resulted in the largest return in many years. The pattern of returns in northern Southeast was more variable than in southern Southeast and the index goal was set at 3 million. Escapement goals were adjusted upward in later years based on analyses of the catch and index of escapement (Durley and Seibel 1972; Jones and Hofmeister 1981). From 1991 to 2002, the index goals were set at 4.8 million for northern Southeast, and a range of 6–9 million for southern Southeast (Hofmeister and Blick 1991). Escapement goals were revised again in 2003 (Zadina et al. 2004) and 2009 (Heinl et al. 2008).
Escapement goals have often been developed using Ricker stock-recruit analysis (Hilborn and Walters 1992; Quinn and Deriso 1999). Note, however, that the pink salmon index measures available for Southeast Alaska represent an unknown fraction of the total escapement (a relative measure) rather than an estimate of the total number. Thus, a Ricker analysis is not possible without making some unproven and possibly ill-advised assumptions. Zadina et al. (2004) developed biological escapement goals for Southeast Alaska pink salmon based on the “tabular approach” described by Hilborn and Walters (1992); a yield analysis that is useful for setting escapement goals when the form of the stock recruit relationship is not known. Heinl et al. (2008) updated the goals in 2009 using the same yield analysis. The current biological escapement goals for pink salmon in Southeast Alaska are 3.0 to 8.0 million index spawners in the Southern Southeast Subregion, 2.5 to 6.0 million index spawners in the Northern Southeast Inside Subregion, and 0.75 to 2.5 million index spawners in the Northern Southeast Outside Subregion (Table 1).
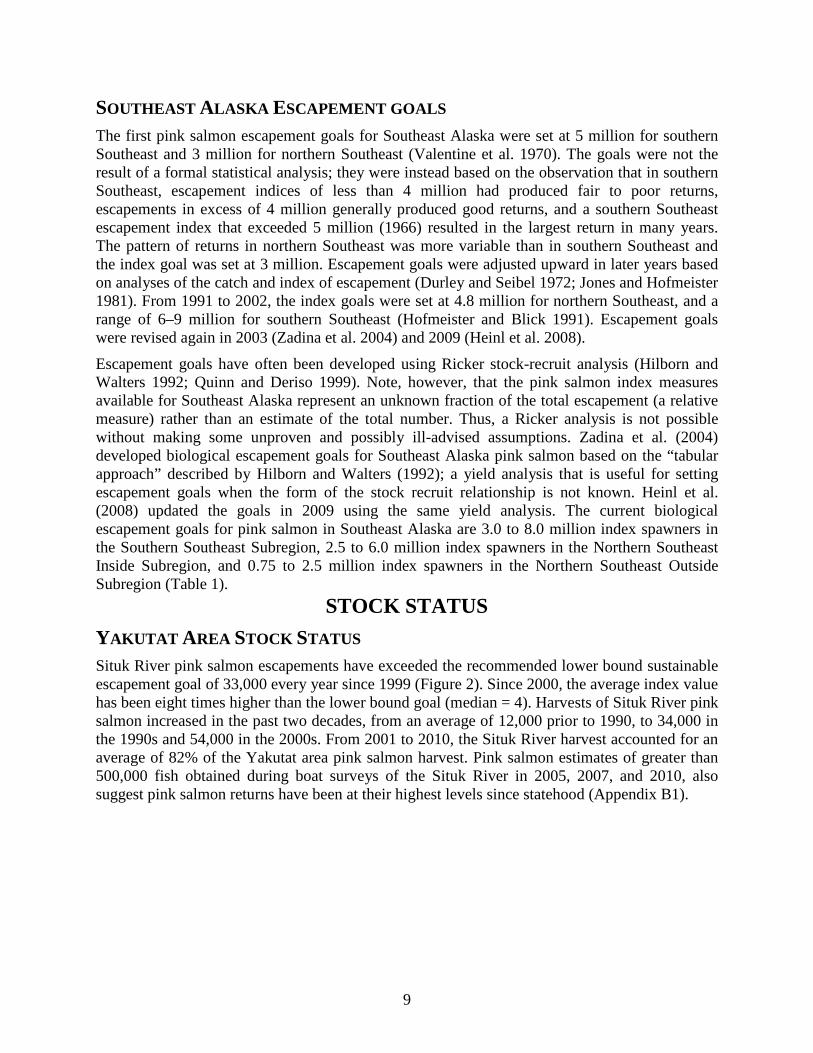
STOCK STATUS YAKUTAT AREA STOCK STATUS Situk River pink salmon escapements have exceeded the recommended lower bound sustainable escapement goal of 33,000 every year since 1999 (Figure 2). Since 2000, the average index value has been eight times higher than the lower bound goal (median = 4). Harvests of Situk River pink salmon increased in the past two decades, from an average of 12,000 prior to 1990, to 34,000 in the 1990s and 54,000 in the 2000s. From 2001 to 2010, the Situk River harvest accounted for an average of 82% of the Yakutat area pink salmon harvest. Pink salmon estimates of greater than 500,000 fish obtained during boat surveys of the Situk River in 2005, 2007, and 2010, also suggest pink salmon returns have been at their highest levels since statehood (Appendix B1).
10
0
50
100
150
200
250
300
350
400
450
1988
1991
1994
1997
2000
2003
2006
2009 Th
ousa
nds
of F
ish
Situk River HarvestWeir-based Escapement Index
Figure 2.–Annual Situk River pink salmon harvest since 1960, and weir-based escapement index for
the Situk River, 1988–2010. The horizontal black line shows the recommended lower bound sustainable escapement goal of 33,000 pink salmon counted through the weir by 5 August.
SOUTHEAST ALASKA STOCK STATUS The annual harvest of pink salmon in Southeast Alaska has declined slightly over the most recent 10 years (Figure 1), from 49 million per year in the 1990s, to an average of 40 million fish per year since 2001 (Appendix B3). This decline in overall harvest is due primarily to poor even-year pink salmon runs in 2006 and 2008, and a below average harvest in 2010. Pink salmon escapement goals were met in all three subregions of Southeast Alaska over the past 10 years, with the exception of the Northern Southeast Inside Subregion in 2008.
Southern Southeast Subregion The harvest of pink salmon in the Southern Southeast Subregion averaged 24 million fish per year over the past 10 years (2001–2010; Figure 3), which was down from an average harvest of 31 million in the 1990s. The biological escapement goal of 3.0 to 8.0 million index spawners was met annually since 1974 in the Southern Southeast Subregion. In addition, the upper range of the goal (8.0 million index spawners) was exceeded in six of the past 10 years (2001–2010; Figure 3). Pink salmon escapements appear to have been well-distributed over the Southern Southeast Subregion as well. With only two exceptions, management targets for districts in the Southern Southeast Subregion (districts 1–8) have been met or exceeded over the past decade (Table 4). With the exception of 2006 and 2008, management targets for all 18 pink salmon stock groups in the Southern Southeast Subregion have also generally been met or exceeded over the past decade (Table 5). Pink salmon escapement indices for five of the 18 pink salmon stock groups were below the management target ranges in 2008, but targets were met for all stock groups in the following even-year return in 2010.
11
0
10
20
30
40
50
60
1960
1965
1970
1975
1980
1985
1990
1995
2000
2005
2010
Milli
ons
of F
ish
Pink Salmon Harvest -Southern Southeast Subregion
0
2
4
6
8
10
12
14
1960
1965
1970
1975
1980
1985
1990
1995
2000
2005
2010
Milli
ons
of In
dex
Fish
Pink Salmon Escapement Index -Southern Southeast Subregion
Figure 3.–Annual pink salmon harvest and escapement index for the Southern Southeast Subregion,
1960–2010. The shaded area shows the escapement goal range of 3.0 million to 8.0 million index spawners.
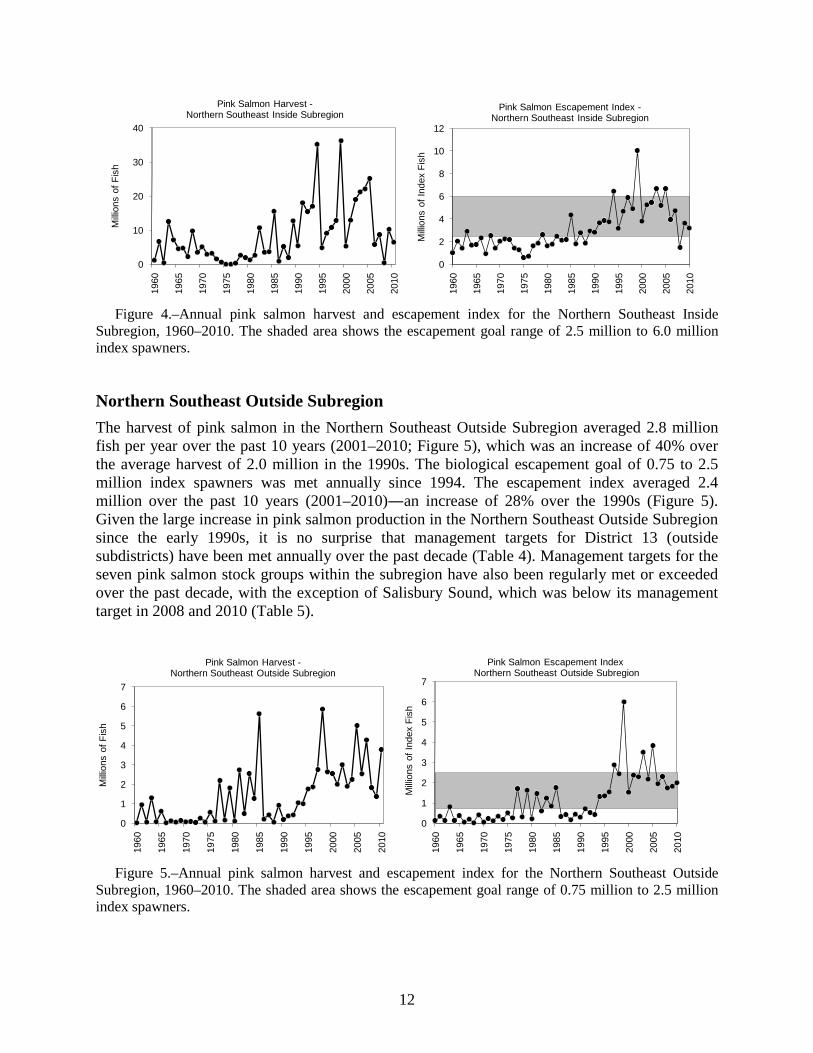
Northern Southeast Inside Subregion The harvest of pink salmon in the Northern Southeast Inside Subregion averaged 13 million fish per year over the past 10 years (2001–2010; Figure 4), which was approximately 75% of the average harvest of 17 million in the 1990s. The biological escapement goal of 2.5 to 6.0 million index spawners was met annually since 1988, with the notable exception of 2008 (Figure 4). Prior to 2008, pink salmon escapements were well-distributed over the Northern Southeast Subregion. Management targets for districts in the Northern Southeast Inside Subregion (districts 9–12, 13 inside, and 14–15) were met or exceeded over the years 1999–2007, with only one exception (Table 4). With the exception of 2008, management targets were generally met or exceeded for the 21 pink salmon stock groups in the Northern Southeast Subregion over the years 1999–2007 (Table 5).
The 2008 run of pink salmon to the Northern Southeast Inside Subregion was the poorest since the mid-1970s: the harvest of 0.4 million was the lowest since 1974 and the escapement index of 1.5 million was the lowest since 1976. Management targets were not met for any of the districts, or 19 of the 21 stock groups in this subregion in 2008. Harvest and escapement improved considerably in the following even-year run, but were still well below recent averages. The 2010 pink salmon harvest of 6.5 million was 50% of the recent 10-year average (Figure 4). The 2010 escapement index value of 3.2 million fell within the escapement goal range of 2.5 to 6.0 million index fish, and escapement indices were slightly below management targets for 4 of the 7 districts and for 7 of 21 pink salmon stock groups within this subregion (Tables 4 and 5).
Pink Salmon Escapement Index -Northern Southeast Inside Subregion
Figure 4.–Annual pink salmon harvest and escapement index for the Northern Southeast Inside
Subregion, 1960–2010. The shaded area shows the escapement goal range of 2.5 million to 6.0 million index spawners.
Northern Southeast Outside Subregion The harvest of pink salmon in the Northern Southeast Outside Subregion averaged 2.8 million fish per year over the past 10 years (2001–2010; Figure 5), which was an increase of 40% over the average harvest of 2.0 million in the 1990s. The biological escapement goal of 0.75 to 2.5 million index spawners was met annually since 1994. The escapement index averaged 2.4 million over the past 10 years (2001–2010)―an increase of 28% over the 1990s (Figure 5). Given the large increase in pink salmon production in the Northern Southeast Outside Subregion since the early 1990s, it is no surprise that management targets for District 13 (outside subdistricts) have been met annually over the past decade (Table 4). Management targets for the seven pink salmon stock groups within the subregion have also been regularly met or exceeded over the past decade, with the exception of Salisbury Sound, which was below its management target in 2008 and 2010 (Table 5).
Pink Salmon Escapement Index Northern Southeast Outside Subregion
Figure 5.–Annual pink salmon harvest and escapement index for the Northern Southeast Outside
Subregion, 1960–2010. The shaded area shows the escapement goal range of 0.75 million to 2.5 million index spawners.
13
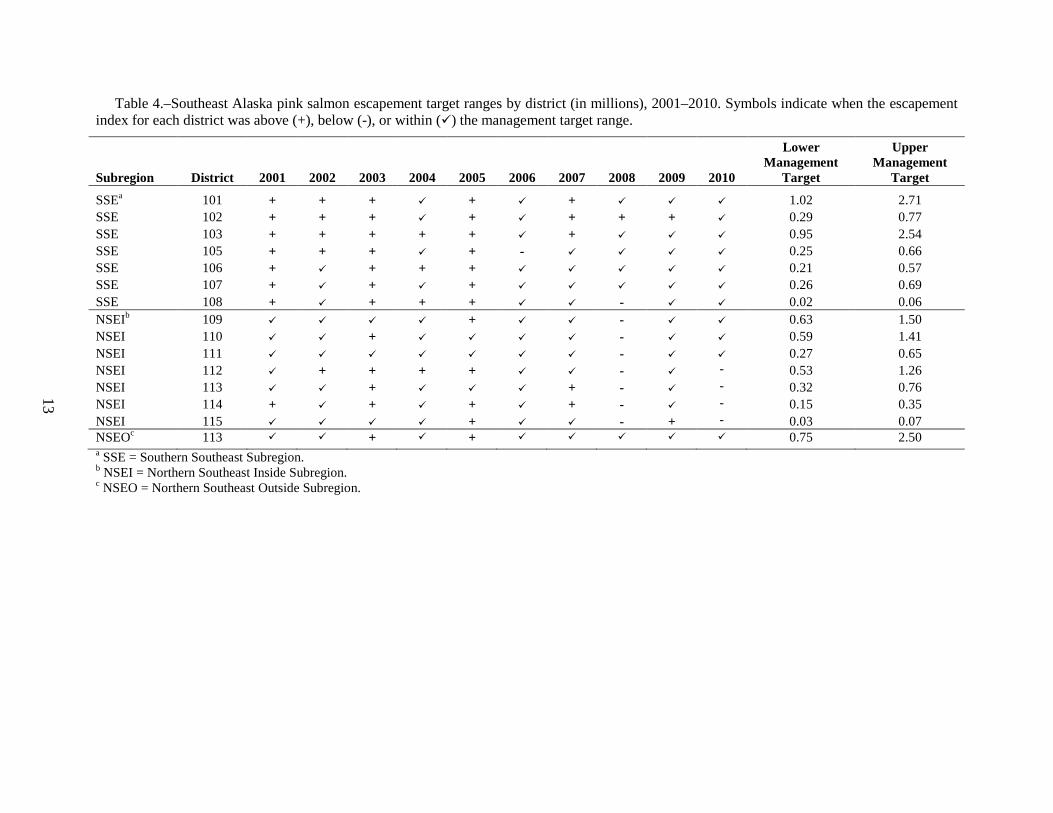
Table 4.–Southeast Alaska pink salmon escapement target ranges by district (in millions), 2001–2010. Symbols indicate when the escapement index for each district was above (+), below (-), or within () the management target range.
a SSE = Southern Southeast Subregion. b NSEI = Northern Southeast Inside Subregion. c NSEO = Northern Southeast Outside Subregion.
14
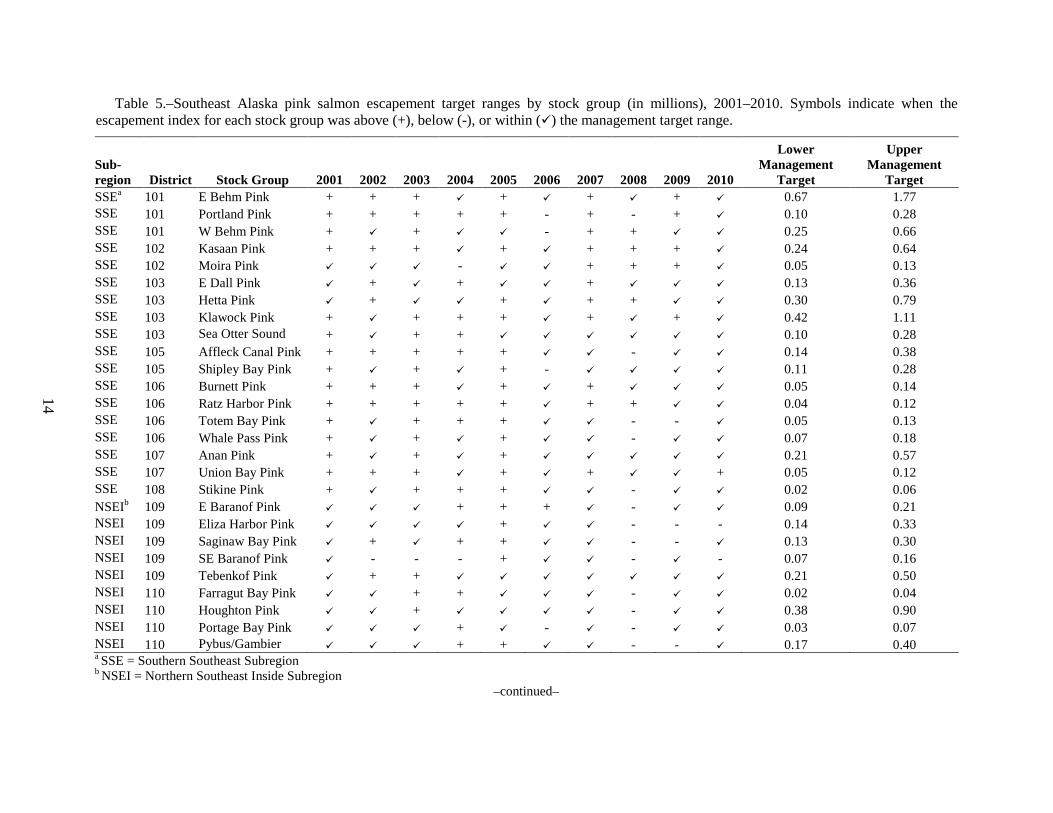
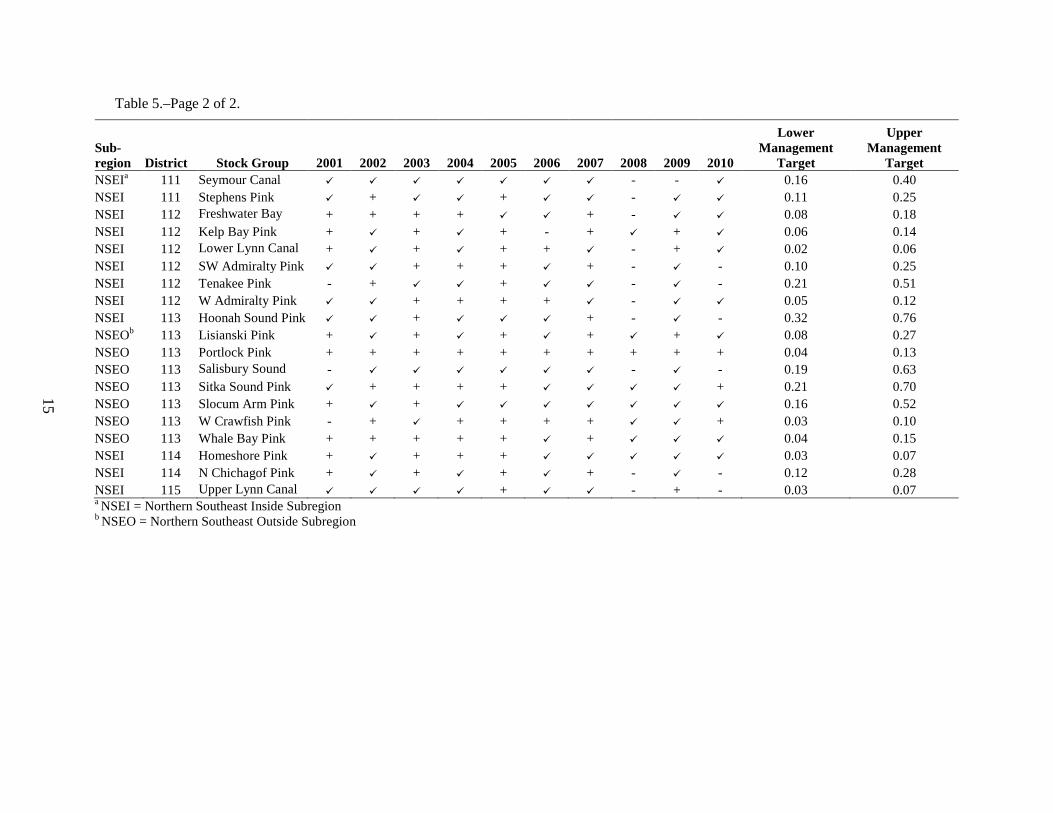
Table 5.–Southeast Alaska pink salmon escapement target ranges by stock group (in millions), 2001–2010. Symbols indicate when the escapement index for each stock group was above (+), below (-), or within () the management target range.
Sub-region District Stock Group 2001 2002 2003 2004 2005 2006 2007 2008 2009 2010
a NSEI = Northern Southeast Inside Subregion b NSEO = Northern Southeast Outside Subregion
16
DISCUSSION Since the 1990s, pink salmon have been harvested in Southeast Alaska at the highest levels since record keeping began in the 20th century, though the annual average harvest over the past 10 years has dropped slightly, largely due to poor even-year runs since 2006. With the exception of 2008, pink salmon escapement indices have been within or above escapement goals and escapements appear to have been well-distributed throughout the region. Pink salmon returns to the Situk River, where the majority of pink salmon harvest in the Yakutat area occurs, appear to be at historically high levels. No stocks of pink salmon currently meet the criteria for stocks of concern as defined by the sustainable salmon fisheries policy.
For Situk River pink salmon, we recommend a new lower bound sustainable escapement goal of 33,000 pink salmon counted at the weir through 5 August. We further recommend that peak surveys be conducted annually on a standardized schedule to provide an index of total escapement that would better track overall trends in abundance and provide the basis for updating the escapement goal in the future. Ideally, the weir would be operated through the end of the pink salmon run, but funding and management priorities, and the logistics of operating the weir into the rainy season, make this impractical. We note that increased effort was directed at Situk River pink salmon in 2010 (Gordon F. Woods, ADF&G Management Biologist, Yakutat, personal communication), which may lead to increased harvest rates on Situk River pink salmon. The commercial pink salmon harvest in the Situk River set gillnet fishery was 143,000 fish in 2010, nearly double the previous maximum catch. An increased focus on harvesting pink salmon will make improved pink salmon stock assessment on the river more of a priority.
Since 1997, fishery biologists at the National Oceanic and Atmospheric Administration’s Alaska Fisheries Science Center have conducted studies through their Southeast Coastal Monitoring Program (SECM) designed to improve understanding of the early marine ecology of juvenile salmon and factors and processes that affect salmon survival in their coastal ocean environment within Southeast Alaska and into the Gulf of Alaska (Orsi et al. 2009). As part of the project, standardized surface trawls have been conducted annually since 1997 at a series of transects in Icy Strait, a northern Southeast Alaska seaward migration corridor. The SECM trawl catches provide an index of juvenile salmon abundance after freshwater and much of the early marine mortality has already occurred. Catches of juvenile pink salmon in these surface trawls have been highly correlated with adult pink salmon returns the following year (Wertheimer et al. 2010). This information has improved the accuracy of ADF&G’s preseason pink salmon harvest forecasts for Southeast Alaska (Piston and Heinl 2011).
The harvest series in Southeast Alaska has exhibited odd-year dominance since 1999, and poor runs of pink salmon in 2006 and 2008 may increase the magnitude of this cycle, although both harvest and escapement improved considerably in 2010. (Note that the harvest series in Southeast Alaska has not always exhibited odd-year dominance; even-year dominance occurred from 1964 to 1973, and from 1994 to 1998; Figure 1.) The direct causes of the poor runs in Southeast Alaska in 2006 and 2008 are not known. Pink salmon runs are notoriously difficult to forecast (Adkison 2002; Haeseker 2005), because survival rates vary tremendously (Pyper et al. 2001; Willette et al. 2001) in response to myriad potential factors in the freshwater, early marine, and offshore environments (see Wickett 1958; Heard 1991; Willette et al. 2001; Moss et al. 2005; and others). Shaul et al. (2005) believed that the recent high levels of coho salmon production in the region reflected influence “primarily by environmental conditions rather than
17
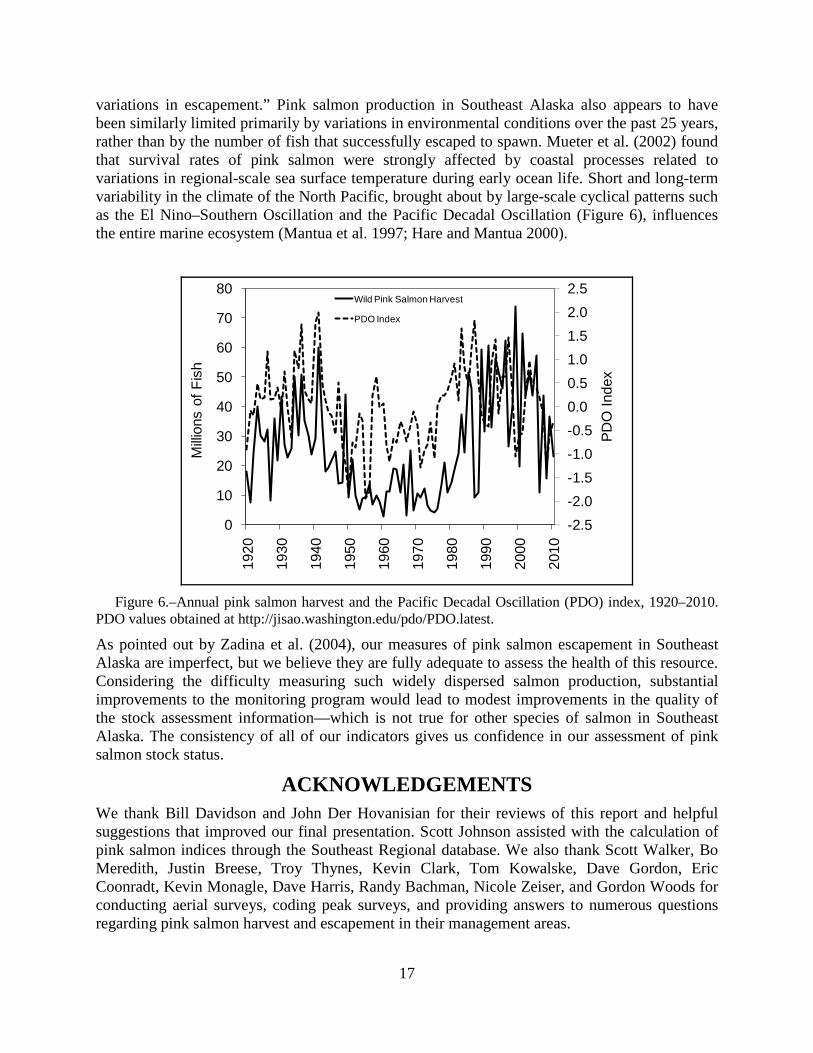
variations in escapement.” Pink salmon production in Southeast Alaska also appears to have been similarly limited primarily by variations in environmental conditions over the past 25 years, rather than by the number of fish that successfully escaped to spawn. Mueter et al. (2002) found that survival rates of pink salmon were strongly affected by coastal processes related to variations in regional-scale sea surface temperature during early ocean life. Short and long-term variability in the climate of the North Pacific, brought about by large-scale cyclical patterns such as the El Nino–Southern Oscillation and the Pacific Decadal Oscillation (Figure 6), influences the entire marine ecosystem (Mantua et al. 1997; Hare and Mantua 2000).
-2.5-2.0-1.5-1.0-0.50.00.51.01.52.02.5
0
10
20
30
40
50
60
70
80
1920
1930
1940
1950
1960
1970
1980
1990
2000
2010
PDO
Inde
x
Milli
ons
of F
ish
Wild Pink Salmon Harvest
PDO Index
Figure 6.–Annual pink salmon harvest and the Pacific Decadal Oscillation (PDO) index, 1920–2010.
PDO values obtained at http://jisao.washington.edu/pdo/PDO.latest.
As pointed out by Zadina et al. (2004), our measures of pink salmon escapement in Southeast Alaska are imperfect, but we believe they are fully adequate to assess the health of this resource. Considering the difficulty measuring such widely dispersed salmon production, substantial improvements to the monitoring program would lead to modest improvements in the quality of the stock assessment information—which is not true for other species of salmon in Southeast Alaska. The consistency of all of our indicators gives us confidence in our assessment of pink salmon stock status.
ACKNOWLEDGEMENTS We thank Bill Davidson and John Der Hovanisian for their reviews of this report and helpful suggestions that improved our final presentation. Scott Johnson assisted with the calculation of pink salmon indices through the Southeast Regional database. We also thank Scott Walker, Bo Meredith, Justin Breese, Troy Thynes, Kevin Clark, Tom Kowalske, Dave Gordon, Eric Coonradt, Kevin Monagle, Dave Harris, Randy Bachman, Nicole Zeiser, and Gordon Woods for conducting aerial surveys, coding peak surveys, and providing answers to numerous questions regarding pink salmon harvest and escapement in their management areas.
REFERENCES CITED Adkison, M. D. 2002. Preseason forecast of pink salmon harvests in Southeast Alaska using Bayesian model
averaging. Alaska Fishery Research Bulletin 9(1):1–8.
Alexandersdottir, M. 1987. Life history of pink salmon (Oncorhynchus gorbuscha) in Southeast Alaska and implications for management. Ph.D. Thesis. University of Washington, Seattle.
Byerly, M., B. Brooks, B. Simonson, H. Savikko, and H. J. Geiger. 1999. Alaska commercial salmon catches, 1878–1999. Alaska Department of Fish and Game, Division of Commercial Fisheries, Regional Information Report 5J99-05, Juneau.
Clark, J. H. 1995. Biological escapement goals for even and odd-year pink salmon returning to the Situk River and to Humpy Creek near Yakutat, Alaska. Alaska Department of Fish and Game, Division of Commercial Fisheries, Regional Information Report 1J95-08, Juneau.
Clark, J. H., A. McGregor, R. D. Mecum, P. Krasnowski, and A. M. Carroll. 2006. The commercial salmon fishery in Alaska. Alaska Fishery Research Bulletin 12(1):1–146.
Dangel, J. R., and J. D. Jones. 1988. Southeast Alaska pink salmon total escapement and stream life studies. Alaska Department of Fish and Game, Division of Commercial Fisheries, Regional Information Report 1J88-24, Juneau.
Durley, K. E., and M. C. Seibel. 1972. Forecast of the 1972 pink salmon runs, Southeastern Alaska. Alaska Department of Fish and Game, Division of Commercial Fisheries, Informational Leaflet No. 158, Juneau.
Haeseker, S. L., R. M. Peterman, and Z. Su. 2005. Retrospective evaluation of preseason forecasting models for pink salmon. North American Journal of Fisheries Management 25:897–918.
Hare, S. R., and N. J. Mantua. 2000. Empirical evidence for North Pacific regime shifts in 1977 and 1989. Progress in Oceanography 47:103–145.
Heard, W.R. 1991. Life history of pink salmon (Oncorhynchus gorbuscha). Pages 119–230 [In] C. Groot and L. Margolis, editors. Pacific Salmon Life Histories. UBC Press, Vancouver, B.C.
Heinl, S. C., and H. J. Geiger. 2005. Pink salmon stock status and escapement goals in Southeast Alaska and Yakutat [In] Stock status and escapement goals for salmon stocks in Southeast Alaska 2005. Der Hovanisian, J. A., and H. J. Geiger,editors. Alaska Department of Fish and Game, Special Publication No. 05-22, Anchorage.
Heinl, S. C., and A. W. Piston. 2009. Standardizing and automating the Southeast Alaska pink salmon escapement index. Alaska Department of Fish and Game, Division of Commercial Fisheries, Regional Information Report 1J09-06, Douglas.
Heinl, S. C., D. M. Eggers, and A. W. Piston. 2008. Pink salmon stock status and escapement goals in Southeast Alaska and Yakutat. Alaska Department of Fish and Game, Special Publication No. 08–16, Anchorage.
Hilborn, R., and C. J. Walters. 1992. Quantitative fisheries stock assessment: choice, dynamics, and uncertainty. Chapman Hall. New York
Hofmeister, K. 1990. Southeast Alaska pink and chum salmon investigations, 1989-1990. Final report for the period July 1, 1989 to June 30, 1990. Alaska Department of Fish and Game, Division of Commercial Fisheries, Regional Information Report 1J90-35, Juneau.
Hofmeister, K. 1998. Standardization of aerial salmon escapement counts made by several observers in Southeast Alaska. Pages 117–125 [In] Proceedings of the Northeast Pacific Pink and Chum Salmon Workshop, 26-28 February 1997, Parksville, British Columbia, Department of Fisheries and Oceans, 3225 Stephenson Point Road, Nanaimo, B. C., V9T 1K3.
Hofmeister, K., and J. Blick. 1991. Pages 39–41 [In] H. Geiger and H. Savikko, editors. Preliminary forecasts and projections for 1991 Alaska salmon fisheries and summary of the 1990 season. Alaska Department of Fish and Game, Division of Commercial Fisheries, Regional Information Report 5J91-01, Juneau.
19
REFERENCE CITED (Continued) Hofmeister, K., J. Blick, and J. R. Dangel. 1993. Southeast Alaska pink and chum salmon investigations, 1991-1992.
Final report for the period July 1, 1991 to June 30, 1992. Alaska Department of Fish and Game, Division of Commercial Fisheries, Regional Information Report 1J93-12, Juneau.
Hoffman, S. H. 1983. Southern Southeastern Alaska pink salmon (Oncorhynchus gorbuscha) tagging investigations, 1981. Alaska Department of Fish and Game, Division of Commercial Fisheries, Technical Data Report No. 92, Juneau.
Jones, J. D., and J. Dangel. 1983. Southeastern Alaska 1982 brood year pink (Oncorhynchus gorbuscha) and chum salmon (O. keta) escapement surveys and pre-emergent fry program. Alaska Department of Fish and Game, Division of Commercial Fisheries, Technical Data Report No. 97, Juneau.
Jones, D., and K. Hofmeister. 1981. Pages 18–20 [In] ADF&G, Preliminary forecasts and projections for 1981 Alaskan salmon fisheries. Alaska Department of Fish and Game, Division of Commercial Fisheries, Informational Leaflet No. 190, Juneau.
Jones, E. L., III, T. J. Quinn, II, and B. W. Van Alen. 1998. Observer accuracy and precision in aerial and foot survey counts of pink salmon in a Southeast Alaska stream. North American Journal of Fisheries Management. 18:832–846.
Mantua N. J., S. R. Hare, Y. Zhang, J. M. Wallace, and R. C. Francis. 1997. A Pacific interdecadal climate oscillation with impacts on salmon production. Bulletin of the American Meteorological Society 78:1069–1079.
McLachlan, G. J., and T. Krishnan. 1997. The EM algorithm and extensions. John Wiley and Sons. New York.
Moss, J. H., D. A. Beauchamp, A. D. Cross, K. W. Myers, E. V. Farley, Jr., J. M. Murphy, and J. H. Helle. 2005. Evidence for size-selective mortality after the first summer of ocean growth by pink salmon. Transactions of the American Fisheries Society 134:1313–1322.
Mueter, F. J., R. M. Peterman, and B. J. Pyper. 2002. Opposite effects of ocean temperature on survival rates of 120 stocks of Pacific salmon (Oncorhynchus spp.) in northern and southern areas. Canadian Journal of Fisheries and Aquatic Sciences 59:456–463.
Munro, A. R., and E. C. Volk. 2010. Summary of Pacific salmon escapement goals in Alaska with a review of escapements from 2001 to 2009. Alaska Department of Fish and Game, Special Publication No. 10–12, Anchorage.
Nakatani, R. E., G. J. Paulik, and R. Van Cleve. 1975. Pink salmon (Oncoryhnchus gorbuscha) tagging experiments in S. E. Alaska, 1938–1942 and 1945. NOAA Technical Report NMFS-SSRF-686, Seattle.
Orsi, J., A. Wertheimer, M. Sturdevant, E. Fergusson, and B. Wing. 2009. Insights from a 12-year biophysical time series of juvenile Pacific salmon in Southeast Alaska: the Southeast Alaska Coastal Monitoring Project (SECM). Alaska Fisheries Science Center Quarterly Report July–September 2009.
Piston, A. W., and S. C. Heinl. 2011. Pages 48–51 [In] D. M. Eggers and A. M. Carroll. 2011. Run forecasts and harvest projections for 2011 Alaska salmon fisheries and review of the 2010 season. Alaska Department of Fish and Game, Special Publication No. 11-03, Anchorage.
Pyper, B. J., F. J. Mueter, R. M. Peterman, D. J. Blackbourn, and C. C. Wood. 2001. Spatial covariation in survival rates of Northeast Pacific pink salmon. Canadian Journal of Fisheries and Aquatic Sciences 58:1501–1515.
Quinn II, T. J., and R. B. Deriso. 1999. Quantitative Fish Dynamics. Oxford University Press. New York.
Rich, W. H. 1927. Salmon-tagging experiments in Alaska, 1924 and 1925. Bulletin of U. S. Bureau of Fisheries 42:109–146.
Rich, W. H., and A. J. Suomela. 1929. Salmon-tagging experiments in Alaska, 1926. Bulletin of U. S. Bureau of Fisheries 43(Part 2):71–104.
Rich, W. H., and F. G. Morton. 1930. Salmon-tagging experiments in Alaska, 1927 and 1928. Bulletin of U. S. Bureau of Fisheries 45:1–23.
20
REFERENCE CITED (Continued) Shaul, L., E. Jones, and K. Crabtree. 2005. Coho salmon stock status and escapement goals in Southeast Alaska [In]
Der Hovanisian, J. A., and H. J. Geiger, editors. Stock status and escapement goals for salmon stocks in Southeast Alaska 2005. Alaska Department of Fish and Game, Special Publication No. 05-22, Anchorage.
Valentine, J. P., L. A. Gwartney, C. C. Larson, and G. D. Downey. 1970. Forecast of the 1970 pink salmon runs, Southeastern Alaska. Alaska Department of Fish and Game, Division of Commercial Fisheries, Informational Leaflet No. 142, Juneau.
Van Alen, B. W. 2000. Status and stewardship of salmon stocks in Southeast Alaska. Pages 161–194 [In] E. E Knudsen, C. R. Steward, D. D. McDonald, J. E. Williams, D. W. Reiser, editors. Sustainable fisheries management: Pacific salmon. CRC Press. Boca Raton.
Wertheimer, A. C., J. A. Orsi, E. A. Fergusson, and M. V. Sturdevant. 2010. Forecasting pink salmon harvest in Southeast Alaska from juvenile salmon abundance and associated environmental parameters: 2009 harvest and 2010 forecast. NPAFC Doc.1278. 19 pp. (Available at http://www.npafc.org).
Wickett, W. P. 1958. Review of certain environmental factors affecting the production of pink and chum salmon. Journal of the Fisheries Research Board of Canada 15:1103–1126.
Willette, T. M., R. T. Cooney, V. Patrick, D. M. Mason, G. L. Thomas, and D. Scheel. 2001. Ecological processes influencing mortality of juvenile pink salmon (Oncorhynchus gorbuscha) in Prince William Sound, Alaska. Fisheries Oceanography 10(1):14–41.
Woods, G. F. 2003. Yakutat set gillnet fishery 2003 management plan. Alaska Department of Fish and Game, Division of Commercial Fisheries, Regional Information Report 1J03-21, Juneau.
Woods, G. F. 2007. Summary of the 2006 Yakutat Area commercial salmon fisheries. Alaska Department of Fish and Game, Fishery Management Report No. 07-11, Anchorage.
Zadina, T. P., S. C. Heinl, A. J. McGregor, and H. J. Geiger. 2004. Pink salmon stock status and escapement goals in Southeast Alaska and Yakutat [In] Stock status and escapement goals for salmon stocks in Southeast Alaska. H.J. Geiger and S. McPherson, editors. Alaska Department of Fish and Game, Special Publication No. 04-02, Anchorage.
ADF&G SALMON MANAGEMENT AREA AND STOCK GROUP MAPS IN SOUTHEAST ALASKA
22
Appendix A1.–ADF&G salmon management areas in Southeast Alaska.
23
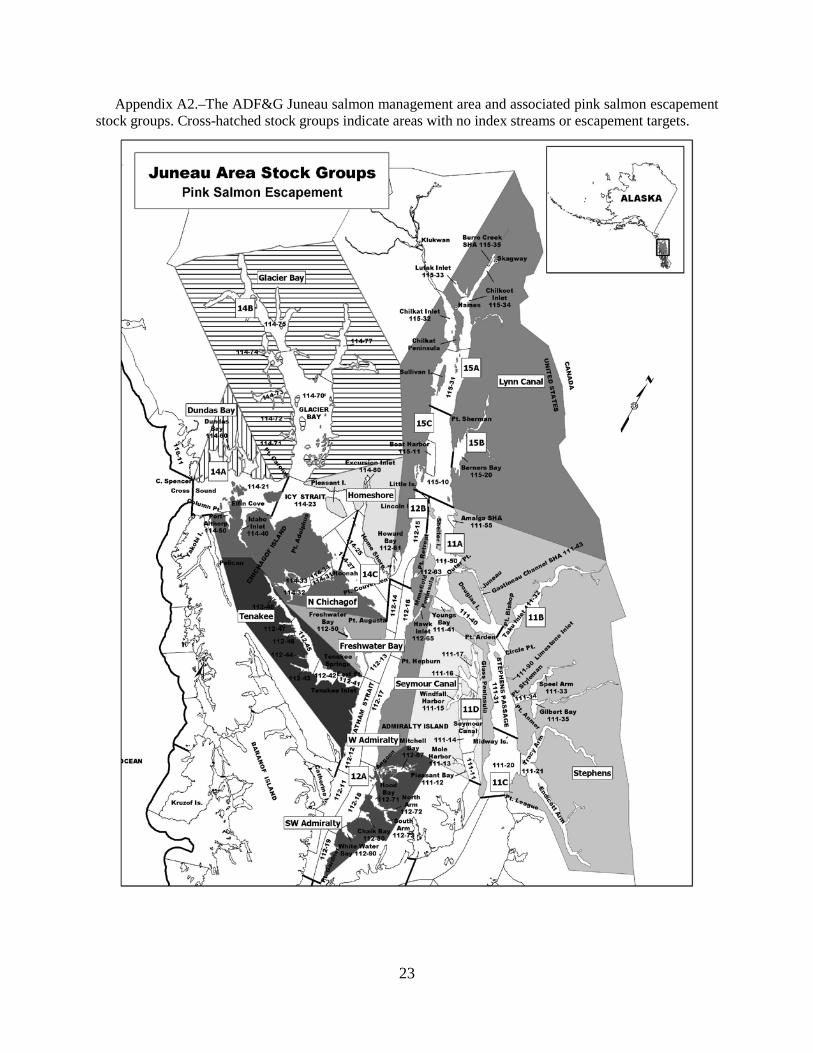
Appendix A2.–The ADF&G Juneau salmon management area and associated pink salmon escapement stock groups. Cross-hatched stock groups indicate areas with no index streams or escapement targets.
24
Appendix A3.–The ADF&G Petersburg salmon management area and associated pink salmon escapement stock groups.
25
Appendix A4.–The ADF&G Sitka salmon management area and associated pink salmon escapement stock groups. Cross-hatched stock groups indicate areas with no index streams or escapement targets.
26
Appendix A5.–The ADF&G Ketchikan salmon management area and associated pink salmon escapement stock groups. Cross-hatched stock groups indicate areas with no index streams or escapement targets.
27
APPENDIX B:
PINK SALMON ESCAPEMENT AND HARVEST IN SOUTHEAST ALASKA
28
Appendix B1.–Weir counts, survey estimates, and harvests of pink salmon at the Situk River, Yakutat area, 1960–2010.
Appendix B2.–Cumulative Situk River weir pink salmon counts (in thousands) and 15th percentile of cumulative escapement from 23 July to 5 August, 1988–2010. Escapements in the six years 1991, 1994, 1995, 2005, 2008, and 2010 were expanded from other years’ data by regressing cumulative count through 5 August on cumulative count by date for the last date of weir counts in those years.
Appendix B4.–Southeast Alaska pink salmon escapement indices and biological escapement goal (BEG) ranges by subregion (in millions of index fish), 1960–2010.
Southern Southeast Northern Southeast Inside Northern Southeast Outside BEG Lower Range 3.00 2.50 0.75 BEG Upper Range 8.00 6.00 2.50
Appendix B6.–Escapement index series and management targets for pink salmon stock groups in the Juneau management area (in millions of index fish), 1960–2010.
Appendix B7.–Escapement index series and management targets for pink salmon stock groups in the Petersburg management area (in millions of index fish), 1960–2010.
Appendix B8.–Escapement index series and management targets for pink salmon stock groups in the Sitka management area (in millions of index fish), 1960–2010.
Appendix B9.–Escapement index series and management targets for pink salmon stock groups in the Ketchikan management area (in millions of index fish), 1960–2010.
Stock Group E Behm Portland W Behm Kasaan Moira E Dall Hetta Klawock Sea Otter