BALANCING CIRCUITS A heating system may be divided up into several sub-circuits. If the circuits resemble electrical circuits wired in parallel then the resistance of each sub-circuit should be similar to maintain the correct distribution of fluid. The diagram below illustrates a system of parallel circuits. The pump should be able to develop a pressure to overcome the resistance of the Index Circuit. The other circuits should then have ‘extra’ resistance added to ensure that all three sub-circuits have equal resistance. This ‘extra’ resistance is added at the Balancing Valves. A Balancing Valve is manufactured so that small changes in resistance can be made by altering the valve setting.
Transcript
BALANCING CIRCUITS
A heating system may be divided up into several sub-circuits.
If the circuits resemble electrical circuits wired in parallel then the resistance of each sub-circuit should be similar to maintain the correct distribution of fluid.
The diagram below illustrates a system of parallel circuits.
The pump should be able to develop a pressure to overcome the resistance of the Index Circuit.
The other circuits should then have ‘extra’ resistance added to ensure that all three sub-circuits have equal resistance.
This ‘extra’ resistance is added at the Balancing Valves.
A Balancing Valve is manufactured so that small changes in resistance can be made by altering the valve setting.
If the index circuit in the above diagram is sub-circuit No.3, then the Balancing Valves of the other two circuits will be closed down to give an equal resistance in all three circuits.
The photos below show typical balancing valves.
The table below is a blank
PIPE SIZING TABLE<FONT< P>
EXAMPLE 7Size the pipework for the heating system shown below.
Determine which circuit is the Index Circuit.
Also determine the pressure drops in the three sub-circuits.
The total lengths of the section are:
The table below shows each of the 3 sub-circuit pressure drops.
The Index Circuit is therefore the Circuit to the Hot Water Indirect Cylinder with a pressure drop of 9918 Pa.
The system should be balanced by slightly closing the valve on the heating return pipe at the boiler.
The Index Circuit pressure drop is 9918 Pa
The pump should be capable of delivering 0.411 kg/s against a pressure of 9918 Pascals (1.01 metres head).
A margin may be added to these figures.
EXAMPLE 6Size the pipework for the heating system shown below. Also determine the pressure drops. The total lengths of the section are:
Pipe Sizing Example 8HEATER BATTERY
Size the pipe and the pump for the system shown below.Use mild steel pipe at average water temperature 75oC.
Length of run F&R = 65 metres.
BoilerCast iron
Heater BatteryOutput 45 kW = 20
3-port diverting valve, pressure drop = 0.5 bar.
PIPE SIZING TABLE
SectionRef.
1Heat
Outputin
section
kW
2Pipe Heat loss.15% of 1.
kW
3Total HeatCol. 1+2
kW
4Water FlowRate
kg/s
5Pipe Size
mm dia.
6Length of pipe
m
7Total Equivalent length of Fittings
m
8Tota
l Pipe LengthCol. 6+7m
9Pressure drop per
metre
Pa/m
10TOTAL
PRESSURE DROP
Col. 8 x 9Pa
1 6.75 51.75 51.75 / 42= 1.23
40 65 Heater battery = 20.0Boiler = 2.5
122.4
220 26,928
12 bends x0.5 = 6.06 valves x 0.25 = 1.5
Add div valve
1 tee = 0.2
0.5 bar =50,000 Pa
= 30.2
TOTAL= 76,928 Pa
TEL = 30.2 x 1.9 (le)TEL = 57.38 metres
= 7.7 metres head
Add margin of 20% on flow rate and 10% on the head.Flow rate = 1.23 + 20% = 1.48 kg/s.Pump head = 7.7 metres + 10% = 8.5 metres
Pump to be capable of 1.48 kg/s (l/s) flow rate against a head of 8.5 metres or ( 85 kPa or 85 kN/m2.)
Look up Biral Catalogue: HX 501 pump is specified.
EXAMPLE 1Determine the smallest pipe which will carry 0.4 kg/s of water at 75oC using Copper, Table 'X'.
Consult the FLOW of WATER in PIPES TABLE (Copper pipe at 75oC).
The pipe diameters are written in bold type across the top of the table.
The pressure loss per unit length (Pa/m) and velocity (m/s) are written down the LHS of the table.
A red horizontal line is drawn across the table below 300 Pa/m.
This means that suitable pipe sizes will be found above this line.
The velocity follows a stepped line the lower blue line is the
1.0 m/s velocity line.
A 22 mm pipe will carry 0.4 kg/s but the pressure loss per unit length is below the red horizontal line and outside the table.
The pressure loss is in fact (790 Pa/m) and is too high since the maximum should be 300 Pa/m.
The velocity is also too high at about 1.3 m/s, the optimum being 1.0 m/s.
If this is the case then look at the next pipe size up, at 28 mm.
The flow rates closest to 0.4 are 0.394 and 0.414 kg/s.
0.4 kg/s is in between these two flow rates.
A 28 mm pipe will carry 0.4 kg/s with a pressure loss of about 230 Pa/m and a velocity of 0.7 m/s.
This meets the design criteria and therefore 28 mm would be a suitable pipe size.
EXAMPLE 2Determine a suitable pipe size for L.T.H.W. copper pipe for a flow rate of 1.0 kg/s.
Answer:
A 42 mm pipe gives a flow rate of 1.0 kg/s with a pressure loss of 160 Pa/m and velocity of about 0.9 m/s.
EXAMPLE 3Choose a pipe diameter for a heating system (L.T.H.W.) with a heat output of 32 kW.
Answer: First find the mass flow rate of water required.
A 35 mm pipe will give a flow rate of 0.76 kg/s with a pressure loss of 250 Pa/m and a velocity of 0.95 m/s.
EXAMPLE 4Size the flow and return pipework to a 1.6 kW radiator.
A 15 mm pipe will give a flow rate of 0.038 kg/s with a pressure loss of 80 Pa/m and a velocity of about 0.25 m/s.
PIPE FITTING LOSSESPipework fittings such as bends, tees, reducers etc., cause pressure loss or resistance in a heating system. When making approximate calculations 10%, 15%, 20% or more may be added to the pressure loss in straight pipe runs.
For accurate calculations the fitting loss should be determined separately for each fitting.
The concept of equivalent length is used and is defined as the length of straight pipe which would give a friction pressure loss equivalent to one velocity head.
The D’Arcy equation is;
H = 4 . f . l . v2 / 2 . g . d
Where; H = head loss due to friction in a straight pipe (m)f = friction coefficientl = length of pipe (m)d = diameter (m)v = velocity of fluid (m/s)g = acceleration due to gravity (m/s2)
The D’Arcy equation can be rewritten for pressure instead of head.
Pressure drop (pl) = ( 4 . f . l ) / d x ( v2 . . g ) / 2 . g
Where; pl = Pressure loss in a pipe section (Pa)f = friction coefficient for pipe l = length of pipe (m)d = diameter of pipe (m)v = water velocity (m/s) = density of water (kg/m3)g = acceleration due to gravity (m/s2)
To simplify the above equation we get;
Pressure drop (pl) = ( 4 . f . l ) / d x ( v2 . ) / 2
or; Pressure drop (pl) = ( 4 . f . l ) / d x ( ½ . . v2 )
For the friction pressure loss to equal one velocity head;
Velocity pressure = ( � . . v2 )
Then 1.0 = ( 4 . f . l ) / d
The length (l) is now called equivalent length (le) and by rearranging the above formula we get;
1.0 x d = 4 . f . le
le = d / 4 .f
Values of equivalent length are given in the FLOW of WATER in PIPES TABLE for water at 75oC, see CIBSE guide C (2001) section 4 , Flow of Fluids in Pipes and Ducts, Tables 4.9 to 4.33 for various types of pipes.
These values should be corrected for each particular type of fitting.
The correction factors of Velocity pressure loss factors are called (Zeta) factors.
The resistance in a fitting is converted to equivalent straight lengths of pipe, e.g. a bend may have a resistance equivalent to 1.2 metres of straight pipe.
The TOTAL EQUIVALENT LENGTH OF A FITTING = Equivalent Length x Pressure Loss factor (Zeta).
TOTAL EQUIVALENT LENGTH OF A FITTING (m) = (le) x (Zeta factor).
See CIBSE guide C (2001) section 4.9 for more details of fittings zeta factors.
EXAMPLES OF zeta FACTORS
The following are some examples of pressure loss ( zeta) factors for pipe fittings:
Index CircuitThe Index Circuit is the circuit with the highest resistance.
This only applies to systems where the circuits are divided.
The Index Circuit needs to be identified so that the pump can be sized.
Example 1
The system shown below is divided into two sub-circuits A & B.
A pipe sizing calculation would determine which of the two sub-circuits had the most resistance and therefore which was the Index Circuit.
The reason for finding the Index Circuit is to size the pump.
The pressure developed by the pump should be capable of overcoming the resistance in the Index Circuit.
If the pump pressure can overcome the resistance in the Index Circuit, then it can overcome the resistance in other circuits of lesser resistance.
If it was found that the Index Circuit was Circuit (B) in the above diagram then we would include the flow of water through radiators No. 3, 4 and 5.
Pump
Sub-Circuit BSub-Circuit A
BOILER
No.1
No.2
No.3 No.4
No.5
Heat Emitters
If we examine Circuit (B) then the Index Circuit flows past Radiator No.3 and No.4 and through Radiator No.5. This would be the circuit with the highest resistance.
If the pump is capable of forcing water through the pipework to Radiator No.5 then there will be enough pressure to force the water through Rads. No.3 & No.4 since they are closer to the pump.
This is the reason why only one radiator is included in the calculations for resistance in the Index Circuit.
Pump
Sub-Circuit B is Index Circuit
Sub-Circuit A
BOILER
No.1
No.2
No.3 No.4
No.5
Heat Emitters
Radiator No.5 Included in Index Circuit
Example 2
A heating system is shown below.There are seven radiators and seven pipe sections.The pipe sections under the radiators are from tee to tee.
The Index circuit is the one with the highest resistance.This is normally the longest run to the radiator that is at the greatest distance from the pump.The first six radiators are not included in the Index circuit.The index circuit below includes all seven sections but only includes; the boiler and fittings around the boiler in section 1, tees in sections No.1 to No.6 and the last radiator and radiator valves in the section 7.
Only Radiator No.7, the last rad., together with the rad. valves is included in the Index Run.
Index Circuit;Sections 1, 2, 3, 4, 5, 6 and 7.
Pipe Sizing for Heating Systems
All pipe sizing in building services is based on the D'Arcy equation, where:
H = 4 . f . l . v2 / 2 . g . d
where H = head loss due to friction in a straight pipe (m)f = friction coefficientl = length of pipe (m)d = diameter (m)v = velocity of fluid (m/s)g = acceleration due to gravity (m/s2)
The object of pipe sizing is to obtain the smallest diameter of pipe without too high a water velocity or too high a pressure drop and therefore large pumps.
It is more convenient to use pipe sizing tables when sizing pipes rather than the D'Arcy equation.
This is because the water velocity and head loss (or pressure loss) are unknown at the time of pipe sizing, and the friction coefficient (f) varies with Reynolds number which in turn varies with velocity and diameter.
A FLOW of WATER in PIPES TABLE is provided in these notes.
The CIBSE guide provide pipe sizing tables in sections C4.11 to C4.45.
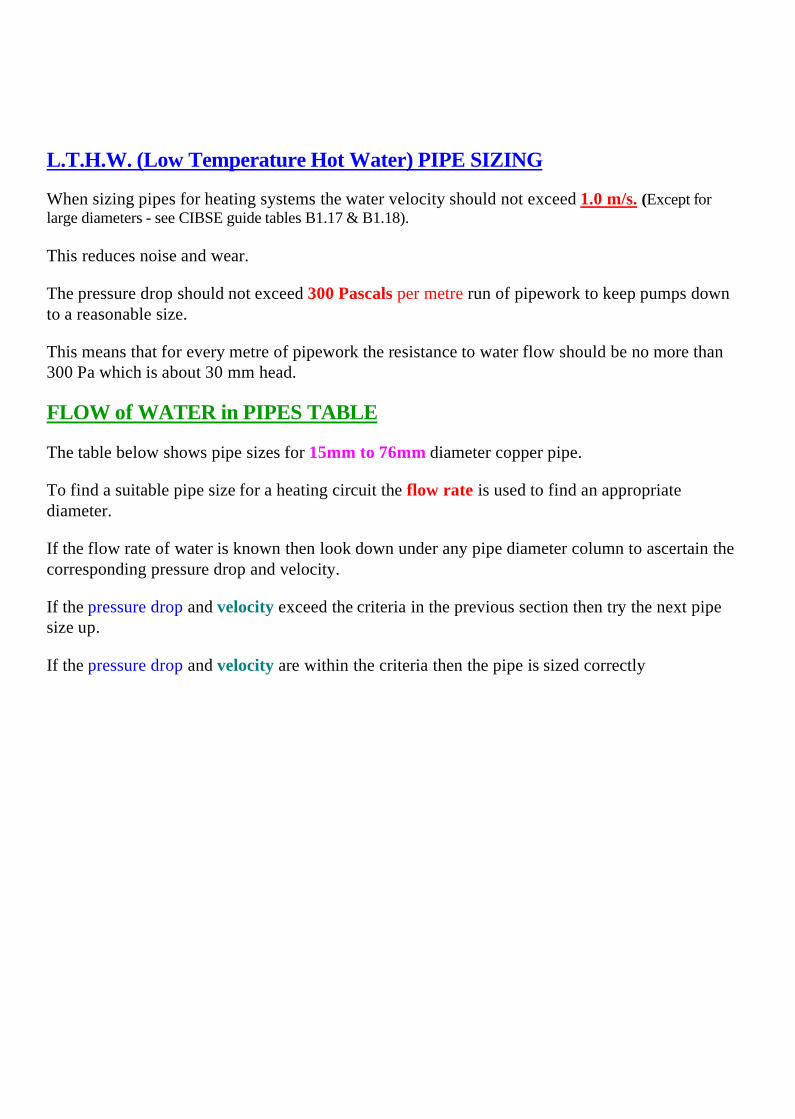
L.T.H.W. (Low Temperature Hot Water) PIPE SIZING
When sizing pipes for heating systems the water velocity should not exceed 1.0 m/s. (Except for large diameters - see CIBSE guide tables B1.17 & B1.18).
This reduces noise and wear.
The pressure drop should not exceed 300 Pascals per metre run of pipework to keep pumps down to a reasonable size.
This means that for every metre of pipework the resistance to water flow should be no more than 300 Pa which is about 30 mm head.
FLOW of WATER in PIPES TABLE
The table below shows pipe sizes for 15mm to 76mm diameter copper pipe.
To find a suitable pipe size for a heating circuit the flow rate is used to find an appropriate diameter.
If the flow rate of water is known then look down under any pipe diameter column to ascertain the corresponding pressure drop and velocity.
If the pressure drop and velocity exceed the criteria in the previous section then try the next pipe size up.
If the pressure drop and velocity are within the criteria then the pipe is sized correctly
PIPE SIZING TABLE
The pipe sizing table shown below is an aid to sizing more complicated circuits.
A description is given in the Table below.
EXAMPLE 5Size the pipework for section (B) of a heating system shown below.
Section B is in red.
Also determine the pressure drop in section (B)
The total length of the section is 8 metres (includes flow and return)
Section B supplies hot water to Radiator No. 2 and No. 3.
The amount of heat to be transferred to radiators No. 2 & 3 is:
1.5 + 1.0 = 2.5 kW.
The downstream tees will be included in this section.
Sizing Example 9WARM AIR HEATERS
Size the pipes to Circuit A and Circuit B and the pump for the system shown below.Use mild steel pipe at average water temperature 75oC.Length of run Section 1 = 26 metres (F & R)Length of run Section 2 = 43 metres (F & R)Length of run Section 3 = 50 metres (F & R)
Pressure drop 3 –port valves = x g H = 1000 x 9.81 x 2 m = 19,620 Pa
3-port diverting valve,
BoilerCast
Industrial warm air heater.Output 70 kWHeater battery
3-port diverting valve,
Industrial warm air heater.Output 62 kWHeater battery
Section 2 Section 3
Section 1
PIPE SIZING TABLE
SectionRef.
1Heat
Outputin
section
kW
2Pipe Heat loss.
15% of 1.
kW
3Total Heat
Col. 1+2
kW
4Water FlowRate
kg/s
5Pipe Size
mm dia.
6Length of pipe
m
7Total
Equivalent length of Fittings
m
8Total Pipe
LengthCol. 6+7
m
9Pressure drop per
metre
Pa/m
10TOTAL
PRESSURE DROP
Col. 8 x 9Pa
1 132 19.8 151.8 3.61 65 26 le = 3.5 26 + 20.13
140 140 x 46.13
3Gate valves @ 0.15 = 0.451 NRV = 2.0
= 46.13 = 6,458
1 Boiler = 2.52 Elbows @ 0.4 = 0.8
5.75
3.5 x 5.75 = 20.13 m
2 70 10.5 80.5 1.92 50 43 le = 2.5 43 + 12.75
160 160 x 55.75
3 Gate valves @ 0.2 = 0.64 Elbows @ 0.5 = 2.0
= 55.75 = 8,920
2 Tees @ 0.5 + 0.5 + red.Reduction 502 / 652
=
+ 19,620 +8,100
Ratio = 0.59 = 0.252Tees @ 1.25 = 2.50
= 36,640
5.12.5 x 5.1
= 12.75 m 3 62 9.3 71.3 1.70 50 50 le = 2.5 50 +
17.75 =130 130 x 67.75
3 Gate valves @ 0.2 = 0.68 Elbows @ 0.5 = 4.0
67.75 = 8808
2 Tees @ 0.5 + 0.5 + red.Reduction 502 / 652
=
+ 19,620 +7,200
Ratio = 0.59 = 0.252Tees @ 1.25 = 2.50
= 35,628
7.12.5 x 7.1
= 17.75 m
Index circuit is therefore to Section 1 & 2 since this has the highest resistance.
Resistance of Index Circuit = 6,458 + 36,640 = 43,088 Pa.
Pump to be capable of (Minimum) 3.61 kg/s (l/s) flow rate against a head of 4.31 metres or ( 43.1 kPa or 43.1 kN/m2.)
Pipe Sizing Example 10Size the pipes and the pump in the system shown below.The heating system is for Factory Radiant Panel Heaters and the design
inside temperature is 15oCUse welded mild steel pipe and fittings at average water temperature 75oC.
Section Length (F&R) (Metres)
1 252 303 184 155 406 187 15
BoilerCast Iron
Each 3-port diverting valve, pressure drop = 3.6 metres head
Section 2
Section 5
Section 1
Section 3
Section 4
Section 6
Section 7
4No. Radiant Panels – 4 horizontal tubes each.To be sized from catalogue.Required output each 40 kW.Hydraulic resistance from
N.R.V.D.R.V.D.R.V.
Pressure Drops from Equipment
3-Port Diverting Valve
Pressure drop 3 –port valves = x g x H = 1000 x 9.81 x 3.6 m = 35,316 Pa
Radiant Panels
Powermatic Radiant Panels, type Aquamatic ARP (see http://www.powrmatic.co.uk/)
Total emissions from catalogue , 75 MWT, 15oC ambient, 4 tubes horizontal - 734 W per m run. (from Table 5)Pipe length of each panel is; 40,000 Watts output / 734 W/m = 56
metres.
Mass flow rate for each panel is 40 kW / 42 = 0.95 kg/s.For each tube mass flow rate is 0.95/4 = 0.25 kg/s + 15% heat loss =
0.28 kg/sFrom hydraulic resistance graph (on website), resistance for each panel = 38 Pa/m runTotal resistance for each panel 38 x 56 m = 2128
Pa.
Pipe Sizing Table
SectionRef.
1Heat
Outputin
section(kW)
2Pipe Heat loss.15% of 1.(kW)
3Total HeatCol. 1+2
(kW)
4Water FlowRate(kg/s)
5Pipe Size(mm dia.)
6Length of pipe
(m)
7Total Equivalent length of
Fittings
(m)
8Total Pipe
LengthCol. 6+7
(m)
9Pressure drop per
metre(Pa/m)
10TOTAL
PRESSURE DROPCol. 8 x 9
(Pa)
40 6 46 1.1 40 18 18 + 3.15= 21.15
1806,3 2elbow weld @ 0.4 = 0.81 st. thro’ tee = 0.23 gate valve @ 0.25 = 0.75
Total = 1.75T.E.L. = Total x le
= 1.75 x 1.8 = 3.15m
21.15 x 180= 3807 + panel 2128+ 3 port valve = 35,316= 41,251
40 6 46 1.1 40 15 15 + 4.59=19.59
1807 4elbow weld @ 0.4 = 1.61 st. thro’ tee = 0.23 gate valve @ 0.25 = 0.75
The circuit containing sections No. 1,5 & 6 have the highest resistance and are therefore the index run with a 49,331 Pa pressure drop.
The pump should be capable of a minimum 4.38 kg/s (l/s) flow rate against a minimum head of 4.93 metres or ( 49.3 kPa or 49.3 kN/m2.) Allowance to pump size may be made for margin or inefficiencies.
Regulating Valves
A commissioning engineer would balance the system using double regulating valves (D.R.V.’s) or metering stations. This process is briefly outlined in BSE Notes Pipe Sizing section, page 9 entitled Balancing Circuits.
The drawing of the system for this example shows two D.R.V.’s; one in section 2 and one in section 5. Before these can be adjusted the sub-circuits No.3 and No.4 must be balanced as well
as sub-circuits No.6 and No.7. When these sub-circuits are balanced then the D.R.V.’s can be regulated.
The amount of extra resistance needed in the D.R.V. in section 2 is;
Resistance in section 5 = 3670 PaResistance in section 2 = 2902 PaDifference between these resistances = 3670 - 2902 = 768 Pa.Therefore the D.R.V. in section 2 is to be turned down to give a resistance to flow of 768 Pa.This means that the circuits are balanced.
Diverting Valves By-Pass Pipe
The by-pass pipe for the 3-port Diverting valves should also be regulated with a D.R.V so that when the valve is fully closed to the panel and fully open to the by-pass port, the resistance of the by-pass section of pipework is equal to that of the radiant panel. This means that the D.R.V in the by-pass pipework should be turned down to give a resistance of 2128 Pa. from the panel (see Radiant panel section) plus the resistance of two gate valves.
See pipe sizing table – pipe section 3.2 No. 40mm gate valve @ = 0.4 therefore total = 0.8. Equivalent length is 0.8 x le 1.8 = 1.44 metres.1.44 x 180 Pa/m pressure drop = 259 Pa pressure drop for 2 gate valves.
The total resistance applied by the D.R.V. is therefore 2128 Pa + 259 Pa = 2387 Pa
Diverting Valve Schematic Detail at Radiant Panel
3-port diverting valve (may be installed on return depending on manufacturer).
Flow
Return
By-passD.R.V.
Standard manometer tappings to measure pressure difference across an orifice
Radiant Panel
Isolating Gate Valves
Panel pipework resistance = 2128 Pa (from catalogue)
Boiler SizingThe boiler output is based on the total heat losses for the building plus hot water boiler power.Other additional items that can be considered are; heater battery outputs and other equipment that require heat.
For details of Boiler Power for Hot Water cylinder see Hot and Cold water section – Hot water generation & storage page 2.
Boiler output (kW) = heat loss (kW) + boiler power for cylinder (kW)
Boiler margin.
It is useful to add a margin to the previous figure for;
1. In case of future extension.2. Quick heat up when the system is cold.3. In case of mistakes in heat loss calculations.4. Loss of efficiency later in boiler life.
We could add between 15% and 33% as a boiler margin.A large margin means the boiler is less efficient since it is firing for less time.The more time a boiler sits idle with a full capacity of hot water, the more heat is lost up the flue and to a lesser extent from the casing.A suitable margin for most projects is 20% margin.
Total Boiler output (kW) = heat loss (kW) + boiler power for cylinder (kW) + 20% margin.
Note:In most cases a margin has already been added to the heat loss to size heat emitters. It should be remembered that if this margin is 10% and a further 20% margin is added for boiler sizing then the net resultant margin is 32%.In continuously operated heating systems such as hospitals, a smaller margin is acceptable since the system is not heated from cold each morning.
Multiple Boiler Installations
In the past if two boilers were to be installed, each one was sized at 2/3rds of the total capacity. This overall margin of 33% is on the high side so a lower margin is more acceptable.A multiple boiler installation is a more efficient method of providing heating since the more boilers that are installed the more they will operate at full load when switched on.
]
Recommendations
CIBSE guide F (2002) section 10.1.2.2 and BSRIA Guidance Note 12/97 Oversized Heating Plant gives details of plant sizing.
As a guide to boiler capacity (heating load) the following yard sticks can be used; 90 W/m2 for offices and industrial buildings, 110 W/m2 for retail, health care and education establishments.
Also for Hot Water calorifier sizing the following yard sticks can be used; 4 l/person for offices, retail, education and restaurant establishments, 23 l/person for hotels, 33 l/person for health care.
Other considerations for oversizing are;
1. Oversizing boilers is a greater capital cost.2. Seasonal efficiency will be less is boilers are oversized.3. Oversizing of control valves means that they don’t control the flow of water
effectively.4. Oversizing pumps means that they consume more electricity than is necessary.5. Also oversizing pumps means that it is more difficult to control the water flow.6. Pumps that are too large will not be operating at the most efficient part of the
characteristic curve.7. Pipe heat losses are increased.8. Oversizing heat emitters mean that the system is more difficult to control with
temperature sensors since the room temperature will drift easily beyond the set point.9. The heat gains from; lights, people and machinery will offset the heat loss in a
building. This is not usually considered when calculating boiler outputs but helps to reduce the amount of heat required in winter time.
Plant Size Ratio
CIBSE guide B1 (2002) section 4.7 gives details of Plant Size Ratio (PSR).
This is defined as; PSR = installed heat emission / design heat loss
Factors for PSR of between 1.2 and 2.0 are common.
A building with low thermal inertia heats up more quickly than one with high thermal inertia and therefore a lower plant size ratio may be used.
The optimum plant size ratio is a compromise between the following factors;
1. occupancy pattern.2. pre-heat time.3. thermal response of the building.4. greater capital cost and maintenance cost.5. stability of controls..6. seasonal efficiency.
Pump SizingThere are two items required to size a pump;
Fluid flow rate Pressure to be developed.
The pressure that should be developed by the pump shouldequal the Pressure Drop in the system.This is usually found from pipe sizing tables or from other methods. See Science section of these notes - Fluids section; Head Loss due to friction in a pipe.
The flow rate of fluid is also found from pipe sizing tables or given in other data.
Add 20% margin to pump pressure to allow for future extensions and the system getting less efficient. The designer must be careful when adding a margin to pump pressure since too much pressure can lead to ‘pumping over’ in open systems and other problems.Some pump catalogues have units of head instead of pressure.
For conversion;
Pressure (Pa) = density of water x acceleration due to gravity x head (m)Or P = x g x H
Where, P = Pump pressure (Pa) Density of waterapprox.1000 kg/m3.g = Acceleration due to gravity 9.81 m/s2.H = Head (m)
Therefore; H = P / x g
H = P / 1000 x 9.81
H = P / 9810
The flow rate of water that the pump delivers will be the flow rate in the section in which the pump is installed.A 20% margin may be added to this flow rate to allow for future extensions to the system.
A pump catalogue may be consulted to choose a suitable unit.
The operating point can be super-imposed on the pump graph for pressure (head) against flow rate in kg/s or l/s. It is best to choose a pump with the operating point near the lower speeds or the bottom end of the performance curve so that the pump will not be operating at its maximum capacity, thus allowing little room for error or margin.
A typical pump sizing curve is shown below with a system operating point superimposed on the curve.
Not all system operating points are directly on top of a pump graph or curve as shown below.It would be best to choose a pump on the curve above the operating point, i.e. Pump B since the output of both pressure and flow rate will be slightly above that required and not below.
Flow rate (l/s) or (kg/s)
Pressure (Pa) (kPa) or Head (m)
Operating point
Typical Pump Sizing Curve
Pump graph or curve
Systemflowrate
SystemPressure or
head
Similarly if a pump has three speeds then three curves will be shown.It would be best to operate a pump at a lower speed if possible to prolong the life of the pump and bearings. The diagram below shows a 3-speed pump with the operating point between speed No.1 and No.2. The pump would then be installed to run at speed No.2; this means that if the system is extended at a later date the pump speed may be increased to accommodate this increase in flow rate and pressure.
Flow rate (l/s) or (kg/s)
Pressure (Pa) (kPa) or Head (m)
Operating point
3 Pump graphs or curves
Systemflowrate
SystemPressure or
head
Pump A
Pump B
Pump C
Flow rate (l/s) or (kg/s)
Pressure (Pa) (kPa) or Head (m)
Operating point
Typical Pump Sizing Curve - 3 Speed Pump
Pump with 3 speeds
Systemflowrate
SystemPressure or
head
Speed 3
Speed 2
Speed 1
Example 1
Size a suitable in-line glanded pump to deliver 10 litres/second of water against a head of 7 metres (70 kPa).Use the information from the Smedegard pump curves shown below.The pump should have a duty and standby facility, that is; a twin pump abbreviated (D).
Manufacturer’s InformationThe pumps shown are 1400 and 900 rpm.Each pump is given a 3 number reference; the first number is the pipe size in inches, the second number is the impellor diameter, the third number is the number of motor pole pairs.
Answer
The operating point can be super-imposed on the pump curves below for head (kPa) against flow rate in l/s.
At first look at the pump curves the; 8-200-4(D) pump is close to the operating point.It is sometimes best to choose a pump with the operating point on the flat part of the pump curve, this gives some anti-stall facility and means that if the volume flow rate fluctuates then the pressure developed will not change.So, a 10-210-4(D) pump may be better suited to a load where the volume flow rate is not steady.This might happen in a circuit where control valves alter water flow rates.Also the 10-210-4(D) pump has more margin for pressure and flow rate above the duty given in the question.A commissioning engineer would have to regulate the flow of water through the pump with a regulating valve to achieve the design flow rate.
To choose a pump the engineer has to be aware of the type of system to which it is connected and choose accordingly.
Consult; http://www.smedegaard.dk/media(93,1033)/Omega_UK_explanation_datasheets.pdf for further information on pump sizing from Smedegard.
Some manufacturer’s curves give more details.Pump efficiency and pump power can also be shown so that it is possible to choose a pump operating at the highest efficiency part of the curve.Another way to reduce flow rate is to change the impellor to a smaller size.
Heating Pump SizingThe heating pump must overcome the resistance to water flow in the pipework system.This resistance will be a combination of straight pipe losses and fittings losses.
To calculate the fittings losses + the pipe losses:
1. Look up the Zeta factor for the fitting in table C4.36.2. Multiply all the Zeta factors in the section by the Equivalent Length for the pipe (l e) found in Table C4.14.3. Add the EQUIVALENT LENGTH of fittings for the section to the actual length of the section in metres.
This gives the TOTAL EQUIVALENT LENGTH in metres.4. Multiply the TOTAL EQUIVALENT LENGTH by the pressure drop in the section (N/m2 per m run).
The pressure drop in the section is found from Table C4.14.This gives the PRESSURE DROP in the section (N/m2 ) or (Pa).
The pressure that should be developed by the pump should equal the Pressure Drop inthe Index Circuit.The Index Circuit is the part of the system with the highest pressure drop.Therefore:
Pump pressure = pressure drop in Index Circuit.
Add 20% margin to pump pressure to allow for future extensions and the system getting less efficient. The designer must be careful when adding a margin to pump pressure since too much pressure can lead to ‘pumping over’ in open systems and other problems.
Some pump catalogues have units of head instead of pressure.
For conversion;
Pressure (Pa) = density of water x acceleration due to gravity x head (m)Or P = x g x H
Where, Density of water ( = 1000 kg/m3.Acceleration due to gravity (g) = 9.81 m/s2.
Therefore; H = P / x g
H = P / 1000 x 9.81
H = P / 9810
The flow rate of water that the pump delivers will be the flow rate in the section in which the pump is installed.A 20% margin may be added to this flow rate to allow for future extensions to the system.
A pump catalogue may be consulted to choose a suitable unit.Smaller pumps can be in-line, that is installed in the pipeline.Larger pumps may be seated on a concrete base, these tend to be end suction pumps where the water is sucked into the pump end and comes out at 90 degrees at the outlet.
The operating point can be super-imposed on the pump graph for pressure (head) against flow rate in kg/s or l/s. It is best to choose a pump with the operating point near the lower speeds or the bottom end of the performance curve so that the pump will not be operating at its maximum capacity, thus allowing little room for error or margin.
Gas Properties
The Table below lists some of the more useful properties in building services for natural gas and liquid petroleum gas (LPG).
Properties Natural Gas Liquid Petroleum Gas (LPG)
Propane
Composition & Chemical symbol 92.6% Methane CH43.6% Ethane C2H60.8% Propane C3H80.2% Butane C4H10
100% C3H8
Gross Calorific Value (GCV)(MJ/m3)(kJ/litre)
41.6 95as gas
Gross Calorific Value (GCV)(MJ/litre)
0.0416 25.5 as liquid
Gross Calorific Value (GCV) (MJ/kg) 53.3 50Net Calorific Value (NCV)(MJ/m3)
38.7 86
Density of gas at 15oC(kg/m3)
0.78 1.85
Density of liquid under pressure(kg/litre) or (kg/m3)
- 0.512 kg/litre or512 kg/m3
Ignition temperature (oC) 650 510Operating pressure (millibars) 20 37Volume of gas per volume of liquid (m3/m3) or (m3/litre)
Medium pressure lines- 450 Pa per m run ( 2 P.S.I. per 100 foot )Low pressure lines - 4.1 Pa per m run ( �” w.g. /100 ft)
- Maximum 1300 Pa total pressure drop in any run.Gas Pressures
First stage regulation at tank pressure is reduced from 6 bar to 0.7 bar.Second stage regulation at building pressure is reduced to 50 mbar (0.05 bar) At equipment and appliances - 37 millibar (0.037 bar)
Natural Gas Pipe Sizing
Allowable pressure drops
The allowable pressure drop between the outlet of the meter and appliances must not exceed 1 mbar or 0.001 bar or 100 Pa.Pressure loss is generally limited to between 75 Pa and 125 Pa from the meter to the point of use.
Gas Pressures
At equipment and appliances - 20 millibar (0.020 bar)
Gas Pipe Sizing - Introduction - Page 1 2 3 4
SIMPLE METHOD OF NATURAL GAS PIPE SIZING
A simple method of sizing Natural Gas pipes is to use the tables below.The three tables are for Steel, thin wall copper and thick wall copper.An allowance may be made for fittings. This allowance is to add to the measured pipe lengths, 0.3 metres for 90o bends and 0.6 metres for an elbow or tee.
Procedure
1. Measure the length of pipe in each section.2. Add equivalent lengths for fittings.3. Determine heat output of appliance or heat to be carried in pipe in MW4. Divide this by Gross Calorific Value (GCV) of gas i.e. 38.7 MJ/m3 to give gas flow rate in m3/s.5. Determine pipe size from relevant Table.
Example 1
Determine the steel pipe size for a gas boiler if the boiler rating is 28 kW and the measured pipe run is 10.2 metres with 3 elbows.
Procedure
1. Measure the length of pipe in each section – answer 10.2 m 2. Add equivalent lengths for fittings – answer 3 x 0.6 = 1.8 m. Add to 10.2 m gives 12.0 metres.3. Determine heat output of appliance or heat to be carried in pipe in MW. – answer 28 / 1000 = 0.028 MW4. Divide this by Gross Calorific Value (GCV) of gas i.e. 38.7 MJ/m3 to give gas flow rate in m3/s – answer 0.025 / 38.7 =
0.0007235 m3/s5. Determine pipe size from relevant Table – answer from Table 1 gives 20mm pipe because the flow rate lies between two
values on the table and the larger pipe size is chosen.
Table 1 below is used for Mild Steel pipe, BS 1387: medium grade.
Table 1 – Gas Pipe Sizing for Steel PipePipe length (m)
It must be remembered that the above method of pipe sizing is not as accurate as using the CIBSE guide method as detailed in page 3, but can be useful for checking pipe sizes quickly.
Use CIBSE guide Table C4.45 (steel) and C4.46 (copper) for natural and LPG pipe sizing.If LPG is used then refer to correction factors on page C4.76 of the CIBSE guide.Most domestic natural gas appliances operate at a pressure of 20 millibar (0.020 bar)Domestic LPG appliances operate at a gas pressure of 37 mbar (0.037 bar).For natural gas it is usual to limit the pressure loss to 75 Pa to 125 Pa from the gas meter to the point of use. A maximum pressure drop from meter to appliance of 1millibar (100 Pa) can be used.
Natural Gas Pipe Sizing Example
Size the gas supply pipe shown below. Copper pipework is used.Appliance pressure is 20 mbar.Use the maximum pressure drop given above of 100 Pa from meter to appliance.
Section Length(metres)
1 82 43 134 55 4
25 kW boiler
Cooker with hob.(12 kW)
4 kW gas fire
Section 1 Section 2 Section 3
Section 4 Section 5Gas Meter
Example 1 – Gas Pipe System
To calculate the gas flow rates use the following formula:
Q = H / GCV
Where;Q = Gas flow rate in pipe section (m3/s)H = Heat output in pipe section (convert to MW)GCV = Gross Calorific Value of gas (MJ/m3) given in Pipe Sizing Table.
For example, in Pipe section 1 the Heat output to all appliances is 25 + 12 + 4 kW = 41 kW.Flow rate Q = H / GCV
Q = 41 x 10-3 (MW) / 38.7 (MJ/m3) from Pipe Sizing Table.Q = 1.05943 x 10⁻³ m3/sQ = 0.00105943 m3/sQ = approximately 0.00106 m3/s
GAS GROSS CALORIFIC VALUEMJ/m3
Natural gas 38.7
L.P.G. ( Commercial propane) 96
Gas Pipe Sizing Table
SectionRef.
1Heat
Outputin
section
kW
2Flow ratem3/s
3Pipe Size
mm dia
4Length of pipe
m
5Total Equivalent length of Fittings
m
6Total Pipe
LengthCol. 4+5m
7Pressure
drop per
metre
Pa/m
8TOTAL
PRESSURE DROP
Col. 6 x 7Pa
9Pressure at start of sectionPa
10Pressure at end
of sectionPa
1 41 0.00106 28 8
Zeta factor for Tee = 0.5 + 1.0 + 0.25 = 1.75T.E.L. = x le
= 1.75 x 0.7
= 1. 23 m
8 + 1.23= 9.23
2.2 20.31
2 16 0.000413 15 4
Tee 0.5 + 1.0 = 1.5T.E.L. = x le
= 1.5 x 0.4= 0.6 m
4 + 0.6= 4.6
8.3 38.18
3 4 0.000103 15 13
3 bends @ 1.0 = 3.01 plug valve = 1.0
Total = 4.0T.E.L = 4.0 x 0.2
= 0.8 m
13 + 0.8= 13.8
1.3 17.94
4 25 0.00065 22 5
2 bends @ 1.0 = 2.01 plug valve = 1.0T.E.L. = x leT.E.L = 3.0 x 0.5
= 1.5 m
5 + 1.5= 6.5
3.0 19.5
5 12 0.00031 15 4
1 plug valve = 1.0T.E.L. = x leT.E.L = 1.0 x 0.4
= 0.4 m
4 + 0.4= 4.4
4.0 17.6
Gas pipe sizes and pressure drops can now be put on the drawing.
25 kW boiler
Cooker with hob.(12 kW)
4 kW gas fire
Section 1(28mm)20.31 Pa p.d.
Section 2 (15mm)38.18 Pa p.d.
Section 3(15mm)17.94 Pa p.d.
Section 4(22mm)19.50 Pa p.d.
Section 5(15mm)17.60 Pa p.d.
Gas Meter
Example 1 – Gas Pipe System with Sizing Information
The pressure drops as shown in the following Table:
Sections Pressure drop(Pa)
Pressure drop (Pa)
1,4 20.31 + 19.50 39.81
1,2,5 20.31 + 38.18 + 17.60 76.09
1,2,3 20.31 + 38.18 + 17.94 76.43
The maximum pressure drop is in sections 1, 2 and 3 and amounts to 76.43 Pa.This is less than the recommended maximum of 100 Pa; therefore the pipe sizes are appropriate.If the pressure drop in sections 1, 2 and 3 and was too high then the pipe size in section 2 could have been increased to 22mm, and a second calculation of pressure drop carried out.
Gas Pipe Sizing - Table - Page 1 2 3 4
GAS GROSS CALORIFIC VALUE(MJ/m3)
Natural gas 41.6
L.P.G. ( Commercial propane) 96
Gas Pipe Sizing Table
SectionRef.
1Heat
Outputin
sectionkW
2Flow ratem3/s
3Pipe Sizemm dia
4Length of pipe
m
5Total
Equivalent length of Fittings
m
6Total Pipe
LengthCol. 4+5m
7Pressure
drop per
metrePa/m
8TOTAL
PRESSURE DROP
Col. 6 x 7Pa
9Pressure at start
of section
Pa
10Pressure
at endof
sectionPa
Gas Pipe Sizing - Table - Page 1 2 3 4
Non-pressurised Cold Water Pipe Sizing
The method is similar to L.T.H.W. pipe sizing except that the pressure available is not from a pump but from the head available from the tank. The higher the tank is above the outlets the more head will be available to force the water through the outlets and overcome pipework resistances.
Head Available
The Head Available develops water pressure and this water pressure is used up in overcoming the frictional resistance of the pipe and in creating the velocity pressure for water flow at the outlet.
h1 - h2 = head loss in pipe due to friction + velocity head
where p = pressure (N/m2)h = head (m)
Cold Water Storage Tank
Outlet
Head Available
Water flow in pipe
Water level in tank
In practice, to avoid additional velocity pressure calculations, it is usual to calculate the available pressure by considering the difference in levels between the bottom of the storage tank and the height of the draw-off points.
The pressure losses in the system are frictional pipe losses and velocity pressure loss through sanitary fittings such as taps, cistern ball valves and shower heads.
Velocity head loss through fittings is as follows :-Pillar tap 1mShower head 1.5mBall valve 1m
Water Flow Rates
Cold water flow rates for sanitary appliances for small installations may be found from the table below.
Approximate hot or cold water demand Flow rate (l/s)
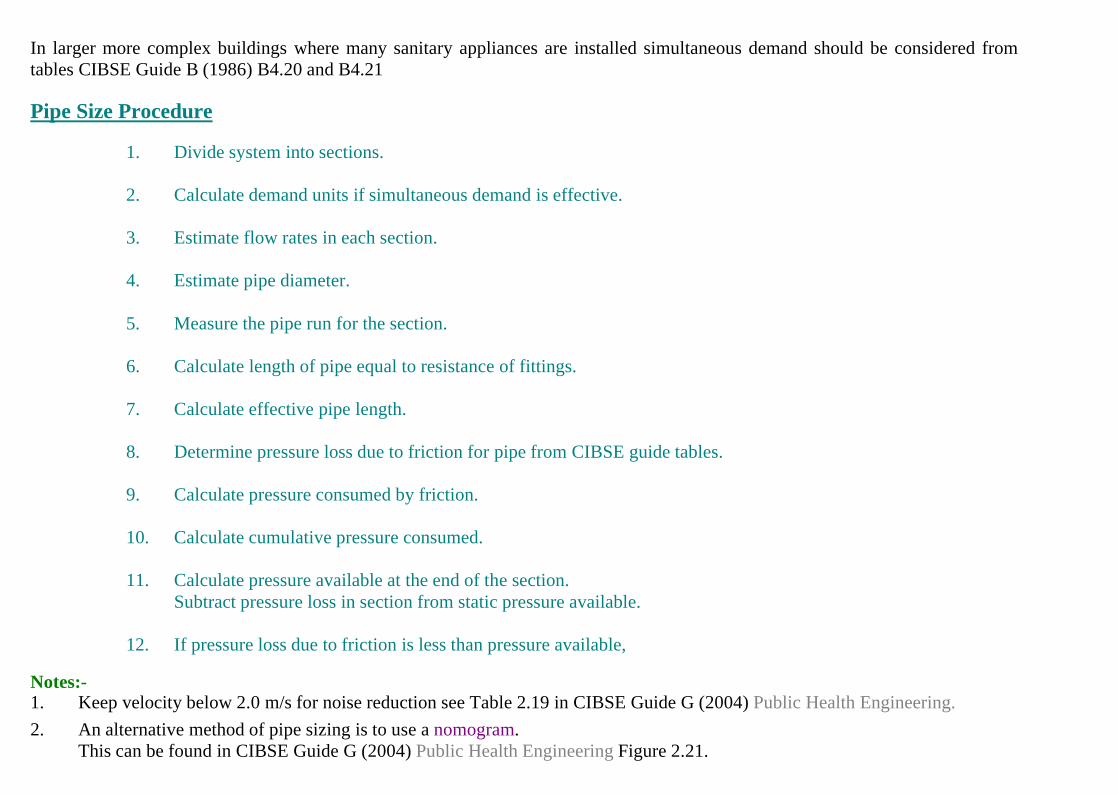
In larger more complex buildings where many sanitary appliances are installed simultaneous demand should be considered from tables CIBSE Guide B (1986) B4.20 and B4.21
Pipe Size Procedure
1. Divide system into sections.
2. Calculate demand units if simultaneous demand is effective.
3. Estimate flow rates in each section.
4. Estimate pipe diameter.
5. Measure the pipe run for the section.
6. Calculate length of pipe equal to resistance of fittings.
7. Calculate effective pipe length.
8. Determine pressure loss due to friction for pipe from CIBSE guide tables.
9. Calculate pressure consumed by friction.
10. Calculate cumulative pressure consumed.
11. Calculate pressure available at the end of the section.Subtract pressure loss in section from static pressure available.
12. If pressure loss due to friction is less than pressure available,
Notes:-1. Keep velocity below 2.0 m/s for noise reduction see Table 2.19 in CIBSE Guide G (2004) Public Health Engineering.2. An alternative method of pipe sizing is to use a nomogram.
This can be found in CIBSE Guide G (2004) Public Health Engineering Figure 2.21.
Example 1
Determine a suitable pipe size for the system shown below.DATAFittings include the following; exit from tank or large vessel, 3No. bends, 1No. gate valve, 1No. 15mm tap, Length of pipe run is 8 metres and copper pipe is to be used.The flow rate for a 15mm Sink Tap from above Table is 0.2 l/s.
The pressure available to force the water through the pipework and tap comes from the head of water above the tap.The formula below gives the relationship between pressure and head.
P = x g x hWhere;P = pressure (N/m2) = density (1000 kg/m3 for water)g = acceleration due to gravity (9.81 m/s2)h = head (m)
Therefore: P = 1000 x 9.81 x 2.0 = 19,620 N/m2
The resistance to flow is from the fittings and pipework.
Cold Water Storage Tank
15mm Sink Tap
2 metres head
Example 2
Determine suitable pipe sizes for the system shown below.The building is a three-storey Nursing Home.DATACopper pipe is to be used.Flow rates are to be obtained from above Table.
Cold Water Storage Tank
3 m
Bath (Private)
3 m
Bath (Private)
Bath (Private)
3 m
5 m
3 m
3 m
3 m
3 m
3 m
4 m
B
A
C
D
E
Answer:
From above Table the flow rate for a private bath is 0.3 l/s.The pipe sizes, flow rates and pressures are indicated on the drawing below.
HOT AND COLD WATER PIPE SIZING TABLE
1 2 3 4 5 6 7 8 9 10 11 12
Ref Demand
Units if require
d
Flow
Rate
(l/s)
Estimated
Pipe Dia.
(mm)
MeasuredPipe Run
(m)
Length ofPipe Equal to Resistance’s
(m)
EffectivePipe
LengthCol . 5 + 6
(m)
Pipe Pressure Loss (Pa/m)
PressureConsumedCol. 7 x 8
(Pa)
TotalPressureConsume
d(Pa)
PressureAvailable at End of
Section(Pa)
Final PipeSize
(mm)
A 0.9 28 8.0 Factors for fittings:1No.Exit large vessel = 0.41No.Gate Valve = 0.31 No. Bend = 1.01 No.28 x 28 x 22 tee = 0.2
Static pressure = 9 m x 9810 = 88,290Press. Available = 88,290 – 56,563 = 31,727 Pa
15
Cold Water Storage Tank
Bath
Bath
Bath
B
A
C
D
E
28mm0.9 l/s
28mm0.6 l/s
15mm0.3 l/s
22mm0.3 l/s
22mm0.3 l/s
16,817 Pa
44,177 Pa
12,754 Pa
40,114 Pa
31,727 Pa
Example 3
Determine suitable pipe sizes for the system shown below.The building is a three-storey hotel.DATACopper pipe is to be used.Flow rates and simultaneous demand data are to be obtained from the CIBSE guide.
Cold Water Storage Tank
5 m
WCWHBBath
7 m2 m 7 m 2 m
1 m
WC WHB Bath
WHBBath
1 m
WC WHB Bath
WHBBathWC WHB Bath
3 m
3 m
3 m
7 m
Hot and Cold Water Pipe Sizing Table
1 2 3 4 5 6 7 8 9 10 11 12
Ref Demand
Units if require
d
FlowRate
(l/s)
Estimated
Pipe Dia.
(mm)
Measured
Pipe Run
(m)
Length ofPipe
Equal to
Resistance’s
(m)
Effective
Pipe Length
Col . 5 + 6
(m)
Pipe Pressu
re Loss
(Pa/m)
Pressure
Consumed
Col. 7 x 8
(Pa)
TotalPressu
reConsumed(Pa)
PressureAvailable at End of Section
(Pa)
Final PipeSize
(mm)
Mains Water Pipe Sizing
Pipe Sizing Procedure1. Reference the pipe section.
2. Calculate flow rates from Table below.
3. Estimate flow rates in each section. Keep velocity below 2 m/s. See also CIBSE Guide G
(2003) part 2, Table 2.19.
4. Estimate pipe diameter from pipe sizing tables in CIBSE Guide C.
5. Measure the pipe run from drawings.
6. Calculate length of pipe equal to resistance of fittings. The Total equivalent length of a fitting = Equivalent
Length x Pressure Loss factor (Zeta).
7. Calculate effective pipe length.
8. Determine pressure loss due to friction from CIBSE Tables.
9. Calculate pressure consumed due to friction (Pa) =effective pipe length (m) x pressure loss due to friction (Pa/m)
10. Calculate total pressure consumed = Friction loss + Static pressure loss
11. Determine pressure at start of section.
12. Calculate pressure available at end of section =Pressure at start of section - Total pressure consumed
If pressure available at end of section is less than the maximum allowable pressure drop then we can accept this pipe size.
13. Determine pressure required at end of section, this can be the minimum pressure that is required for terminal equipment.
14. If the pressure available at the end of the section is more than or equal to the pressure required at the end of the section then the pipe size is correct.
Water Flow Rates
Cold water flow rates for sanitary appliances for small installations may be found from the table below.
Approximate hot or cold water demand Flow rate (l/s)
In larger more complex buildings where many sanitary appliances are installed simultaneous demand should be considered from tables CIBSE Guide B (1986) B4.20 and B4.21.
Notes:-An alternative method of pipe sizing is to use a nomogram.This can be found in CIBSE Guide G (2004) Public Health EngineeringFigure 2.21.
Pipe Sizing table
Pressurised Cold Water Pipe Sizing Table
1 2 3 4 5 6 7 8 9 10 11 12 13 14
Ref DemandUnits if
required
FlowRate
(l/s)
EstimatedPipe Dia.
(mm)
MeasuredPipe Run
(m)
Length ofPipe Equal to Fittings
Resistance’s(m)
EffectivePipe
LengthCol . 5 +
6(m)
Pipe Pressure
Loss (Pa/m)
From CIBSE Tables
PressureConsumed
due to Friction
Col. 7 x 8(Pa)
Friction loss + Static
pressure loss = Total
PressureConsumed
(Pa)
Pressure at Start
of Section
(Pa)
PressureAvailable at End of Section
(Pa)
Pressure Required at End of Section
(Pa)
Final PipeSize
(mm)
Example 1
Calculate an appropriate pipe size for the system shown above.Use Copper Table X pipework for water at 10oC..
Answer
The maximum allowable pressure drop along the length of pipe = 300,000 Pa – 250,000 Pa = 50,000 Pa
Pressurised Cold Water Pipe Sizing Table
1 2 3 4 5 6 7 8 9 10 11 12 13 14
Ref DemandUnits if
required
FlowRate
(l/s)
EstimatedPipe Dia.
(mm)
MeasuredPipe Run
(m)
Length ofPipe
Equal to
Fittings
Resistance’
s(m)
EffectivePipe
LengthCol . 5 +
6(m)
Pipe Pressure
Loss (Pa/m)
From CIBSE Tables
PressureConsumed
due to Friction
Col. 7 x 8(Pa)
Friction loss
+ Static pressure loss
= Total
Pressure
Consumed(Pa)
Pressure at Start
of Section
(Pa)
Pressure
Available at End of
Section
(Pa)
Pressur
e Required at End of
Section
(Pa)
Final PipeSize
(mm)
A none 0.8 22 50 none 50 3500 175,000 175,000
300,000 125,000
250,000
Too smal
l
A none 0.8 28 50 none 50 1000 50,000 50,000
300,000 250,000
250,000
28
Pressurised Cold Water Pipe Sizing Table
1 2 3 4 5 6 7 8 9 10 11 12 13 14
Pipe Sizing Procedure
1. Reference the pipe section - section A.
2. Calculate demand units or loading units from Tables in CIBSE guide (attached). – not required, see No.3 below.
3. Estimate flow rates in each section. Keep velocity below 2 m/s. -given
4. Estimate pipe diameter from pipe sizing tables in CIBSE Guide C. – 22mm (velocity too high at approx 2.4 m/s) or 28mm (velocity is 1.5 m/s).
5. Measure the pipe run from drawings. – 50m
6. Calculate length of pipe equal to resistance of fittings. – no fittings
7. Calculate effective pipe length. - 50m
8. Determine pressure loss due to friction from CIBSE Tables. See Table 4.18 in Guide C (CD version).
9. Calculate pressure consumed due to friction (Pa) = effective pipe length (m) x pressure loss due to friction (Pa/m). Column 7 x 8 in Pipe Sizing Table.
10. Calculate total pressure consumed = Friction loss + Static pressure loss. There are no vertical pipe sections and therefore no static pressure loss.
11. Determine pressure at start of section. Given in drawing as 300,000 Pa.
12. Calculate pressure available at end of section = Pressure at start of section - Total pressure consumed.
If pressure available at end of section is less than the maximum allowable pressure drop then we can accept this pipe size.
13. Determine pressure required at end of section, this can be the minimum pressure that is required for terminal equipment. Given in drawing as 250,000 Pa.
14. If the pressure available at the end of the section is more than or equal to the pressure required at the end of the section then the pipe size is correct.
28mm pipe is correct, 22mm is too small since there is not enough pressure available at the end of the section and the water velocity is also too high.
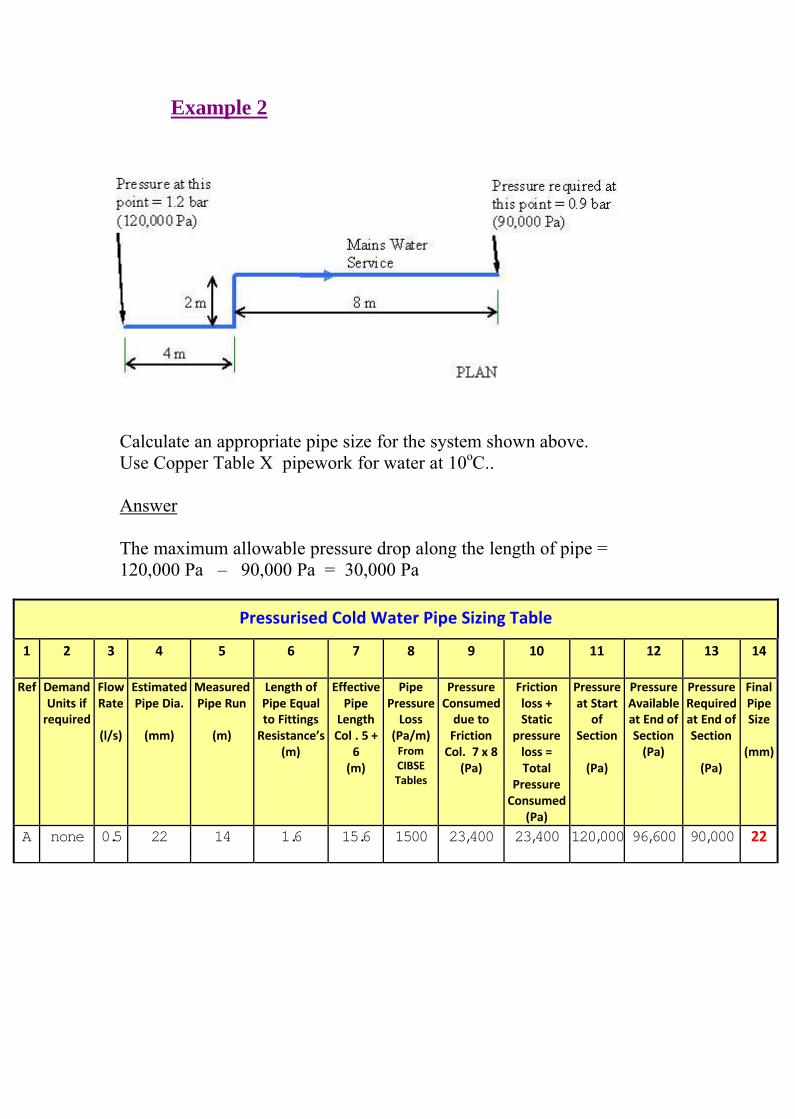
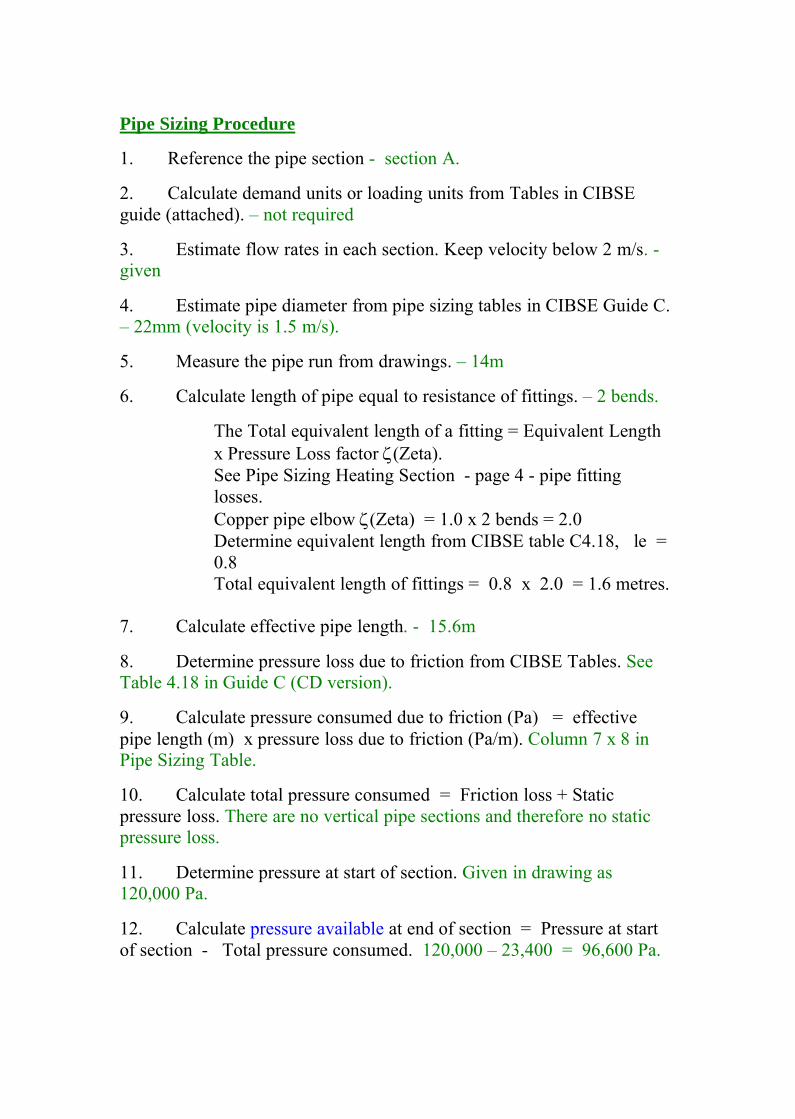
Example 2
Calculate an appropriate pipe size for the system shown above.Use Copper Table X pipework for water at 10oC..
Answer
The maximum allowable pressure drop along the length of pipe = 120,000 Pa – 90,000 Pa = 30,000 Pa
2. Calculate demand units or loading units from Tables in CIBSE guide (attached). – not required
3. Estimate flow rates in each section. Keep velocity below 2 m/s. -given
4. Estimate pipe diameter from pipe sizing tables in CIBSE Guide C. – 22mm (velocity is 1.5 m/s).
5. Measure the pipe run from drawings. – 14m
6. Calculate length of pipe equal to resistance of fittings. – 2 bends.
The Total equivalent length of a fitting = Equivalent Length x Pressure Loss factor (Zeta).See Pipe Sizing Heating Section - page 4 - pipe fitting losses.Copper pipe elbow (Zeta) = 1.0 x 2 bends = 2.0Determine equivalent length from CIBSE table C4.18, le = 0.8Total equivalent length of fittings = 0.8 x 2.0 = 1.6 metres.
7. Calculate effective pipe length. - 15.6m
8. Determine pressure loss due to friction from CIBSE Tables. See Table 4.18 in Guide C (CD version).
9. Calculate pressure consumed due to friction (Pa) = effective pipe length (m) x pressure loss due to friction (Pa/m). Column 7 x 8 in Pipe Sizing Table.
10. Calculate total pressure consumed = Friction loss + Static pressure loss. There are no vertical pipe sections and therefore no static pressure loss.
11. Determine pressure at start of section. Given in drawing as 120,000 Pa.
12. Calculate pressure available at end of section = Pressure at start of section - Total pressure consumed. 120,000 – 23,400 = 96,600 Pa.
If pressure available at end of section is less than the maximum allowable pressure drop then we can accept this pipe size.
13. Determine pressure required at end of section, this can be the minimum pressure that is required for terminal equipment. Given in drawing as 90,000Pa.
14. If the pressure available at the end of the section is more than or equal to the pressure required at the end of the section then the pipe size is correct.