80
PIPED GAS DISTRIBUTION INDUSTRY STATISTICS 2016
PIPED GASDISTRIBUTIONINDUSTRYSTATISTICS 2016


The data and information contained in this yearly publication is prepared and provided for general information purposes only. While the Energy Commission made reasonable efforts to ensure that the information contained in this publication is accurate, the Energy Commission shall not have any liability (whether arising from negligence, negligent misstatement, or otherwise) for any statements, opinions, information or matter (expressed or implied) arising out of, contained in or derived from, or for any omissions from, the information in this publication, or in respect of a person’s use of the information (including any reliance on its currency, accuracy, reliability or completeness) contained in this publication.
© All rights reserved. Reproduction of all or any part of this publication via electronic mechanical, recording or other medium is strictly prohibited without written consent from the Energy Commission.
Published by:
SURUHANJAYA TENAGA (ENERGY COMMISSION)No. 12, Jalan Tun Hussein, Precinct 2, 62100 Putrajaya, Malaysia.T : 03 8870 8500F : 03 8888 8637Toll Free : 1-800-222-78 (ST)
ISSN No. : 2289-5094ST Publication No. : ST(P) 08/07/2018

PIPED GAS DISTRIBUTION INDUSTRY STATISTICS 2016
4
CONTENTS
01 BACKGROUNDGas Supply Act 1993Functions of the Energy Commission Under Act 501Gas SpecificationsGas Distribution System
CHAPTER
070808
0911
02PIPED GAS SUPPLY AND CONSUMPTIONNatural Gas Supply in the Peninsula and SabahLiquefied Petroleum Gas (LPG) Supply in the Peninsula
CHAPTER
17
18
23
03SUPPLY RELIABILITY AND SERVICE QUALITYGas Malaysia Berhad (GMB) Performance IndicatorsComplaints and Inquiries Received by GMB Gas Malaysia Berhad (GMB) Client’s Charter PerformanceSabah Energy Corporation (SEC) Client’s Charter Performance
CHAPTER
25
26
28
29
32
04NATURAL GAS TARIFF AND LPG PRICESNatural Gas Prices To Gas Utility Licensee In The PeninsulaNatural Gas Tariff By Category In The PeninsulaLiquefied Petroleum Gas (LPG) Prices In The PeninsulaNatural Gas Prices in Sabah and Labuan
CHAPTER
35
36
36
37
37
05FINANCIAL PERFORMANCE OF GAS UTILITY LICENSEE IN THE PENINSULA
CHAPTER
39
06GAS LICENSEESGas Utility Licence (GUL) Private Gas Licence (PGL)
CHAPTER
4142
42

PIPED GAS DISTRIBUTION INDUSTRY STATISTICS 2016
5
CONTENTS
01 BACKGROUNDGas Supply Act 1993Functions of the Energy Commission Under Act 501Gas SpecificationsGas Distribution System
CHAPTER
070808
0911
02PIPED GAS SUPPLY AND CONSUMPTIONNatural Gas Supply in the Peninsula and SabahLiquefied Petroleum Gas (LPG) Supply in the Peninsula
CHAPTER
17
18
23
03SUPPLY RELIABILITY AND SERVICE QUALITYGas Malaysia Berhad (GMB) Performance IndicatorsComplaints and Inquiries Received by GMB Gas Malaysia Berhad (GMB) Client’s Charter PerformanceSabah Energy Corporation (SEC) Client’s Charter Performance
CHAPTER
25
26
28
29
32
04NATURAL GAS TARIFF AND LPG PRICESNatural Gas Prices To Gas Utility Licensee In The PeninsulaNatural Gas Tariff By Category In The PeninsulaLiquefied Petroleum Gas (LPG) Prices In The PeninsulaNatural Gas Prices in Sabah and Labuan
CHAPTER
35
36
36
37
37
05FINANCIAL PERFORMANCE OF GAS UTILITY LICENSEE IN THE PENINSULA
CHAPTER
39
06GAS LICENSEESGas Utility Licence (GUL) Private Gas Licence (PGL)
CHAPTER
4142
42
07GAS RETICULATION SYSTEM APPROVALS Approval to Install (ATI)Approval to Operate (ATO)
CHAPTER
45
4646
08GAS FITTING, GAS APPLIANCE AND GAS EQUIPMENT APPROVALS
CHAPTER
49
09COMPETENCYGas Contractors Gas Competent Persons
CHAPTER
535455
10GAS TRAINING INSTITUTIONS
CHAPTER
57
11GAS SAFETY AUDITS
CHAPTER
59
12NEW GUIDELINES OR CIRCULARS ISSUED IN 2016
CHAPTER
63
13GAS ACCIDENTS
CHAPTER
65
14GAS UTILITY LICENSEES CONTACT INFORMATION Gas Malaysia BerhadSabah Energy Corporation Sdn. Bhd.
CHAPTER
71
7272
15GAS UTILITY LICENSEES CONTACT INFORMATION HeadquartersRegional Offices
CHAPTER
75
7676


BACKGROUND
1.0

PIPED GAS DISTRIBUTION INDUSTRY STATISTICS 2016
8
GAS SUPPLY ACT 1993 The government introduced the Gas Supply Act 1993 (Act 501) and Gas Supply Regulations 1997 to regulate piped gas supply and utilisation activities. The main objective is to protect the interests of the consumers and the public who are affected by the supply activities whilst at the same time ensuring continued viability of the gas supply businesses. Act 501 prescribes the administrative and technical standards in the aspects of safety, reliability, economy, efficiency and quality.
In Act 501 gas is defined as methane, ethane, propane, butane or hydrocarbons which may consist of one or more of the above gases in the form of gas or liquid. Natural gas is mainly methane with a small percentage of other hydrocarbons and non-hydrocarbon gases whereas Liquefied Petroleum Gas (LPG) comprises of mainly propane and butane. Other types of gases, such as oxygen, nitrogen and acetylene used in the industrial sector are not covered by Act 501.
The act is not applicable throughout the gas supply chain. Its scope covers only the supply of natural gas through pipeline downstream of the last flange of the city gate station or the supply of LPG from the filling point of storage tanks or cylinders to gas appliances. Natural gas transmission and lateral pipeline systems (up to and including the city gate stations) are outside the scope of Act 501. Presently, Act 501 is only applicable in the Peninsula and Sabah.
FUNCTIONS OF THE ENERGY COMMISSION UNDER ACT 501
a) To ensure a licensee satisfies all reasonable demands for gas through pipelines.b) To ensure a licensee could finance the provision of gas supply services.c) To protect the interests of consumers of gas supplied through pipelines in respect of
i. The prices charged and the other terms of supply.ii. The continuity of supply.iii. The quality of the gas supply services provided.
d) To regulate the composition, pressure, purity and volume of gas supplied through pipelines.e) To promote efficiency and economy to supply gas through pipelines and the efficient use
of gas supplied through pipelines.f) To protect the public from dangers arising from the distribution of gas through pipelines or
from the use of gas supplied through pipelines.g) To enable persons to compete effectively in the supply of gas through pipelines.h) To investigate any accident or fire involving any gas pipeline or installation.

PIPED GAS DISTRIBUTION INDUSTRY STATISTICS 2016
9
GAS SPECIFICATIONS
PENINSULAR MALAYSIA
Average composition of natural gas supplied by Gas Malaysia Berhad (GMB) to consumers in the Peninsula:
Gas Composition MT-JDA Gas[Mole (%)]
Kerteh[Mole (%)]
CH4 84.04 94.90
C2H6 4.95 2.24
C3H8 1.62 0.24
iC4H10 0.12 0.05
nC4H10 0.07 0.04
iC5H12+ 0.07 0.01
nC5H12+ 0.03 0.04
C6H14+ 0.03 0.03
CO2 7.48 1.51
N2 1.59 0.85
Table 1: Average Composition of Natural Gas Supplied by GMB
Natural Gas Property MT-JDA Kerteh
Specific Gravity 0.68 0.59
Gross Calorific Value, (kcal/Sm3) 8,862 9,024
Burning Velocity, (m/s) 0.28 0.31
Upper Flammability Limit, (%) 15 15
Lower Flammability Limit, (%) 5 5
Auto-ignition Temperature, (°C) 537 537
Theoretical Air Requirement, (m3/m3) 9.71 9.74
Table 2: Typical Characteristics of Natural Gas Supplied by GMB
PIPED GAS DISTRIBUTION INDUSTRY STATISTICS 2016
10
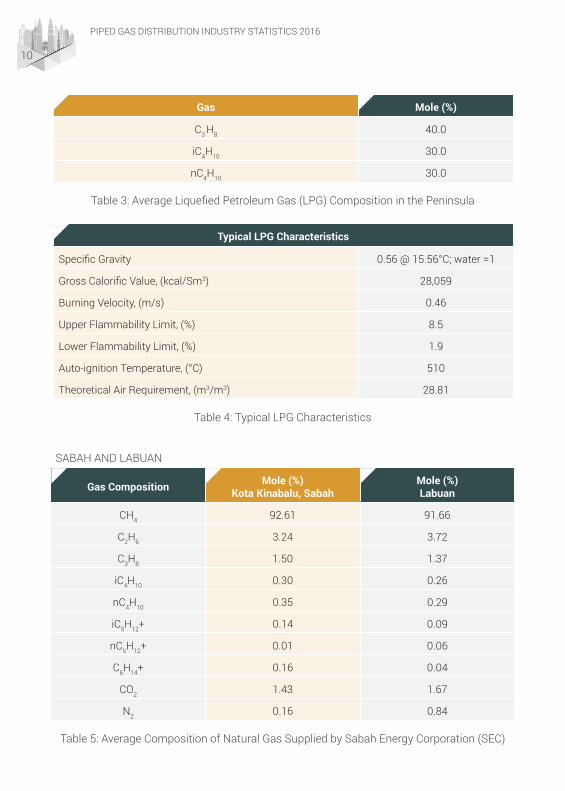
Gas Mole (%)
C3 H8 40.0
iC4H10 30.0
nC4H10 30.0
Table 3: Average Liquefied Petroleum Gas (LPG) Composition in the Peninsula
Typical LPG Characteristics
Specific Gravity 0.56 @ 15.56°C; water =1
Gross Calorific Value, (kcal/Sm3) 28,059
Burning Velocity, (m/s) 0.46
Upper Flammability Limit, (%) 8.5
Lower Flammability Limit, (%) 1.9
Auto-ignition Temperature, (°C) 510
Theoretical Air Requirement, (m3/m3) 28.81
Table 4: Typical LPG Characteristics
SABAH AND LABUAN
Gas Composition Mole (%)Kota Kinabalu, Sabah
Mole (%)Labuan
CH4 92.61 91.66
C2H6 3.24 3.72
C3H8 1.50 1.37
iC4H10 0.30 0.26
nC4H10 0.35 0.29
iC5H12+ 0.14 0.09
nC5H12+ 0.01 0.06
C6H14+ 0.16 0.04
CO2 1.43 1.67
N2 0.16 0.84
Table 5: Average Composition of Natural Gas Supplied by Sabah Energy Corporation (SEC)
PIPED GAS DISTRIBUTION INDUSTRY STATISTICS 2016
11
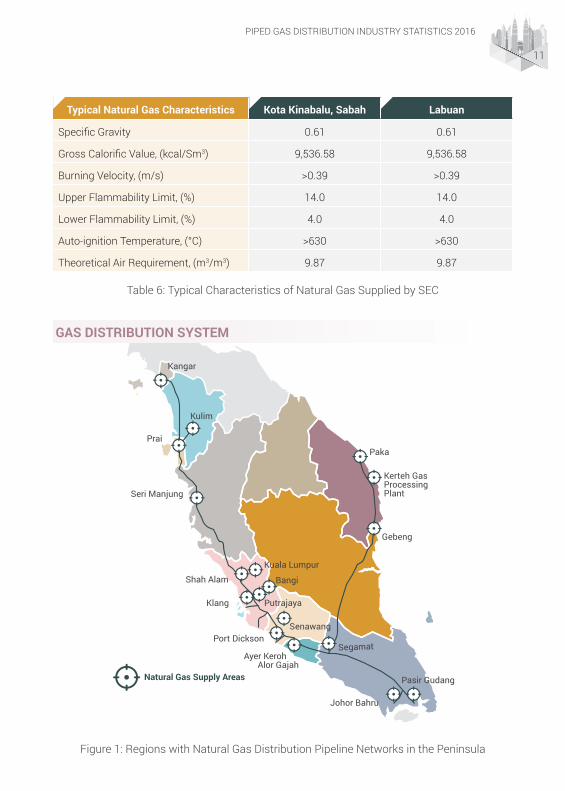
Natural Gas Supply Areas
Kangar
Kulim
Prai
Seri Manjung
Shah Alam
Klang
Kuala Lumpur
Bangi
Putrajaya
Senawang
Segamat
Pasir Gudang
Gebeng
Kerteh Gas Processing Plant
Paka
Johor Bahru
Port Dickson
Ayer KerohAlor Gajah
Typical Natural Gas Characteristics Kota Kinabalu, Sabah Labuan
Specific Gravity 0.61 0.61
Gross Calorific Value, (kcal/Sm3) 9,536.58 9,536.58
Burning Velocity, (m/s) >0.39 >0.39
Upper Flammability Limit, (%) 14.0 14.0
Lower Flammability Limit, (%) 4.0 4.0
Auto-ignition Temperature, (°C) >630 >630
Theoretical Air Requirement, (m3/m3) 9.87 9.87
Table 6: Typical Characteristics of Natural Gas Supplied by SEC
GAS DISTRIBUTION SYSTEM
Figure 1: Regions with Natural Gas Distribution Pipeline Networks in the Peninsula

PIPED GAS DISTRIBUTION INDUSTRY STATISTICS 2016
12
Type of Gas
Region
North Central South East
Natural Gas
Kamunting,Kulim, Parit Buntar,NibongTebal, Prai, Kangar, Seri Manjung, Sungai Petani, Setiawan,Lumut, Tronoh,Padang Terap, Chuping
Kuala Lumpur, Petaling Jaya, Batu Caves, Selayang, Shah Alam, Klang, KLIA, Sepang, Salak Tinggi, Puchong, Banting, Nilai, Balakong, Sungai Buloh, Bangi, Dengkil, Kajang, Cheras, Teluk Panglima Garang, Beranang, Bestari Jaya, Jeram, North Port, Bandar Sultan Sulaiman, Pandamaran, Ijok, Seri Kembangan, Semenyih, Kundang, Rawang, West Port, Port Klang, Bangi, Meru, Subang Jaya, Kapar, Putrajaya, Cyberjaya, Damansara and Subang Jaya
Pasir Gudang,Tanjung Langsat,Tebrau, Tampoi,Larkin, Plentong,Senai, KulaiAir Hitam, Kluang,Senawang, Cheng, Seremban, Alor Gajah,Ayer Keroh, Lipat Kajang,Cheng, TanggaBatu,Batu Berendam,Bukit Rambai, Seremban 2, Sendayan, Masai, Pegoh and Yong Peng
Gebeng,Teluk Kalong,Kemaman,Kerteh and Kuantan Port
LPG
Kangar, Sungai Dua, Bukit Mertajam, Tanjung Tokong, Prai,Ipoh, Setiawan, Teluk Intan, Taiping, Kampar, Alor Setar, Kulim, Jitra, Sungai Petani
Kuala Lumpur, Ampang, Selayang, Kepong, Cheras,Batu Caves, Mont Kiara, Setapak, Shah Alam, Klang, Puchong, Kajang, Semenyih, Kuala Selangor, Banting, Puncak Alam, Jenjarom, Seri Kembangan, Rawang, Bandar Baru Bangi, Subang Jaya, Sepang, Damansara, Petaling Jaya
Johor Bahru, Plentong, Tampoi, Masai, Skudai, Tebrau, Kulai, Nusa Bestari, Bukit Indah, Nusajaya, Iskandar Puteri, Bandaraya Melaka, Peringgit, Alor Gajah, Seremban, Senawang, Nilai, Bahau, Lukut, Kuala Pilah
Kuantan
Table 7: Areas with Natural Gas and LPG Supply in the Peninsula by GMB

PIPED GAS DISTRIBUTION INDUSTRY STATISTICS 2016
13
Natural Gas Supply Areas
SULU SEA
Kota KinabaluKinabaluPark
Mt. Kinabalu(4,095.2 m)
Labuan
BRUNEISABAH
SARAWAK
SOUTH CHINA
SEA
Figure 2: Areas with Natural Gas Supply in Sabah and Labuan
Areas with natural gas supply in Sabah and Labuan are limited to the Kota Kinabalu Industrial Park (KKIP) and Labuan as shown in Figure 2.

PIPED GAS DISTRIBUTION INDUSTRY STATISTICS 2016
14Fi
gure
3: T
ypic
al N
atur
al G
as D
istr
ibut
ion
Syst
em
Sing
leDe
velo
pmen
t
Transmission Pipeline
Area
Stat
ion
Serv
ice
Stat
ion
City
Ga
te
The
Last
Flan
ge o
fCi
ty G
ate
Stat
ion
Stat
ion
Dist
ribut
ion
Line
(35-
50 p
sig)
Feed
er L
ine
(150
-260
psi
g)
Serv
ice
Stat
ion
Regu
latin
gSt
atio
n
4.3
psig
4.3
psig
0.43
psi
g
> 20
psi
g
Industry Residential Commercial
Odor
iser
Stat
ion
Serv
ice
Stat
ion
> 20
psi
g
MMM
M M M M
M
Dist
rict
Stat
ion
= Ga
s Met
er
Gas S
uppl
y Act
199
3
Note
: Indu
stria
l inst
allat
ions a
re n
ot co
vere
d by
Gas
Sup
ply A
ct 1
993

PIPED GAS DISTRIBUTION INDUSTRY STATISTICS 2016
15
Figu
re 4
: Typ
ical
LPG
Dis
trib
utio
n Sy
stem
Man
ifold
edCy
linde
rs
80-100 psig
Bulk
Tan
kSy
stem
Inte
rnal
Pip
ing
Com
mer
cial
Resi
dent
ial
Inte
rnal
Pip
ing
M=
Gas
Met
erR
1Fi
rst S
tage
Reg
ulat
orR
2Se
cond
Sta
ge R
egul
ator
MR
2
M
R1

Figu
re 5
: Nat
ural
Gas
Pip
ing
Syst
em fo
r Sup
ply
to R
esid
entia
l Use
rs
Priv
ate
Road
or or
LPG
Sto
re
Nat
ural
Gas
Stat
ion
Building / Property Boundary
Building / Property Boundary
Bulk
Tan
k
Man
ifold
Cyl
inde
rs
Isol
atio
n Va
lve
LPG
St
ore
/ N
atur
al
Gas
St
atio
n
Gas
pip
e fr
om
met
er o
utle
t of
indi
vidu
al u
nit
appl
ianc
esG
as P
ipe
from
sta
tion
or s
tora
ge o
utle
t con
nect
ion
flang
e up
-to is
olat
ion
valv
e
Resp
onsi
bilit
y of
the
Gas
Util
ity L
icen
ce
Resp
onsi
bilit
y of
the
Join
t Man
agem
ent B
ody
or L
ocal
Aut
horit
y
Resp
onsi
bilit
y of
the
Ow
ner o
r Res
iden
t

PIPED GAS SUPPLY AND CONSUMPTION
2.0

PIPED GAS DISTRIBUTION INDUSTRY STATISTICS 2016
18
NATURAL GAS SUPPLY IN THE PENINSULA AND SABAH
Figure 6: Total Natural Gas Consumption in the Peninsula
Figure 7: Average Monthly Natural Gas Consumption According to Region in the Peninsula
2012
127,
380,
253
Gas
Con
sum
ptio
n (M
MBt
u)
2013
138,
244,
288
2014
Year
147,
342,
490
2015
158,
770,
535
2016
163,
483,
304
North Central East South
Region
0
1,000,000
2,000,000
3,000,000
4,000,000
5,000,000
6,000,000
7,000,000
2,99
7,19
4
3,13
3,43
0
953,
653
6,53
9,33
2
Gas
Co
nsu
mp
tio
n (
MM
Btu
)

PIPED GAS DISTRIBUTION INDUSTRY STATISTICS 2016
19
Figure 8: Natural Gas Consumption in Sabah and Labuan
Region
North Central East South
Average Monthly NG Usage Rate (MMBtu/month)
2,997,194 6,539,332 953,653 3,133,430
Number of City Gate Stations 11 10 5 11
Number of Industrial Customers 142 416 43 218
Number of Commercial Customers 0 933 1 1
Number of Residential Customers 0 12,339 0 0
Table 8: Natural Gas Stations in the Peninsula
2012 2013 2014 2015 2016
74,6
84 93,5
82
233,
723
294,
387
284,
156
Gas
Con
sum
ptio
n (M
MBt
u)
Year

PIPED GAS DISTRIBUTION INDUSTRY STATISTICS 2016
20
2.0 PIPED GAS SUPPLY AND CONSUMPTION
Figure 9: Natural Gas Consumption by User Category in the Peninsula in 2016
Figure 10: Natural Gas Consumption by Industry Sub-sectors in the Peninsula in 2016
Gas
Con
sum
ptio
n (M
MBt
u)
Category
Industry Commercial Residential
162,451,003 MMBtu 1,007,563 MMBtu 24,738 MMBtu
2016
Gas
Co
nsu
mp
tio
n (
MM
Btu
)
Non-Metallic Industry
Basic Metal Industry
Electrical & Electronic
Machinery & Equipment
Rubber products
Food, Beverages & Tobacco
Fabricated Metal Products
Chemical Products
Glass Products
Others10,8
45,6
67
10,8
56,2
12
14,3
25,0
25
12,2
70,1
25
3,74
2,36
9
16,6
09,1
84
18,9
96,9
52
32,8
17,1
74
31,2
58,1
84
10,7
30,1
11
0
5,000,000
10,000,000
15,000,000
20,000,000
25,000,000
30,000,000
35,000,000
PIPED GAS DISTRIBUTION INDUSTRY STATISTICS 2016
21
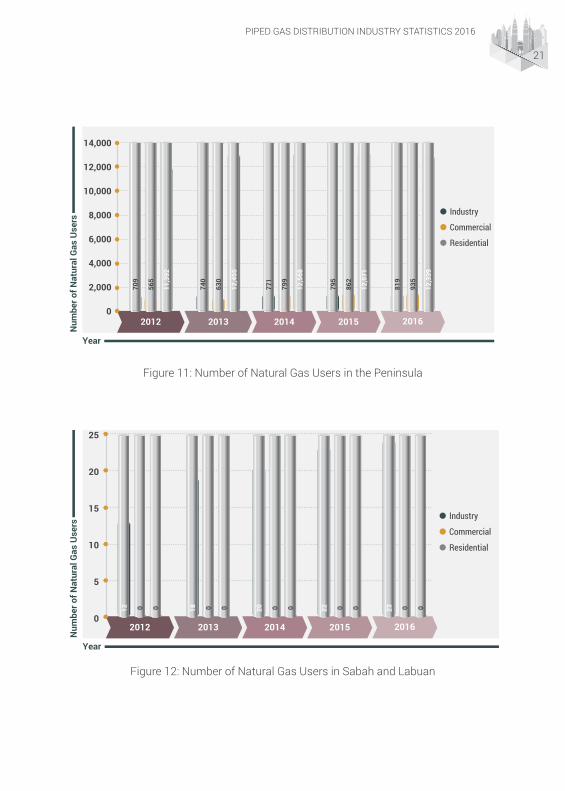
Figure 11: Number of Natural Gas Users in the Peninsula
Figure 12: Number of Natural Gas Users in Sabah and Labuan
Num
ber o
f Nat
ural
Gas
Use
rs
Year
2012 2013 2014 2015 2016
Industry
Commercial
Residential
0
5
10
15
20
25
12 0 0 18 0 0 20 0 0 22 0 0 23 0 0
Num
ber o
f Nat
ural
Gas
Use
rs
Year
2012 2013 2014 2015 2016
Industry
Commercial
Residential
0
2,000
4,000
6,000
8,000
10,000
12,000
14,00070
9
565
11,3
92
740
630
12,4
55
771
799
12,5
68
795
862
12,5
71
819
935
12,3
39

PIPED GAS DISTRIBUTION INDUSTRY STATISTICS 2016
22
2.0 PIPED GAS SUPPLY AND CONSUMPTION
Figure 13: Length of Natural Gas Pipelines in Operation in the Peninsula
Figure 14: Length of Natural Gas Pipelines in Operation in Sabah
2012
Leng
th o
f Pip
elin
es (m
eter
)
2013 2014
Year
2015 2016
Steel
Polyethylene
Total
1,300 1,300 1,300 1,300 1,300
6,718 6,718 6,718 6,718 6,718
8,018 8,018 8,018 8,081 8,081
0
1,000
2,000
3,000
4,000
5,000
6,000
7,000
8,000
9,000
2012
Leng
th o
f Pip
elin
es (k
m)
2013 2014
Year
2015 2016
Steel
Polyethylene
Total
1,262 1,3301,430 1473 1,543
556 558 564 567 571
1,818 1,8891,993 2,040 2,114
0
500
1,000
1,500
2,000
2,500

PIPED GAS DISTRIBUTION INDUSTRY STATISTICS 2016
23
LIQUEFIED PETROLEUM GAS (LPG) SUPPLY IN THE PENINSULA
Figure 15: LPG Consumption in the Peninsula
Figure 16: LPG Consumption in the Peninsula by Sector
Gas
Con
sum
ptio
n (M
MBt
u) S
uppl
ied
by G
MB
Year
2012 2013 2014 2015 2016
Industry
Commercial
Residential
0
50,000
100,000
150,000
200,000
250,000
510
205,
912
54,0
09
275
219,
067
59,2
82
0
223,
027
55,2
97
0
247,
855
51,0
42
0
240,
649
49,0
98
Gas
Con
sum
ptio
n (M
MBt
u) S
uppl
ied
by G
MB
Year
2012 2013 2014 2015 2016240,000
250,000
260,000
270,000
280,000
290,000
300,000
260,
431
278,
624
298,
897
278,
324
289,
747

PIPED GAS DISTRIBUTION INDUSTRY STATISTICS 2016
24
2.0 PIPED GAS SUPPLY AND CONSUMPTION
Figure 17: Number of LPG Users in the Peninsula
Figure 18: Length of LPG Piping System in the Peninsula
2012
LPG
Pip
elin
e Le
ngth
(km
) Ope
rate
d by
GM
B
2013 2014
Year
2015 2016
Steel
Polyethylene
Total
0.29 0.29 0.29 0.29 0.29
71.62 71.62 71.62 71.62 71.62
71.91 71.91 71.91 71.91 71.91
0
10
20
30
40
50
60
70
80
Num
ber o
f LPG
Use
rs, S
uppl
ied
by G
MB
Year
2012 2013 2014 2015 2016
Industry
Commercial
Residential
0 0 00 01,17
0
21,0
58
1,20
4
22,4
80
1,19
5
22,9
85
1,28
7
23,1
75
1,32
5
22,9
59
0
5,000
10,000
15,000
20,000
25,000

SUPPLY RELIABILITY AND SERVICE QUALITY
3.0

PIPED GAS DISTRIBUTION INDUSTRY STATISTICS 2016
26
GAS MALAYSIA BERHAD (GMB) PERFORMANCE INDICATORS
Figure 19: GMB’S System Average Interruption Duration Index (SAIDI)
Figure 20: GMB’S System Average Interruption Frequency Index (SAIFI)
*Note*SAIDI and SAIFI lower readings indicate better performance.
0.0000
0.0005
0.0010
0.0015
0.0020
0.0025
0.0030
SAIF
I (Di
srup
tion/
Cust
omer
/Yea
r)
Year
2012 2013 2014 2015 2016
0.00
29
0.00
22
0.00
21
0.00
10
0.00
16
SAID
I (M
inut
es/C
usto
mer
/Yea
r)
Year
2012 2013 2014 2015 2016
0.74
89
0.14
80
0.14
92
0.58
12
0.08
74
0.0000
0.1000
0.2000
0.3000
0.4000
0.5000
0.6000
0.7000
0.8000
PIPED GAS DISTRIBUTION INDUSTRY STATISTICS 2016
27
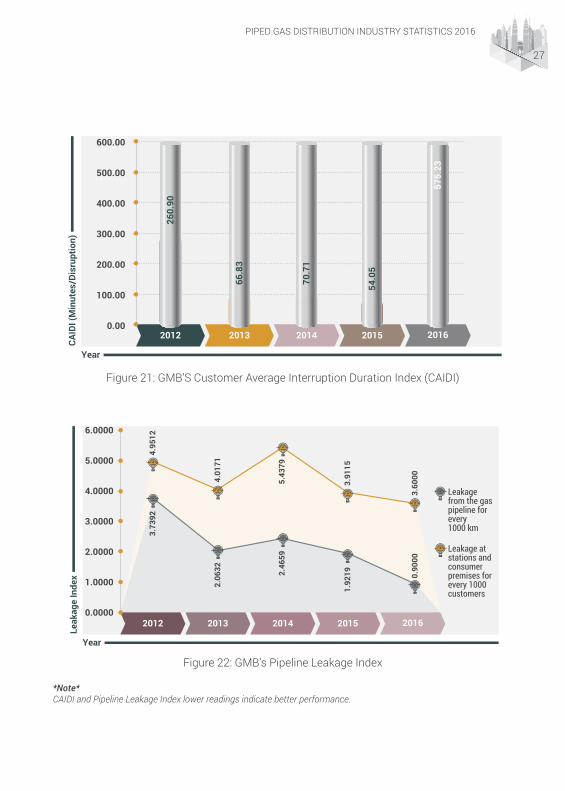
Figure 21: GMB’S Customer Average Interruption Duration Index (CAIDI)
Figure 22: GMB’s Pipeline Leakage Index
*Note*CAIDI and Pipeline Leakage Index lower readings indicate better performance.
0.00
100.00
200.00
300.00
400.00
500.00
600.00
CAID
I (M
inut
es/D
isru
ptio
n)
Year
2012 2013 2014 2015 2016
66.8
3
260.
90
70.7
1
575.
23
54.0
5
2012
Leak
age
Inde
x
2013 2014
Year
2015 2016
Leakagefrom the gaspipeline forevery1000 km
Leakage atstations andconsumerpremises forevery 1000customers
3.73
92
2.06
32 2.46
59
1.92
19 0.90
00
4.95
12
4.01
71
5.43
79
3.91
15
3.60
00
0.0000
1.0000
2.0000
3.0000
4.0000
5.0000
6.0000

PIPED GAS DISTRIBUTION INDUSTRY STATISTICS 2016
28
GAS SUPPLY INTERRUPTIONS AND GAS LEAKAGES AT GMB’S FACILITIES
Figure 23: Number of Gas Supply Interruptions in 2016
Figure 24: Number of Gas Leakages in 2016
Num
ber o
f Gas
Lea
kage
s
Types of Installations
Natural Gas
LPG
Total
Industry
14 15
Residential
22 71 93
Commercial
201 24
0
10
20
30
40
50
60
70
80
90
100
4
0
2
4
6
8
10
12
14
16
18
20
Num
ber o
f Gas
Sup
ply
Inte
rrup
tions
Types of Installations
Natural Gas
LPG
Total
Industry
2 0 2
Residential
12 7 19
Commercial
0 18 18
PIPED GAS DISTRIBUTION INDUSTRY STATISTICS 2016
29
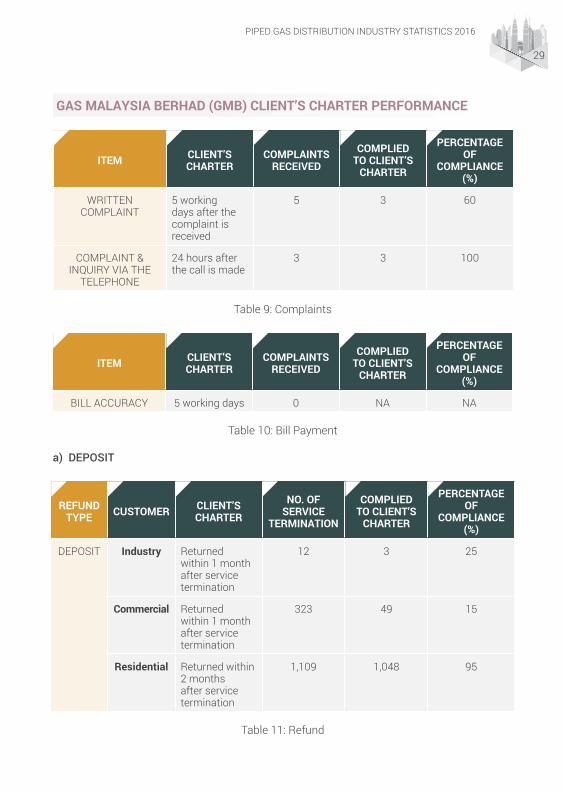
GAS MALAYSIA BERHAD (GMB) CLIENT’S CHARTER PERFORMANCE
ITEM CLIENT’S CHARTER
COMPLAINTS RECEIVED
COMPLIED TO CLIENT’S
CHARTER
PERCENTAGE OF
COMPLIANCE (%)
WRITTEN COMPLAINT
5 working days after the complaint is received
5 3 60
COMPLAINT & INQUIRY VIA THE
TELEPHONE
24 hours after the call is made
3 3 100
Table 9: Complaints
ITEM CLIENT’S CHARTER
COMPLAINTS RECEIVED
COMPLIED TO CLIENT’S
CHARTER
PERCENTAGE OF
COMPLIANCE (%)
BILL ACCURACY 5 working days 0 NA NA
Table 10: Bill Payment
a) DEPOSIT
REFUND TYPE CUSTOMER CLIENT’S
CHARTER
NO. OF SERVICE
TERMINATION
COMPLIED TO CLIENT’S
CHARTER
PERCENTAGE OF
COMPLIANCE (%)
DEPOSIT Industry Returned within 1 month after service termination
12 3 25
Commercial Returned within 1 month after service termination
323 49 15
Residential Returned within 2 months after service termination
1,109 1,048 95
Table 11: Refund

PIPED GAS DISTRIBUTION INDUSTRY STATISTICS 2016
30
b) BANK GUARANTEE
REFUND TYPE CLIENT’S CHARTER
NO. OF BANK GUARANTEE
COMPLIED TO CLIENT’S
CHARTER
PERCENTAGE OF
COMPLIANCE (%)
BANK GUARANTEE To be released within 1 month after service termination
8 3 38
Table 11: Refund (cont’d)
ITEM CLIENT’S CHARTER
NO. OF CALLS RECEIVED
COMPLIED TO CLIENT’S
CHARTER
PERCENTAGE OF
COMPLIANCE (%)
EMERGENCY RESPONSE
To send an emergency response team within 90 minutes after a call is received
522 522 100
Table 12: Emergency Response
ITEM CLIENT’S CHARTER
NO. OF PERMITS ISSUED
COMPLIED TO CLIENT’S
CHARTER
PERCENTAGE OF
COMPLIANCE (%)
THIRD PARTY SUPERVISION
Written notice at least 3 days before commencement of work
10,976 10,976 100
Table 13: Third Party Supervision

PIPED GAS DISTRIBUTION INDUSTRY STATISTICS 2016
31
ITEM CLIENT’S CHARTER
NO. OF REQUESTS
FOR PIPELINE LOCATION
INFORMATION
COMPLIED TO CLIENT’S
CHARTER
PERCENTAGE OF
COMPLIANCE (%)
IDENTIFICATION OF GAS PIPELINE
LOCATION
4 days after application is received
760 760 100
Table 14: Identification of Gas Pipeline Location
ITEM CLIENT’S CHARTER
NO. OF PLANNED
DISRUPTIONS
COMPLIED TO CLIENT’S
CHARTER
PERCENTAGE OF
COMPLIANCE (%)
PLANNED DISRUPTIONS
Customer will be notified at least 48 hours before disruption begins
2 2 100
Table 15: Planned Disruptions
ITEM CLIENT’S CHARTER
NO. OF GAS METERS
CHANGED
COMPLIED TO CLIENT’S
CHARTER
PERCENTAGE OF
COMPLIANCE (%)
REPLACEMENT OF GAS METERS
Gas meter will be replaced 3 days after completion of the investigation
64 64 100
Table 16: Replacement of Gas Meters
PIPED GAS DISTRIBUTION INDUSTRY STATISTICS 2016
32
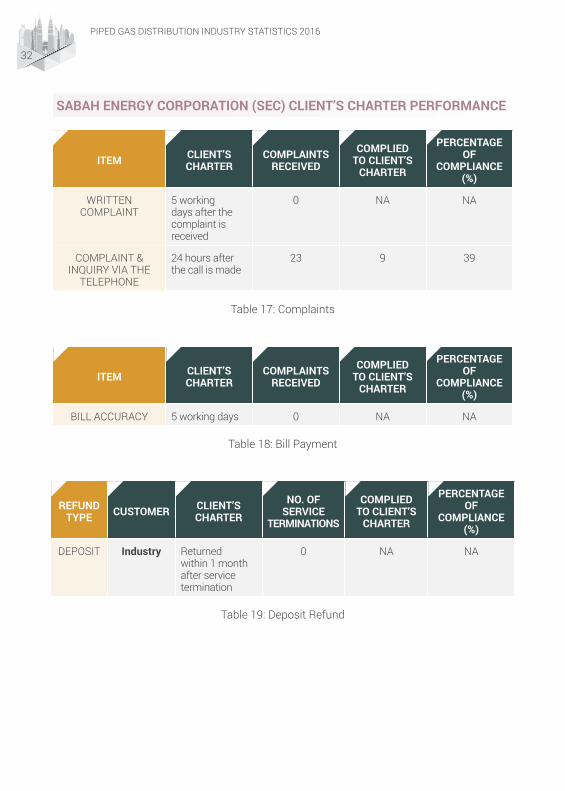
SABAH ENERGY CORPORATION (SEC) CLIENT’S CHARTER PERFORMANCE
ITEM CLIENT’S CHARTER
COMPLAINTS RECEIVED
COMPLIED TO CLIENT’S
CHARTER
PERCENTAGE OF
COMPLIANCE (%)
WRITTEN COMPLAINT
5 working days after the complaint is received
0 NA NA
COMPLAINT & INQUIRY VIA THE
TELEPHONE
24 hours after the call is made
23 9 39
Table 17: Complaints
ITEM CLIENT’S CHARTER
COMPLAINTS RECEIVED
COMPLIED TO CLIENT’S
CHARTER
PERCENTAGE OF
COMPLIANCE (%)
BILL ACCURACY 5 working days 0 NA NA
Table 18: Bill Payment
REFUND TYPE CUSTOMER CLIENT’S
CHARTER
NO. OF SERVICE
TERMINATIONS
COMPLIED TO CLIENT’S
CHARTER
PERCENTAGE OF
COMPLIANCE (%)
DEPOSIT Industry Returned within 1 month after service termination
0 NA NA
Table 19: Deposit Refund

PIPED GAS DISTRIBUTION INDUSTRY STATISTICS 2016
33
ITEM CLIENT’S CHARTER
NO. OF CALLS RECEIVED
COMPLIED TO CLIENT’S
CHARTER
PERCENTAGE OF
COMPLIANCE (%)
EMERGENCY RESPONSE
To send an emergency response team within 45 minutes after a call is received
0 NA NA
Table 20: Emergency Response
ITEM CLIENT’S CHARTER
NO. OF PERMITS ISSUED
COMPLIED TO CLIENT’S
CHARTER
PERCENTAGE OF
COMPLIANCE (%)
THIRD PARTY SUPERVISION
Written notice at least 4 days before commencement of work
0 NA NA
Table 21: Third Party Supervision
ITEM CLIENT’S CHARTER
NO. OF REQUESTS
FOR PIPELINE LOCATION
INFORMATION
COMPLIED TO CLIENT’S
CHARTER
PERCENTAGE OF
COMPLIANCE (%)
IDENTIFICATION OF GAS PIPELINE
LOCATION
4 days after application is received
0 NA NA
Table 22: Identification of Gas Pipeline Location

PIPED GAS DISTRIBUTION INDUSTRY STATISTICS 2016
34
ITEM CLIENT’S CHARTER
NO. OF PLANNED
DISRUPTIONS
COMPLIED TO CLIENT’S
CHARTER
PERCENTAGE OF
COMPLIANCE (%)
PLANNED DISRUPTIONS
Customer will be notified at least 48 hours before disruption begins
2 2 100
Table 23: Planned Disruptions
ITEM CLIENT’S CHARTER
NO. OF GAS METERS
CHANGED
COMPLIED TO CLIENT’S
CHARTER
PERCENTAGE OF
COMPLIANCE (%)
REPLACEMENT OF GAS METERS
Gas meter will be replaced three (3) days after completion of the investigation
1 1 100
Table 24: Replacement of Gas Meter

NATURAL GAS TARIFF AND LPG PRICES
4.0

PIPED GAS DISTRIBUTION INDUSTRY STATISTICS 2016
36
NATURAL GAS PRICES TO GAS UTILITY LICENSEE IN THE PENINSULA
Figure 25: Natural Gas Prices to Gas Utility Licensee in the Peninsula for the Year 2016
NATURAL GAS TARIFF BY CATEGORY IN THE PENINSULA
Tariff Category User Category
Range of Gas Consumption
(MMBtu)
Tariff (RM/MMBTu)
Jan 2016 – Jun 2016
Jul 2016 – Dec 2016
A Domestic User 0 19.52 19.52
B Commercial 0-600 23.78 25.20
C Commercial 601-5,000 23.90 25.33
D Industrial 5,001-50,000 24.14 25.58
E Industrial 50,001-200,000 25.19 26.69
F Industrial 200,001-750,000 25.19 26.69
L Industrial 750,000 & above 26.03 27.58
Average (RM/MMBtu) 25.53 27.05
Table 25: Natural Gas Tariff in the Peninsula for the Year 2016
Jan Feb Mar Apr May June July Aug Sept Oct Nov Dec
20.05 20.05 20.0521.55 21.55 21.55 21.55
38.2035.25
33.12 32.5030.35
26.7123.31 23.98
25.83 26.4929.27 30.28
0.00
10.00
20.00
30.00
40.00
50.00
Pric
e (R
M/M
MBt
u)
Month
20.05 20.05 20.05
Regulated Price
LNG Indexed Price
21.55 21.55
PIPED GAS DISTRIBUTION INDUSTRY STATISTICS 2016
37
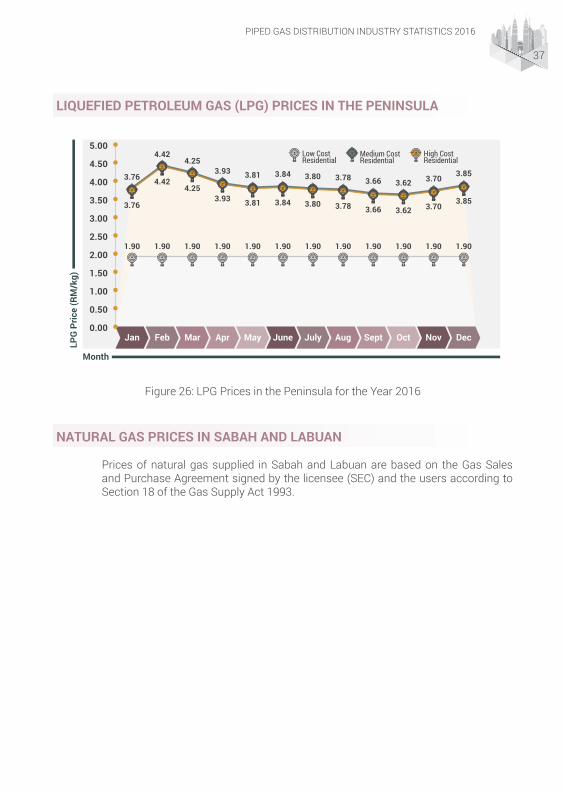
LIQUEFIED PETROLEUM GAS (LPG) PRICES IN THE PENINSULA
Figure 26: LPG Prices in the Peninsula for the Year 2016
NATURAL GAS PRICES IN SABAH AND LABUAN
Prices of natural gas supplied in Sabah and Labuan are based on the Gas Sales and Purchase Agreement signed by the licensee (SEC) and the users according to Section 18 of the Gas Supply Act 1993.
Jan Feb Mar Apr May June July Aug Sept Oct Nov Dec
LPG
Pric
e (R
M/k
g)
Month
1.90
3.76
3.76 4.42
4.42
4.25
4.25
3.93 3.81 3.84 3.80 3.78 3.66 3.62 3.703.85
3.93 3.81 3.84 3.80 3.78 3.66 3.62 3.70 3.85
0.00
0.50
1.00
1.50
2.00
2.50
3.00
3.50
4.00
4.50
5.00High CostResidential
Medium CostResidential
1.90 1.90 1.90 1.90 1.90 1.90 1.90 1.90 1.90 1.90 1.90
Low CostResidential

FINANCIAL PERFORMANCE OF GAS UTILITY LICENSEE IN THE PENINSULA
5.0

PIPED GAS DISTRIBUTION INDUSTRY STATISTICS 2016
40
Table 26: Key Financial Ratios* (%) for the year 2016
*Note*SAIDI and SAIFI lower readings indicate better performance.
Return on Sales 2.94%
Return on Fixed Asset 10.49%
Return on Equity 11.74%

GAS LICENSEES
6.0

PIPED GAS DISTRIBUTION INDUSTRY STATISTICS 2016
42
GAS UTILITY LICENCE (GUL)
Table 27: List of Licensees
PRIVATE GAS LICENCE (PGL)
Figure 27: Number of Private Gas Licenses from 2012-2016
2012
No.
of P
GL
Issu
ed
2013 2014
Year
2015 2016
Renewal
New
Total
1,088988 1,015
1,111
1,346
626
362
672
416
640
375
775
336
916
430
0
300
500
700
900
1,100
1,300
1,500
Type of Gas Licensee Effective Date Validity
Natural Gas GMB 1 September 1998 30 Years
LPG GMB 15 December 2000 20 Years
Natural Gas SEC 1 September 1998 30 Years

PIPED GAS DISTRIBUTION INDUSTRY STATISTICS 2016
43
Figure 28: Number of Private Gas Licenses by User Category in 2016
Educational Institutions
Restaurants
Resorts / Clubs
Hotels
Hospitals
Shopping Complexes
Others
83,6%
184,14%172,
13%160,12%
264,19%
294,22%
189,14%


GAS RETICULATION SYSTEM APPROVALS
7.0

PIPED GAS DISTRIBUTION INDUSTRY STATISTICS 2016
46
APPROVAL TO INSTALL (ATI)
Figure 29: Approval to Install (ATI) Issued from 2012 – 2016
Figure 30: Approval to Install (ATI) Issued based on Locations of Installation in 2016
2012
Num
ber o
f ATI
Issu
ed
2013 2014
Year
2015 2016
ATI Issued NG
ATI Issued LPG
ATI Issued Total
0
200
400
600
800
1,000
1,200
1,4001,243
1,3581,255
1,0881,052
1,007
1,168
1,046941906
236190209
147146
Commercial
Residential
Industry
1,150,93%
79,6%
14,1%
PIPED GAS DISTRIBUTION INDUSTRY STATISTICS 2016
47
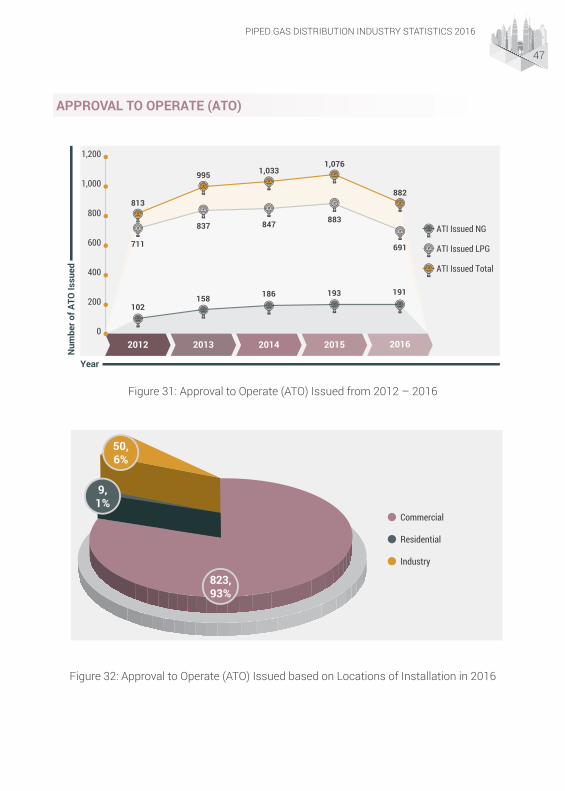
APPROVAL TO OPERATE (ATO)
Figure 31: Approval to Operate (ATO) Issued from 2012 – 2016
Figure 32: Approval to Operate (ATO) Issued based on Locations of Installation in 2016
Commercial
Residential
Industry
823,93%
50,6%
9,1%
2012
Num
ber o
f ATO
Issu
ed
2013 2014
Year
2015 2016
ATI Issued NG
ATI Issued LPG
ATI Issued Total
0
200
400
600
800
1,000
1,200
813
995 1,0331,076
882
711
837 847 883
691
102158 186 193 191


GAS FITTING, GAS APPLIANCE AND GAS EQUIPMENT APPROVALS
8.0

PIPED GAS DISTRIBUTION INDUSTRY STATISTICS 2016
50
Figure 41: Approvals to Assemble, Manufacture or Import Gas Fittings, Gas Appliances and Gas Equipment from 2012-2016
Figure 42: Approvals Issued for Gas Fittings, Gas Appliances and Gas Equipment from 2012 – 2016
Num
ber o
f App
rova
ls Is
sued
Year
2012 2013 2014 2015 20160
50
100
150
200
250
300
350
43 27 37 287
307
Num
ber o
f App
rova
ls Is
sued
Approval to ImportGas Fittings,Gas Appliancesor Gas Equipment
Approval toAssemble,ManufactureGas Fittings,Gas Appliancesor Gas Equipment
2012
2 2
2013 2014 2015 2016
Year
0
10
20
30
40
50
60
70
6 27 11 56 15 590 4

PIPED GAS DISTRIBUTION INDUSTRY STATISTICS 2016
51
Figure 43: Approvals Issued According to Gas Equipment, Gas Appliances and Fittings in 2016
Figure 44: Approvals Issued in the Gas Fitting Category in 2016
Num
ber o
f App
rova
ls Is
sued
Type of Gas Fitting
Polyethylene Fittings Flexible Rubber Hose
13 1
0
2
4
6
8
10
12
14
Gas Fittings
Gas Equipment
Gas Appliances246,80%
15,5%
45,15%

PIPED GAS DISTRIBUTION INDUSTRY STATISTICS 2016
52
Figure 45: Approvals Issued in the Gas Equipment Category in 2016
Figure 46: Approvals Issued in the Gas Appliances Category in 2016
Type of Gas Equipment
Nu
mb
er o
f A
pp
rova
ls Is
sued
Gas Cock
Gas Detector
Gas Filters
Gas Heat Pump
Gas Meter
Gas Regulator
Gas Tap
Pressure Gauge
Valve
Miscellaneous
0
10
20
30
40
50
60
70
372 6 3 63 61 2 8 61 5
Num
ber o
f App
rova
ls Is
sued
Type of Gas Appliance
GAS COOKER GAS FRYER GAS GRILLER GAS HOB GAS RANGE
4 3 3 318
GAS RICECOOKER
HOT WATERSYSTEM
7
0
2
4
6
8
10
12
14
16
18
207

GAS COMPETENCY
9.0

PIPED GAS DISTRIBUTION INDUSTRY STATISTICS 2016
54
GAS CONTRACTORS
Figure 47: Gas Contractor Registrations in 2016
No. Gas Contractors Audit Date
1. Astaraya Sdn. Bhd. 15 April 2016
2. Globegas Engineering Sdn. Bhd. 10 May 2016
3. Ezra Engineering & Trading 20 July 2016
4. Far East Gas Engineering 22 July 2016
5. Madrid Engineering Sdn. Bhd 23 August 2016
6. AIE Engineering (M) Sdn. Bhd. 9 September 2016
7. Ilham Warisan Jaya Enterprise Sdn. Bhd. 4 October 2016
8. Langsutra Sdn. Bhd. 10 October 2016
9. Alpha Flowtech Sdn. Bhd. 21 October 2016
10. I Drill Pipelines Constructions Sdn. Bhd. 4 November 2016
Table 28: Gas Contractor Facility Audits in 2016
Num
ber o
f Reg
istr
atio
ns
Renewal
New
Class A Class B Class C Class D Total
Gas Contractor Category
3 351 41 1 17 0 7 5 100
0
20
40
60
80
100
120
PIPED GAS DISTRIBUTION INDUSTRY STATISTICS 2016
55
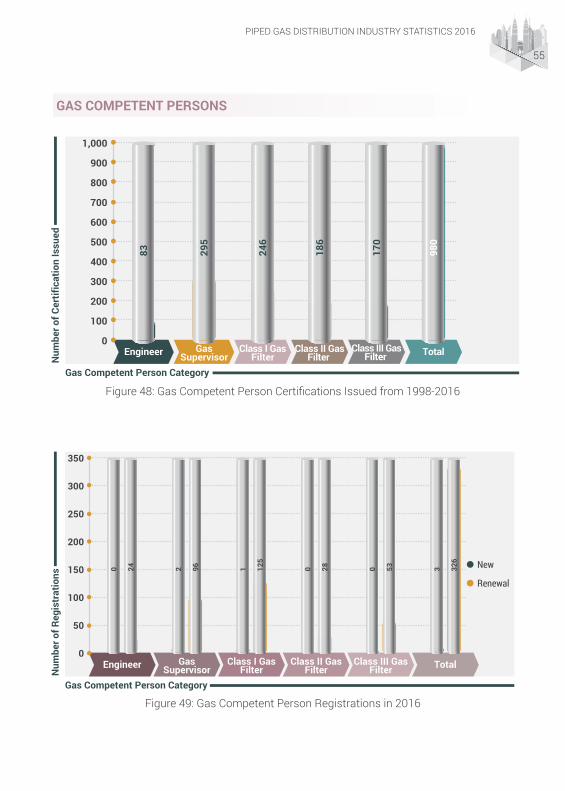
GAS COMPETENT PERSONS
Figure 48: Gas Competent Person Certifications Issued from 1998-2016
Figure 49: Gas Competent Person Registrations in 2016
Num
ber o
f Cer
tific
atio
n Is
sued
Gas Competent Person Category
Engineer GasSupervisor
Class I GasFilter
Class II GasFilter
Class III GasFilter
83 295
246
170
186
Total
980
0
100
200
300
400
500
600
700
800
900
1,000
Num
ber o
f Reg
istr
atio
ns
Renewal
New
Engineer GasSupervisor
Class I GasFilter
Class II GasFilter
Class III GasFilter
Gas Competent Person Category
2 9624 1 125
0 00 28 53
Total
3 326
0
50
100
150
200
250
300
350

PIPED GAS DISTRIBUTION INDUSTRY STATISTICS 2016
56
Session 2012 2013 2014 2015 2016
Written exam 4 1 0 0 1
Interview 24 19 32 17 39
Table 29: Gas Competency Examination & Interview Sessions
Candidates 2012 2013 2014 2015 2016
Written exam 3 5 0 0 17
Interview 68 54 81 34 128
Table 30: Gas Competency Examination & Interview Candidates
No. Name
Gas Competency Registration
No.
Non-Compliance
Actions by the Energy Commission
Effective Suspension
date
1.Muhammad
Anas Bin Marjunit
JBE (PKG) 06
Subregulation 86(6) Gas
Supply Regulations
1997.
Suspension of certificate of competency for 2 years under Subregulation 86(3) Gas Supply Regulations 1997.
25th August 2016
2.Muhammad
Arif Bin Ismail
PKG-T-1-B-04-2013
Subregulation 86(6) Gas
Supply Regulations
1997.
Suspension of certificate of competency for 2 years under Subregulation 86(3) Gas Supply Regulations 1997.
25th August 2016
3.Ahmad
Bakri Bin Othman
JBE(JGGI) 145
Subregulation 86(6) Gas
Supply Regulations
1997.
Suspension of certificate of competency for 2 years under Subregulation 86(3) Gas Supply Regulations 1997.
25th August 2016
4. Samsuddin Bin Md Taib
JGG-T-2-C-04-2012
Subregulation 86(6) Gas
Supply Regulations
1997.
Suspension of certificate of competency for 9 months under Subregulation 86(3) Gas Supply Regulations 1997.
25th August 2016
5.
Mohd Mahazam Bin Mohd
Zain
JGG-T-3-C-25-2012
Subregulation 86(6) Gas
Supply Regulations
1997.
Suspension of certificate of competency for 9 months under Subregulation 86(3) Gas Supply Regulations 1997.
25th August 2016
Table 31: List of Gas Competent Persons Suspended by the Energy Commission in 2016

GAS TRAINING INSTITUTIONS
10.0
PIPED GAS DISTRIBUTION INDUSTRY STATISTICS 2016
58
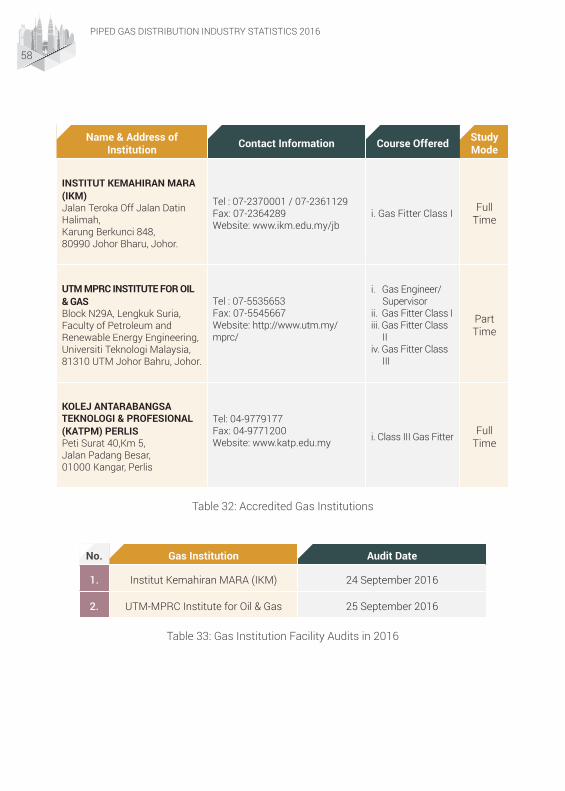
Name & Address of Institution Contact Information Course Offered Study
Mode
INSTITUT KEMAHIRAN MARA (IKM)Jalan Teroka Off Jalan Datin Halimah,Karung Berkunci 848,80990 Johor Bharu, Johor.
Tel : 07-2370001 / 07-2361129Fax: 07-2364289Website: www.ikm.edu.my/jb
i. Gas Fitter Class I Full Time
UTM MPRC INSTITUTE FOR OIL & GASBlock N29A, Lengkuk Suria,Faculty of Petroleum and Renewable Energy Engineering,Universiti Teknologi Malaysia,81310 UTM Johor Bahru, Johor.
Tel : 07-5535653Fax: 07-5545667Website: http://www.utm.my/mprc/
i. Gas Engineer/Supervisor
ii. Gas Fitter Class Iiii. Gas Fitter Class
IIiv. Gas Fitter Class
III
Part Time
KOLEJ ANTARABANGSA TEKNOLOGI & PROFESIONAL (KATPM) PERLISPeti Surat 40,Km 5,Jalan Padang Besar,01000 Kangar, Perlis
Tel: 04-9779177Fax: 04-9771200Website: www.katp.edu.my i. Class III Gas Fitter Full
Time
Table 32: Accredited Gas Institutions
No. Gas Institution Audit Date
1. Institut Kemahiran MARA (IKM) 24 September 2016
2. UTM-MPRC Institute for Oil & Gas 25 September 2016
Table 33: Gas Institution Facility Audits in 2016

GAS SAFETY AUDITS
11.0

PIPED GAS DISTRIBUTION INDUSTRY STATISTICS 2016
60
Figure 50: Inspections conducted for the issuance of Approval to Install (ATI) & Approval to Operate (ATO)
Figure 51: Gas Safety Taskforce Inspections Conducted at Shopping Malls Throughout the Peninsular and Sabah
Approval to Install (ATI)
Approval to Operate (ATO)167,76%
54,24%
0 10 20 30 40 50 60 70
Number of Inspected Gas Outlets
Mai
n P
rem
ises 26
25
14
62
26
23
20
SETAPAK CENTRAL MALL
AEON MALL AU2
DPULZE SHOPPING CENTRE
SURIA KLCC
IMAGO SHOPPING MAL
AEON MALL SEREMBAN 2
MID VALLEY MEGAMALL
PIPED GAS DISTRIBUTION INDUSTRY STATISTICS 2016
61
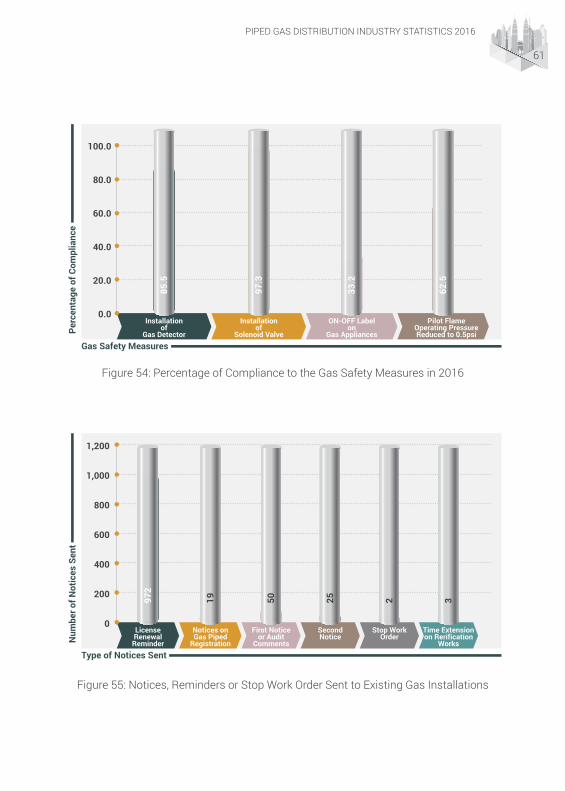
Figure 54: Percentage of Compliance to the Gas Safety Measures in 2016
Figure 55: Notices, Reminders or Stop Work Order Sent to Existing Gas Installations
Perc
enta
ge o
f Com
plia
nce
Gas Safety Measures
Installationof
Gas Detector
Installationof
Solenoid Valve
ON-OFF Labelon
Gas Appliances
Pilot FlameOperating PressureReduced to 0.5psi
85.5
97.3
33.2
62.5
0.0
20.0
40.0
60.0
80.0
100.0
Num
ber o
f Not
ices
Sen
t
Type of Notices Sent
LicenseRenewal
Reminder
Notices onGas Piped
Registration
First Noticeor Audit
Comments
972
19 50
SecondNotice
25
Stop WorkOrder
2
Time Extensionon Rerification
Works
3
0
200
400
600
800
1,000
1,200


NEW GUIDELINES OR CIRCULARS ISSUED IN 2016
12.0

PIPED GAS DISTRIBUTION INDUSTRY STATISTICS 2016
64
No. Reference Number Title Objective
1 ST(IP/JG/P)16/2/3(52)
Non destructive test (NDT) requirement for welding works on gas piping sized 4 inch and above.
To ensure that welding works on gas piping are done according to approved standards and do not pose any danger to the public.
2 NA
Guidelines on the Implementation of Periodic Inspections and Leak Tests for Gas Piping System
To assist gas contractors and gas competent persons when conducting periodic inspections on existing gas piping system.
Table 34: New Guidelines or Circulars Issued in 2016

GAS ACCIDENTS
13.0

PIPED GAS DISTRIBUTION INDUSTRY STATISTICS 2016
66
Figure 57: Number of Gas Accidents that were Reported to the Energy Commission from 2002 to 2016
Figure 58: Causes of Gas Accidents From 2002 to 2016
2002 2003 2004 2005 2006 2007 2008 2009 2010 2011 2012 2013 20162014 2015Num
ber o
f Rep
orte
d Ac
cide
nt
Year
0
1
2
3
4
5
6
7
8
9
Num
ber o
f Acc
iden
ts
Causes of Gas Accident
PoorMaintenance
Third PartyWorks NearGas Pipeline
Negligence ByGas
Contractors
10 13 5
PoorOperatingProcedure
1
PoorWorkmanship
1
Other
2
0
2
4
6
8
10
12
14

PIPED GAS DISTRIBUTION INDUSTRY STATISTICS 2016
67
12.0 NEW GUIDELINES OR CIRCULARS ISSUED IN 201No. Location Date Approximate Time
1Shopping mall in Kuala Lumpur• Grill & bar restaurant• Fast food outlet
5th April 2016 9.45 AM
2 Apartment in Kuala Lumpur 8th December 2016 4.15 PM
Table 35: List of Gas Accidents Reported to the Energy Commission in 2016
SUMMARY OF GAS ACCIDENTS IN 2016
Gas Accidents at a Shopping Mall in Kuala Lumpur
Date & Time 5th April 2016 at approximately 9.45 am
Number of Victim 9
Gender 5 Males and 4 Females
Victim’s Occupation
i. 5 food & beverages outlet crewsii. 1 fast food outlet crew iii. 2 maintenance crews of the shopping malliv. 1 gas competent person
Locations of Accidents i. Food & beverages outlet restaurantii. Fast food outlet
Type of gas installation Gas piping droppers before the gas meters.
Summary of the Accident
Shopping mall maintenance crews were carrying out recommissioning works on the after-gas meter piping due to the installation of main bypass valves on the main piping system. Unfortunately, during the recommissioning process, two separate explosions occurred at two outlets injuring 9 people.
Cause of Accidenti. Failure to effectively implement permit-to-work system.ii. Unsafe practices during recommissioning
Action taken by the Commission under the Gas Supply Act 1993 & Gas Supply Regulations 1997
Suspension and Cancellation of Certificates of Competency under Subregulation 86(6) Gas Supply Regulations 1997.
Table 36: Case Summary

PIPED GAS DISTRIBUTION INDUSTRY STATISTICS 2016
68
12.0 NEW GUIDELINES OR CIRCULARS ISSUED IN 2016
Figure 59: Gas Piping Layout for Fast Food Outlet
Figure 60: Gas Piping Layout for Food and Beverage Outlet Restaurant
LG 33-34Lokasi kejadianLetupan Gas
Petunjuk:Paip penaik (Riser)Paip gas utamaPaip gas dalaman
undergroundtank 2x20kL
6
LG 3
0
LG 3
1
LG 3
2
LG 3
3
LG 3
4
LG 053-LG 035LG 052-LG 043ALG 057-LG 053
LG 0059-LG 0060 LG 0061-LG 0069 LG 0070-LG 0077 LG 0009-LG 0017
1st stage regulator
2nd stage regulator Vaporiser
MAKANPLACELG084-LG078
LG001-LG008
Hypermarket
ARAS LG
BOOKSTORE
Tenant
GE- 11B & 12Lokasi kejadian Letupan Gas
9
SupermarketDepartment Store
Shop
Shop
Shop
Shop Hotel
ARAS G
STORE
HotelMENARA
Petunjuk:Paip penaik (Riser)Paip gas utamaPaip gas dalaman

PIPED GAS DISTRIBUTION INDUSTRY STATISTICS 2016
69
Gas Accident at an Apartment Complex in Kuala Lumpur
Date & Time 8th December 2016 at approximately 4.15 pm
Number of Victim 1
Gender Male
Victim’s Occupation Maintenance technician
Locations of Accidents Gas meter riser room located at 5th floor of an apartment complex in Kuala Lumpur
Type of gas installation After gas meter piping.
Summary of the Accident
Maintenance technicians were carrying out nitrogen purging work due to blockage in the piping. Unfortunately, during the purging process, an explosion occurred in the riser room where the gas meter is located injuring one technician who was manning the valve.
Cause of Accident Still under investigation
Action taken by the Commission under the Gas Supply Act 1993 & Gas Supply Regulations 1997
Still under investigation
Table 37: Case Summary
Figure 65: Schematic diagram of the piping at an apartment complex in Kuala Lumpur
The explosion occurred during the purging process
GAS METER
Pipe size = ¾ inch, Length of pipe ≈ 40 m
Gas meter riser room
GM
GAS VALVE
House unit


GAS UTILITY LICENSEES CONTACT INFORMATION
14.0

PIPED GAS DISTRIBUTION INDUSTRY STATISTICS 2016
72
GAS MALAYSIA BERHAD
HEADQUARTERS
Address:No. 5, Jalan Serendah 26/17, Seksyen 26, Peti Surat 7901, 40732 Shah Alam, Selangor.
Tel : 03 5192 3000Fax : 03 5192 6766Website : www.gasmalaysia.com
OCC Hotline : 1-800-88-9119 or 1-800-5656
OCC Email : [email protected]
OCC = Operations Control Centre
REGIONAL OFFICE
SOUTHPLO 343, Jalan EmasTiga,Kawasan Perindustrian Pasir Gudang,81700 Pasir Gudang, Johor.
Tel : 07 252 2314Fax : 07 252 2561
EASTLot 104, Gebeng Industrial Area,26080 Kuantan,Pahang.
Tel : 09 583 6340Fax : 09 583 6339
NORTHNo. 27, Jalan Todak 4, Pusat Bandar Seberang Jaya,13700 Seberang Jaya, Pulau Pinang.
Tel : 04 398 1727 / 1757Fax : 04 398 2636
DISTRICT OFFICE
SELANGOR, BangiNo. 30, Jalan 4/12B, 43650 Bandar Baru Bangi, Selangor.
Tel : 03 8922 1191/ 1192 Fax : 03 8922 1190
SELANGOR, Shah AlamNo. 1, Jalan 13/15, Sekyen 13, 40000Shah Alam, Selangor.
Tel : 03 5511 9914 Fax : 03 5511 9912
PERAK, Seri Manjung9 PSN PM7, Pusat Bandar Seri Manjung,32040 Seri Manjung, Perak.
Tel : 04 976 8400 Fax : 04 976 0625
KUALA LUMPUR, Jalan GurneyNo. 20, Jalan Gurney,54100 Kuala Lumpur.
Tel : 03 9206 7800Fax : 03 9287 4282
WP PUTRAJAYA, PutrajayaNo. 1, Jalan P9 B/1, Precinct 9,62250 Putrajaya. Tel : 03 8888 5264 /5224Fax : 03 8888 3990
NEGERI SEMBILAN, SenawangNo. 34, Jalan Bunga Raya 9,Pusat Perniagaan Senawang,Taman Tasik Jaya,70400 Seremban,Negeri Sembilan.
Tel : 06 678 1995/5348Fax : 06 678 6937
JOHOR, KluangNo. 9, Jalan 53B, Taman Kluang Barat86000 Kluang, Johor.
Tel : 07 771 2105 Fax : 07 777 2108

PIPED GAS DISTRIBUTION INDUSTRY STATISTICS 2016
73
SABAH ENERGY CORPORATION SDN. BHD.
HEADQUARTERS
Address:1st, 2nd & 3rd Floors,Wisma Bandaraya, Jalan Mesjid Lama, Locked Bag No. 2,88990 Kota Kinabalu, Sabah.
Tel : 088 311290 / 299 Fax : 088 311361Website : www.sabahenergycorp.com
REGIONAL OFFICE
LABUAN UNITSaguking Warehouse D8,P. O. Box 80244,87012 Labuan, Wilayah Persekutuan.
Tel : 087 418 060 / 417 162Fax : 087 413 877


PIPED GAS DISTRIBUTION INDUSTRY STATISTICS 2016
75
ENERGY COMMISSION CONTACT INFORMATION
15.0

HEADQUARTERS
SURUHANJAYA TENAGA No. 12, Jalan Tun Hussein,Precinct 2,62100, Putrajaya.
GPS Coordinate : 2.919175, 101.688459Toll Free No : 1-800-2222-78 (ST)Phone : (603) 8870 8500Fax : (603) 8888 8637Web : www.st.gov.my
REGIONAL OFFICES
Address Phone No.& Fax
SELANGOR, KUALA LUMPUR & PUTRAJAYATingkat 10, Menara PKNSNo. 17, Jalan Yong Shook Lin46050 Petaling Jaya, Selangor
Tel : 03 - 7955 8930Fax : 03 - 7955 8939
NEGERI SEMBILAN & MELAKATingkat 4, Wisma Perkeso, Jalan Persekutuan, MITC,75450 Ayer Keroh, Melaka.
Tel : 06 - 231 9594Fax : 06 - 231 9620
JOHORSuite 18A, Aras 18Menara ANSAR 65Jalan Trus80000 Johor Bharu, Johor
Tel : 07 - 224 8861Fax : 07 - 224 9410
PULAU PINANG, KEDAH & PERLISTingkat 10, Bangunan KWSP,13700 Seberang Jaya, Butterworth, Pulau Pinang.
Tel : 04 - 398 8255Fax : 04 - 390 0255

Address Phone No.& Fax
PERAKTingkat 1, Bangunan KWSP,Jalan Greentown,30450 Ipoh, Perak.
Tel : 05 - 253 5413Fax : 05 - 255 3525
KELANTAN & TERENGGANUTingkat 6, Bangunan KWSP,Jalan Padang Garong,15000 Kota Bharu, Kelantan.
Tel : 09 - 748 7390Fax : 09 - 744 5498
PAHANGTingkat 7, Kompleks Teruntum,Jalan Mahkota,25000 Kuantan, Pahang.
Tel : 09 - 514 2803Fax : 09 - 514 2804
PANTAI BARAT NEGERI SABAHTingkat 7, Bangunan BSN,Jalan Kemajuan,88000 Kota Kinabalu, Sabah.
Tel : 088 - 232 447Fax : 088 - 232 444
PANTAI TIMUR NEGERI SABAHTingkat 3, Wisma Sabah KM12,W.D.T. No. 25,90500 Sandakan, Sabah.
Tel : 089 - 666 695Fax : 089 - 660 279

NOTES


SURUHANJAYA TENAGA(ENERGY COMMISSION)No. 12, Jalan Tun Hussein, Precinct 2,62100 Putrajaya, Malaysia.
Tel : 603 8870 8500Fax : 603 8888 8637 Toll Free Number: 1-800-2222-78 (ST)
w w w . s t . g o v . m y
ECOFRIENDLYPAPER RECYCLABLE Printed on Ecobel White


