Company Note March 22, 2012 Thomas J. Gunderson, Sr Research Analyst 612 303-6467, [email protected]Piper Jaffray & Co. Brooks E. West, Sr. Research Analyst 612 303-6954, [email protected]Piper Jaffray & Co. Daniel F. Garofalo, Research Analyst 612 303-6956, [email protected]Piper Jaffray & Co. Michael Dinerman, M.D., Research Analyst 212 284-9325, [email protected]Piper Jaffray & Co. Reason for Report: Initiating Coverage Changes Previous Current Rating Neutral Price Tgt $21.00 FY12E Rev (mil) -- 215.9 FY13E Rev (mil) -- 269.0 FY12E EPS -- (1.00) FY13E EPS -- (0.45) Price $19.28 52 Week High $23.33 52 Week Low $14.00 12-Month Price Target $21.00 4.0x EV/CY13E Revenue Shares Out (mil) 51.1 Market Cap. (mil) $985.2 Avg Daily Vol (000) 332 Book Value/Share $1.51 Net Cash Per Share NM Debt to Total Capital 60% Yield: 0.00% Fiscal Year End: Dec Rev (mil) 2011A 2012E 2013E Mar 28.3A 47.4E 60.0E Jun 32.2A 50.9E 65.4E Sep 44.6A 56.2E 69.6E Dec 47.2A 61.4E 74.2E FY 152.3A 215.9E 269.0E CY 152.3A 215.9E 269.0E FY RM 6.5x 4.6x 3.7x CY RM 6.5x 4.6x 3.7x EPS 2011A 2012E 2013E Mar (0.22)A (0.31)E (0.21)E Jun (0.35)A (0.26)E (0.12)E Sep (0.29)A (0.24)E (0.08)E Dec (0.30)A (0.19)E (0.04)E FY (1.15)A (1.00)E (0.45)E CY (1.15)A (1.00)E (0.45)E FY P/E NM NM NM CY P/E NM NM NM Insulet Corporation (PODD – $19.28) Neutral Growth Balanced by Near-Term Risk: Initiate at Neutral CONCLUSION: As one of only a few pure plays in the diabetes device market, Insulet offers the only tubeless patch pump in the US, with roughly 10% overall market share. We see the opportunity for patch pumps as still in early stages of adoption, and view 2012 as a transition year for PODD. The potential Q2 launch of the company’s next generation OmniPod® should provide enhanced patient benefits and adoption of the device, as well as increased product margins. However, the oft delayed product does not yet have final FDA approval. Once approved, we believe high volume manufacturing and customer conversion activities add additional short term investor risk. Given uncertain timing of launch events we rate PODD Neutral with a $21 price target, pending better visibility on timing for the conversion to the next gen product. • Established Technology Position in Attractive Market: Even if PODD's patch pump monopoly is broken, established technology, product awareness and manufacturing experience should allow for the continuance of market share gains. We estimate insulin pumps to be a $1.1 billion global market with 3%-7% annual growth prospects through 2015. The potential for an established diabetes participant to gain position with a competing patch pump looms, but not likely before 2013 at the earliest in our opinion. • Potential Transition to Break-even Earnings: Over the course of the next 1-2 months investors expect regulatory approvals in the US and China. The US FDA approval and conversion of PODD's ~35K customer base potentially unlocks 10-15 points of OmniPod GM expansion based on a new contract manufacturing (Flextronics) platform in China with capacity to support a 90k-100k global customer base. The approval, launch, and conversion process is targeted for completion in 2013, but timelines have shifted in the past. We are modeling for a 530 bp increase in GM in FY13, with earnings approaching breakeven by Q413. • Valuation: PODD trades at 3.8x our 2013 revenue estimate, slightly lower than the high growth medtech comp group median of 5.1x. The acquisition of Neighborhood Diabetes last year distorts the pure OmniPod product revenue, accounting for the relative discount to pure product driven high growth medtech multiples. Our price target of $21 is based on 4.0x 2013 revenue and represents a weighted average of OmniPod (4.8x) and Neighborhood Diabetes (1.3x) multiples, with the OmniPod multiple reflecting a gross margin related discount to our comp group. We would become more constructive on a pullback to below $18/share. INVESTMENT RECOMMENDATION: We rate PODD shares at Neutral with a $21 price target based on a 4.0x EV/Sales multiple of our 2013E revenue of $269, assuming $15 net debt and 51.5M shares. RISKS TO ACHIEVEMENT OF TARGET PRICE: Risks include Government & Regulatory issues, and strong established competition in the global insulin delivery market. COMPANY DESCRIPTION: Insulet engages in the development, manufacture, and marketing of insulin infusion systems for people with insulin-dependent diabetes. Page 1 of 22 Insulet Corporation Piper Jaffray does and seeks to do business with companies covered in its research reports. As a result, investors should be aware that the firm may have a conflict of interest that could affect the objectivity of this report. Investors should consider this report as only a single factor in making their investment decisions. This report should be read in conjunction with important disclosure information, including an attestation under Regulation Analyst certification, found on pages 20 - 22 of this report or at the following site: http://www.piperjaffray.com/researchdisclosures.
Transcript
Company NoteMarch 22, 2012
Thomas J. Gunderson, Sr Research Analyst612 303-6467, [email protected] Jaffray & Co.Brooks E. West, Sr. Research Analyst612 303-6954, [email protected] Jaffray & Co.Daniel F. Garofalo, Research Analyst612 303-6956, [email protected] Jaffray & Co.Michael Dinerman, M.D., Research Analyst212 284-9325, [email protected] Jaffray & Co.
4.0x EV/CY13E RevenueShares Out (mil) 51.1Market Cap. (mil) $985.2Avg Daily Vol (000) 332Book Value/Share $1.51Net Cash Per Share NMDebt to Total Capital 60%Yield: 0.00%Fiscal Year End: Dec
Growth Balanced by Near-Term Risk: Initiate atNeutralCONCLUSION:As one of only a few pure plays in the diabetes device market, Insulet offers the onlytubeless patch pump in the US, with roughly 10% overall market share. We see theopportunity for patch pumps as still in early stages of adoption, and view 2012 as atransition year for PODD. The potential Q2 launch of the company’s next generationOmniPod® should provide enhanced patient benefits and adoption of the device, aswell as increased product margins. However, the oft delayed product does not yethave final FDA approval. Once approved, we believe high volume manufacturingand customer conversion activities add additional short term investor risk. Givenuncertain timing of launch events we rate PODD Neutral with a $21 price target,pending better visibility on timing for the conversion to the next gen product.
• Established Technology Position in Attractive Market: Even if PODD'spatch pump monopoly is broken, established technology, product awareness andmanufacturing experience should allow for the continuance of market share gains.We estimate insulin pumps to be a $1.1 billion global market with 3%-7% annualgrowth prospects through 2015. The potential for an established diabetes participantto gain position with a competing patch pump looms, but not likely before 2013 atthe earliest in our opinion.
• Potential Transition to Break-even Earnings: Over the course of the next 1-2months investors expect regulatory approvals in the US and China. The US FDAapproval and conversion of PODD's ~35K customer base potentially unlocks10-15 points of OmniPod GM expansion based on a new contract manufacturing(Flextronics) platform in China with capacity to support a 90k-100k globalcustomer base. The approval, launch, and conversion process is targeted forcompletion in 2013, but timelines have shifted in the past. We are modeling for a530 bp increase in GM in FY13, with earnings approaching breakeven by Q413.
• Valuation: PODD trades at 3.8x our 2013 revenue estimate, slightly lower than thehigh growth medtech comp group median of 5.1x. The acquisition of NeighborhoodDiabetes last year distorts the pure OmniPod product revenue, accounting for therelative discount to pure product driven high growth medtech multiples. Our pricetarget of $21 is based on 4.0x 2013 revenue and represents a weighted average ofOmniPod (4.8x) and Neighborhood Diabetes (1.3x) multiples, with the OmniPodmultiple reflecting a gross margin related discount to our comp group. We wouldbecome more constructive on a pullback to below $18/share.
INVESTMENT RECOMMENDATION:We rate PODD shares at Neutral with a $21 price target based on a 4.0x EV/Salesmultiple of our 2013E revenue of $269, assuming $15 net debt and 51.5M shares.RISKS TO ACHIEVEMENT OF TARGET PRICE:Risks include Government & Regulatory issues, and strong established competitionin the global insulin delivery market.COMPANY DESCRIPTION:Insulet engages in the development, manufacture, and marketing of insulin infusionsystems for people with insulin-dependent diabetes.
Page 1 of 22Insulet Corporation
Piper Jaffray does and seeks to do business with companies covered in its research reports. As a result, investors should beaware that the firm may have a conflict of interest that could affect the objectivity of this report. Investors should considerthis report as only a single factor in making their investment decisions. This report should be read in conjunction withimportant disclosure information, including an attestation under Regulation Analyst certification, found on pages 20 - 22 ofthis report or at the following site: http://www.piperjaffray.com/researchdisclosures.
We are initiating coverage of Insulet (PODD) with a Neutral rating, and a $21 price target. We view PODD’s OmniPod patch pump platform as representing an established technology in the growing insulin delivery market. While we do believe shares may offer above average return prospects for longer-term investors, in the near term we expect shares to be range bound as PODD navigates next generation OmniPod approval in the U.S. with a worldwide launch, implementation of a new manufacturing platform and conversion of an existing customer base of 35,000+. Importantly, the associated margin expansion of PODD’s next generation OmniPod should provide a clear runway to profitability, but not until 2014 in our opinion. The next generation OmniPod approval process has clearly come a long way in recent years, and we fully expect any remaining delays to be shorter in nature and less severe. However, in our view the collective effort of approval, manufacturing capacity ramp, and worldwide launch and conversion will likely be a 1 year process at minimum with operational profitability in 2H13 and positive EPS in 2014 (Exhibit 2), contrary to some street estimates of profitable EPS in 2013. As such, we believe shares are fairly valued at current levels. We recommend investors use any next generation OmniPod setbacks along the way, or potential recalibrations of street earnings estimates, to judiciously build positions in PODD. We would become more constructive below $18/share.
VALUATION
For a start-up medical device company, we believe PODD valuation should be based on an EV to 2013 revenue multiple. Currently, PODD trades at 6.6 times 2011 revenue, 4.7 times 2012 estimated revenue and 3.8 times 2013 estimated revenue. PODD trades at a discount to its high growth medtech peers, partly due to a lower GM business model which has postponed positive earnings relative to others. We also note that PODD’s revenues are a composite of product sales, license fees, and the low margin (1.0-1.5 revenue multiple) Neighborhood Diabetes revenues. Aside from the Neighborhood Diabetes contribution, we estimate organic growth of 26%-30% for CY12 for PODD, in-line to our assembled comps, and it has the “rare technology” label that is attractive to potential strategic buyers. We believe EV/CY13E revenue provides the most relevant metric for valuation for investors, as PODD should be well into the domestic and international launch of its next gen pump by then. We value shares at 4.0x EV/CY13E revenue, resulting in a $21 PT. The 4.0 multiple that we are using is a blend of the high valuation and low valuation
Slight Discount to High Growth Peers
Page 2 of 22Insulet Corporation
Company Note March 22, 2012
components of the business. Our blended methodology weights the OmniPod business at 76% and Neighborhood Diabetes at 24% based on our 2012 mix assumptions. We assign a 4.8x CY13 revenue multiple to the OmniPod portion of Insulet’s business, which does reflect a discount from ~5.1x of our assembled comps below, owing to the significant gross margin disparity. Conversely, we assign a 1.3x multiple to the Neighborhood Diabetes business, reflecting Insulet’s purchase price of $63 million compared to ~$50 - $54 million of revenue, post referral attrition from competing pump manufacturers. Our blended methodology {(.76 x 4.8) + (.24 x 1.3)} rounds to a 4.0x multiple, and in our view, best reflects the two main elements of PODD’s business. Absent unforeseen delays in PODD’s next gen pump, we would become more constructive on shares with a pullback below $18/share given the inherent risk of achieving next gen approval, executing launch, installed base conversion and ultimate achievement of cost reductions and the associated GM improvements.
Like other high growth medtech stocks, upside in PODD shares could come from a potential strategic acquirer. Diabetes has historically been an active sector for M&A. Several potential strategic suitors do appear to be engaged in development of their own competing patch pumps. Both Roche (Medingo) and Medtronic appear to be working toward their own products for the U.S. market. Other candidates include Abbott and JNJ and Bayer. Pharma players such as Eli Lilly and Denmark based Novo Nordisk could also be interested in acquiring patch pump technology, although these are less discussed suitors, in our view. In the following exhibit we provide a historical perspective on key M&A transactions in the insulin pump space. Ultimately, we believe the price PODD could command would likely be at the high end of the range below, given the attractive growth outlook for insulin pumps in general, and OmniPod’s differentiated technology and ability to gain market share, not only from other pump manufacturers, but more importantly from multiple daily injections (MDI) that currently dominate the insulin delivery market.
That said, while an acquisition is a possibility, we would be cautious about playing shares solely for a potential take-out. Timing is uncertain, make or buy calculations change, and new technologies always threaten in diabetes. In our view, any potential acquirer would likely wait at least until the dust settles on the next gen launch, and the resulting market share ramifications/competitive landscape to potentially make a move.
INVESTMENT OVERVIEW
Insulet is a $1B market cap medtech company, growing revenues at over 30%, and trading at 4.7 times our 2012 revenue estimate of $215.9 million. Insulet is a pure play in diabetes. Essentially, Insulet is a drug delivery company, with one key product. It has developed an insulin delivery system, known generically as a patch pump, which is a 3 day use disposable device. Over the last six years it has established roughly 10% market share in the $1.1 billion US insulin pump business. Each new patient can be thought of as an annuity for PODD, generating revenues of roughly $3,000/yr. PODD management has suggested that there are 35,000 OmniPod customers worldwide of whom we believe over 95% are US based. In other words, the current US base of users (assuming they are retained) should generate approximately $100 million in revenues per year. The company grew OmniPod revenues by 47% in 2010 and ~40% in 2011, but is yet to reach profitability. The key to attaining profitability is achieving a higher GM, given relatively fixed pricing. Manufacturing is semi-automated and based in China (Flextronics). A next generation OmniPod that is due this year in the US is intended to increase patient features, but most importantly drive costs down by 30%. Competition in the patch pump market has been active, loud and so far unsuccessful in gaining a foothold OUS, or even FDA approval in the US. OmniPod is reimbursed by most of the key private insurance companies.
Exhibit 2
INSUL IN PUMP RELATED ACQUIS IT IONS & MULT IPLES ($ Millions)
Source: Thomson One, Piper Jaffray Estimates
Diabetes Pure Play
Page 4 of 22Insulet Corporation
Company Note March 22, 2012
Whereas the traditional insulin pump is a long-term use medical device, patch pumps are smaller, short term use and disposable. Instead of one pump for 4 years, an OmniPod user requires roughly 500 devices (disposable component) in 4 years (assuming a 3 day cycle). The system includes two basic components: 1) the disposable “pod”, which combines the pump/reservoir/insertion modules and 2) the Personal Diabetes Manager (PDM) which is essentially a handheld wireless remote control unit for the “pod” (Exhibit 1). The OmniPod allows for a relatively small, lightweight unit to be placed directly on the skin of the abdomen or arm, without the hassle of a tube. The pod/pump component is completely replaced every 3 days. Pricing is roughly $600 for a starter kit and $28/pod.
In our view there are three key advantages to the OmniPod patch system:
1) Freedom from tubes (patient). For active patients, the tubing that leads from a
traditional pump to the cannula can be cumbersome. The OmniPod attaches to a
single site and has no other body contact or restriction of movement.
2) Ease of training (diabetes educator). The ease of insertion for the OmniPod is a big
plus in our view. We have watched as diabetes educators have “oo-ahed” when
viewing a video of attaching the OmniPod. The needle stick is fast, automatic, and
by our personal view, painless.
3) Payor friendly, pay as you go (insurance company). From a payor perspective—the
majority of private insurance companies reimburse for insulin pumps. But many
feel that the financial risk profile is less with the OmniPod. Rather than a $6,000
outlay all at once, OmniPod pump costs are roughly $280/month. Given the
mobility of workers and the changing pay plans for employers, a pay as you go
plan like the OmniPod matches costs with benefit in a more timely manner.
Insulet’s Solution: the OmniPod
Exhibit 3
OMNIPOD AND PERSONAL D IABETES MANAGER (PDM)
Source: Company Reports
Page 5 of 22Insulet Corporation
Company Note March 22, 2012
The OmniPod has been essentially the same product for the last 7 years. The next gen (NG) product will be one third smaller volume, and 25% lighter, while still maintaining the same features, including the same insulin capacity (200 units). More importantly for investors, and for the long term financial viability of the company, the next generation pods are expected to be less costly to manufacture. Management has estimated that US OmniPod GM can increase 10-15 points from current levels, which approach 50% in our estimation. Manufacturing for the new pod is currently gearing up. We believe the first of three manufacturing lines is up and ready. The next gen product received CE mark in Q311, and we suspect shipments to Europe of the NG product may have already begun. For US approval, the 510(k) was submitted to the FDA in May of 2011, FDA responded with a list of 49 questions in August 2011, and Insulet filed its answers to the FDA questions in late November of 2011.
As of this writing we are not aware of any outstanding issues that would prevent final FDA clearance. The American Diabetes Association (ADA) annual convention begins June 8 (in Philadelphia). Management is hopeful that the next generation product can be launched at ADA. Shifting the more than 35,000 customers to a new device is expected to take six months. To be mindful of potential time delays in regulatory, manufacturing and marketing, as well as the GM dilution of placing the new PDM, we begin modeling the higher GM from the next gen product in the first quarter of 2013. The next gen will also be the platform that eventually incorporates DexCom’s continuous glucose monitoring (CGM) capabilities. We expect DexCom’s Gen 4 to be FDA approved possibly by end of year 2012. A CGM enabled OmniPod could be available in late 2013, but more likely 2014 in our opinion. In our estimation the CGM compatibility will allow the user to carry one less handheld. Currently Medtronic is the only FDA approved insulin pump with CGM onboard.
The device section of the FDA (CDRH) has been noted to be in an even slower, more cautious mode for the last 2-3 years. However, it seems to us that an extra layer of caution and scrutiny has been placed on diabetes, and particularly insulin pumps. For investors, the additional scrutiny for pumps is a factor to be considered. For Insulet the regulatory slowness has both a positive and a negative impact in our view. On the positive side, the
Next Generation Approval Imminent
Exhibit 4
NEXT GENERAT ION OMNIPOD T IMEL INE
Source: Company Documents, Piper Jaffray Estimates
Regulatory
Page 6 of 22Insulet Corporation
Company Note March 22, 2012
higher bar and slower approvals have kept patch pump competition at bay. Conversely, Insulet has had to deal with the costs of a delayed launch of its next generation OmniPod. The results have been that fewer new pumps have come to market and that development of newer iterations of pumps has been slowed. Traditional insulin pumps are complex insulin delivery systems with a need for high level quality and back-up safety systems. The traditional devices’ manufacturing costs are roughly $1,200 and the pumps last 4-5 years. For a base of 10,000 customers, a traditional pump company would need to provide roughly 100 pumps a month. For a disposable pump that lasts 3 days, the sophistication requirement remains high. OmniPods are complex and must have safety back-up systems built in, but for a base of 10,000 customers, Insulet needs to manufacture 100,000 devices monthly! Additionally, the cost needs to be significantly less than the sales price, which we estimate at $14/unit currently. Insulet’s challenge is daunting, but we believe the company is making headway. In order to accomplish the production challenge, Insulet manufactures the OmniPod in China using Flextronics for both the pod and the PDM. We anticipate that eventually with increased volumes, yields and reduced component costs, that Insulet can realize a 500-1,000bp reduction in total costs in 2013, as the shift to next gen is completed. Pumps are more expensive than multiple daily injection (MDI). And OmniPod is slightly more expensive over 4 years than a traditional insulin pump, but the numbers are close. Unlike the #1 selling Medtronic pump, OmniPod does not have CGM integration, nor does it have low glucose auto-off (available from MDT OUS only). The OmniPod reservoir is smaller (200 units) vs. traditional pumps (300 units). Whereas some reports have the “constantly on” OmniPod delivering better clinical results, some patients like the ability of traditional pumps to be detached from the cannula during swimming, bathing, or moments of intimacy. We have also heard some users’ desire for a button on the pod itself for delivering a pre-set bolus, without the need for the PDM. Overall we find the disadvantages minor as compared to the overall positive experience that we have heard from users. With roughly 30%-35% of the Type 1 diabetics using a pump of some sort, the main competition for Insulet continues to be multiple daily injections, either with a syringe or an insulin pen. Our discussions with industry and clinical experts leads us to believe that most of Insulet’s 35,000 patients in the last 6 years have been predominantly market expanding rather than share steal. Insulet management states that roughly 70% of OmniPod users are first time pumpers Medtronic stands out as the largest participant in the insulin pump market with ~70% US market share. Medtronic’s product is the only to include built-in CGM capabilities. Al Mann’s MiniMed (now Medtronic) was the pioneer in developing the market for small, safe, insulin pumps. Since the introduction, the market has grown more slowly than originally anticipated. We estimate roughly 30-35% of the US Type 1 market is “on pump”. We believe pump penetration of pumps has been “slow and steady” over the last decade with minor accelerations in conjunction with new system introductions and technological advancements. We see the two most notable introductions as the initial “patch pump” introduction in 2005 by Insulet and CGM (continuous glucose monitoring) integration by Medtronic in 2007. In the US market, we estimate JNJ Animas at 15% market share, Insulet at 10%, and the remaining 5 % divided among Roche (Disetronic)
Manufacturing
Disadvantages
Insulin Delivery Market
Competitive Insulin Pump Market Dynamics
Page 7 of 22Insulet Corporation
Company Note March 22, 2012
and smaller players. Roche, is the number 2 market share holder OUS, but has struggled in the last several years in the US, mostly due to regulatory problems.
Medtronic MiniMed: Medtronic purchased MiniMed in 2001 for $3.1 billion, with other related assets taking the total to close to $3.7 billion. Then and now, Medtronic MiniMed has the leading market share. We estimate MDT with roughly 70% of the pump market in the US and slightly less Worldwide. MiniMed is a prime example of first to market benefits. MDT’s pump is a good one, and has some nice to have features that others do not (e.g. CGM). But in our opinion, the market franchise strength comes from the customer service side. Medtronic provides full online and phone support for all MiniMed pump customers with ongoing contact with the user and/or the caregiver. Because of this ongoing relationship, Medtronic knows precisely when a customer is eligible for reimbursement of a new pump. MDT has a high rate of retention (we estimate greater than 90%) for a number of reasons, but primarily due to the relationship built over the years between the company and the customer. JNJ Animas: JNJ purchased Animas in 2006 for $518 Million. We estimate that Animas has the 2nd largest pump share in the US and in some countries OUS. It is a slightly smaller pump, with a color screen and more waterproof. In the US, we estimate Animas has a 15% market share. Roche Disetronic: We estimate Roche is has the #2 market share in many countries outside the US, but has struggled with regulatory issues inside the US. In the patch pump segment Roche purchased Medingo in 2010, for a reported $160 million. The Medingo Solo® patch pump is similar in concept to Insulet’s OmniPod, and has FDA approval, but it has not been commercially launched. We believe that changes that Roche is employing to the Solo to make it more customer and mass production friendly, will also slow FDA clearance for the changed device. While Solo could launch in 2012, Roche has been historically slow in obtaining pump related clearances, and thus a 2013 or later approval is more likely in our opinion.
Exhibit 5
INSUL IN PUMP MARKET SHARE (U .S . )
Source: Piper Jaffray Estimates
Page 8 of 22Insulet Corporation
Company Note March 22, 2012
Others: Worldwide there are a dozen small players in the traditional pump market. However, in our opinion, without the resources to supply 24/7 service and training coverage, it will be difficult for many to break away from the crowd. Two recent FDA approved pumps, one from Tandem Diabetes, the other from Asante are newer innovations, and have solid VC backing. We expect launches of these smaller, easier to use traditional pumps in 2012. But for patch pumps, other than Valeritas (focusing their 2012 launch on the Type 2 market), we see Insulet standing alone in the US Type 1 patch pump market. For Insulet investors the threat of direct patch competition has existed since the IPO in 2006. But none have made it through the FDA gauntlet. Once through, the disposable pump monopoly that PODD enjoys will be diluted. But, without a large investment in marketing (training, education, customer service), we do not believe the Insulet/OmniPod franchise will be meaningfully impacted. Medtronic and Roche (Medingo) have patch pumps developed, but launch schedules in the US have been postponed repeatedly. New players, including Cellnovo, ST MicroElectronics’ Jewel Pump™, and others will need to make considerable manufacturing and marketing investments once US regulatory hurdles have been overcome. We noted 32 listings when we searched recently for “artificial pancreas” at www.clinicaltrials.gov. The intensity of effort to develop this holy grail is as great as we have seen in decades. Part of the increased attention is due to the realization that with the availability of viable CGM systems, there now appears to be technology answers for a mechanical version of an artificial pancreas, or closed loop system. “Closed loop” refers to a system that does not require human interaction, but measures the appropriate parameters (including blood glucose), and then calculates and delivers the appropriate amount of insulin automatically. We have long thought that the legal issue of delivering an accidental over-dose of insulin by a computer program would be too great to overcome from a commercialization standpoint. After talking with some of those involved in the projects, the solution appears to be double and maybe triple redundancy. In other words, the design would be so that a fail-safe mode would be in place, and not reliant on a single algorithm, but on separate methods to catch/stop an insulin overdose. MDT has a pump already commercialized in Europe that has hypoglycemic automatic shutoff—in other words, with CGM on board the pump ”knows” to shut down insulin release when glucose levels reach dangerously low levels. The first closed loop systems will most likely be for overnight use where early clinical data are showing improvement in fewer hypo episodes and fewer excursions out of the norm. Insulet is working to advance a smarter pod and is engaged in artificial pancreas research. As a first step we expect Insulet to have DexCom’s CGM system integrated sometime in 2014. Advancing a smart pump algorithm would be the next step beyond the CGM integration. Insulet’s pod system may be well suited to some of the artificial pancreas research that is looking into dual hormone delivery. One could envision a pod for insulin and another inter-communicating pod for glucagon perhaps. We do not anticipate a truly closed loop system to be commercialized in the US in the near term. Features of the artificial pancreas including low glucose auto-off and night time auto-monitoring may offer competitive issues for Insulet when/if these features are commercialized in the US. The OmniPod platform has started with insulin for treatment of diabetes, but we could envision other drugs that might be delivered. OmniPod is being developed in Europe by Ferring Corporation as a possible delivery method for an infertility drug. Other potential
The Role of the Artificial Pancreas
Future Opportunities?
Page 9 of 22Insulet Corporation
Company Note March 22, 2012
applications could include: pain management, multiple sclerosis drugs, and thyroid or growth hormones. However, we do not believe that any new applications are in development and, appropriately, the stock valuation does not reflect any contribution from anything other than the continued development of the diabetes opportunity.
EARNINGS OUTLOOK
PODD’s Q4 revenue of $47.2M fell just shy of consensus, a common occurrence for PODD in 2011. Organic growth has been somewhat obscured by the recent Neighborhood Diabetes (ND) acquisition, which was ~$12.5M (26%) of revenue during the quarter. We believe OmniPod revenue was up 30% - 32% yr/yr during the quarter which also included a small contribution from Ypsomed (International). Also in the revenue mix was ~$1.6M from Abbott due to licensing in connection with each sale of PDM devices that include an Abbott Blood Glucose Monitor. Operating expenses were a mixed bag, as the company digests the ND acquisition, which is responsible for the majority of the 725 bp yr/yr contraction in GM during Q411, as well as a ~385 bp increase in G&A as a percentage of sales. Signs of operating leverage potential include a ~370 bp and ~420 bp reduction in R&D and Sales & Marketing.
Q4 Results a Mixed Bag
Exhibit 6
Q411 EARNINGS OVERVIEW ($ Millions)
Source: Company Reports Piper Jaffray Estimates
Page 10 of 22Insulet Corporation
Company Note March 22, 2012
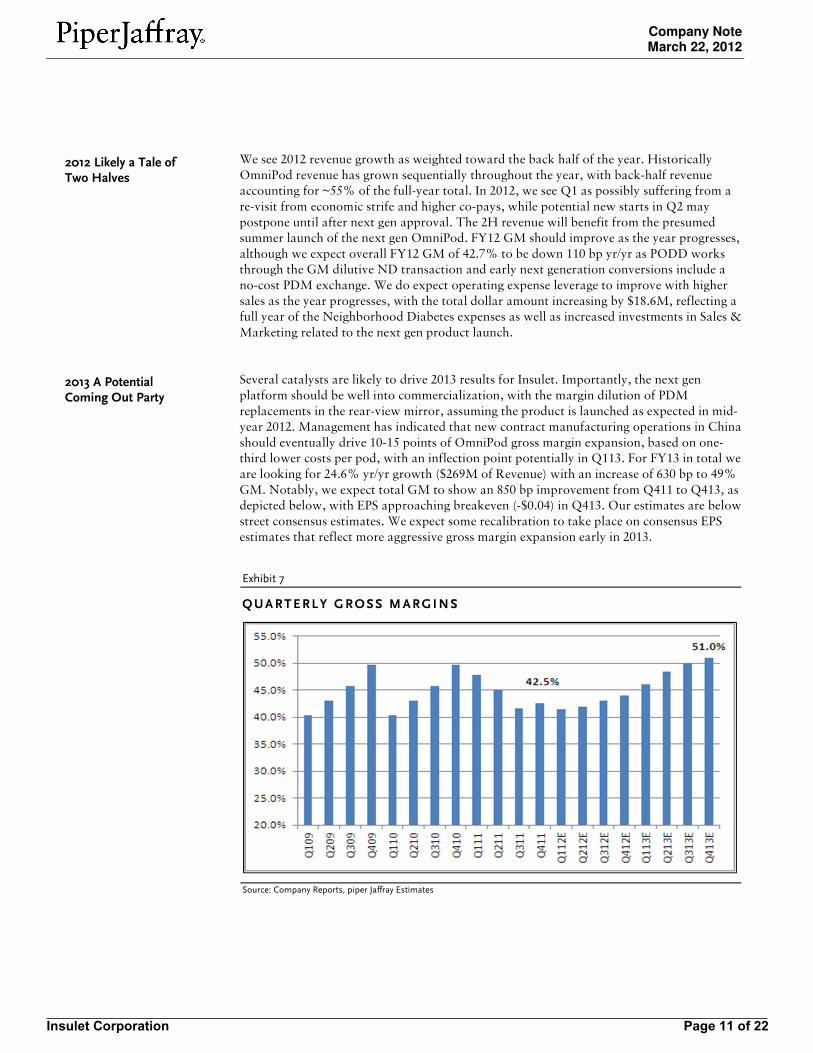
We see 2012 revenue growth as weighted toward the back half of the year. Historically OmniPod revenue has grown sequentially throughout the year, with back-half revenue accounting for ~55% of the full-year total. In 2012, we see Q1 as possibly suffering from a re-visit from economic strife and higher co-pays, while potential new starts in Q2 may postpone until after next gen approval. The 2H revenue will benefit from the presumed summer launch of the next gen OmniPod. FY12 GM should improve as the year progresses, although we expect overall FY12 GM of 42.7% to be down 110 bp yr/yr as PODD works through the GM dilutive ND transaction and early next generation conversions include a no-cost PDM exchange. We do expect operating expense leverage to improve with higher sales as the year progresses, with the total dollar amount increasing by $18.6M, reflecting a full year of the Neighborhood Diabetes expenses as well as increased investments in Sales & Marketing related to the next gen product launch. Several catalysts are likely to drive 2013 results for Insulet. Importantly, the next gen platform should be well into commercialization, with the margin dilution of PDM replacements in the rear-view mirror, assuming the product is launched as expected in mid-year 2012. Management has indicated that new contract manufacturing operations in China should eventually drive 10-15 points of OmniPod gross margin expansion, based on one-third lower costs per pod, with an inflection point potentially in Q113. For FY13 in total we are looking for 24.6% yr/yr growth ($269M of Revenue) with an increase of 630 bp to 49% GM. Notably, we expect total GM to show an 850 bp improvement from Q411 to Q413, as depicted below, with EPS approaching breakeven (-$0.04) in Q413. Our estimates are below street consensus estimates. We expect some recalibration to take place on consensus EPS estimates that reflect more aggressive gross margin expansion early in 2013.
2012 Likely a Tale of Two Halves
2013 A Potential Coming Out Party
Exhibit 7
QUARTERLY GROSS MARGINS
Source: Company Reports, piper Jaffray Estimates
Page 11 of 22Insulet Corporation
Company Note March 22, 2012
FINANCIAL POSITION
Consistent with our expectation of a gross margin inflection point in 2013, we expect 2013 to represent a key year for PODD in terms of a transition to positive EBITDA and FCF. PODD reported a slight net debt position 4Q11, based on ~$94M of Cash & equivalents, and convertible debt of $108.5M. The main convertible notes were issued in June of 2011, with a principal amount of $143.75M due in June of 2016. PODD used ~$86M of the proceeds to repurchase $70M of face value convertible notes that were scheduled to mature in June 2013, with a $15M principal amount still outstanding on that issue leaving $158.75 of principal outstanding. At the same time of the convertible offering PODD completed a public offering of ~1.15M shares of common stock related to the Neighborhood diabetes acquisition. Additionally, the company completed a 3M share secondary in December of 2010. Management has expressed confidence that current cash on hand is sufficient to reach profitability. We expect that the company will continue to generate negative operating cash flows for the first half of CY12, with the potential for breakeven operating cash flow in Q412. Capex should remain relatively flat in the 11M – 12M range for both CY12 and CY13. During CY13 we expect PODD to generate positive EBITDA of $16.6M and FCF of $17M with positive FCF beginning in Q213. As of 2011 Insulet had $394.1 million net operating loss (NOL) carryforwards; $372.3 million of the total amount are federal NOL carryforwards which will begin to expire in 2020 and continue through 2031.
Sufficiently Capitalized for Transition to Profitability
Exhibit 8
F INANCIAL OVERVIEW ($ Millions)
*Based on book value of convertible notes
Source: Company Reports, Piper Jaffray Estimates
Page 12 of 22Insulet Corporation
Company Note March 22, 2012
COMPANY OVERVIEW
Insulet was established in 2000 in Bedford, Massachusetts and completed an initial public offering in May of 2007 raising net proceeds of $113.8M. The company develops, manufactures, and markets the OmniPod insulin infusion system for insulin dependent diabetics. The OmniPod system features two components, an insulin delivery pump and a handheld controller that communicate wirelessly. The majority of Insulet revenue comes from OmniPod sales and Neighborhood Diabetes, as depicted in Exhibit 6, with a licensing agreement from Abbott accounting for ~$1.5M of the other category. In January of 2010 Insulet signed an exclusive international OmniPod distribution agreement with Ypsomed for nine countries across Europe and China and Australia. The agreement calls for $100 million of guaranteed minimum total sales through Jan 2015.
In June of 2011, PODD completed an acquisition of Neighborhood Diabetes (ND) a direct to consumer durable medical equipment distributor of diabetes supplies for total consideration of ~$63M in cash and stock. Neighborhood Diabetes is based in Woburn, Massachusetts, with offices in Brooklyn, NY and Orlando, FL. The company serves more than 60,000 Type1 and Type 2 diabetics primarily in the northeast and southeast regions of the United States with a business model that supplements a wide breadth of diabetes management products with education and support services. Roughly 25% or 15k of ND’s clients are insulin dependent with the majority of these individuals using multiple daily injections. ND had $61.8M of annual revenue representing ~17% yr/yr growth, with operating income of $3.9 million according to the press release at the time of the acquisition. Referrals from competing pump manufacturers have produced some revenue contraction post the acquisition, but management has pointed to 10%-15% yr/yr growth for ND moving forward
Neighborhood Diabetes
Exhibit 9
Q411REVENUE BREAKDOWN ($ Millions)
Source: Company Reports, Piper Jaffray Estimates
Page 13 of 22Insulet Corporation
Company Note March 22, 2012
INDUSTRY OVERVIEW
To understand Insulet, and the insulin pump market, requires some basic understanding of the diabetes market. Diabetes is a complex disease, with multiple variations in clinical presentation. Other than pancreas transplant, there is no cure for Type 1 diabetes; it is a chronic disease and requires chronic, daily management. Diabetes is estimated to affect more than 340 million people worldwide and has a 1% annual mortality rate, according to the World Health Organization. The US Department of Health and Human Services has indicated total prevalence of diabetes in the U.S. of 25.8 million, broken down into 18.8 million diagnosed with diabetes and an additional 7.0 million living with the disease, but not yet diagnosed. Data show that between 5 and 10 percent of diagnosed cases are for Type 1 diabetes while the remaining 90% to 95% are Type 2 diabetes. Roughly 1.9 million people are diagnosed with diabetes every year in the U.S. alone, the vast majority with Type 2 diabetes. According to the CDC, new pediatric diagnoses (under age 10) of Type 1 diabetes are roughly 15,600 annually. Diabetes represents a condition in which the body is unable to sufficiently control levels of glucose (sugar) in the bloodstream. Cellular uptake of glucose is facilitated by the hormone insulin, which in a healthy person is produced by the pancreas. Type 1 diabetes is marked by the body's inability to produce sufficient amounts of insulin (if any at all), whereas in Type 2 diabetes the pancreas is producing insulin, but the body's tissues are resistant to its utilization to control glucose levels. Why does it matter? An excess amount of glucose in the blood (called hyperglycemia) combined with wide swings in blood glucose concentrations over a sustained period of time can have serious consequences. Glycosylated Hemoglobin A1c or HbA1c is the commonly accepted measure to determine how well diabetes is controlled. When diabetes is not well controlled and blood sugar is too high, it combines with hemoglobin causing it to become “glycosylated”. HbA1c tests measure glycosylated hemoglobin to determine the average amount of sugar over some period, typically 120 days. Normal HbA1c for non-diabetics is within the range of 4% - 6%. Clinical data support HbA1c’s of less than 7% for diabetics for the most favorable outcomes and avoidance of diabetes related outcomes such as heart attacks, strokes, retinopathy, kidney failure, peripheral neuropathy, and amputation. So where do insulin pumps fit in? Since Type 1 diabetics are unable to produce insulin themselves, they are required to supply insulin to the body from an external source – whether this is accomplished through multiple daily injections or insulin pump therapy. Thus the population of Type 1 diabetics, which we estimate to be 1.3 million in the U.S. and 20 million worldwide, is the primary target market for insulin pump therapy. Type 2 diabetes is usually treated through exercise, diet management, and oral medications in the earlier stages of the disease. Type 2 diabetes can progress to a stage where the body no longer produces enough insulin. It is estimated that between 4 and 5 million of the 12 million diagnosed with Type 2 diabetes in the U.S. may require insulin on a daily basis. The DCCT (Diabetes Control and Complications Trial) and the UKPDS (United Kingdom Prospective Diabetes Study) studies have shown that maintaining blood glucose levels as close to normal as possible can significantly delay the onset and reduce the severity of complications in both Type 1 and Type 2 diabetes. One of the most efficient means of
Diabetes: A Growing Epidemic
Insulin Delivery Opportunity
Page 14 of 22Insulet Corporation
Company Note March 22, 2012
maintaining blood glucose levels in a normal range is through the use of an insulin pump, since the pump can be used to more accurately reflect the normal functions of the pancreas, through supplying an ongoing minimal supply of insulin (basal), with increased insulin supplied at the time of food intake through boluses. Of note, studies suggest that more than 50% of professionals working in the diabetes industry, who have diabetes themselves, utilize an insulin pump to manage the disease – a strong testament to the value of pump therapy. All that said, both the Type 1 population and the insulin-dependent Type 2 population are underpenetrated by insulin pump therapy. The ~$4.0B insulin delivery market is dominated by syringes and pens, although we believe the insulin pump market opportunity is currently ~$1.1B with approximately 420,000 diabetics in the U.S. currently using an insulin pump, most of which being Type 1 patients, representing roughly a 30% -33% penetration of the Type 1 market. We estimate worldwide pump market growth of 5-10% over the next several years. Traditional insulin pumps consist of the pump mechanism that also includes the insulin reservoir, batteries and the user control interface (usually worn on a belt or in a small pocket), an infusion set that is the site of subcutaneous insulin delivery (attached by adhesive and including a short cannula that is placed just under the skin, and tubing connecting the two. The pumps carry enough insulin for 3 days or more of short acting insulin. The onboard computer chip can be programmed to deliver an ongoing basal rate of insulin, and varying amounts of an insulin bolus can be supplemented at any time, often before meals, without the need of a separate injection system. Traditional pumps are priced at approximately $6,000-$7,000. Pump supplies cost roughly $125/month. Insurance companies generally cover the majority of the costs and will allow pump replacement at 4 year cycle. While insurance programs differ widely, we assume a 20% co-pay is required out of pocket on all items. We concur with industry experts that have noted that the downturn in the economy has had an impact on pump use, both attrition and on new starts. Insulin injection by hypodermic needle was the standard for decades. Insulin pumps were introduced in the 1970s. The pumps gained traction with the publication of the DCCT Study in 1994, which demonstrated better health outcomes with intensive glycemic treatment. Insulin pumps allow for easier intensive control in many diabetics. The majority of diabetics use multiple daily injection, or MDI. In the past few years, more convenient insulin pens and long acting insulin analogs have been developed that make injection faster and easier. Injection pens come in a variety of types and sizes, pre-filled or reusable, short, medium and long acting, as well as mixes of insulin analogs. We believe the convenience, lower cost, and simplicity of these injection pens has been one of the major factors in keeping pump penetration below 50%, even after 30 years on the market.
INVESTMENT RISKS
Regulatory Delays. PODD’s high profile next gen launch has been plagued by delays related to regulatory approval in the United States, as insulin pumps have faced increased scrutiny in recent years. While approval later this year appears likely for Insulet’s next generation system, timing remains in question. Additionally, manufacturing of the next gen product could experience delays or not adequately meet demand, resulting in additional delays post-approval and possible loss of market share.
Page 15 of 22Insulet Corporation
Company Note March 22, 2012
Current Competitive Environment. Current insulin pump competitors are larger, and better funded than Insulet. Medtronic, Animas(JNJ) and Roche all currently have higher worldwide market share than Insulet, and could make it difficult for Insulet to compete despite Insulet’s differentiated tubeless technology. Competing Pump Patch Products: Medtronic and Roche (Medingo) could commercialize competing patch pumps in the United States. Roche is planning to commercialize a next gen version of their Medingo patch pump in the United States likely in the 2013/2014 timeframe. Medtronic is also in development of a competing patch pump. While the entrance of a second competing patch pump could elevate awareness of the category as a whole, it could also elevate already fierce competition, harming PODD’s overall market share. Reimbursement: Private insurance company changes in deductibles, co-pays and the overall out of pocket costs for diabetes care could have a negative impact on Insulet. U.S. Economic Conditions: The U.S. economy remains somewhat sluggish as it recovers from a severe recession, with tepid consumer spending being the norm. Economic uncertainty and lackluster job growth could continue to negatively impact PODD’s current and future customers, forcing them to use multiple daily injections (MDI) or other less costly therapies than OmniPod to manage their diabetes. History of Operating Losses: PODD has been unprofitable for the duration of its history, including operating losses of $34.2M in FY10 and $39.2M in FY11. While we expect operating losses to improve in FY12 and approach breakeven during 2HFY13, PODD may need to raise additional funds in the future, although management remains confident no additional cash is required to achieve profitability.
Page 16 of 22Insulet Corporation
Piper Jaffray
Thom Gunderson (612) 303-6467
Brooks West (612) 303-6954
Daniel Garofalo (612) 303-6956Insulet Corporation (PODD)Income Statement
Net increase (decrease) in cash and cash equivalents (37.9) 71.3 (14.7) (8.8) 2.3 (2.9) (9.9) (19.3) (14.3) (11.3) (3.1) (3.1) (31.8) 1.2 (9.3) 8.5 8.9 9.4
Cash and cash equivalents at beginning of period 94.6 56.7 128.0 113.3 104.5 106.7 103.8 113.3 94.0 79.7 68.4 65.3 94.0 62.2 63.4 54.1 62.6 62.2
Cash and cash equivalents at end of period 56.7 128.0 113.3 104.5 106.7 103.8 94.0 94.0 79.7 68.4 65.3 62.2 62.2 63.4 54.1 62.6 71.5 71.5
3/20/2012
Page 19 of 22Insulet Corporation
Company NoteMarch 22, 2012
Important Research Disclosures
Notes: The boxes on the Rating and Price Target History chart above indicate the date of the Research Note, the rating, and the price target. Each boxrepresents a date on which an analyst made a change to a rating or price target, except for the first box, which may only represent the first Note written duringthe past three years.
Legend:
I: Initiating Coverage
R: Resuming Coverage
T: Transferring Coverage
D: Discontinuing Coverage
S: Suspending Coverage
OW: Overweight
N: Neutral
UW: Underweight
B: Buy (Piper Jaffray discontinued use of the B, N, and S ratings on June 30, 2009)
N: Neutral
S: Sell
AL On/AL Off: Placed on/removed from the Alpha List maintained by Piper Jaffray (AL use discontinued March 2010)
NA: Not Available
UR: Under Review
Distribution of Ratings/IB Services
Piper Jaffray
IB Serv./Past 12 Mos.
Rating Count Percent Count Percent
BUY [OW] 355 55.99 63 17.75
HOLD [N] 245 38.64 22 8.98
SELL [UW] 34 5.36 0 0.00
Note: Distribution of Ratings/IB Services shows the number of companies currently in each rating category from which Piper Jaffray and its affiliates receivedcompensation for investment banking services within the past 12 months. FINRA rules require disclosure of which ratings most closely correspond with"buy," "hold," and "sell" recommendations. Piper Jaffray ratings are not the equivalent of buy, hold or sell, but instead represent recommended relativeweightings. Nevertheless, Overweight corresponds most closely with buy, Neutral with hold and Underweight with sell. See Stock Rating definitions below.
Page 20 of 22Insulet Corporation
Company NoteMarch 22, 2012
Important Research DisclosuresAnalyst Certification — Thomas J. Gunderson, Sr Research AnalystAnalyst Certification — Brooks E. West, Sr. Research AnalystAnalyst Certification — Daniel F. Garofalo, Research AnalystAnalyst Certification — Michael Dinerman, M.D., Research AnalystThe views expressed in this report accurately reflect my personal views about the subject company and the subject security. In addition, no part of mycompensation was, is, or will be directly or indirectly related to the specific recommendations or views contained in this report.
Research DisclosuresPiper Jaffray was making a market in the securities of Insulet Corporation at the time this research report was published. Piper Jaffray will buy and sellInsulet Corporation securities on a principal basis.
Affiliate Disclosures: This report has been prepared by Piper Jaffray & Co. and/or its affiliate Piper Jaffray Asia Securities Limited, both of which aresubsidiaries of Piper Jaffray Companies (collectively Piper Jaffray). Piper Jaffray & Co. is regulated by FINRA, NYSE, and the United States Securities andExchange Commission, and its headquarters is located at 800 Nicollet Mall, Minneapolis, MN 55402. Piper Jaffray Asia Securities Limited is a licensedcorporation regulated by the Securities and Futures Commission of Hong Kong ("SFC"), entered on the SFC's register, no. ABO154, and is an exchangeparticipant of The Stock Exchange of Hong Kong Limited. Its headquarters is located at Suite 1308, 13/F Two Pacific Place, 88 Queensway, Hong Kong.Disclosures in this section and in the Other Important Information section referencing Piper Jaffray include all affiliated entities unless otherwise specified.
Piper Jaffray research analysts receive compensation that is based, in part, on overall firm revenues, which include investment banking revenues.
Rating DefinitionsStock Ratings: Piper Jaffray ratings are indicators of expected total return (price appreciation plus dividend) within the next 12 months.At times analysts may specify a different investment horizon or may include additional investment time horizons for specific stocks. Stockperformance is measured relative to the group of stocks covered by each analyst. Lists of the stocks covered by each are available atwww.piperjaffray.com/researchdisclosures. Stock ratings and/or stock coverage may be suspended from time to time in the event that thereis no active analyst opinion or analyst coverage, but the opinion or coverage is expected to resume. Research reports and ratings shouldnot be relied upon as individual investment advice. As always, an investor’s decision to buy or sell a security must depend on individualcircumstances, including existing holdings, time horizons and risk tolerance. Piper Jaffray sales and trading personnel may provide writtenor oral commentary, trade ideas, or other information about a particular stock to clients or internal trading desks reflecting different opinionsthan those expressed by the research analyst. In addition, Piper Jaffray technical research products are based on different methodologiesand may contradict the opinions contained in fundamental research reports.
• Overweight (OW): Anticipated to outperform relative to the median of the group of stocks covered by the analyst.
• Neutral (N): Anticipated to perform in line relative to the median of the group of stocks covered by the analyst.
• Underweight (UW): Anticipated to underperform relative to the median of the group of stocks covered by the analyst.
An industry outlook represents the analyst’s view of the industry represented by the stocks in the analyst’s coverage group. A Favorableindustry outlook generally means that the analyst expects the fundamentals and/or valuations of the industry to improve over the investmenttime horizon. A Neutral industry outlook generally means that the analyst does not expect the fundamentals and/or valuations of the industryto either improve or deteriorate meaningfully from its current state. An Unfavorable industry outlook generally means that the analystexpects the fundamentals and/or valuations of the industry to deteriorate meaningfully over the investment time horizon.
Page 21 of 22Insulet Corporation
Company NoteMarch 22, 2012
Other Important InformationThe material regarding the subject company is based on data obtained from sources we deem to be reliable; it is not guaranteed as to accuracy and doesnot purport to be complete. This report is solely for informational purposes and is not intended to be used as the primary basis of investment decisions.Piper Jaffray has not assessed the suitability of the subject company for any person. Because of individual client requirements, it is not, and it should not beconstrued as, advice designed to meet the particular investment needs of any investor. This report is not an offer or the solicitation of an offer to sell or buyany security. Unless otherwise noted, the price of a security mentioned in this report is the market closing price as of the end of the prior business day. PiperJaffray does not maintain a predetermined schedule for publication of research and will not necessarily update this report. Piper Jaffray policy generallyprohibits research analysts from sending draft research reports to subject companies; however, it should be presumed that the analyst(s) who authoredthis report has had discussions with the subject company to ensure factual accuracy prior to publication, and has had assistance from the company inconducting diligence, including visits to company sites and meetings with company management and other representatives.
This report is published in accordance with a conflicts management policy, which is available at http://www.piperjaffray.com/researchdisclosures.
Notice to customers: This material is not directed to, or intended for distribution to or use by, any person or entity if Piper Jaffray is prohibited or restrictedby any legislation or regulation in any jurisdiction from making it available to such person or entity. Customers in any of the jurisdictions where Piper Jaffrayand its affiliates do business who wish to effect a transaction in the securities discussed in this report should contact their local Piper Jaffray representative.Europe: This material is for the use of intended recipients only and only for distribution to professional and institutional investors, i.e. persons who areauthorised persons or exempted persons within the meaning of the Financial Services and Markets Act 2000 of the United Kingdom, or persons who havebeen categorised by Piper Jaffray Ltd. as professional clients under the rules of the Financial Services Authority. Asia: This report is distributed in HongKong by Piper Jaffray Asia Securities Limited, which is regulated by the Hong Kong SFC. This report is intended only for distribution to professional investorsas defined in the Hong Kong Securities and Futures Ordinance and is for the use of intended recipients only. United States: This report is distributed inthe United States by Piper Jaffray & Co., member SIPC, FINRA and NYSE, Inc., which accepts responsibility for its contents. The securities described inthis report may not have been registered under the U.S. Securities Act of 1933 and, in such case, may not be offered or sold in the United States or to U.S.persons unless they have been so registered, or an exemption from the registration requirements is available.
This report is produced for the use of Piper Jaffray customers and may not be reproduced, re-distributed or passed to any other person or published inwhole or in part for any purpose without the prior consent of Piper Jaffray & Co. Additional information is available upon request.
Copyright 2012 Piper Jaffray. All rights reserved.