37
Piramal Enterprises Limited Investor Presentation January 2013

Piramal Enterprises Limited
Investor Presentation
January 2013

Piramal Enterprises – an overview:
Piramal Enterprises
Pharma Financial Services
Equity Investment In Vodafone India –Rs. 5,862 crores
Information Management
2
PharmaSolutions
CriticalCare
OTC
• Partners with MNC pharma cos to service their mfg & development needs
• Sales – Rs. 13.5 bn
• Sells anesthetic products to hospitals globally
• Sales –Rs. 4.1 bn
• Sells OTCdrugs in India
• Sales – Rs. 1.4 bn
Life Sciences
• Has a pipeline of 16 compounds with 8 in clinical trials
• Received approval for cartilage repair gel –BST-Cargel®
NBFC Indiareit
• NBFC focused on lending to Real estate sector
• Book of Rs. 8.5 billion
• A Real Estate PE fund with domestic and offshore fund
• Total AUM – Rs. 42 billion
DRG
• Provides research, predictive analytics via proprietary databases & consulting to healthcare sector
• Sales (E) -$ 160 mn

Pharma Segment
3
Pharma Segment

Pharma Solutions
4
Pharma Solutions

Market Characteristics
• Global Outsourcing market estimated to be USD 32 billion, growing at 12%
• Market share of India extremely low
• Lower costs and high quality manufacturing skill presents compelling
rationale to shift manufacturing to India
• Cost pressures on big pharma due to patent expiries leading to
opportunities for Indian CMOs
India CMOs SizeGlobal Outsourcing Market Size
5Source: Business Insights 2012
India CMOs SizeGlobal Outsourcing Market Size
31.9
64.0
0
10
20
30
40
50
60
70
Year 2011 Year 2017
USD Bn
1.8
5.3
0
1
2
3
4
5
6
Year 2011 Year 2017
USD Bn

A full-service CMO across the drug life-cycle
Early Phase Custom Synthesis and Formulations Development Full scale supplies
Discovery Research
Pre-clinical Dev.API
Phase IAPI
Phase IIaAPI
Phase IIb Phase III Launch
CLINICAL DEVELOPMENT
Medicinal Chemistry
Pre-clinical Dev.Forms
Clinical Trials Formulations
Formulations development
APIAPI API
Medicinal
6
API
• Canada – Torcan
• UK – Morpeth,
• India – Ennore
Formulations
• UK – Morpeth
• India - Ahmedabad
API
•Canada - Torcan
•UK – Morpeth,
• India – Ennore,
Formulations
•UK – Morpeth
• India – Ahmedabad
API
• Torcan (niche APIs only)
• Morpeth,
• Digwal, Ennore
Formulations
• Morpeth
• Pithampur
Medicinal & Synthetic Chemistry Services –India -Ahmedabad
API
• Canada – Torcan
• UK – Morpeth
• India – Ennore
Formulations
• UK – Morpeth
• India - Ahmedabad
API
•Canada - Torcan
•UK – Morpeth,
• India – Ennore,
Formulations
•UK – Morpeth
• India – Ahmedabad
API
• Torcan (niche APIs only)
• Morpeth,
• Digwal, Ennore
Formulations
• Morpeth
• Pithampur
Medicinal & Synthetic Chemistry Services –India -Ahmedabad
Sales break-up (Rs. In crores) FY2012 Growth
Pharma Solutions 1,355 32.7%
From assets in India 801 52.7%
From assets outside India 554 11.6%

UNITED KINGDOMMorpeth
•API development & manufacturing
•Formulation development
•Commercial formulation manufacturing
•Clinical Trial supplies & distribution
Grangemouth
•Antibody Drug Conjugates development &
manufacturing
CANADAToronto
•API development & manufacturing
RM supplies
Pharma Solutions – Global Footprint
7
INDIAMumbai R&D
•API development
•Formulation development
Chennai
•API development & manufacturing
Hyderabad
•API manufacturing
•Ahmedabad
•Drug Discovery Services
•Formulations Development
•Clinical Trial manufacturing
•Pithampur
•Commercial formulation manufacturing
CHINAShanghai
•Sourcing Office
RM supplies
Critical CareCritical Care
8

Critical Care - expanding product portfolio and enhancing geographic reach
Geographies
/Products
Halothane
Isoflurane
Enflurane
Sevoflurane
US EU RoW
� � �
� � �
US EU RoW
� � �
� � �
� � �
�
US EU RoW
� � �
� � �
� � �
� � �
Addressable Market Opportunity $ Million
100 550 1,800
Desflurane
Propofol �
� � �
� � �
2006 2011 2016
9

Critical Care – Infrastructure in place for sustained rapid growth
38 Managers
32 Sales Field Force
84 Distributors
10
Products Products
Manufactured
Approvals/Certific
ation
Bethlehem USFDA, AFSSAPS
Digwal US FDA, WHO,
UKMHRA, MCC
Ambernath (BSV) WHO
Baddi (Abbott) UKMHRA
Sevoflurane PropofolEnflurane Isoflurane HalothaneDesflurane Haemaccel
(Rs. In crores) FY2012 Growth
Critical Care Sales 413 6.4%

OTC Business
11
OTC Business

OTC – Strong Track Record
• Lacto Calamine
won coveted
•Strong brand portfolio across various high growth segments
•Moved from no. 40 in 2008 to top-10 in 2011
• Field force expansion to improve distribution to 4 lakh chemists and
cover all 485 1 lakh+ towns in India
12
won coveted
2010 REBRAND
100 Winner
•Successful Rx to
OTC
transformation
for Polycrol,
Tetmosol and
Supractiv

Life Sciences
13

PEL is making progress in Life Sciences space
� Received the European CE mark approval for the innovative bio-orthopaedic
product for cartilage repair - BSTCarGel ®.
� Acquired molecular imaging development portfolio of Bayer pharma which includes rights to Florbetaben – a final stage Phase III clinical trial molecule.
� 16 other products under development in various stages in areas of Oncology, Metabolic Disorders, Inflammation and Anti-infectives
14
Metabolic Disorders, Inflammation and Anti-infectives
� Our lead molecule for P276 is currently undergoing Phase I/II clinical trials for
multiple indication of cancer: Pancreatic Cancer, Radiation induced Mucositis
� Potential Market size: >$ 2 billion;
� Started Phase II clinical trials for P276 for reduction of serious radiation
induced mucositis in patients of head and neck cancer receiving
chemoradiation
Annual spend : Rs. 230 – Rs. 250 crores

BST-CarGel® will be the first patented product to be launched from PEL� A novel bioscaffold for advanced cartilage regeneration that has clinically demonstrated consistently higher quality cartilage repair
� An EU class III medical device, it is a liquid scaffold which, combined with the patient’s whole blood, is then implanted into a debrided cartilage lesion prepared with bone marrow access
� Received European CE mark regulatory approval in April 2012
� Plans to commercially launch in the fourth quarter of the 2012 calendar year
� Filed for regulatory approval to sell in Canada and will soon file in India
Damaged CartilageBefore Treatment
CartilageAfter Treatment
Current European Market Potential
The CE mark enables us to access a potential $ 200 mn market in Europe.
While we can sell in all EU countries, the largest markets in Europe for BST-CarGel® are: UK, Germany, France, Spain, and Italy
MRI of patient treated with CarGel
15

� Acquired leading portfolio of molecular imaging tracers from Bayer AG – forming
subsidiary Piramal Imaging
� Lead compound Florbetaben - final stage Phase III molecule
� Reliably detects Beta-Amyloid in the brain, which is the pathological hallmark
of disease in probable Alzheimer's disease patients
� Potential tool to aid in diagnosis and assessment of Alzheimer’s disease
� Early diagnosis can both improve patients’ quality of life and reduce
healthcare costs
Piramal Imaging – Acquisition of Bayer’s molecular imaging development portfolio
healthcare costs
� Positive Phase III results presented on April 25 at American Academy of
Neurology Annual Meeting
� Potential Market size: $ 1.5 billion
� Earliest regulatory filing: 2012
� Other assets include strong pipeline of PET imaging tracers in CNS, Oncology, and
Cardiovascular diseases
� Core members of Bayer’s R&D team have joined Piramal Imaging leadership team
� Manufacturing & distribution alliance formed with IBA Molecular, a world leader in
Nuclear Medicine 16

Financial Services
17

PHL Finance:
Real Estate SME
� Lending to quality real estate
developers
� To foray into funding
education sector from FY13
PHL Finance: An overview
developers
� Currently focusing on Mumbai,
Pune, Bangalore and Chennai
�Not >25% of total assets towards
commercial and retail projects
� Book as on 30th September 2012:
Rs. 849 crores
education sector from FY13
� Fund established educational
institutions for growth,
upgrading facilities
�Newer verticals to be added
18

� Mr. A. K. Purwar – Chairman, PHL Finance:ex-Chairman of SBI with 40+
� Credit Committee
� Members who are experts in their fields: Mr. Deepak Satwalekar, Mr. A.
K. Purwar and Mr. Ajay Piramal
� Management team with vast banking experience
Strong systems & process in place now…..
years of experience in Banking and financial services
� Mrs. Sudha Ravi – CE0, over 30 years of banking experience
� Specialized team under them – specialists in real estate sector, education
Sector, relationship managers and compliance officer with deep knowledge
Of Banking and compliance
� Well defined processes – Loan Policy approved by Board
� Independent audit – pre and post disbursement
19

� Highly experienced Board members
� Strong knowledge bank within the Group
� Strong Parentage
� Piramal Group has significant recall with builder community
� A company with Ethical values – honesty and fair play
� Domain Knowledge
……to benefit from strong parentage and excellent domain knowledge
� Strong knowledge bank within the Group
� Shared resources – real estate private equity and realty arm –
with a pulse on the real estate market practice
To become profitable niche player in the market………
through domain knowledge expertise, world class risk management practices and highest ethical standards
20

Indiareit - Executive Summary
Best positioned to benefit from emerging Indian real estate
‒ Consistent fund raising
‒ Proven & consistent investment strategy
‒ Strong team with comprehensive investment experience;
Supplemented with key differentiators
‒ Realized exits across funds
‒ Exits commenced since October 2008
‒ Valuations in sync with guidance and exit delivery
‒ Estimate 2.22x pre-tax money multiple on valued portfolio (March ‘11)
‒ Ability to profitably deploy large pools of capital;
‒ Over USD 650Mn in 4 years
Proven fund
management
expertise,
Successful exits
across vehicles
– First to declare independent valuations
– First to commence exits in investee projects
– First to round trip investments across all fund
offerings
– First to manage third party portfolio
Comprehensive Experience
• 5 Top Tier 1 cities
• 8 Local partners
• 23 Projects
• 53.7m sq ft of Saleable area currently under development
History of firsts in
the Indian market
Domestic Fund Size (Rs. Crs) Offshore Funds Size ($ mn)
Fund scheme I 430 Offshore Fund I 200
Fund scheme III 585 Trinity Capital Plc 230
Fund scheme IV 923 Trafalgar/F&C Reit 36
Mumbai Redevelopment Fund 37021

Information Management Segment
22

Decision Resources Group - An Overview
• Subscription-based global decision support market leader and premium brand
in the healthcare information services market (~$5.7 billion 1)
• ~$2.4 billion segment is addressable by the Company today
• Provides web-enabled insights and predictive analytics via proprietary
databases, high-value analytical reports and tools
• Enables customers to make fully-informed key investment and cost containment
23
23
decisions in each phase of the life sciences lifecycle
• Proprietary content and data streams created in-house through a rigorous,
highly-analytical, knowledge-driven process
• Staff of approximately 290 analysts, including 100+ highly-credentialed PhDs, MDs,
MPHs, Pharmacists, MBAs and key industry experts
• Global scale and reach with offices in Belgium, Canada, England, Japan and
various locations across the U.S. (~500 full-time employees)
1. Veronis Suhler Stevenson, 2011..

• Long-standing, strategic relationships with the top pharmaceutical, medical
technology and managed care companies
• 95% average customer renewal rate
• 48 out of top-50 pharma companies are its clients
• 10+ year relationships with top ten customers
Decision Resources Group - An Overview
24
24
• 10+ year relationships with top ten customers
• Products and services are deeply imbedded in customers’ work flow and decision
making processes
• Since 2006, revenue has grown at a CAGR of ~20%, with profit growth higher
than sales growth
• Best-in-class profitability
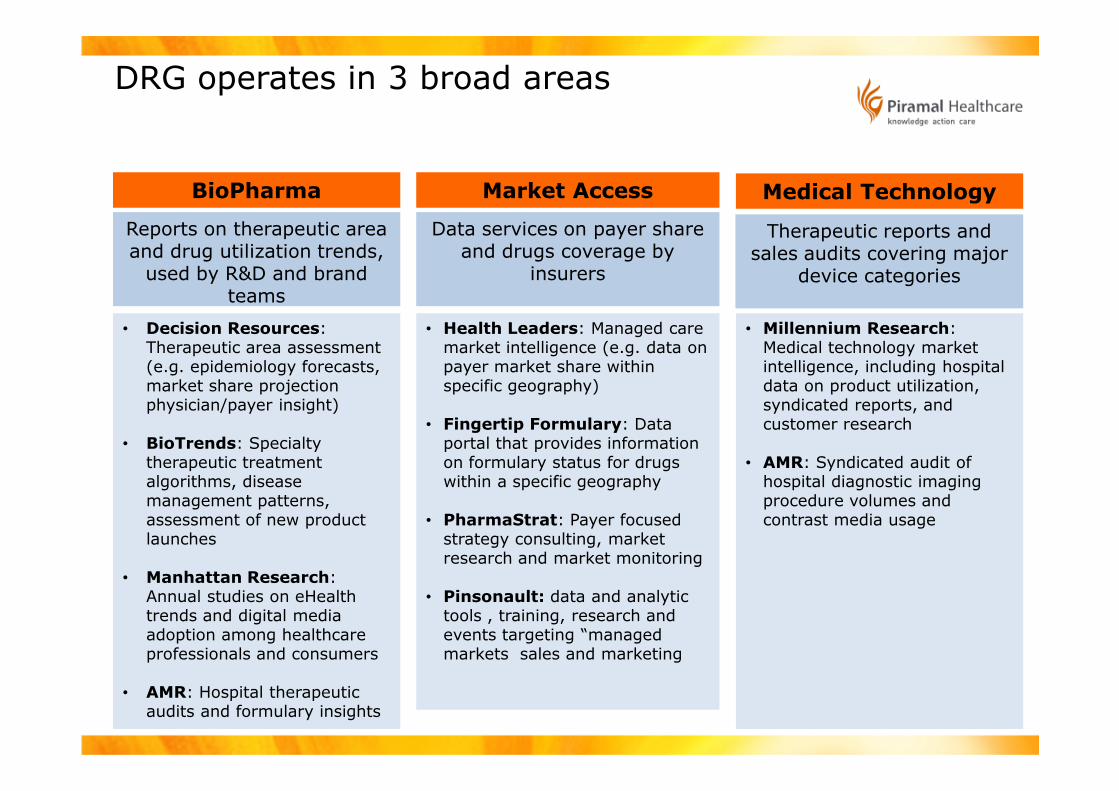
DRG operates in 3 broad areas
BioPharma
• Decision Resources: Therapeutic area assessment (e.g. epidemiology forecasts, market share projection physician/payer insight)
Reports on therapeutic area and drug utilization trends, used by R&D and brand
teams
Market Access
• Health Leaders: Managed care market intelligence (e.g. data on payer market share within specific geography)
Data services on payer share and drugs coverage by
insurers
Medical Technology
• Millennium Research: Medical technology market intelligence, including hospital data on product utilization, syndicated reports, and
Therapeutic reports and sales audits covering major
device categories
25
25
physician/payer insight)
• BioTrends: Specialty therapeutic treatment algorithms, disease management patterns, assessment of new product launches
• Manhattan Research: Annual studies on eHealth trends and digital media adoption among healthcare professionals and consumers
• AMR: Hospital therapeutic audits and formulary insights
• Fingertip Formulary: Data portal that provides information on formulary status for drugs within a specific geography
• PharmaStrat: Payer focused strategy consulting, market research and market monitoring
• Pinsonault: data and analytic tools , training, research and events targeting “managed markets sales and marketing
syndicated reports, and customer research
• AMR: Syndicated audit of hospital diagnostic imaging procedure volumes and contrast media usage

Special Investments
26

Special Investments
PEL to invest surplus funds in investments that give:
o minority equity stake
o global companies in India
o high growth sectors
o short to medium term
o Minimal risk
27
o Minimal risk
o ROI: 17-20% p.a.
PEL has increased it’s stake in Vodafone Essar to ~11% with the total investment of $ 1.2 billion
The partnership underscores trust placed by global companies in Piramal values, ethics, corporate governance and good reputation

Back-up slides
29
Back-up slides

Business Mix – Consolidated Q2 FY2013
Rs. Crores
30-Sep-12 30-Sep-11 % Gr 30-Sep-12 30-Sep-11 % Gr
1 Pharma Solutions 42.3% 364.9 305.1 19.6% 749.5 595.3 25.9%
From Assets in India 22.2% 191.9 187.4 2.4% 430.6 359.8 19.7%
From Assets Outside India 20.0% 173.0 117.7 47.0% 319.0 235.5 35.5%
2 Piramal Critical Care 18.0% 155.5 91.6 69.8% 302.4 182.7 65.5%
3 OTC & Ophthalmology 7.8% 67.7 57.1 18.6% 139.4 112.8 23.6%
No. Net Sales break-up%
Sales
Quarter II ended Half Yearly ended
Notes:
1. Investment income for Q2FY13 is lower due to investment of ~Rs. 5,862 crores for buying ~11% stake in Vodafone India
2. Financial Services revenue includes revenue from NBFC and IndiaReit Fund
30
4 DRG 20.0% 172.6 - - 230.3 - -
5 Financial Services 6.3% 54.7 6.6 - 97.1 6.6 -
6 Investment Income 3.4% 29.6 50.5 -41.5% 61.6 121.5 -49.3%
7 Others 2.2% 18.6 24.0 -22.6% 30.5 28.0 9.0%
100.0% 863.5 534.7 61.5% 1,610.8 1,046.7 53.9%Total

Rs. Crores
Profit & Loss Account – Consolidated -Q2 FY2013
30-Sep-12 30-Sep-11 % Gr 30-Sep-12 30-Sep-11 % Gr
Total operating income 863.5 534.7 61.5% 1,610.8 1,046.7 53.9%
NCE R&D Exps 54.7 - - 87.7 - -
Other Operating Expenses 735.1 507.6 44.8% 1,370.9 941.1 45.7%
OPBIDTA 73.7 27.2 171.1% 152.2 105.3 44.5%
OPM % 8.5% 5.1% - 9.4% 10.1% -
28.3 102.6 -72.4% 85.8 179.0 -52.1%
Period ended - ConsolidatedQ2 Ended H1 Ended
31
Notes:
1. Non-operating other income is mainly FX gain arising out of restatement of receivables from sales of
Healthcare solutions business
Non-operating other income 28.3 102.6 -72.4% 85.8 179.0 -52.1%
EBIDTA 102.0 129.8 -21.4% 237.9 284.6 -16.4%
Interest 122.2 19.6 524.3% 209.8 30.6 586.1%
Depreciation 56.3 28.6 96.8% 97.4 55.6 75.2%
Profit before tax (76.6) 81.6 - (69.2) 198.5 -
Exceptional items 0.3 (1.1) - 1.6 1.1 -
Income tax 14.6 27.6 - 15.4 54.5 -
Profit after tax (91.5) 52.9 - (86.1) 142.9 -
EPS (Rs.) (5.3) 3.2 - (5.1) 8.5 -

Consolidated Balance Sheet – Q2 FY2013
Rs. Crores
As at As at
30-Sep-12 30-Sep-11
Equity capital 34.5 33.4
Reserves & Surplus 11,261.5 11,879.2
Networth 11,296.0 11,912.7
Minority interest 9.5 7.7
Deferred tax liability 58.4 46.1
Loan funds 6,331.9 1,088.9
Total 17,695.9 13,055.4
Period ended- Consolidated
32
Notes:
1. The increase in loan funds is mainly due to debt raised for acquisition of DRG
2. Net fixed assets increased due to consolidation of DRG assets
3. Increase in investments due to additional investment in equity of Vodafone India in February 2012
Total 17,695.9 13,055.4
Net fixed assets 5,892.2 1,717.9
Investments 6,855.1 3,917.5
Net current assets 4,948.7 7,420.0
Inventories 519.8 455.6
Sundry debtors 558.9 351.9
Other current assets 5,162.9 7,546.2
Current liabilities 1,292.9 933.7
Total 17,695.9 13,055.4

P276 CDKs
P276 – with
Gemcitabine
Pipeline: Oncology
P276 – with
radiation
P1446 – CDKs
Malignant Melanoma
Mantle Cell Lymphoma
Head & Neck Cancer Clinically complete
Stage I of Phase
I/II complete
Stage I of Phase I/II
complete
Pancreatic
RIM
Clinically Complete
POC complete DCGI Approval awaited
Phase II part of PhaseII/III initiated
India
US, India
Australia, NZ
India
India
India
Program Preclinical Phase I Phase II Phase III Phase IV Trial Location
POC complete
P1446 – CDKs
P1446 Combination
Clinically Complete India
India
CanadaClinically Complete
Malignant Melanoma
Mantle Cell Lymphoma
Head & Neck Cancer Phase I/II planned
Phase I/II planned
Phase I/II planned
US
US
Triple Negative Breast Cancer
Phase I/II planned US, India

Program Preclinical Phase I Phase II Phase III Phase IV Trial Location
Pipeline: Oncology
P2745
P7170 – PI3K/ mTOR
PL225B -
Merck
Target Y -
Merck
Ongoing
Lead Selection
Ph I plannedFinal regulatory Final regulatory
approval awaitedapproval awaited
India
India
India, US
India, US
Ongoing

Program Preclinical Phase I Phase II Phase III Phase IV Trial Location
Tinefcon
(oral) - TNFα
Pipeline: Inflammation
Tinefcon
Psoriasis
Ulcerative Colitis
Ankylosing Spondylitis Planned*
Recruitment
completed
Tinefcon
(oral) - TNFα
Tinefcon
(oral) - TNFα
Psoriasis PlannedTinefcon
(oral) - TNFα
India
India
India
Asia-Pacific
Planned
Planned
Tinefcon
(topical) - TNFα
P3914-NSAID
P7170-PI3K
Note: Note: TinefconTinefcon is a is a phytopharmaceuticalphytopharmaceutical
Ongoing
Preclinical
Psoriasis Ongoing India
India

Program Preclinical Phase I Phase II Phase III Phase IV Trial Location
P1736
Non-PPARγ
Pipeline: Diabetes and Metabolic Disorders
P1201 - Lilly
P2202 - Lilly
P7435 – DGAT1
Type 2 Diabetes
Ongoing
Clinically complete
Ongoing
India
India
Canada, India
Netherlands, France
Phase II Stage I Complete

Pipeline: Infectious Diseases
Program Preclinical Phase I Phase II Phase III Phase IV Trial Location
PP9706642 Anti-
HSV 2
PM181104 – MRSA/VRE
PM181108
Preclinical
Preclinical
NPH 30907
Dermatophyte
Complete
Recruitment closed
India
India
PM181108 Preclinical
Note: PP9706642 Note: PP9706642 is a is a phytopharmaceuticalsphytopharmaceuticals


