16-19th January 2017 ERA-CLIM2 3rd General Assembly, Vienna Development of the ocean carbon component [MERCO] Aurélie Albert, Coralie Perruche, Yann Drillet [UVSQ/LSCE] Marion Gehlen WP1 – Task 1.1: Global 20th century analysis
Transcript
16-19th January 2017 ERA-CLIM2 3rd General Assembly, Vienna
Development of the ocean carbon component [MERCO] Aurélie Albert, Coralie Perruche, Yann Drillet
[UVSQ/LSCE] Marion Gehlen
WP1 – Task 1.1: Global 20th century analysis
Objectives and Strategy
Objectives: - set up of the coupling of Ocean Biogeochemistry with CERA-20C - run 20th century analyses of ocean biogeochemistry
16-19th January 2017 ERA-CLIM2 3rd General Assembly, Vienna
Objectives and Strategy
16-19th January 2017 ERA-CLIM2 3rd General Assembly, Vienna
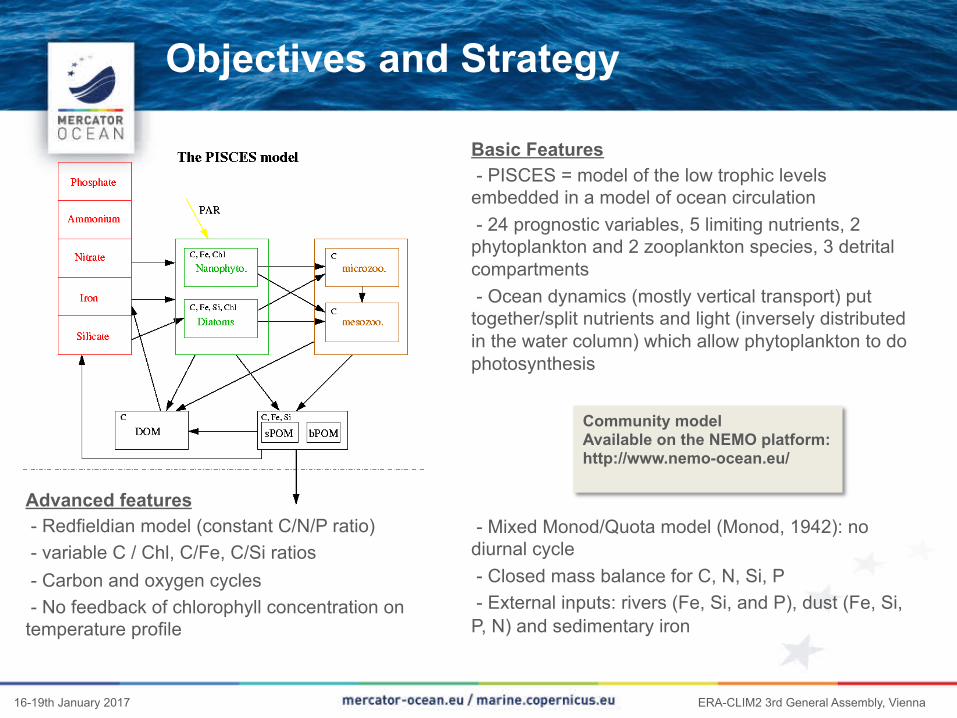
Advanced features - Redfieldian model (constant C/N/P ratio) - variable C / Chl, C/Fe, C/Si ratios - Carbon and oxygen cycles - No feedback of chlorophyll concentration on temperature profile
- Mixed Monod/Quota model (Monod, 1942): no diurnal cycle - Closed mass balance for C, N, Si, P - External inputs: rivers (Fe, Si, and P), dust (Fe, Si, P, N) and sedimentary iron
Community model Available on the NEMO platform: http://www.nemo-ocean.eu/
Basic Features - PISCES = model of the low trophic levels embedded in a model of ocean circulation - 24 prognostic variables, 5 limiting nutrients, 2 phytoplankton and 2 zooplankton species, 3 detrital compartments - Ocean dynamics (mostly vertical transport) put together/split nutrients and light (inversely distributed in the water column) which allow phytoplankton to do photosynthesis
Objectives and Strategy
Objectives: - set up of the coupling of Ocean Biogeochemistry with CERA-20C - run 20th century analyses of ocean biogeochemistry 3 strategies for the coupling were considered: (contribution to WP2 – Task 2.4)
§ online coupling : we provide code, namelists & biogeochemical inputs and
ECMWF integrates PISCES in CERA-20C § offline coupling : CERA-20C ocean & atmospheric outputs as forcings § “offline” NEMO-PISCES : CERA-20C atmospheric outputs as forcings
16-19th January 2017 ERA-CLIM2 3rd General Assembly, Vienna
CERA20-20C
OCEAN ICE
BIO
NEMO
ATM
PISCES
IFS
Objectives and Strategy
Objectives: - set up of the coupling of Ocean Biogeochemistry with CERA-20C - run 20th century analyses of ocean biogeochemistry 3 strategies for the coupling were considered: (contribution to WP2 – Task 2.4) § online coupling : we provide code, namelists & biogeochemical inputs and
ECMWF integrates PISCES in CERA-20C § offline coupling : CERA-20C ocean & atmospheric outputs as forcings § “offline” NEMO-PISCES : CERA-20C atmospheric outputs as forcings The “offline” NEMO-PISCES approach was selected after a series of tests with different parameter settings and NEMO versions
16-19th January 2017 ERA-CLIM2 3rd General Assembly, Vienna
CERA20-20C
OCEAN ICE
BIO
NEMO
ATM
PISCES
IFS
Configuration
The “offline” NEMO-PISCES configuration: § Atmospheric Forcing: ERA-20C (CERA-20C not ready at that time) § Time period: 1900 - 2009 § Latest NEMO 3.6, PISCES v2 (Aumont et al., 2015), LIM3 for ice § New set-up from IPSL configuration (OR1L3PIS-V1) § 75 vertical levels, vvl option (water column volume variable) § Updated external input fluxes: river input, sediment Fe supply, atmospheric
deposition of Fe, Si, N and P, Fe input from sea ice § Initial state from OR1L3PIS-V1 (after 100 yrs of climatological simulation) § Spin-up 1870-1900 with climatological ERA-20C atmospheric forcing, and then
interannual ERA-20C (1870 = beginning of industrial era)
16-19th January 2017 ERA-CLIM2 3rd General Assembly, Vienna
Globcolour DATA clim 1998 - 2009 MODEL clim 1998 - 2009
CHL (mg/m3)
16-19th January 2017 ERA-CLIM2 3rd General Assembly, Vienna
MODEL clim 1998 - 2009
Sea-to-air CO2 flux (gC/m2/yr)
Landschützer clim 1998 - 2009
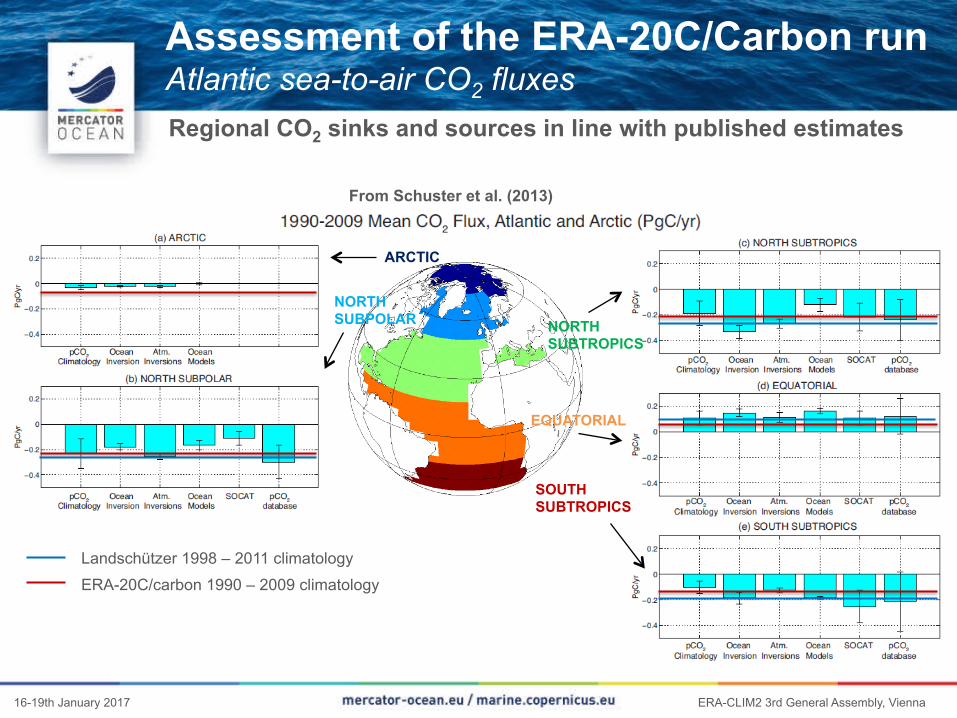
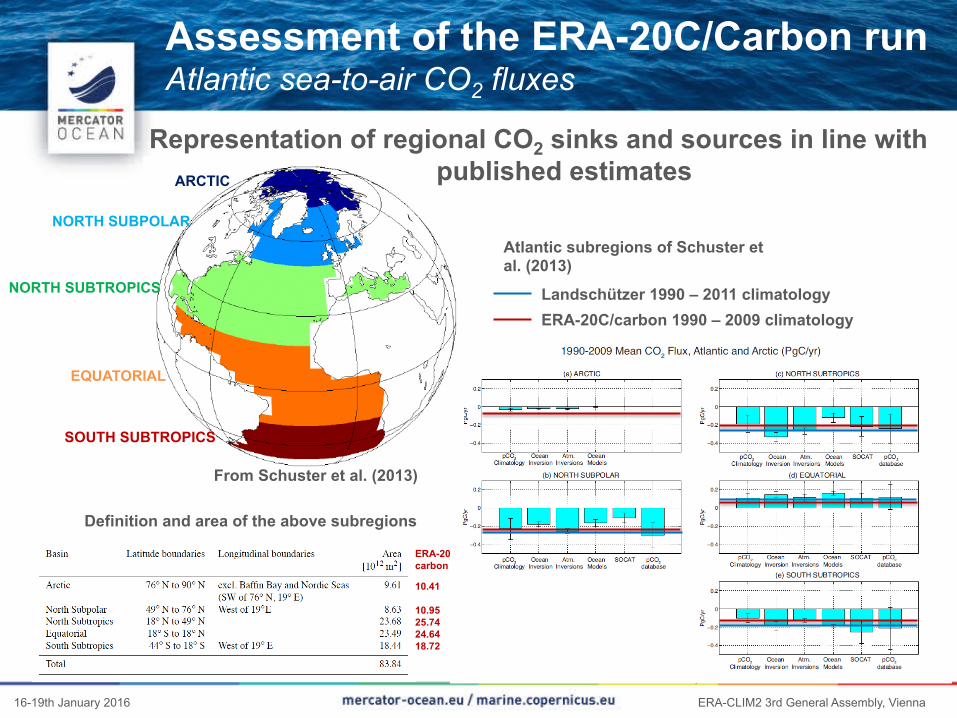
Assessment of the ERA-20C/Carbon run Surface annual mean
Satisfying CHL and CO2 fluxes
16-19th January 2017 ERA-CLIM2 3rd General Assembly, Vienna
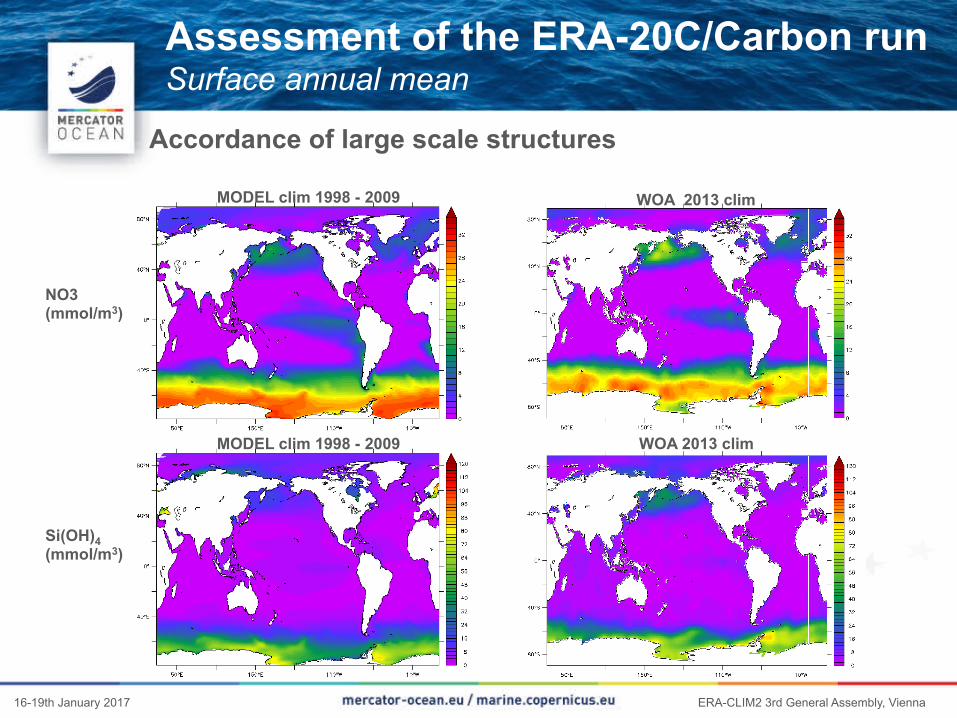
MODEL clim 1998 - 2009
MODEL clim 1998 - 2009 WOA 2013 clim
WOA 2013 clim
NO3 (mmol/m3)
Si(OH)4 (mmol/m3)
Assessment of the ERA-20C/Carbon run Surface annual mean
Accordance of large scale structures
16-19th January 2017 ERA-CLIM2 3rd General Assembly, Vienna
16-19th January 2017 ERA-CLIM2 3rd General Assembly, Vienna
Assessment of the ERA-20C/Carbon run Global statistics: Taylor diagram
Taylor diagram computed with surface monthly climatologies (1998 – 2009 years if available)
Data sources: - GLODAPv2 for DIC, ALK - Landschützer for Cflx = CO2 flux - Globcolour for logCHL - WOA 2013 for NO3, O2, PO4, Si, SST, SSS - De Boyer-Montégut for MLD
SST, SSS: +++ Nutrients ++ Chl, MLD, carbon variables: significant correlations but still work to do (on data and model)
16-19th January 2017 ERA-CLIM2 3rd General Assembly, Vienna
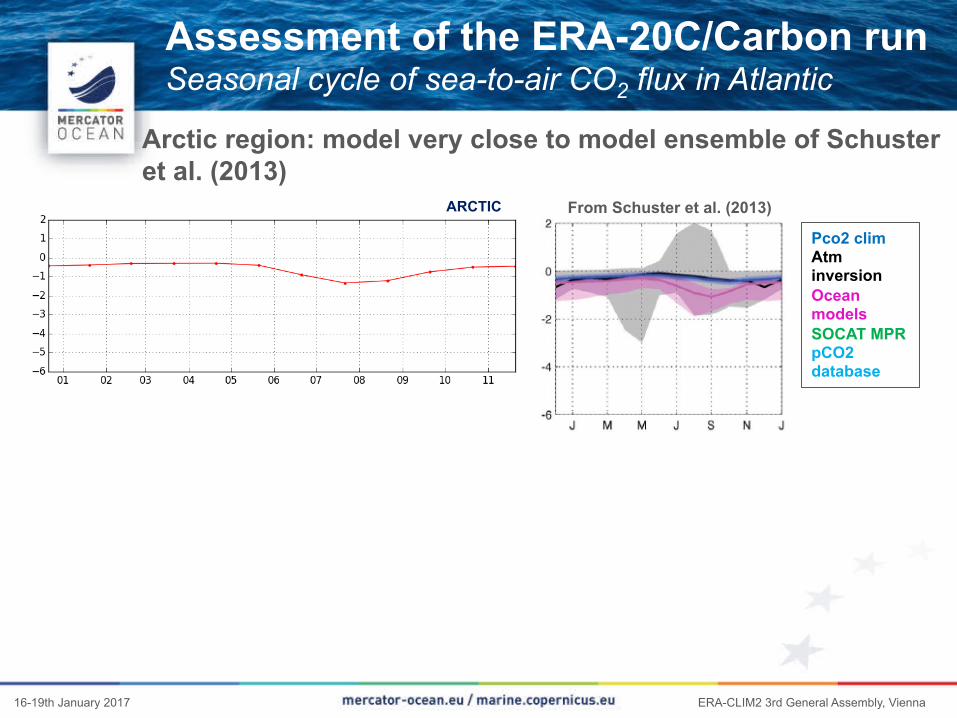
Assessment of the ERA-20C/Carbon run Interannual time series of the CO2 flux
From Landschützer et al. (2014):
Mixed models and data
From Le Quéré et al. (2015)
x (-1)
Anthropogenic air-to-sea CO2 flux
Anthropogenic Sea-to-Air CO2 flux
Ocean models Rödenbeck (2015) Landschützer (2014) Models before normalisation ERA-20C/carbon
16-19th January 2017 ERA-CLIM2 3rd General Assembly, Vienna
Conclusions & Perspectives
Conclusion: § Evaluation of ERA20C/Carbon gave rather promising results over the period
covered by observations (1998 – 2009)
• At the global scale (annual mean, Taylor) • At the scale of Atlantic basin: seasonal cycle and subbasin integrated values • Globally yearly integrated air-to-sea flux of CO2 over the period 1960 to 2009
§ Interannual variability needs to be further assessed (comparison of ERA20C/Carbon to model output having contributed to Global Carbon Project)
Perspectives: § Run an “offline” NEMO/PISCES simulation forced by CERA20C
• Scheduled during the second semester of 2017 (should be produced by Mercator) • We will use the same parameter settings as for ERA20C/Carbon run
Thank you for your attention !
16-19th January 2017 ERA-CLIM2 General Assembly, Vienna
16-19th January 2017 ERA-CLIM2 3rd General Assembly, Vienna
Assessment of the ERA-20C/Carbon run Interannual time series of the CO2 flux
From Landschützer et al. (2014)
& Mixed models and
data
From Le Quéré et al. (2015)
- River outgassing = 0.45 PgC/yr (Jacobson et al., 2007) - Arctic = - 0.12 PgC/yr (Schuster et al., 2013)
x (-1)
Air-to-Sea CO2 flux
Sea-to-Air CO2 flux
Ocean models Rödenbeck (2015) Landschützer (2014) Models before normalisation ERA-20C/carbon
Landschützer
16-19th January 2016 ERA-CLIM2 3rd General Assembly, Vienna
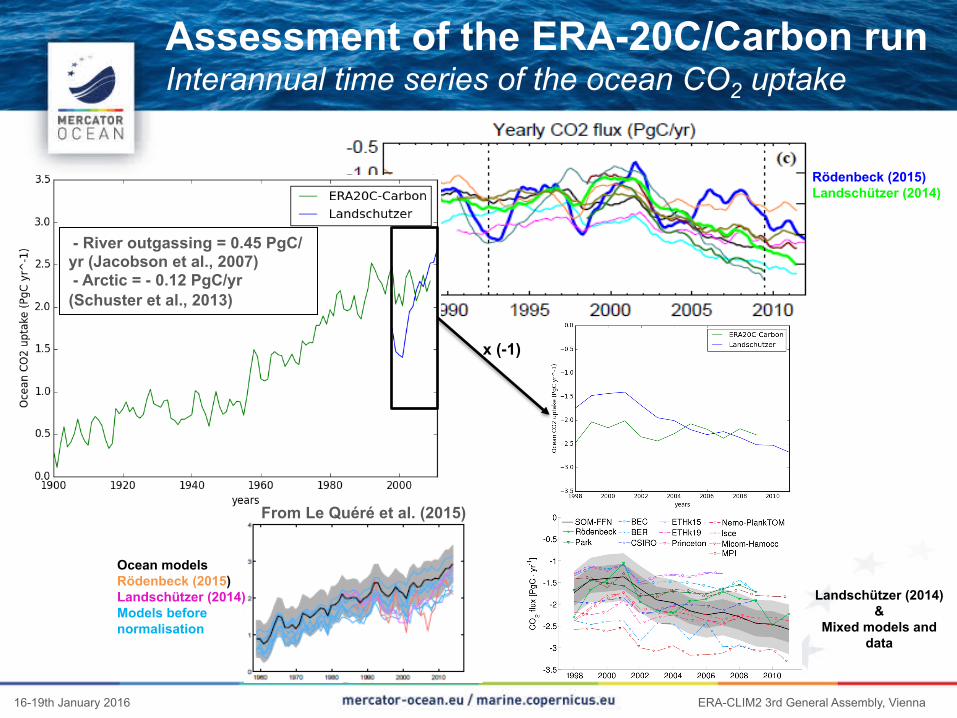
Assessment of the ERA-20C/Carbon run Interannual time series of the ocean CO2 uptake
Ocean models Rödenbeck (2015) Landschützer (2014) Models before normalisation
Rödenbeck (2015) Landschützer (2014)
Landschützer (2014) &
Mixed models and data
x (-1)
From Le Quéré et al. (2015)
- River outgassing = 0.45 PgC/yr (Jacobson et al., 2007) - Arctic = - 0.12 PgC/yr (Schuster et al., 2013)
16-19th January 2016 ERA-CLIM2 3rd General Assembly, Vienna