12
Pitcher Partners Automotive 2017/2018 edition (Luxury and Non-Luxury) Key performance indicators for automotive retailers
| Date post: | 24-May-2018 |
| Category: |
Documents |
| Upload: | duongkhanh |
| View: | 218 times |
| Download: | 2 times |
Pitcher Partners Automotive
2017/2018 edition (Luxury and Non-Luxury)
Key performance indicators for automotive retailers

ContentsAutomotive services 1
Non-luxury edition 2
Luxury edition 4
About Pitcher Partners 6

Automotive servicesWelcome to the 2017/2018 Pitcher Partners Automotive Key Performance Indicators for Australian Automotive Retailers – Non Luxury and Luxury EditionsNew vehicle salesThe 2016 calendar year showed continued growth and strength in the Australian new car market, with official sales of approximately 1.178 million units, representing a 2% increase on the sales for the 2015 calendar year (1.155 million units). This marked the seventh consecutive year in which new car sales exceeded 1 million units.
The Toyota and Mazda manufacturers continue to generate the highest sales volumes, with Hyundai, Holden and Ford rounding out the top 5 vehicle sales by manufacturers, and accounting for over 50% of total sales in calendar year 2016. However, we have also witnessed a shift in consumer preferences through increased sales in SUVs and light commercial vehicles. Remarkably, the Toyota Hilux was Australia’s highest selling vehicle in calendar year 2016, and continues to perform strongly, as evidenced through the sale of over 5,400 Toyota Hilux vehicles in June 2017 alone. Further, the Ford Ranger also had sales in excess of 5,000 units for the month of June 2017. On the back of this, the June 2017 month was considered to be the highest performing month in history, with over 134,000 units sold.
The challengesAustralian Automotive Dealerships will face many challenges in the coming years. One such issue is in relation to innovation through increased competition as a result of surging online vehicle sales, with some experts predicting the entire vehicle sales transaction will be transitioned to an online platform in the near future, with almost 10% of vehicle transactions expected to be online by 2019. Dealerships will need to focus on business innovation solutions to continue to adapt with technological development that will impact the relationship between the manufacturer, dealer and consumer.
Almost on a weekly basis we read about the limited future of retail automotive dealerships with some reports suggesting they will cease to exist by 2025. However, in Australia, with the continued interest by private equity in the industry, it is evident they are seeing sufficient opportunities in the automotive retailing market. Economies of scale will continue to drive consolidation.
The business model will need to change with the brick and click dealership itself being able to match the best high-street retail experience and with dealerships going beyond the car sale and into mobility services. In saying that, dealers have always been good at adapting – an innovative car dealer is a future car dealer.
A key issue impacting the future of the automotive industry is in relation to commission models and structures in the context of ASIC’s prohibition of flexible commission arrangements as announced in March 2017 and effective from 1 September 2018. ASIC’s decision not only means the banning of flex-commissions, but also imposes restrictions on interest rates and origination fees, giving greater power to lenders. This decision will impact dealership profitability through underlying restrictions on the sale of products within the F&I departments.
Further, automotive dealerships are expected to be impacted by new accounting standards, more specifically surrounding revenue recognition (AASB 15) and leases (AASB 16), which are set to become effective from 2018. These standards are sure to impact on dealerships’ benchmarking and profitability.
Overall, we expect new vehicle sales to hover around the 1.0 million sales mark for calendar year 2017, in line with VFACTS forecasts, and these sales to be underpinned by continued growth in SUV and light commercial vehicle sales.
The unknownIn our opinion, autonomous driving technology is the real unknown – will cars drive themselves to our homes, removing the dealer from the process!
Contrary to current economic conditions and predictions, the retail automotive market has continued to perform strongly as a result of the following:
Strong competitiveness within the market, allowing for consumers to have access to a greater level of choice and access to high quality vehicles.
Increased business sales as a result of government tax incentives (i.e. access to instant asset write-off provisions) as well as manufacturer product offerings.
Low interest rates and end of financial year sales.
1
Non-Luxury edition
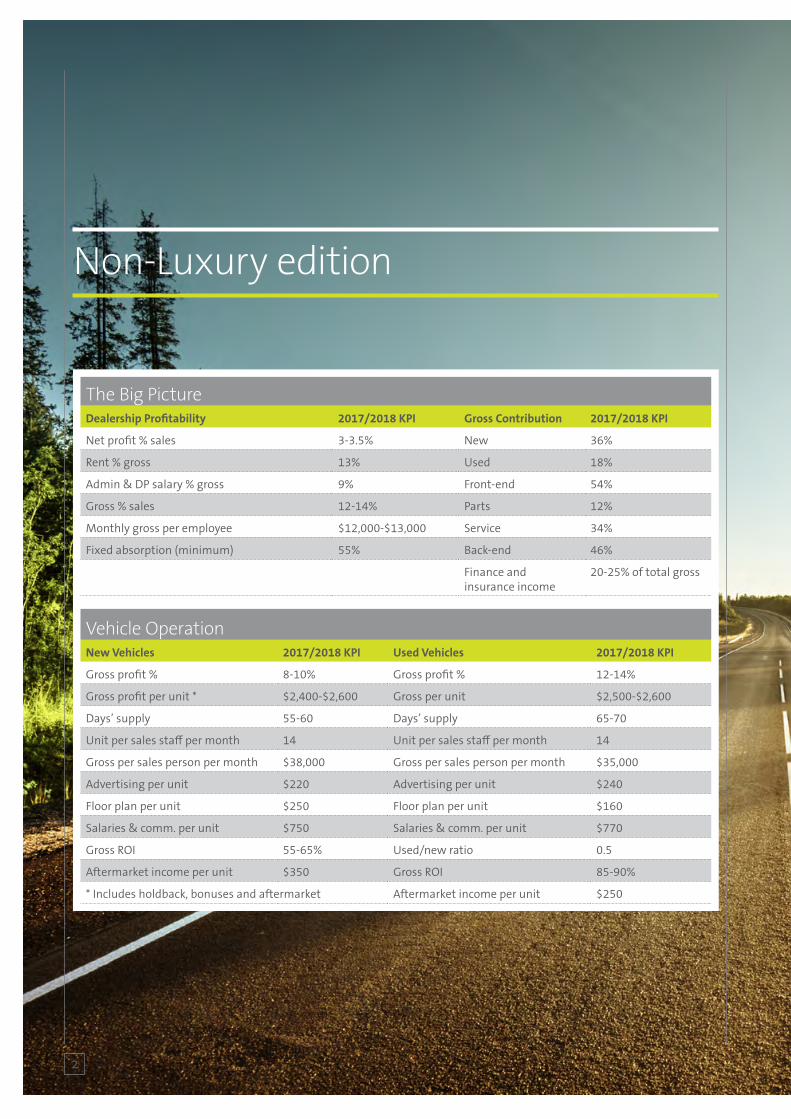
The Big PictureDealership Profitability 2017/2018 KPI Gross Contribution 2017/2018 KPI
Net profit % sales 3-3.5% New 36%
Rent % gross 13% Used 18%
Admin & DP salary % gross 9% Front-end 54%
Gross % sales 12-14% Parts 12%
Monthly gross per employee $12,000-$13,000 Service 34%
Fixed absorption (minimum) 55% Back-end 46%
Finance and insurance income
20-25% of total gross
Vehicle OperationNew Vehicles 2017/2018 KPI Used Vehicles 2017/2018 KPI
Gross profit % 8-10% Gross profit % 12-14%
Gross profit per unit * $2,400-$2,600 Gross per unit $2,500-$2,600
Days’ supply 55-60 Days’ supply 65-70
Unit per sales staff per month 14 Unit per sales staff per month 14
Gross per sales person per month $38,000 Gross per sales person per month $35,000
Advertising per unit $220 Advertising per unit $240
Floor plan per unit $250 Floor plan per unit $160
Salaries & comm. per unit $750 Salaries & comm. per unit $770
Gross ROI 55-65% Used/new ratio 0.5
Aftermarket income per unit $350 Gross ROI 85-90%
* Includes holdback, bonuses and aftermarket Aftermarket income per unit $250
2

Fixed OperationsParts 2017/2018 KPI Service 2017/2018 KPI
Gross profit % 23-25% Gross profit % total 66-69%
Days’ supply 45-50 Gross profit % labour 76-79%
Monthly gross per staff $18,500-$19,000 Monthly labour gross per tech $12,000-$13,000
$ sales per $ salary $18 Unapplied time % COS 5% max
Gross ROI 180-200% Non-chargeable salaries % gross 23-25%
Fixed absorption (minimum) 55% Back-end 46%
* Apprentices and foreman are weighted to arrive at an adjusted number of technicians
Chargeable to non-chargeable 2 to 1
Labour hours per retail RO 2.0 hours
Technician to service advisor 5 to 1
Parts / labour ratio $0.60
Fixed absorption (minimum) 55%
Finance and InsuranceNew Vehicles 2017/2018 KPI Used Vehicles 2017/2018 KPI
Finance penetration 40-45% Finance penetration 40-45%
Income per contract $2,300-$2,500 Income per contract $2,400-$2,600
Finance per retail unit $880 Finance per retail unit $890
Insurance per retail unit $180 Insurance per retail unit $180
F&I income per staff per month $50,000-$55,000
Units retailed per F&I staff per month
50-55
3

Luxury edition
The Big PictureDealership Profitability 2017/2018 KPI Gross Contribution 2017/2018 KPI
Net profit % sales 4-4.5% New 44%
Rent % gross 11% Used 12%
Admin & DP salary % gross 5% Front-end 56%
Gross % sales 13-15% Parts 12%
Monthly gross per employee $11,500-$12,500 Service 32%
Fixed absorption (minimum) 55% Back-end 44%
Finance and insurance income
13-15% of total gross
Vehicle OperationVehicles 2017/2018 KPI Used Vehicles 2017/2018 KPI
Gross profit % 10-12% Gross profit % 12-14%
Gross profit per unit * $4,000-$4,500 Gross per unit $2,500-$3,000
Days’ supply 55-60 Days’ supply 65-70
Unit per sales staff per month 11 Unit per sales staff per month 12-14
Gross per sales person per month $50,000-$55,000 Gross per sales person per month $33,000-$38,000
Advertising per unit $400 Advertising per unit $200
Floor plan per unit $350 Floor plan per unit $150
Salaries & comm. per unit $1,200 Salaries & comm. per unit $800
Gross ROI 65-70% Used / new ratio 0.4
Aftermarket income per unit $350 Gross ROI 75-80%
* Includes holdback, bonuses and aftermarket Aftermarket income per unit $250
4

Fixed OperationsParts 2017/2018 KPI Service 2017/2018 KPI
Gross profit % 22-26% Gross profit % total 65-70%
Days’ supply 45-55 Gross profit % labour 76%
Monthly gross per staff $20,000-$22,000 Monthly labour gross per tech $13,000-$14,000
$ sales per $ salary $18-$20 Unapplied time % COS 5% max
Gross ROI 200-220% Non-chargeable salaries % gross 30%
* Apprentices and foreman are weighted to arrive at an adjusted number of technicians
Chargeable to non-chargeable 2 to 1
Labour hours per retail RO 2.2 hours
Technician to service advisor 5 to 1
Parts / labour ratio $0.80
Fixed absorption (minimum) 55%
Finance and InsuranceNew Vehicles 2017/2018 KPI Used Vehicles 2017/2018 KPI
Finance penetration 33-38% Finance penetration 30-35%
Income per contract $2,200-$2,400 Income per contract $2,150-$2,350
Finance per retail unit $800 Finance per retail unit $800
Insurance per retail unit $170 Insurance per retail unit $180
F&I income per staff per month $35,000-$40,000
Units retailed per F&I staff per month
50-55
5
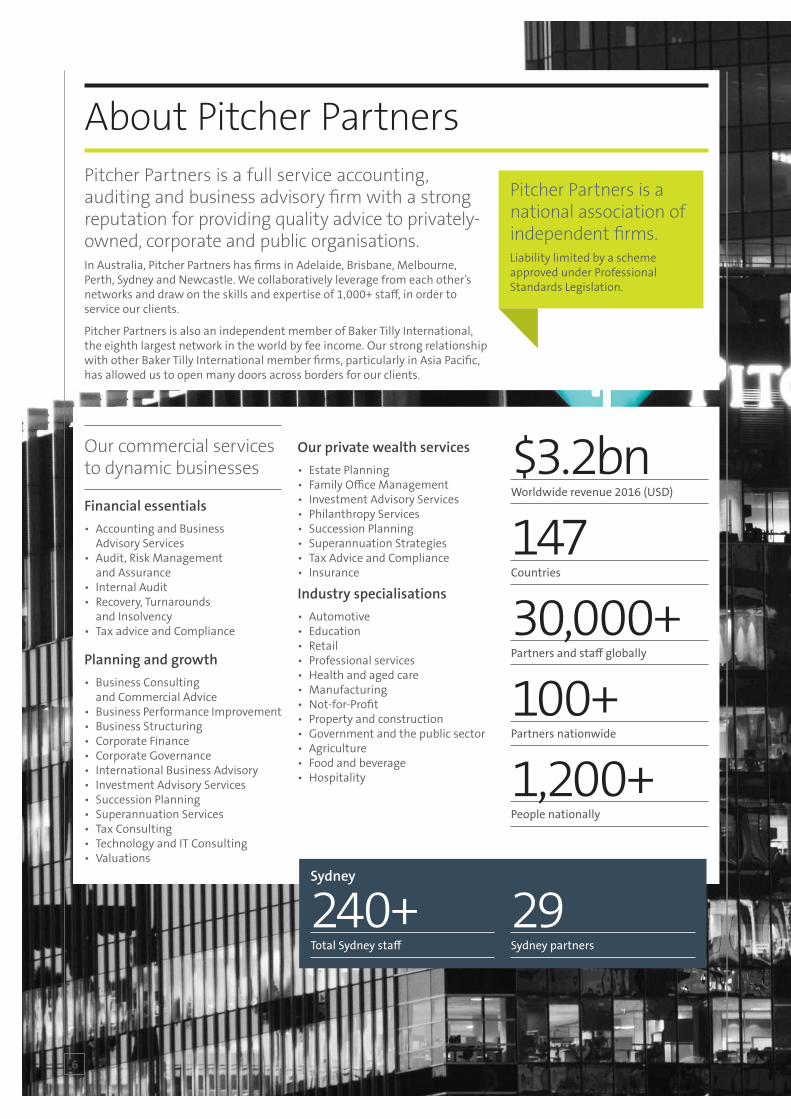
About Pitcher PartnersPitcher Partners is a full service accounting, auditing and business advisory firm with a strong reputation for providing quality advice to privately-owned, corporate and public organisations.In Australia, Pitcher Partners has firms in Adelaide, Brisbane, Melbourne, Perth, Sydney and Newcastle. We collaboratively leverage from each other’s networks and draw on the skills and expertise of 1,000+ staff, in order to service our clients.
Pitcher Partners is also an independent member of Baker Tilly International, the eighth largest network in the world by fee income. Our strong relationship with other Baker Tilly International member firms, particularly in Asia Pacific, has allowed us to open many doors across borders for our clients.
Our commercial services to dynamic businesses
Financial essentials• Accounting and Business
Advisory Services• Audit, Risk Management
and Assurance• Internal Audit• Recovery, Turnarounds
and Insolvency• Tax advice and Compliance
Planning and growth• Business Consulting
and Commercial Advice• Business Performance Improvement• Business Structuring• Corporate Finance• Corporate Governance• International Business Advisory• Investment Advisory Services• Succession Planning• Superannuation Services• Tax Consulting• Technology and IT Consulting• Valuations
Our private wealth services• Estate Planning• Family Office Management• Investment Advisory Services• Philanthropy Services• Succession Planning• Superannuation Strategies• Tax Advice and Compliance• Insurance
Industry specialisations• Automotive• Education• Retail• Professional services• Health and aged care• Manufacturing• Not-for-Profit• Property and construction• Government and the public sector• Agriculture• Food and beverage• Hospitality
$3.2bnWorldwide revenue 2016 (USD)
147Countries
30,000+Partners and staff globally
100+Partners nationwide
1,200+People nationally
Pitcher Partners is a national association of independent firms.Liability limited by a scheme approved under Professional Standards Legislation.
Sydney
240+Total Sydney staff
29Sydney partners
6

About Pitcher PartnersPitcher Partners is a full service accounting, auditing and business advisory firm with a strong reputation for providing quality advice to privately-owned, corporate and public organisations.In Australia, Pitcher Partners has firms in Adelaide, Brisbane, Melbourne, Perth, Sydney and Newcastle. We collaboratively leverage from each other’s networks and draw on the skills and expertise of 1,000+ staff, in order to service our clients.
Pitcher Partners is also an independent member of Baker Tilly International, the eighth largest network in the world by fee income. Our strong relationship with other Baker Tilly International member firms, particularly in Asia Pacific, has allowed us to open many doors across borders for our clients.
Our commercial services to dynamic businesses
Financial essentials• Accounting and Business
Advisory Services• Audit, Risk Management
and Assurance• Internal Audit• Recovery, Turnarounds
and Insolvency• Tax advice and Compliance
Planning and growth• Business Consulting
and Commercial Advice• Business Performance Improvement• Business Structuring• Corporate Finance• Corporate Governance• International Business Advisory• Investment Advisory Services• Succession Planning• Superannuation Services• Tax Consulting• Technology and IT Consulting• Valuations
Our private wealth services• Estate Planning• Family Office Management• Investment Advisory Services• Philanthropy Services• Succession Planning• Superannuation Strategies• Tax Advice and Compliance• Insurance
Industry specialisations• Automotive• Education• Retail• Professional services• Health and aged care• Manufacturing• Not-for-Profit• Property and construction• Government and the public sector• Agriculture• Food and beverage• Hospitality
$3.2bnWorldwide revenue 2016 (USD)
147Countries
30,000+Partners and staff globally
100+Partners nationwide
1,200+People nationally
Pitcher Partners is a national association of independent firms.Liability limited by a scheme approved under Professional Standards Legislation.
Sydney
240+Total Sydney staff
29Sydney partners
Firm locations
MELBOURNE
ADELAIDE
SYDNEY
BRISBANE
PERTH
NEWCASTLE
Pitcher Partners has the resources and depth of expertise of a major firm, but with a smaller firm feel. We give our clients the highest level of personal service and attention. That’s the difference.
Winner – 2016 Acquisition International M&A Awards Best Mid-Market Financial Advisory Firm - Australia & Recognised Leader in Acquisition Growth Strategy - Australia
Finalists – AFR Top Graduate Employer Awards (less than 5,000 employees)
New Partner of the Year – Dean Love, Melbourne
NEW PARTNER OF THE YEAR
Professional Development Program of the Year
Executive of the Year – Rob Southwell, Sydney
Accounting Student of the Year – Arlen Dabinett, Adelaide
Firm of the Year – Less than $1bn revenue
Accountants Daily Excellence Award – Rob Southwell, Sydney
Winner – Network of the Year – in the 2016 International Accounting Bulletin and the Accountant Awards
Finalist – 2017 Financial Review Client Choice Awards Best Accounting Firm (Rev $50m - $500m)
Winner – 2017 Financial Review Client Choice Awards Best Provider to Manufacturing, Retail and Wholesaling
Business Leader Finalist – Rob Southwell – 2017 Sydney City Regional Business Awards
7
Key
20Asia Paci�c Firms
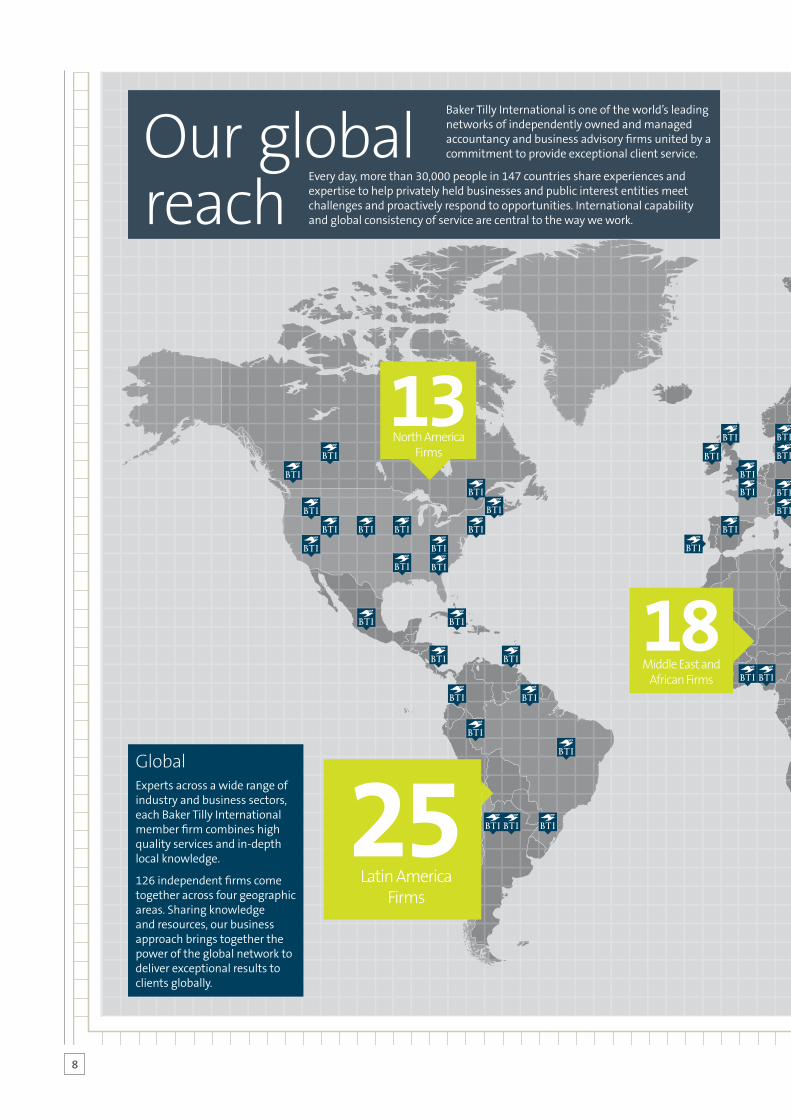
13North America
Firms
50European Firms
18Middle East and
African Firms
25Latin America
Firms
Baker Tilly International is one of the world’s leading networks of independently owned and managed accountancy and business advisory firms united by a commitment to provide exceptional client service.
Every day, more than 30,000 people in 147 countries share experiences and expertise to help privately held businesses and public interest entities meet challenges and proactively respond to opportunities. International capability and global consistency of service are central to the way we work.
Our globalreach
GlobalExperts across a wide range of industry and business sectors, each Baker Tilly International member firm combines high quality services and in-depth local knowledge.
126 independent firms come together across four geographic areas. Sharing knowledge and resources, our business approach brings together the power of the global network to deliver exceptional results to clients globally.
8
Key
20Asia Paci�c Firms
13North America
Firms
50European Firms
18Middle East and
African Firms
25Latin America
Firms
Baker Tilly International is one of the world’s leading networks of independently owned and managed accountancy and business advisory firms united by a commitment to provide exceptional client service.
Every day, more than 30,000 people in 147 countries share experiences and expertise to help privately held businesses and public interest entities meet challenges and proactively respond to opportunities. International capability and global consistency of service are central to the way we work.
Our globalreach
GlobalExperts across a wide range of industry and business sectors, each Baker Tilly International member firm combines high quality services and in-depth local knowledge.
126 independent firms come together across four geographic areas. Sharing knowledge and resources, our business approach brings together the power of the global network to deliver exceptional results to clients globally.
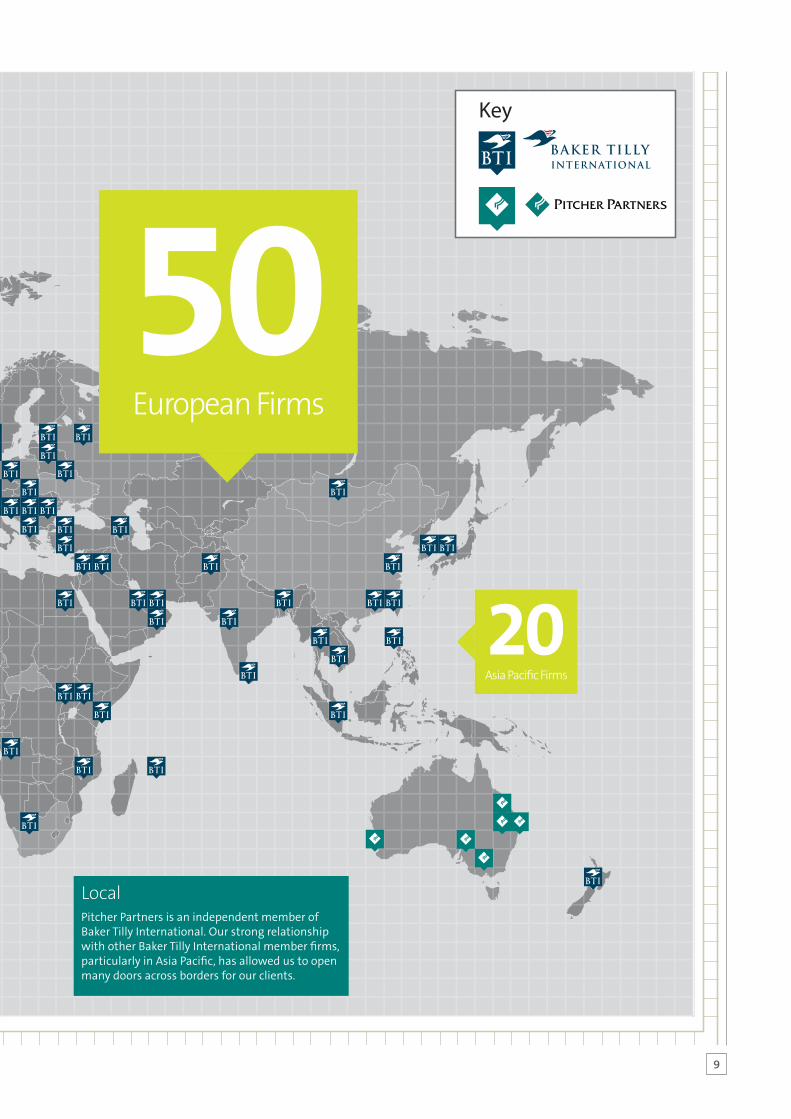
Key
20Asia Paci�c Firms
13North America
Firms
50European Firms
18Middle East and
African Firms
25Latin America
Firms LocalPitcher Partners is an independent member of Baker Tilly International. Our strong relationship with other Baker Tilly International member firms, particularly in Asia Pacific, has allowed us to open many doors across borders for our clients.
9

Get in touch...
Industry Statement_KPIs for Automotive Retailers 2017_2018
MELBOURNE
+61 3 8610 5000 [email protected]
ADELAIDE
+61 8 8179 2800 [email protected]
SYDNEY
+61 2 9221 2099 [email protected]
BRISBANE
+61 7 3222 8444 [email protected]
PERTH
+61 8 9322 2022 [email protected]
PITCHER.COM.AU
NEWCASTLE
+61 2 4911 2000 [email protected]
Pitcher Partners is an association of independent firms. Liability limited by a scheme approved under Professional Standards Legislation.
John Gavljak Partner – Automotive
+61 2 8236 [email protected]
John TaouilManager – Automotive
+61 2 8236 [email protected]


