ADAOB8 119 PITTSBURGH UNIV PA DEPT OF METALLURGICAL AND MATERI--ETC F/6 11/9 THERMOMECHANICAL TRANSITIONS IN POLYPHOSPHAZENES.(U) AUG B0 I C CHOY, J H MAGILL N00014-77-C-0310 UNCLASSIFIED TR-5 NL END
Transcript
ADAOB8 119 PITTSBURGH UNIV PA DEPT OF METALLURGICAL AND MATERI--ETC F/6 11/9THERMOMECHANICAL TRANSITIONS IN POLYPHOSPHAZENES.(U)AUG B0 I C CHOY, J H MAGILL N00014-77-C-0310
UNCLASSIFIED TR-5 NL
END
THERMOMECHAJNICAL TRANSITIONSIN POLYPHOSPHAZENES
I. C. Choy and J. H. Magill Q' /UDept. of Metallurgical and Materials Engr._____ University of Pittsburgh
METALLURGICAL AND MATERIALSENGINEERING
University of Pittsburgh
Pittsburgh, Pennsylvania 15261
_ _ _ _ ,80 818 05,
THERMOMECHANICAL TRANSITIONSIN POLYPHOSPHAZENES
I. C. Choy and J. H. MagillDept. of Metallurgical and Materials Engr.
University of PittsburghPittsburgh, Pennsylvania 15261
Submitted to J. Applied Polymer Science, 1980
Wx ;C
... ~ .
4ECUfPITV CLASSIFICATION OF THIS PAGE ("hlers Date En.tered)
REPORT DOCUMENTATION PAGE READ INSTRUCTIONS___________________________________ BEFORE COMPLETING FORM
IREPORT NUMBER 2.GOVT ACCESSION NO. RECIPIENT'S CATALOG NUMBER
Technical Report 15 / I-A L2 :-4. Tg~Las~as~- -~- -S. TYPE OF REPORT & PERIOD COVERED
Thermomechanical Transitions Interium Technical Report) in Polyphosphazenes _____________
S. PERFORMING ORGo. REPORT NUMBER
JAU TM.O.*We) _ C@1AC*R4t3M Ew~e)
10) C /Coy J.B //Magill N.3 N00014-77-C-031g (
9. PERFORMING ORGANIZATION NAME AND ADDRESS 10. PROGRAM ELEMENT. PROJECT, TASKARtEA & WORK UNIT NUMBERS
Dept. of Metallurgical/Materials Engineering/ NR 356-644 / ~University of PittsburghPittsburgh. PA 15261 1'
II. CONTROLLING OFFICE NAME AND ADDRESS 12. REPORT DATEOffice of Naval Research August 8, 1980Dept. of the Navy /7D 17 I. NUMBER OF PAGES '
Arlington, Virginia 22217 /..48"9
14. MONITORING AGENCY NAME IADRESS(f differte Ifrom Controlling Office) 115. SECURITY CLASS. (o1 this report)
T his document has been appioveIfor public relcase and sole; is
distribution is unlimited.
17. DISTRIBUTION STATEMENT (of the abetraet entered In Block 20. it different from Rteport)
Polyphosphazene Polymers, Filler, Dynamic Mechanical Properties, ThermalTransitions, Orientation, Density
2.AST ACT (Continue an reverse aide It Irocoseory and Identify by block ammber)Unoriented and orie~xted samples of two phosphazene hqmopolymers with
chemical structure [P")where X = 2FCH0 and p-CH"C'H 0 and three[ 2x] n' 3 2 3 6 4;,soefldunfilled and filled alkoxy-type polyphosphazene copolymers,plsoefldaryloxy-type copolymer were exampaed using a Rheovibron viscoelastometer.Measurements were made from -120'C to temperatures above the T(l) transitionof the respective polymers. The effects of orientation and repeated tempera-ture cycling through the T(l) transition temperatures were studied. Theoverall physical behavior of these polyphosphazenes was dominated by changes ~.~I
DD I JAN7, 1473 'EDITION OF I NOV 5IS OBSOLETES/k 0102-LF014-6601 SECURITY CLASSIFICA1TION OF T14IS PAGE (Whena Dots EntrA)
SECURITY CLASSIFICATION OF THIS PAOE (fton Date nIore.d)
that occurred through the primary softening dispersion and the so-calledmosomorphic or T(l) transition region. The enthalpy of the T(l) transition,and the T(l) temperature were investigated by differential scanning calorimetry(DSC) as a function of temperature cycling through the T(l) region. Forinstance, the change in enthalpy through the T(l) region is about an orderof magnitude larger than it is at Tm for the unfilled polyphosphazenebomopolymers. The Tg's of the polyphosphazenes were also determined. Densitymeasurements were made on oriented and unoriented specimens using a floatationmethod. Although an increase in density (and crystallinity) was observedwhen specimens were cycled through the T(l) transition, no significantdifference in density was found between oriented and unoriented materials.Some discussion of the molecular origin of the T(1) mesophase transition isincluded.
Key words: 1. Polyphosphazenes (homo and copolymers)2. Dynamic Mechanical Properties3. Thermal Transitions4. Orientation5. Density
Unoriented and oriented samples of two phosphazene homopolymers with
chemical structure [NPX 2]n where X - CF 3CH2 0 and p-CH3C6H40, and three
unfilled and filled alkoxy-type polyphosphazene copolymers, plus one filled
aryloxy-type copolymer were examined using a Rheovibron viscoelastometer.
Measurements were made from -120*C to temperatures above the T(l) transition
of the respective polymers. The effects of orientation and repeated temperature
cycling through the T(l) transition temperatures were studied. The overall
physical behavior of these polyphosphazenes was dominated by changes that
occurred through the primary softening dispersion and the so-called mosomorphic
or T(l) transition region. The enthalpy of the T(l) transition, and the T(l)
temperature were investigated by differential scanning calorimetry (DSC) as a
function of temperature cycling through the T(l) region. For instance, the
change in enthalpy through the T(1) region is about an order of magnitude
larger than it is at Tm for the unfilled polyphosphazene homopolymers. The
Tg's of the polyphosphazenes were also determined. Density measurements were
made on oriented and unoriented specimens using a floatation method. Although
an increase in density (and crystallinity) was observed when specimens were
cycled through the T(l) transition, no significant difference in density was
found between oriented and unoriented materials. Some discussion of the molecular
origin of the T(l) mesophase transition is included.
Key words: 1. Polyphosphazenes (homo and copolymers)
2. Dynamic Mechanical Properties
3. Thermal Transitions
4. Orientation
5. Density
.............................
2
I. INTRODUCTION
Conventional synthetic organic polymers usually consist of long chains
comprised of carbon backbone atoms or even carbon atoms linked through oxygen
and/or nitrogen atoms. The "organic" nature of such polymers is to be partly
responsible for some of their weaknesses in properties. Many of these materials
are flammable, tend to melt or oxidize and char at high temperatues. Most of
these macromolecules dissolve or swell in hydrocarbon fuels and solvents, which
restrict their utility as engineering materials. Very few of them remain
flexible down to low temperatures. Only a few of these synthetic polymers are
compatible with the human body and can be used in prosthetic devices such as
artificial heart pumps, replacement blood vessels, artificial kidneys, etc.
In an effort to overcome some of these deficiencies encountered in con-
ventional organic polymers, two main types of "inorganic" backbone polymers
have been developed. One of these contains silicon in the chain backbone and
forms a class known as poly(organosiloxanes). Presently some are used
in applications where stability, flexibility, and biomedical compatibility are
needed. The other class is the poly(organophosphazenes) which have alternating
phosphorus and nitrogen atoms in the backbone as illustrated in Figure 1. Develop-
ments and some related research activities in this area have been reviewed by
Shaw (1'2 ) and Alcock 4 . The details of polyphosphazene synthesis are given
in references 5 and 6. Polyphosphazene synthesis is unique in that a large
variety of polyphosphazenes, all with different properties, can be prepared from
one precursor, poly(dichlorophosphazene), by reacting it with other selected
reactants such as alcohols, phenols and amines. Thus far, more than 60 poly-
phosphazenes have been synthesized in this way and even more novel alkyl and
(7)aryl substituted polymers have now been prepared . Some important properties
of many of these materials are given in references 8 and 9.
3
In general, when only one type of substituent group is present, the poly-
mers are invariably semicrystalline, thermoplastic materials, but when two or
more types of substituent groups are introduced (mixed substituent polymers),
crystallinity is often inhibited to the point where only rubbery, amorphous
(10)materials are obtained ( , except perhaps where the two substituents are
present in about equal amounts (11)
The technological focus of phosphazene polymer research is predicted upon
applications where other polymers are deficient or even unsuitable. Applications
fall into three broad categories, namely (a) special service elastomers; (b)
fire-resistant elastomers and plastics; (c) biomedical engineering applications.
For instance, in group (a), fluoroalkoxy-type polyphosphazene elastomers (PNF)
exhibit unusual resistance to oils, solvents and hydraulic fluids. In addition.
they possess low-temperature flexibility (Tg = -60 n, -80*C) as well as high-
temperature stability. Through the proper choice of side groups, poly(fluoro-
alkoxyphosphazenes) can be designed to have serviceability in the range from
-60*C to 200C or even higher. The poly(fluoroalkoxyphosphazene) copolymers
are fairly tough, rubbery materials with tensile strength of 1080 to 1490 psi
and elongation from 150 to 280 percent or more 12'. These materials find uses
such as O-rings, lip-seals, arctic fuel hoses, gaskets, and in coated fabrics(1 3- 16 )
A wide variety of polyphosphazenes including rigid plastics, elastomers, flexible
films, and expanded foams have been developed approaching commercialization in
recent years.
In category (b), most organic polymers either burn rapidly in air, some often
evolving excessive amounts of smoke and toxic gases. The unfilled poly(arlyoxy-
phosphazenes) are self-extinguishing in air under normal test conditions.
They have relatively high limiting oxygen indices (i.e. LOI values) (17) which
can be raised as high as 65 when suitable fillers are incorporated in the polymer
...
4
matrix. It has been established recently, that they evolve low to moderate
levels of smoke (18 ) and toxic gases (19 ,20 ) compared with many other commercially
available polymers. Generally, it is found that both the flammability and the
smoke density of polyphosphazenes can be further reduced by using inert
fillers (18 ,2 1 ,2 2). Flame retardant foams and wire coverings feature amongst the
most promising applications for poly(aryloxyphosphazene) copolymers(23 '24)
currently under evaluation. In category (c), some polyphosphazenes are also found
to have potential as body organ replacements. Some show promise too, as bio-
degradable polymers (8 .2 5 . Water soluble materials such as poly(aminophosphazenes)
can function as carrier molecules for the controllable release of chemotherapeutic
drugs (8'25 ) in biological systems.
Many crystalline polyphosphazenes characteristically exhibit two first order
transitions(9 ) sometimes separated by a temperature interval often as much
as 150 to 250°C. The lower of these transitions, T(l), corresponds to a
transformation from a crystalline to a mesomorphic state(9 '26). The upper
transition, Tm, represents the true melting point where an isotropic melt results.
In the present work, we will deal with the behavior and nature of the
transitions at T(l) and Tm as revealed by thermomechanical measurements (Rheovibron),
density (floatation method) and calorimetric (DSC) measurments. Although
dynamical mechanical spectra have been reported using torsional braid(2 7) and
torsion pendulum techniques, the present study focuses on new information in
dynamical mechanical behavior in regards to polymer chemistry, filler type and
to pertinent property changes that depend upon temperature and sample orientation.
*Recent unpublished work by Plazek and associates has demonstrated that intorsional braid analysis two spurious peaks can be observed in the log decrementcurves when the material itself does not exhibit anything.
5
II. EXPERIMENTAL
1. Materials
The polymers used in this work were obtained from Dr. Allcock's
laboratory at Penn State University, Dr. R. Singler of the Army Materials
and Mechanics Research Center, Watertown, Massachusetts, and from Drs.
David Tate and David Lawson, Firestone Tire and Rubber Company, Akron, Ohio.
Materials are listed in Tables 1 and 2. Samples 1 and 2 are semi-
crystalline hompolymers. Samples 3 through 6 are unfilled and filled
hybrid copolymers. All polyphosphazene samples were of high average molecular
weight ( > 106) with broad molecular weight distribution (sometimes
Mw > 10)(6)
Samples 1 and 2 initially obtained in the form of unoriented films, were
also drawn to about X10 and X3.5 respectively, in order to investigate the
effects of molecular orientation on their dynamic mechanical properties and
T values. Sample 1 was drawn at 70C (which is just below T(l)) and Sampleg
2 was cold-drawn at room temperature. Fabrication by molding at higher
temperatures via melt crystallization invariably tended to induce brittleness
in these films or fibrilation in oriented samples so they were not further
studied.
2. Rheovibron Dynamic Viscoelastometer
Dynamic mechanical properties were measured with a Rheovibron Model DDV-II
(manufactured by Toyo Measuring Instruments Company, Japan). The storage
modulus, E', loss modulus, E" and loss tangent (tan 6) of the polymers were
obtained as a function of temperature (often in the range -120* to 180°C approximately)
at 3.5 and 110 Hz using heating and cooling rates of 1C/min. Liquid nitrogen
was used as a refrigerant for subambient temperature work. In subambient
measurementsmoisture was excluded from the specimens by means of a transparent
" ". ..6IL . . . . . ... .r '-
""" " "" '
6
plexiglass box that fitted over the instrument and which was purged continually
with dry air or nitrogen during sample equilibration and measurements.
3. Differential Scanning Calorimetry
A Perkin-Elmer DSC II calorimeter with a scanning auto zero and a mini-computer
was used to measure transition temperatures and to determine their respective heats
of transitions. The effects of thermal history on these enthalpies of transition
and transition temperatures were investigated by scanning as many as 9 to 10
cycles sometimes.
For T measurements, liquid nitrogen was used as a coolant in the DSCg
apparatus. Heats of transitions were determined by computerized integration of
the areas under the DSC curves using indium as a reference material. The instrument
temperature was calibrated using standard samples.
4. Density Measurement
Density measurements on unoriented and oriented samples of 1 and 2 were
carried out by the well-known floatation method using CsC1 aqueous solution.
The temperature of measurement was 24*C. Beginning from a rather dense CsC1
solution, small amount of distilled water was added to the solution from time to
time, with proper mixing, until the density of a test specimen matched exactly the
solution density. Then, the density of this solution was determined with a
pycnometer, which gave the sample density.
III. RESULTS AND DISCUSSION
1. Dynamic Mechanical Behavior
Data dealing with mechanical properties of polyphosphazenes are sparse and
sometimes conflicting. In the present experiments, the storage Young's modulus,
E', the loss modulus, E" and the loss factor tan 6 of the samples were obtained
from measurements in temperature interval from -120*C to temperatures sometimes
as high as 200, where the samples became too soft to make accurate measurements.
7
Results of El, E" and tan 6 versus temperature obtained for these
polyphosphazenes at 110 and 3.5 Hz are shown as curves in Figures 2 through 13.
All curves are corrected for clamping and other instrumental contributions using
the method outlined by Massa 28 ) several years ago, (see Appendix I). For all
of the samples the absolute values of E*, the complex modulus, lie so close to
the E' curves that they are omitted in these figures.
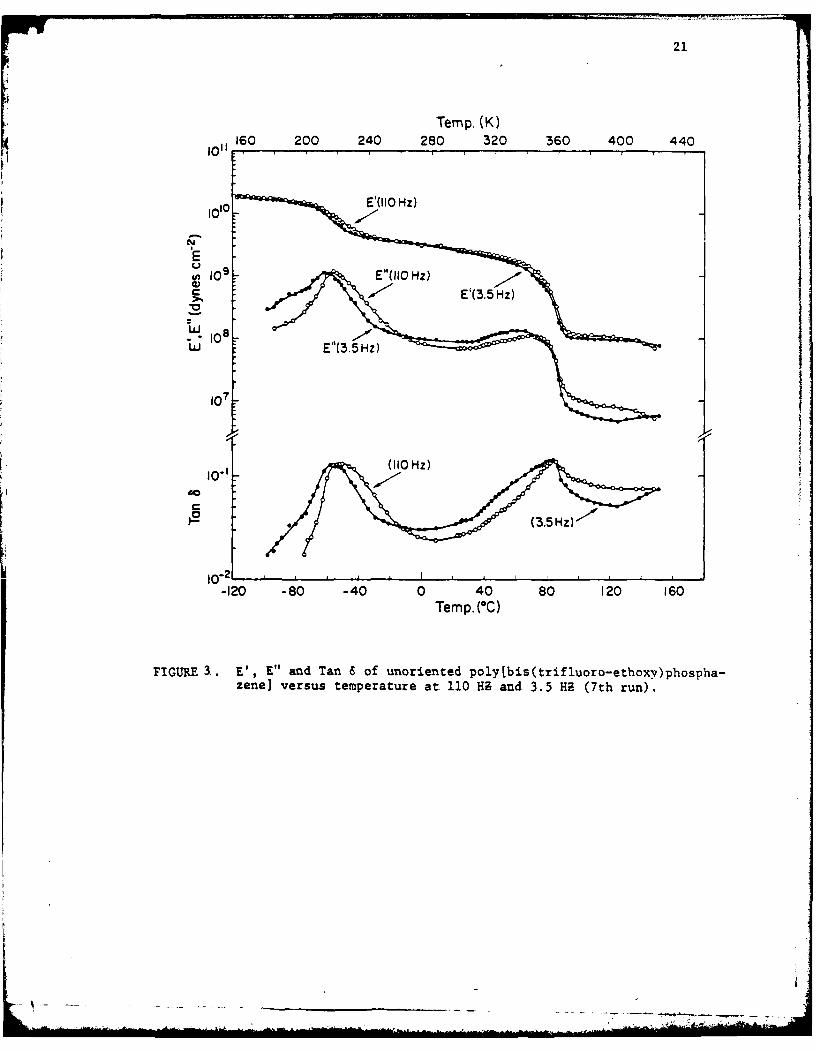
The dynamic mechanical response of unoriented poly[bis(trifluoroethoxy)
phosphazene] is illustrated in Figure 2 (1st run) and Figure 3 (7th consecutive
run). Typical plateau values of E' (approximately 1010 dynes/cm 2) are shown in
Figure 2 for the glassy region. Above the primary softening dispersion region,
9 2E' decreases rapidly to a value of about 2 x 10 dynes/cm , which lies much
higher than the -107 dynes/cm2 value usually encountered in amorphous rubbery
polymeric materials. Relaxation behavior associated with any glass transition
is termed a primary softening dispersion in this paper. This higher value
arises because of the crystalline nature of this polyphosphazene. About 80*C
a T() transition is apparent. This transition sets an upper temperature limit
for polyphosphazenes as useful engineering materials. It also provides a con-
venient lower temperature limit where the material can be easily compression
molded.
Crystallinity develops upon cycling the polymer up and down through T(l),
(see "Differential Scanning Calorimetry" section) as witnessed in Fig. 4, through
the increase in E' and a concomitant decrease in the height of the primary
softening dispersion peak in the tan 6 curves. The decrease in peak height
and in peak area corresponds to a reduction in the amorphous component of the
polyphosphazene (i.e., an increase in the crystalline fraction) of this polymer.
Repeated runs (up to seven times) in the Rheovibron clearly shows that E' and
T(l) temperature increase almost monotonically under these conditions. This
*Note that considerable errors arise if these corrections are omitted. (SeeAppendix 1).
-- j
8
behavior is associated with morphological changes that occur within the
sample. They match the enthalpy changes obtained from DSC measurements und-r
similar circumstances.
In their torsional braid measurements, Connelly, et al. (27) found four
distinct loss peaks, including a T(l) peak, for polyrbis(trifluoroethoxy)
phosphazene]. These four peaks consisted of a secondary softening dispersion (at about
-180*C), a primary softening dispersion, T(l) and Tm. From torsion pendulum
measurements, Allen, et al. (26) also found a T() transition for this polymer
evidenced by the drop in their G' curve, but their tan 6 curves did not clearly
show a distinct peak.
Figures 5 and 6 illustrate the E', E" and tan 6 curves for the ist and
3rd runs on well oriented (draw ratio xlO) polyfbis(trifluoroethoxy)phosphazene].
This polymer has a much higher modulus than its unoriented counterpart (see
Fig. 7). Although a decrease in the primary softening dispersion peak was
expected here, it was not observed, which indicates that no substantial
increase in crystallinity arises when the sample was oriented. This conclusion
is supported by density measurements and heats of the T(l) transition mentioned
later in this paper. Again, for this oriented polyphosphazene (compare Figures
5 and 6), an increase in E' and a decrease in the primary softening dispersion
peak occur upon cycling the sample. In Fig. 8 for the unoriented poly[bis-
(p-methlphonoxy)phosphazenel the primary softening dispersion occurs about 5*C
and the T(l) transition is evident at 145*C approximately. This polyphosphazene
shows a higher primary softening dispersion temperature than either samples 1
or 2 presumably because of its bulky side groups which tend to reduce the chain
flexibility and raisethe glass temperature.
Figure 9 depicts the E', E", tan 8 curves of oriented poly[bis(p-methyl-
phenoxy)phosphazene]. The broad T(l) transition region in this material may
be associated with the broad bimodal molecular weight distribution found by
9
(29)GPC analysis
Moving now to polyphosphazene copolymers with and without chemically inert
additives, some striking features are observed. For instance, E', E" and
tan 6 curves for unfilled and filled PNF (i.e., fluoroalkoxy-type) samples are
shown in Figures 10 through 12. All of these crosslinked, rubbery specimens
display a long plateau. Although filled PNF samples have much higher plateau
levels (by as much as X1O) than the unfilled polymer, yet only small differences
are found between carbon black-filled and silica-filled PNF specimens. No
T() transition is found for these hybrid copolymer samples (see Figures 10-13)
because of their amorphous (or very low crystalline) nature. Note however,
that double peaks (separated by more than 15*C) were observed in the primary
softening dispersion regions for all of these copolymeric PNF samples studies.
However, DSC scans only indicated a single glass transition, probably because
the glass temperatures of homopolymer components are too close to each other
to be resolved. The DSC method is unable to resolve two peaks that are
(30)close together. Elsewhere 3 , it has been reported that the Rheovibron
measurements succeeded where thermal methods failed for polysiloxane block
copolymers. In general, it has been noted that the dynamic mechanical test
provides one of the most sensitive probes for studying primary and secondary
softening dispersions in polymers (3 1 .
From torsional braid analysis for copolymers [NP(OCH2CF3) (OCH2C3F7)In
and [NP(OCH2CF3) (OCR 2(3F3 CHF2)]n, Connelly and Gillham(2 7 ) also found two
peaks 150 apart. These workers also reported the presence of two peaks in the
logarithmic decrement vs. temperature plots of their [NP(OCH2CF3) (OHC2C3F )]n
copolymer. Thermomechanical spectra of other phenoxy-type copolymers such as
[NP(OC6H5)(P-OC 6H4C2H5 )]n also exhibit two loss peaks in the primary dispersion
(32)region . This unusual behavior may be due to heterogeneities in the copolymer
structure which obtain during synthesis. For instance, in the substitution
of [NP C12]n with two Alkoxides, some block copolymer character may result (27).
-- - ________________________
10
(27Other experiments 27) have been made on homopolymer blends to investigate
rolymer compatibility, as well as to simulate or probe the effects of possible
irregularities in the copolymer strucutres. Contrary to expectation, only a
single primary softening peak was observed. Contrariwise, Beres, et al.(3 3)
have reported two Tg transitions in their DSC studies of two blends of
aryloxyphosphazene homopolymers where the hompolymer Tg values were more than
20*C apart.
An analysis of the dynamic mechanical spectra of filled samples using
simplified Mooney equation such as
Ef = E (1 + 2.5 4 + 14.1 2) (1)
where 4 is the volume fraction of filler, E is the modulus of the unfilled0
sample, and Ef is the predicted modulus for filled material, are given in Table
3. Estimated values of Ef are based upon spherical, non-interacting particles.
The differences noted in Table 3 may be attributed to uncertainties in the
nature and shape of filler particles but more especially in the degree of
crosslinking in these materials as provided by the manufacturer.
Mechanical spectra of APN (aryloxy-type) polyphosphazene containing
alumina trihydrate filler, are illustrated in Fig. 13. They show a rather
high storage modulus, E' in the glassy and rubbery plateau regions, some of
which is due to the high filler content (150 phr; see Table 2).
In summarythe relative magnitudes of the changes in E' in each transition
region, are tabulated in Table 4.
2. Differential Scanning Calorimetry
In Figure 14, the area of the endotherm at T(l) for poly[bis(trifluoroethoxy)
phosphazene] increases appreciably with repeated sample cycling just above T(l),
or by sample annealing in the vicinity of T(1). A gradual increase in the T(l)
11
temperature is also noted under these conditions. Annealing procedures such
as these, are important in improving crystalline order within specimens.
Plots of the changes in T(l) and AH1 (enthalpy change at T(1))as a
function of the number of heating cycles for unoriented poly[bis(trifluoroethoxy)
phosphazene] are illustrated in Figures 15 and 16. Limiting T(l) temperatures
as well as limiting heats of transition were determined from these plots to
be T(1)00= O.7°C and AH1 6.41 cal/g respectively, based upon the notion that
an asymptotic limits prevailed here.
The endotherm at T() for poly[bis(p-methylphenoxy)phosphazene] (not
illustrated in the figures) showed a similar response to repeated temperature
cycling through its T(1) of 154°C. The T(l) values and heats of T(1) transitions
for this polymer are tabulated (see Tables 4 and 5j.
Thermal analysis measurements were also made on the specimens measured in
the Rheovibron. Results showed that both T(l) and AHl were enhanced during
mechanical testing.
Whenever the poly[bis(trifluoroethoxy) phosphazenel sample is recrystallized
by slow cooling from the molten state, a marked increase in the enthalpy occurs
and the T() transition peak moves upwards by about 10°C. Changes in the
magnitude and shape of these curves are shown in Figure 17. Note that the
enthalpy change for the T(l) transition is about ten-fold greater than it is
at Tm. Specific values of T(l) - 91°C, T M 241.5*C; AH(T(l))= 8.4 cal/g andm
AH(Tm) = 0.8 cal/g were found in the current investigation. Similar results
have been reported (9'3 4) for this polymer. Whenever recrystallized samples
were cycled repeatedly through Tm, decreases in these values were observed,
maybe because some polyphosphazenes are heat sensitive at or above their melting
temperatures where they display some degree of degradation(34 ). However these other
authors did not subject their polyphosphazene to extensive high temperature
cycling. Other thermal stability analysis (2 0 '22' 35 ) have been made on these
-4 - -- -Jp.
12
materials and more extensive work is in progress.
Recrystallization after heating above Tm usually produces needle-shaped
crystallites instead well developed spherulites commonly encountered in melt
(34)crystallization or in solution cast films
Furthermore it has been estimated that the volume changes at the two
transitions are of the order of 4 to 6%. In Table 6 thermal analysis results
are summarized and comparisons are made with other polymers which also show
transitional changes in the solid state that are not mesomorphic in character.
Claims have been made from published X-ray diffraction studies on poly
[bis(chlorophenoxy)phosphazene] (3 7,38 ) that the T(l) transition involves a
transformation from the orthorhombic crystalline structure with 3-dimensional
order to a pseudo-hexagonal lattice exhibiting lateral order but longitudinal
disorder. The lateral chain order is preserved above T(.), and this disappears
completely above the higher first order (melting) transition. Recent broad-line
NMR investigations claim that the disorder that exists above T(1) is dynamic
rather than static in nature, and arises from the onset of rapid side-chain
(39)and backbone motions , although the writers of this paper believe that heterophase
fluctuations may be responsible for some of the property changes that occur
upon heating these polyphosphazenes. Much more experimental work is needed to
elucidate the properties in relation to other polymeric structures, and to
establish the extent and direction of chain motion. Equally important, the pre-
cise thermodynamics, volume changes, and kinetics of the transitions, at the
T() and Tm transitions also require further study.
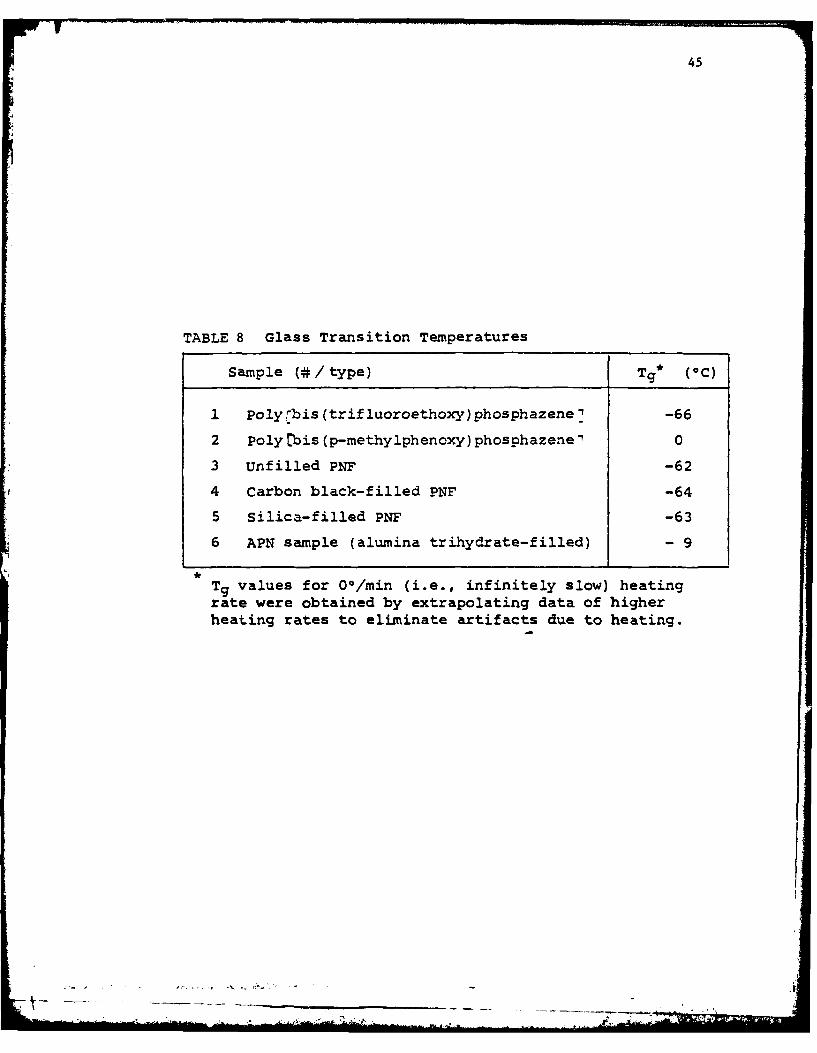
3. Glass Transition Temperatures
Tg values of the polyphosphazenes are reported in Table 7. No differences
between oriented and unoriented polyphosphazene samples were detected. Each
sample was measured at four different heating rates. The Tg corresponding to
-4 -
13
1 /min. heating rate was obtained by extrapolation from the ln(Tg) vs.
heating-rate plots. In general polyphosphazenes have lower Tg values than polymers
with organic-backbones. This is attributed to a flexible PN backbone, and a
comparatively large bond angles ( NPN - 119, PNP - 136*) compared to
C-C backbone polymers. The lack of substituents on nitrogen as well as the
flexibility imparted by the oxygen linkage from the phosphorus atom to the
substituent groups is also contributory. The alkoxy materials have even lower
Tg values consistent with the presence of the more flexible and less bulky
side groups in these polymers. A more restricted situation arises when alkyl
or aryl groups are linked directly to the phosphorus. Here measurably higher
Tg values are expected.
4. Density Measurement
Table 8 contains measured densities for samples #1 and #2used in this
work. While repeated temperature cycling through the T(l) region (in the
Rheovibron) raised the density because of increased crystallinity, oriented
polyphosphazene samples did not indicate higher densities than those found
in their unoriented counterpartspresumably because of morphological changes
induced on drawing initially.
5. The T(l) Transition in Polyphosphazenes
Although this transition is associated with mesophase formation, there is
no definitive work that clearly shows that polyphosphazene homopolymers behave
as real liquids and not solids between the T(l) and Tm temperatures of respective
polymers. The dynamic mechanical properties presented in this paper are incapable
of solving this problem although considerable softening is noted above T(l) as
Connelly and Gillhaw (27) has also shown. The T(l) transition depends upon
heating or cooling rates, whereas a true relaxation process would be expected
to show no hysteresis response. On the other hand, the mechanical response of
14
polyphosphazenes is rather broad, and this may, to some extent, be associated
with the broad molecular weight distribution of these polymers. For a
thermodynamic transition, the nature and the arrangement of the substituents
are both important factors since none of the polyphosphazenes with mixed
substituents (i.e. copolymers) exhibited either T(l) (thermal) or a mechanical
transition. X-ray diffraction measurements on APN and PNF samples showed
no measurable amount of crystallinity. However, a small, but broad endothermic
peak was noticeable in the PNF silica (filled) sample at 152*C but no peak(s)
was found in APN copolymer . Its origin is not clear since this peak is
intermediate between the T(l) and Tm transition encountered in the corresponding
linear homopolymer. Although the absence of meridional X-ray (26,33) reflections
and the persistence of equatorial x-ray reflections on going through the T(l)
temperature has been interpreted to mean that disturbances occur only along
the chain direction, more definitive measurements are still required since
alternative explanations are possible. Certainly, polyphosphazenes do not
exhibit rod-like properties in solution with a Mark-Houwink exponent of 0.52
If indeed they really form true liquid crystals above T(l), it can be
concluded that although rod-like polymers invariably gives rise to mesophase
behavior, liquid crystal formation is not necessarily connected with stiff
molecules, so that it still remains to establish beyond doubt, the true origin of
the T(l) transition in polyphosphazenes.
6. Conclusions
The thermomechanical behavior of several polyphosphazenes have been
determined from -120*C to 180*C approximately. The dynamic mechanical response
of these materials is dominated by two transitional regions, namely (a) primary
softening dispersion region (related to Tg) and (b) the so-called mesomorphic
transition region (T(l)) which occurs between Tg and Tm.
15
It has been found that the relative magnitudes of the changes in E'
for some specimens may be as large as (X500) through the primary softening
dispersion, whereas changes as large as (X16) were found through the so-called
mesomorphic transition.
In the semicrystalline polyphosphazenes, the enthalpy of transition through
T(l), AH1, is about an order of magnitude higher than the change that occurs
upon melting. The change in T(l) ethalpy is sensitive to temperature cycling and
asymptotically approaches a limiting value as the number of cycles tends to
infinity. Annealing enhances both crystallinity and sample modulus. Changes
in sample density were not found upon drawing.but annealing did increase the
sample density. For filled polyphosphazenes, measured moduli could not be accounted
for using a simplified Mooney equation based upon filler level alone.
APPENDIX
When a sinusoidal tensile strain is applied to a viscoelastic sample, a
sinusoidal stress is generated within the sample. There is a phase lag, 6,
between the strain and the stress. The instrument output provides a measure
of the complex dynamic Young's modulus, E*, as a function of frequency and
temperature. E* is related to the storage modulus E' and loss modulus E" of
the sample where
E*- E' + iE"
and the ratio E"/E" - tan 8, which is a measure of the stress-induced internal
friction found in the specimen. Consequently useful information about the
internal molecular motions within the polymer are obtained as a function of frequency
and temperature. However, instrument and sample clamping correction, if
avoided, will give rise to considerable errors, especially when comparatively
soft elastomers are investigated. Only when these corrections to IE* are made,
can the moduli and other parameters be derived with accuracy, using the equations
16
E' - IE*I cos 6
and E" - IE*I sin 6 - E' tan 6.
Figure 18 clearly illustrates that very large discrepancies arise if these
corrections are not undertaken for polyphosphazenes. As a precaution, they
should be applied to all Rheovibron measurements as Massa (28 ) has already
demonstrated. Certainly, they are most important for polyphosphazene and
(30)polysiloxane elastomers.
ACKNOWLEDGMENT
The authors are indebted to the Office of Naval Research (.Chemistry
Program), ONR for partial support in performing this study.
LJB
-J 17
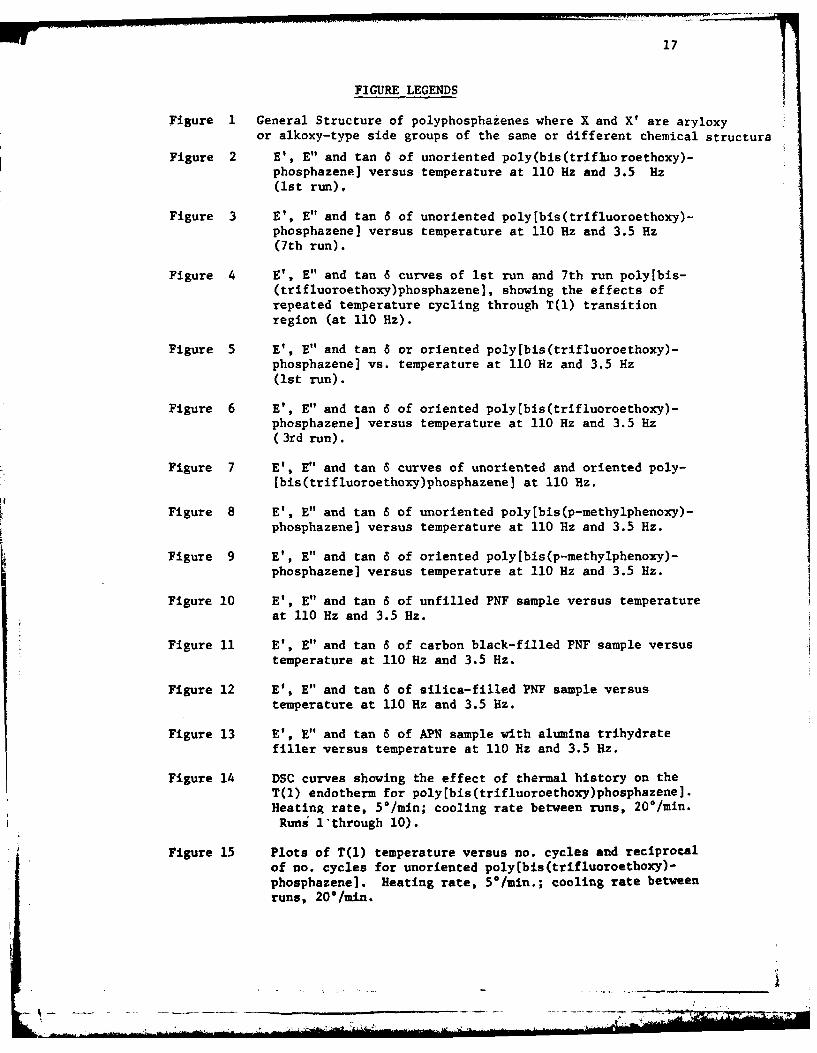
FIGURE LEGENDS
Figure 1 General Structure of polyphosphazenes where X and X' are aryloxyor alkoxy-type side groups of the same or different chemical structura
Figure 2 E', E" and tan 6 of unoriented poly(bis(trifluoroethoxy)-phosphazene] versus temperature at 110 Hz and 3.5 Hz(1st run).
Figure 3 E', E" and tan 6 of unoriented poly[bis(trifluoroethoxy)-phosphazene] versus temperature at 110 Hz and 3.5 Hz(7th run).
Figure 4 E', E" and tan 6 curves of 1st run and 7th run poly[bis-
(trifluoroethoxy)phosphazene], showing the effects ofrepeated temperature cycling through T(l) transition
region (at 110 Hz).
Figure 5 E', E" and tan 6 or oriented poly[bis(trifluoroethoxy)-phosphazene] vs. temperature at 110 Hz and 3.5 Hz(1st run).
Figure 6 E', E" and tan 6 of oriented poly[bis(trifluoroethoxy)-phosphazene] versus temperature at 110 Hz and 3.5 Hz(3rd run).
Figure 7 E', E" and tan 6 curves of unoriented and oriented poly-[bis(trifluoroethoxy)phosphazene] at 110 Hz.
Figure 8 E', E" and tan 6 of unoriented polylbis(p-methylphenoxy)-phosphazene] versus temperature at 110 Hz and 3.5 Hz.
Figure 9 E', E" and tan 6 of oriented poly[bis(p-methylphenoxy)-phosphazene] versus temperature at 110 Hz and 3.5 Hz.
Figure 10 E', E" and tan 6 of unfilled PNF sample versus temperatureat 110 Hz and 3.5 Hz.
Figure 11 E', E" and tan 6 of carbon black-filled PNF sample versustemperature at 110 Hz and 3.5 Hz.
Figure 12 E, E" and tan 6 of silica-filled PNF sample versustemperature at 110 Hz and 3.5 Hz.
Figure 13 E', E" and tan 8 of APN sample with alumina trihydratefiller versus temperature at 110 Rz and 3.5 Hz.
Figure 14 DSC curves showing the effect of thermal history on theT(l) endotherm for poly[bis(trifluoroethoxy)phosphazene].Heating rate, 50/min; cooling rate between runs, 20°/min.Runs 1"through 10).
Figure 15 Plots of T(l) temperature versus no. cycles and reciprocalof no. cycles for unoriented poly(bis(trifluoroethoxy)-phosphazene]. Heating rate, 5*/min.; cooling rate betweenruns, 20*/min.
18
FIGURE LEGENDS (Continued)
Figure 16 Heat of transition at T(l), AH plotted against no. cyclesand reciprocal no. cycles ior unoriented poly[bis-(trifluoroethoxy)phosphazene].
Figure 17 DSC scan for the comparison of the endotherms at T(l) andT for poly[bis(trifluoroethoxy)phosphazene]. Heatingrate, 20*/min. The sample was recrystallized from themelt at 252C .
Figure 18 Corrected and uncorrected curves of the dynamic Youngs moduli,E* , and the 6 for the unfilled fluoroalkoxy type poly-
phosphazene. Sample description is given in Table 2.
19
x
I I = N - n
x
Figure 1. General Structure of Poly(phosphazenes) where X and V'are aryloxy ar alkoxy type side groups of the same ordifferent chemical structure.
20
Temp. (K)
loll 160 200 240 280 320 360 400 440
10107 'IO z
E
w109-
C
(3.5 Hz)~
107
-120 -80 -40 0 40 80 120 160Temp. (*C)
FIGURE 2. V', E" and Tan 6 of unoriented poly~bis(trifluoro ethoxy)-phosphazene] versus temperature at 110HE and 3.5H8 (1st run).
21
Temp. (K)lol160 200 240 280 320 360 400 440
LI
-12 E8 -4 0H0 80Z0)6
zene]~ ~~ ~11 vesstmertrz)10 ~ad35H~(t u)
.1 22
Temp. (K)
loll 160 200 240 280 320 360 400 440
1010,
E
:LAJ
00
I-
10-2-120 -80 -40 0 40 80 120 160
Temp. (*C)
Figure 4. E', E" and tan 6 curves for the 1st and 7th runs for poly(bis~trifluoroethoxy)phosphazene], showing the effects of
repeated temperature cycling through the T(1) region (at 110 Hz).
23
Temp. (K)160 200 240 280 320 360 400 440
1012
loll
'E 1010-
07
010-lz
10-1
AM (35 iH:z)
10-21-120 -80 -40 0 40 80 120 160
Temp. (*C)
FIGURE 5. V', E" and Tan 6 of oriented polylbis(trifluoroethoxy)phospha-zone] temperature at 110 HE and 3.5 HE (1st run).
24
Temp. (K)160 200 240 280 320 360 400 440
10"2
U
w
01
0-2
-120 -80 -40 0 40 80 120 160Temp. (*C)
Figure 6 E', E" and tan 8 of oriented poly[bis(trifluoroethoxy)-pliosphazeria] versus temperature at 110 Hz and 3.5 Hz(3rd run).
25
Temp. (K)
lo0l1160 200 240 280 320 360 400 440
E'(oriented)
1010-
NY
EC-)
w
w 08
07
j~(unoriented)
10.21 II-120 -80 -40 0 40 80 120 160
Temp. (0C)
Figure 7 E', E" and tan 8 curves of unoriented and oriented poly-[bis(trifluoroetboxy)pbosphiazene] at 110 Hz.
26
Temp. (K)
101 200 240 280 320 360 400 440
EUIOz
0
-80 -40 0 40 80 120 160 200Temp. (*C)
FIGURE 8. V', E" and Tan 6 of unoriented poly(bis(p-methyl phenoxy)phosphazene] versus temperature at 110 HE and 3.5 HE.
27
Temp (K)
lol 200 240 1280 320 360 400 440
1010 (35z
SiL 109,
08:
-80 -40 0 40 80 120 160 200Temp. (*C)
FIGURE 9. E', E" and Tan 6 of oriented poly[bis(p-methylphenoxy)phosphazene]versus temperature at 110 HE and 3.5 HE.
28
Temp. (K)loll 200 240 280 320 360 400 440
1010- E'(lI0Hz)
'E 109
U
106 E"(3.5Hz) ' '(.5Hz
(3.5 Hz
10-2 I-80 -40 0 40 so 120 160 200
Temp. (tC)
FIGURE 10 E', E" and Tan 6 of unfilled PNF sample versus temperature at110 HR and 3.5 HR.
29
Temp. (K)
11 200 240 280 320 360 400 440
10~
101
:-109-
LLJLUJ
V (3.5 HZ
106
10.21I
-80 -40 0 40 80 120 160 200I
FIGURE 12. E', E" and Tan 6 of carbon black-filled PNF sample versustemperature at 110 HE and 3.5 HE.
30
Temp. (K)
1011 200 240 280 320 360 400 440
1010-
'E 109 -
C
108 E'0IHZ
0-1
10-2-80 -40 0 40 s0 120 160 200
Temp. (tC)
FIGURE 12. E', E" and Tan 6 of silica-filled PNF sample versus temperatureat 110 HI and 3.5 HE.
31
Temp. (K)12: 200 240 280 320 T,360 400 440
1010-
108 E "(3.5 H Z)
0-
-2
-80 -40 0 40 80 120 160 200Temp. (*C)
FIGURE 13. EV, E" and Tan 5 of APN sample with alumina trihydrate fillerversus temperature at 110 HE and 3.5 HE.
32
Temp. (K)320 340 360 380
I I I
Run IT(I) = 76.30CA -1.00
Run 4T(I)= 79.3"CA x 1.85
~T(11=80.056C06
= A = 2.01
a
Run 70
T(I) 80.55°C
A : 2.05
40 60 80 100Temp. (C)
FIGURE 14.DSC curves showing the effect of thermal history on the T(l)endotherm for poly[bis(trifluoroethoxy)phosghazene]. Heatingrate, 50 /min; cooling rate between runs, 20 /min. (Runs 1through 10).
_______________________ 2 1-~.
33
00
O N
-40
0 0 r=
0
02 w
U-4
o "0 0
00
&OW
0- 0S a
Aj 41~0
C4--0 0 ODU
00 (00)
34
l/ No, cycle0.2 0.4 0.6 0.8 1.0
6
00
5
4
3
0 2 4 6 810No. cycle f
FIGMPE 16. Heat of transition at T(l), 6H, vlotted against No. cycles andreciprocal of No. cycles for unoriented polytbis~trifluoroethoxy)phosphazene].
V77
35
N
00Lc) -
0 - C'J
0N
Aj 60 0
v --
0 NQJ0
0 0j
-i 0** r
(0
IJ. Er-
0)ODC
(BUISD8JOUj) do
36
Temp. (K)loll 80 120 160 200 240 280 -0
A CORRECTED
B UNCORRECTED
A
10107
-100
109
10-
1070I
1061 10-2-100 -80 -60 -40 -20 0 20
Temp. M0 )
Figure 18 Corrected and uncorrected curves of the dynamic Youns moduli,E*., and tan 8 curves for the unfilled fluoralkoxy type poly-phosphazene. Sample discription is given in Table 2.
37
TABLE LEGENDS
Table 1 Description of Homopolymers
Table 2 Description of Unfilled and Filled Copolymers ofPolyphosphazenes.
Table 3 Dynamic Young's Modulii of Filled Samples (Measured andPredicted).
Table 4 Changes in E' in the primary softening and T(l) transitionregions.
Table 5 T(l) Temperature and Heat of Transition, AHR, at T(.)for Poly(bis(trifluoroethoxy)phosphazene] for Orientedand Unoriented Specimens.
Table 6 T(l) Temperature and Heat of Transition, AH1, at T(1)for Poly[bis(p-methylphenoxy)phosphazene] for Orientedand Unoriented specimens.
Table 7 Comparison of Thermal Transition Data for Polyphosphazenes and
other polymers.
Table 8 Glass Transition Temperatures of Polyphosphazenes.
Table 9 Density of Polyphosphazenes.
38
TABLE 1.Description of Homopolymers
Sample (#r/type) Su.bstituents Description Source
1 Poly Fbis (trifluoro- C H0- Setfr lccethoxy)phosphazene] C 3 CH2O Shetfrmnncc
Table 5. Mesomorphic transition temperature T(l) and Heat of transition,AH at T(1), for poly~bis(trifluoroethoxy) phosphazene] for
oriented and unoriented specimens.
N.T(1) 0c (cal/g)
cycle Unoriented* oriented +Unoriented oriented
1 76.3 76.1 2.97 4.37
2 78.5 77.1 4.98 4.87
3 79.3 77.1 5.33 5.11
4 79.3 -5.51 5.17
5 - 77.8 -5.39
6 79.8 78.1 -5.44
7 80.0 -5.97 5.46
8 - 78.3 -5.54
9 80.3 -6.03
10 80.5 6.08
W r T(1)0=80.7 T(1) 0=79.1 A =' 6.41 AH1co 5. 78
*Heating rate - 5*/min., cooling rate between runs-20*/min.+Heating rate - 20*/min., cooling rate between runs-20*/min.#Obtained by extrapolation to infinite no. of cycle.
43
TABLE 6. T(1) Temperature and Heat of Transition, LH1, atT(1), for poly~bis (p-rethylphenoxy)phosphazenej,oriented and unoriented specimens
o.T(I) 0C LH1 (cal/g)
cycle Unoriented* Oriented* Unoriented oriented
1 132.6 138.1 3.25 2.98
2 154.1 153.6 8.10 8.62
3 154.1 9.24
4 154.3 153.8 8.58 9.18
5 154.6 153.6 8.69 9.18
6 154.6 153.8 9.22
-r7 154.3 153.8 8.80 9.24
8 154.3 153.6 8.81 9.23
00154.9 153.9 tAH 9.05 j 9.
*Heating rate =200/mmn
# obtained by extrapolation to infinite no. of cycle.
44
Table 7. Comparison of Thermal Transition Data for polyphosphazenesand other polymers (Ref. 36).
T(l) Tm AH (T (1 f H (TM) &V (T(1)1 6V (Tm)Sample (10C) (CC) (cal/g)(cal/g) % t
Poly Ibis (tr if luoro-etoyposhznj92 240 8.6 0.8 5 6
Tg values for 00/min (i.e., infinitely slow) heatingrate were obtained by extrapolating data of higherheating rates to eliminate artifacts due to heating.
46
TABLE 9 Density of Polyphosphazenes
(1) Poly[bis(trifluoroethoxy)phosphazenej
Sample Condition Density (g/ml)
Unoriented. 1) As received 1.6952) After 7th run 1.715
in Rheovibron
oriented 3) As drawn 1.6924) After 2nd run1.0
in Rheovibron1.0
(2) Poly Ebis (p-methylphenoxy) phosphazene]
Sample Condition Density (g/ml)
Unoriented. 1) As received 1.2472) After 1st run >.4
in Rheovibron >.4
Oriented 3) As drawn 1.244
47
REFERENCES
1. R. A. Shaw, B. W. Fitzsimmons and B, C. Smith, Chem. Rev, 62 (19621,
2. R. A. Shaw and R. Keat, Organic Phosphorous Compounds, (New York:Wiley Interscience, 1972), Chapter 1.
3. H. R. Allcock, Chem. Rev. 72 (1972), p. 315.
4. H. R. Allcock, Phosphorous-Nitrogen Compounds, (New York: AcademicPress, 1972).
5. H. R. Allcock and R. L. Kugel, Journal of American Chemical Society,87 (1965), p. 4216.
6. H. R. Allcock, R. L. Kugel and J. K. Valan, Inorganic Chemistry, 5(1966), p. 1709.
7. T. L. Evans, P. R. Suszko, D. B. Patterson and H. R. Ailcock, A.C.S.Organic Coatings and Plastics Chemistry, 41, 93 (1979).
8. H. R. Allcock, Angew, Chem. Int. Ed. Engl. 16 (1977), pp. 147-156.
9. R. E. Singler, N. S. Schneider and G. L. Hagnauer, Polymer Engineering andScience, 15, No. 5 (1975), pp. 321-338.
10. S. H. Rose, Journal of Polymer Science, Part B, 6 (1968), pp. 837-839.
11. R. L. Dieck and L. Goldfarb, J. Polym. Sci., Polym. Chem. Ed., 15, 361 (1977).
12. K. A. Reynard, R. W. Sicka and S. H. Rose, Synthesis of New Low TemperaturePetroleum Resistant Elastomers, AMMRC CTR-72-8-AD 745900 (Cleveland, Ohio,Horizons, Inc., June 1972).
13. D. P. Tate, J. Polymer Science: Symposium, No. 48, (1974), pp. 33-45.
14. T. A. Antkowiak, Phosphonitrilic Fluoroelastomer Fuel Rose-Utilization ofExtruded Tubes, MERADCOM CTR 70-76-C-0239 (Akron, Ohio: Firestone Tire andRubber Company, October 1977).
15. J. C. Vicic and K. A. Reynard, J. Applied Polymer Science, 21 (1977), p. 3185.
16. P. Touchet and P. E. Gatza, Journal of Elastomers and Plastics, 9(1977),pp. 3-24.
17. ASTh Method D 2863-74, "Flammability of Plastics Using the Oxygen IndexMethod", Am. Soc. Test, Mater., (1974), p. 701.
18. E. J. Quinn and R. L. Dieck, J. Fire and Flammability, 7, (1976), p. 358.
19. Di Edvardo et al., Organic Coatings Preprints, 36(2) (1976), p. 737.
20. K. Sebata, J. H. Magill and Y. C. Alarie, J. Fire and Flammability, 9 (1978)pp. 50-70.
48
21. E. J. Quinn and R. L. Dieck, J. Fire and Flammability, 7 (1976), p. 5.
22. S. V. Pedadda and J. H. Magill, J. Fire and Flammability, 11 (1980),pp. 63-82.
23. K. A. Reynard, R. W. Sicka, J. E. Thomson and S. H. Rose, Poly(aryloxyphosphazene)Foams and Wire Coverings, Horizons Inc., Naval Ship Engineering Center CTRNo. 024-73-5474 (March 1975).
24. E. J. Quinn and R. L. Dieck, J. Cellular Plastics, 13(2) (1977), p. 96.
25. H. R. Allcock, Chemtech, 5 (1975), p. 552.
26. G. Allen, C. J. Lewis and S. M. Todd, Polymer, 11 (1970), pp. 44-62.
27. T. M. Connelly, Jr. and J. K. Gillham, J. Appl. Pol. Sci., 20 (1976),pp. 473-488.
28. D. J. Massa, J. Appl. Phys. 44 (1973) p. 2595.
29. R. E. Singler, Private communication
30. H. M. Li and J. H. Magill, Polymer 19 (1978), p. 829.
31. L. E. Nielsen, Mechanical Properties of Polymers and Composites, MarcelDekker, Inc. 1974, Vol. 1, pp. 11-17.
32. J. K. Gillham, unpublished results, 1975, see ref. 27.
33. J. J. Beres, N. S. Schneider, C. R. Desper and R. E. Singler, Macromolecules,July-August (1979), p. 566.
34. N. S. Schneider, C. R. Desper and R. E. Singler, J. Appl. Pol. Sci. 20,(1976), pp. 3087-3103.
35. P. J. Lieu and J. H. Magill, J. Fire and Flammability, 12 (1980), p. 17.
36. N. S. Schneider and C. R. Desper, Liquid Crystalline Order in Polymers,(New York: Academic Press, 1978), p. 310.
37. C. R. Desper and N. S. Schneider, Macromolecules, 9 (1976) pp. 424-428.
38. S. M. Bishop and I. H. Hall, British Polymer Journal, 6 (1974) pp. 193-204.
39. M. N. Alexander, C. R. Desper, P. L. Sagalyn and N. S. Schneider,Macromolecules, 10 (1977) pp. 721-723.
'4.. .. . . .. .. .
I
TECHNICAL REPORT DISTRIBUTION LIST
No. Copies No. Copies
Office of Naval Research Defense Documentation CenterArlington, Virginia 22217 Building 5, Caieron StationAttn: Code 472 2 Alexandria, Virginia 22314 12
';Office of Naval Research U.S. ArMy Research OfficeArlington, Virginia 22217 P.O. Box 12211Attn: Code 1021P 1 6 Research Triangle Park, N.C. 27709
Attn: CRD-AA-IPONR Branch Office536 S. Clark Street Naval Ocean Systems CenterChicago, Illinois 60605 San Diego, California 92152Attn: Dr. Jerry Smith Attn: Mr. Joe M6Cartney
ONR Branch Office715 Broadway
-New York, New York 10003 Naval Weapons CenterAttn: Scientific Dept. 1 China Lake, California 93555
Attn: Head, Chemistry Division 1ONR Branch Office1030 East Green Street Naval Civil Engineering LaboratoryPasadena, California 91106 Port Hueneme, California 93041Attn: Dr. R. J. Marcus 1 Attn: Mr. W. S. Haynes
ONR Branch Office Professor 0. Heinz760 Market Street, Rm. 447 Department of Physics & ChemistrySan Francisco, California 94102 Naval Postgraduate SchoolAttn: Dr. P. A. Miller 1 Monterey, California 93940 1
ONR Branch Office Dr. A. L. Slafkosky495 Sunmer Street Scientific AdvisorBoston, Massachusetts 02210 Commnandant of the Marine Corps (Code RD-I1Attn: Dr. L. H. Peebles Washington, D.C. 20380 1
Director, Naval Research Laboratory Office of Naval ResearchWashington, D.C. 20390 Arlington, Virginia 22217Attn: Code 6100 1 Attn: Dr. Richard S. Miller 1
The Asst. Secretary of the Navy (R&D) ONR Resident RepresentativeDepartment of the Navy Carnegie-Mellon UniversityRoom 4E736, Pentagon Room 407 - Margaret Morrison BuildingWashington, D.C. 20350 1 Pittsburgh, Pennsylvania 15213 1
Commnander, Naval Air Systems ConnandDepartment of the Navy
)r. T. C. Williams Dr. M. GoodUnion Carbide Corp. University of New OrleansChemicals and Plastics Department of ChemistryTarrytown Technical Center LakefrontTarrytown, New York 1 New Orleans, Louisiana 70122
Dr. R. Soulen Douglas Aircraft Co.Contract Research Dept. 3855 Lakewood BoulevardPennwalt Corp. I Long Beach, California 90846900 First Avenue Attn: Technical LibraryKing of Prussia, Pennsylvania 19406 Cl 290/36-84
AUTO-SuttonDr. A. G. MacDiarmidUniversity of Pennsylvania NASA-Lewis Research CenterDepartment of Chemistry 21000 Brookpark RoadPhiladelphia, Pennsylvania 19174 1 Cleveland, Ohio 44135
Attn: Dr. T. T. Serafini, MS 49-1Dr. G. DunksUnion Carbide Corp. Dr. J. GriffithCorporate Research Laboratory Naval Research LaboratoryTarrytown Technical Center Chemistry Section, Code 6120Tarrytown, New York 10591 Washington, D.C. 20375
Dr. A. Rheingold Dr. G. GoodmanSUNY Plattsburg Globe-Union Inc.Department of Chemistry 5757 North Green Bay AvenuePlattsburg, New York 12901 1 Milwaukee, Wisconsin 53201
Dr. E. Fischer, Code 2853Naval Ship Research and Development CtrAnnapolis DivisionAnnapolis, Maryland 21402 1
Dr. H. Allcock 1 Dr. Martin H. Kaufman, HeadPennsylvania State University Materials Research Branch (Code 4542)Department of Chemistry Naval Weapons CenterUniversity Park, Pennsylvania 16802 China Lake, California 93555 1
Dr. M. KenneyCase-Western UniversityDepartment of ChemistryCleveland, Ohio 44106 1
Dr. R. Lenz Dr. C. AllenUniversity of Massachusetts University of VermontDepartment of Chemistry Departinent of ChemistryAmherst, Massachusetts 01002 1 Burlington, Vermont 05401
Dr. M. David Curtis Dr. D. BergbrelterUniversity of Michigan Texas A&M UniversityDepartment of Chemistry Department of ChemistryAnn Arbor, Michigan 48105 College Station, Texas 77843