36
PKO Bank Polski SA Group LEADER ON THE STABLE MARKET October 2012

PKO Bank Polski SA Group
LEADER ON THE STABLE MARKET
October 2012
1.1.1.1. PKO Bank Polski: The Leading Polish and CEE BankPKO Bank Polski: The Leading Polish and CEE BankPKO Bank Polski: The Leading Polish and CEE BankPKO Bank Polski: The Leading Polish and CEE Bank
2.2.2.2. Operating EnvironmentOperating EnvironmentOperating EnvironmentOperating Environment
3.3.3.3. Continued Strong Financial PerformanceContinued Strong Financial PerformanceContinued Strong Financial PerformanceContinued Strong Financial Performance
4.4.4.4. Focused StrategyFocused StrategyFocused StrategyFocused Strategy
5.5.5.5. AppendixAppendixAppendixAppendix

3
The leading bank in CEE and PolandThe leading bank in CEE and PolandThe leading bank in CEE and PolandThe leading bank in CEE and Poland
� Largest universal bankLargest universal bankLargest universal bankLargest universal bank in Polandin Polandin Polandin Poland since 1919 and amongst the leading banks in CEE (1) by total assets, net income, total equity, loans and deposits, size of customer base and distribution network
� No. 1 in Polish banking sectorNo. 1 in Polish banking sectorNo. 1 in Polish banking sectorNo. 1 in Polish banking sector in terms of all mentioned metrics
� Leading bank in CEELeading bank in CEELeading bank in CEELeading bank in CEE and one of Top 25 bank in Europe by market cap
� Robust funding, strong liquidity profile and strong capitalisatiRobust funding, strong liquidity profile and strong capitalisatiRobust funding, strong liquidity profile and strong capitalisatiRobust funding, strong liquidity profile and strong capitalisationononon combined with strong and consistent financial performance strong and consistent financial performance strong and consistent financial performance strong and consistent financial performance
� Dividend payout ratio Dividend payout ratio Dividend payout ratio Dividend payout ratio (2) at 40,15% of 2011 net profit
� Ranked among Top 10Ranked among Top 10Ranked among Top 10Ranked among Top 10 out of 91 European Banks during 2011 EBA stress EBA stress EBA stress EBA stress testtesttesttest (3)
� Strong credit ratingStrong credit ratingStrong credit ratingStrong credit rating by S&P (A-) and Moody’s (A2)
� Listed on Warsaw Stock ExchangeListed on Warsaw Stock ExchangeListed on Warsaw Stock ExchangeListed on Warsaw Stock Exchange since 2004, the largest and most liquid exchange in the CEE
Notes: (1) Central and Eastern Europe (“CEE”) excludes Commonwealth of Independent States (“CIS”) and Turkey. (2) Payout ratio in % of stand-alone net profits of the Bank. (3) Under the severe stress scenario. (4) Impaired loans to total gross loans and advances to customers under IFRS. (5) Net interest income for the year divided by average interest bearing assets for the period calculated using ending quarterly balances. (6) Net profit attributable to equity holders of the parent company for the period divided by the average shareholders’ equity calculated using ending quarterly balances.
Rebased to PKO Rebased to PKO Rebased to PKO Rebased to PKO BP BP BP BP Share PriceShare PriceShare PriceShare Price in PLNin PLNin PLNin PLN
Share price performance since Share price performance since Share price performance since Share price performance since 10.11.04 (I10.11.04 (I10.11.04 (I10.11.04 (IPOPOPOPO) to 31.08.12) to 31.08.12) to 31.08.12) to 31.08.12
45.3%23.2%
(64.8%)
Ke y financ ial in fo rmation Ke y financ ial in fo rmation Ke y financ ial in fo rmation Ke y financ ial in fo rmation (P LN bn)(P LN bn)(P LN bn)(P LN bn) 2009200920092009 2010201020102010 2011201120112011 1H'111H'111H'111H'11 1H'121H'121H'121H'121H'12/1H'12/1H'12/1H'12/
1H'111H'111H'111H'11
Net loans 117 131 142 136 141 +4.2%
Total assets 156 170 191 179 190 +6.6%
Deposits 125 133 146 133 147 +10.5%
Equity 20 21 23 21 23 +11.5%
Total Banking Income 8.9 10.2 11.1 5.3 5.8 +8.9%
Ne t p rofi tNe t p rofi tNe t p rofi tNe t p rofi t 2.32.32.32.3 3 . 23 . 23 . 23 . 2 3 . 83 . 83 . 83 . 8 1 .81 .81 .81 .8 2.02.02.02.0 +6.3%
Earnings per share, diluted (PLN) 2.06 2.57 3.05 1.47 1.56 +6.3%
Div ide nd pe r Share (PLN)Div ide nd pe r Share (PLN)Div ide nd pe r Share (PLN)Div ide nd pe r Share (PLN) 1 . 901 . 901 . 901 . 90 1 . 981 . 981 . 981 . 98 1 .271 .271 .271 .27 xxxx xxxx xxxx
Loan to Deposit Ratio 93.2% 98.3% 96.7% 97.5% 96.2% -1.4 pp.
Imapaired Loans Ratio(4) 7.6% 8.0% 8.0% 7.6% 8.7% +1.0 pp.
(Core ) Tie r 1 Rat io (Core ) Tie r 1 Rat io (Core ) Tie r 1 Rat io (Core ) Tie r 1 Rat io 13 . 5%13. 5%13. 5%13. 5% 11. 3%11. 3%11. 3%11. 3% 11 . 2%11 . 2%11 . 2%11 . 2% 11 .5%11 .5%11 .5%11 .5% 12. 0%12. 0%12. 0%12. 0% +0. 5 pp .+0 . 5 pp .+0 . 5 pp .+0 . 5 pp .
Net Interest Margin(5) 3.9% 4.4% 4.6% 4.5% 4.7% +0.3 pp.
Cost to Income Rat ioCost to Income Rat ioCost to Income Rat ioCost to Income Rat io 47 . 9%47. 9%47. 9%47. 9% 41. 7%41. 7%41. 7%41. 7% 39 . 6%39 . 6%39 . 6%39 . 6% 39 .9%39 .9%39 .9%39 .9% 38. 8%38. 8%38. 8%38. 8% -1 . 2 pp .-1 . 2 pp .-1 . 2 pp .-1 . 2 pp .
RoAERoAERoAERoAE ( 6)( 6)( 6)( 6) 14 . 8%14. 8%14. 8%14. 8% 14. 9%14. 9%14. 9%14. 9% 17 . 5%17 . 5%17 . 5%17 . 5% 16 .3%16 .3%16 .3%16 .3% 17. 5%17. 5%17. 5%17. 5% +1. 2 pp .+1 . 2 pp .+1 . 2 pp .+1 . 2 pp .
0
10
20
30
40
50
60
PKO BP WIG 20 Euro STOXX Banks
Shareholders structure on 24 July 2012 r. Shareholders structure on 24 July 2012 r. Shareholders structure on 24 July 2012 r. Shareholders structure on 24 July 2012 r. (after settlement of transaction of shares sale by State Treasu(after settlement of transaction of shares sale by State Treasu(after settlement of transaction of shares sale by State Treasu(after settlement of transaction of shares sale by State Treasury)ry)ry)ry)
State State State State Treasury Treasury Treasury Treasury 33.39%33.39%33.39%33.39%
BGKBGKBGKBGK10.25%10.25%10.25%10.25%
ING OFEING OFEING OFEING OFE5.17%5.17%5.17%5.17%
OthersOthersOthersOthers51.19%51.19%51.19%51.19%
4
38.6% 38.8%42.6% 43.5% 44.8%
47.5%52.5% 53.3%
Ko
me
rcni
(So
c G
en
)
PK
O B
P
OTP
BR
E
BZ W
BK
Pe
kao
(UC
G)
Ers
te
RB
I
17.5% 16.9%15.3% 14.5% 14.0%
10.8%
4.6%
-6.3%
PK
O B
P
BZ
WB
K
BR
E
Ko
me
rcn
i
(So
c G
en
)
Pe
kao
UC
G)
RB
I
OTP
Ers
te
16.6%
9.4%7.3% 7.1%
6.1%
2.5% 1.5% -1.1%
19.4%
8.8%10.3%
4.5%3.1% 3.3% 2.5%
4.9%
RB
I
PK
O B
P
BR
E
Pe
kao
(UC
G)
Ko
me
rcn
i
(So
c G
en
)
BZ W
BK
Ers
te
OTP
net loans deposits10.19.3
5.9 5.2 5.0 3.9 3.5 2.9
PK
O B
P
Pe
kao
(UC
G)
Ers
te
Ko
me
rcn
i
(So
c G
en
)
RB
I
BZ W
BK
OTP
BR
E
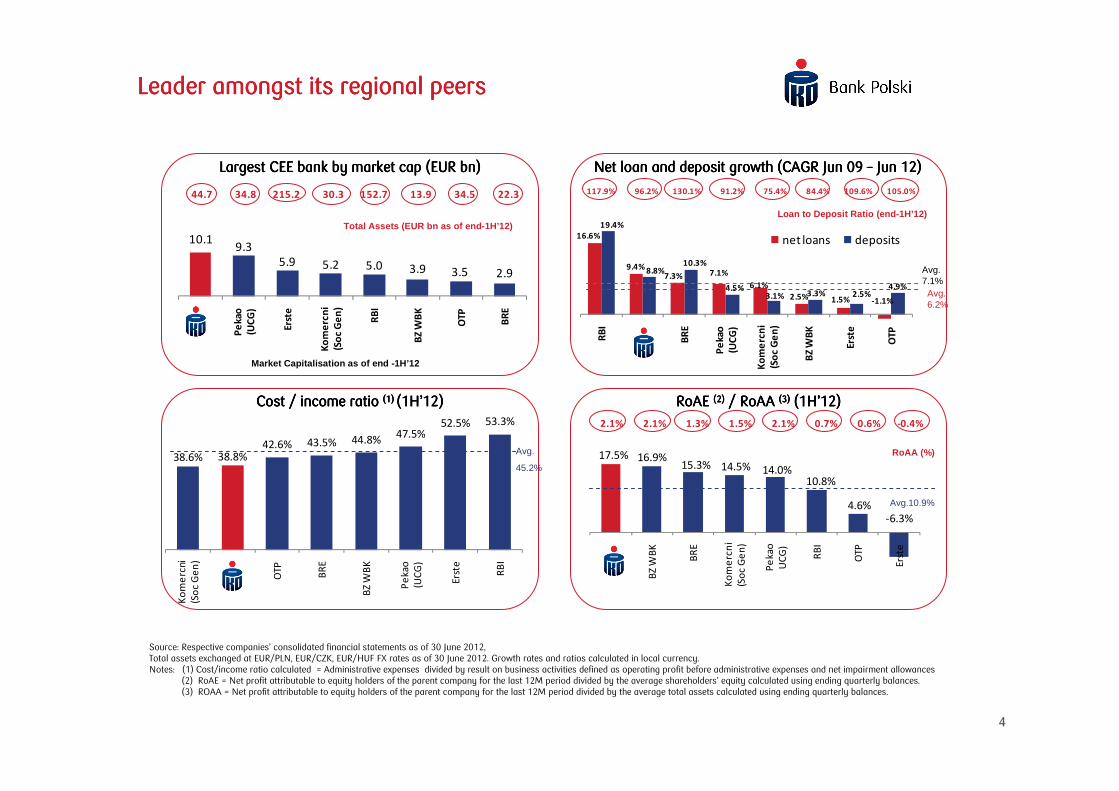
Leader amongst its regional peersLeader amongst its regional peersLeader amongst its regional peersLeader amongst its regional peers
Largest CEE bank by market cap (EUR bn)Largest CEE bank by market cap (EUR bn)Largest CEE bank by market cap (EUR bn)Largest CEE bank by market cap (EUR bn)
Total Assets (EUR bn as of end-1H’12)
Source: Respective companies’ consolidated financial statements as of 30 June 2012, Total assets exchanged at EUR/PLN, EUR/CZK, EUR/HUF FX rates as of 30 June 2012. Growth rates and ratios calculated in local currency.Notes: (1) Cost/income ratio calculated = Administrative expenses divided by result on business activities defined as operating profit before administrative expenses and net impairment allowances
(2) RoAE = Net profit attributable to equity holders of the parent company for the last 12M period divided by the average shareholders’ equity calculated using ending quarterly balances. (3) ROAA = Net profit attributable to equity holders of the parent company for the last 12M period divided by the average total assets calculated using ending quarterly balances.
Market Capitalisation as of end -1H’12
Cost / income ratio Cost / income ratio Cost / income ratio Cost / income ratio (1) (1) (1) (1) ((((1H1H1H1H’’’’12121212)))) RoAE RoAE RoAE RoAE ((((2222)))) / RoAA / RoAA / RoAA / RoAA ((((3333)))) ((((1H1H1H1H’’’’12121212))))
RoAA (%)Avg.
45.2%
Avg.10.9%
Loan to Deposit Ratio (end-1H’12)
Net loan and deposit growth (CAGR Net loan and deposit growth (CAGR Net loan and deposit growth (CAGR Net loan and deposit growth (CAGR Jun Jun Jun Jun 00009999 –––– Jun Jun Jun Jun 11112222))))
Avg. 7.1%
Avg. 6.2%
44.7 34.8 215.2 30.3 152.7 13.9 34.5 22.3 117.9% 96.2% 130.1% 91.2% 75.4% 84.4% 109.6% 105.0%
2.1% 2.1% 1.3% 1.5% 2.1% 0.7% 0.6% -0.4%

5
19.2 19.520.0 20.1 19.9
19.5 19.2 19.2 18.9
12.8
13.8 14.1 14.213.8
13.3 13.113.5
13.0
16.016.6
17.2 17.217.0
16.5 16.2 16.4 16.0
10.0
15.0
20.0
2008 2009 2010 1Q'11 2Q'11 3Q'11 4Q'11 1Q'12 2Q'12
23.5 23.4 23.2 23.0 23.0 22.5 22.3 22.3 22.0
10.6
12.911.7
10.912.1 12.6 12.1
11.2 11.5
17.318.5
17.9 17.518.1 18.1 17.8 17.5 17.4
5.0
10.0
15.0
20.0
25.0
2008 2009 2010 1Q'11 2Q'11 3Q'11 4Q'11 1Q'12 2Q'12
14.316.8
25.3
Total Assets Total Equity Net Profit
Market share (%) 1H 2012
Maintaining leadership in Poland Maintaining leadership in Poland Maintaining leadership in Poland Maintaining leadership in Poland –––– #1 in Polish banking sector #1 in Polish banking sector #1 in Polish banking sector #1 in Polish banking sector
Market shareMarket shareMarket shareMarket share
Highest profitability, assets and capital in the sectorHighest profitability, assets and capital in the sectorHighest profitability, assets and capital in the sectorHighest profitability, assets and capital in the sector
Source: PFSA, Chamber of Fund and Asset Management as of 30 June 2012Notes: PKO TFI is a fully owned subsidiary of PKO BP since October 2009.
PKOPKOPKOPKO’’’’s market share in net profit is 1s market share in net profit is 1s market share in net profit is 1s market share in net profit is 11111 pp. higher pp. higher pp. higher pp. higher than market share based on total assetsthan market share based on total assetsthan market share based on total assetsthan market share based on total assets
Total
Loans market share (%)Deposits market share (%)
Total
Private individuals
Private individuals
Institutional entities
Institutional entities
Mutual funds market share
101 102110
120 124 124 115 115127 128
6.5
0.0
1.0
2.0
3.0
4.0
5.0
6.0
7.0
0
40
80
120
160
1Q'10 2Q'10 3Q'10 4Q'10 1Q'11 2Q'11 3Q'11 4Q'11 1Q'12 2Q'12
%PLN bn
Total assets of mutuals funds (PLN bn) PKO TFI market share (%)
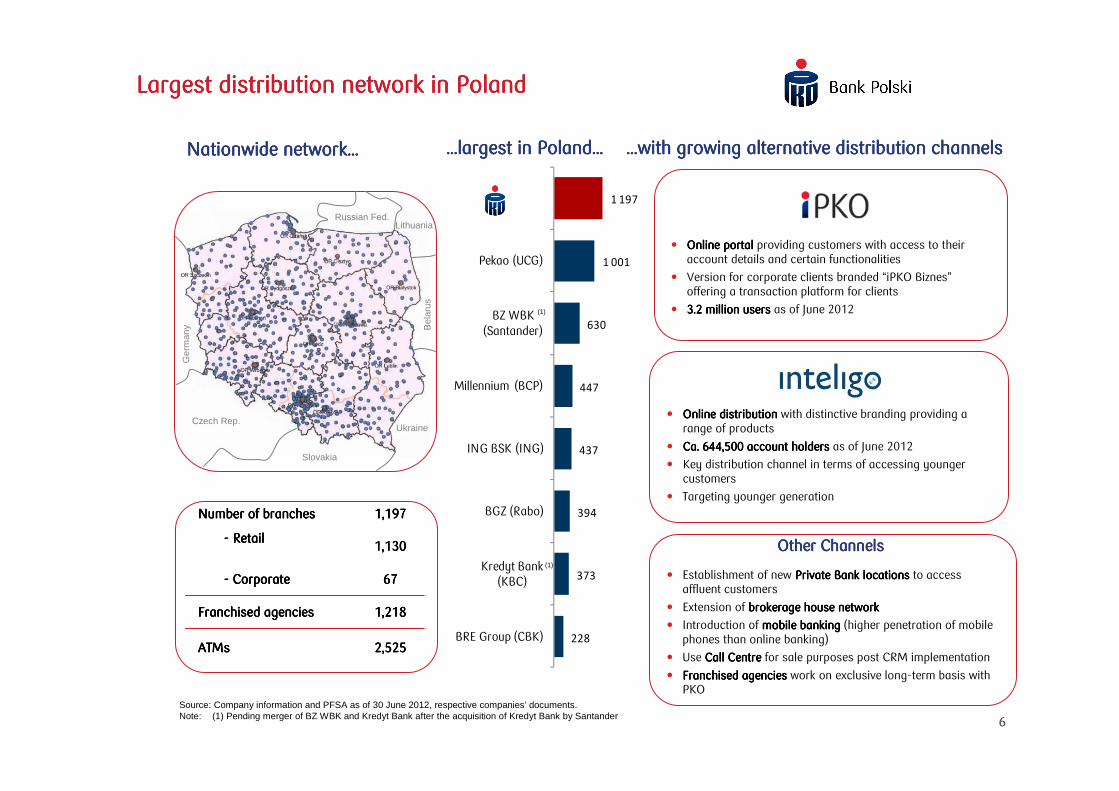
6
1 197
1 001
630
447
437
394
373
228
Pekao (UCG)
BZ WBK (Santander)
Millennium (BCP)
ING BSK (ING)
BGZ (Rabo)
Kredyt Bank (KBC)
BRE Group (CBK)
Largest distribution network in PolandLargest distribution network in PolandLargest distribution network in PolandLargest distribution network in Poland
Nationwide networkNationwide networkNationwide networkNationwide network………… …………largest in Polandlargest in Polandlargest in Polandlargest in Poland………… …………with growing alternative distribution channelswith growing alternative distribution channelswith growing alternative distribution channelswith growing alternative distribution channels
Number of branchesNumber of branchesNumber of branchesNumber of branches 1,191,191,191,197777
---- RetailRetailRetailRetail1,131,131,131,130000
---- CorporateCorporateCorporateCorporate 66667777
Franchised agenciesFranchised agenciesFranchised agenciesFranchised agencies 1,1,1,1,218218218218
ATMsATMsATMsATMs 2,2,2,2,525525525525
� Online portalOnline portalOnline portalOnline portal providing customers with access to their account details and certain functionalities
� Version for corporate clients branded “iPKO Biznes”offering a transaction platform for clients
� 3.3.3.3.2222 million usersmillion usersmillion usersmillion users as of June 2012
� Establishment of new Private Bank locationsPrivate Bank locationsPrivate Bank locationsPrivate Bank locations to access affluent customers
� Extension of brokerage house networkbrokerage house networkbrokerage house networkbrokerage house network
� Introduction of mobile bankingmobile bankingmobile bankingmobile banking (higher penetration of mobile phones than online banking)
� Use Call CentreCall CentreCall CentreCall Centre for sale purposes post CRM implementation
� Franchised agenciesFranchised agenciesFranchised agenciesFranchised agencies work on exclusive long-term basis with PKO
Other ChannelsOther ChannelsOther ChannelsOther Channels
� Online distributionOnline distributionOnline distributionOnline distribution with distinctive branding providing a range of products
� Ca. 6Ca. 6Ca. 6Ca. 644,544,544,544,500 account holders00 account holders00 account holders00 account holders as of June 2012
� Key distribution channel in terms of accessing younger customers
� Targeting younger generation
Ger
man
y
Czech Rep.
Slovakia
Ukraine
Russian Fed.Lithuania
Bel
arus
(1)
(1)
Source: Company information and PFSA as of 30 June 2012, respective companies’ documents.Note: (1) Pending merger of BZ WBK and Kredyt Bank after the acquisition of Kredyt Bank by Santander

7
• Asset management Asset management Asset management Asset management operationsoperationsoperationsoperations
• Gained full control from Gained full control from Gained full control from Gained full control from Credit Suisse in 2009Credit Suisse in 2009Credit Suisse in 2009Credit Suisse in 2009
• 6666thththth by AuM as of by AuM as of by AuM as of by AuM as of endendendend----1H1H1H1H’’’’12121212 valued PLN 8.valued PLN 8.valued PLN 8.valued PLN 8.4444bn bn bn bn
• Pension fund businessPension fund businessPension fund businessPension fund business• 9999thththth by total assetsby total assetsby total assetsby total assets• As of endAs of endAs of endAs of end----1H1H1H1H’’’’12 12 12 12 PLN PLN PLN PLN 8.48.48.48.4bn of net assets bn of net assets bn of net assets bn of net assets
• Key strategic product in Key strategic product in Key strategic product in Key strategic product in corporate bankingcorporate bankingcorporate bankingcorporate banking
• 3333rdrdrdrd market position in market position in market position in market position in terms of leased assets terms of leased assets terms of leased assets terms of leased assets as of as of as of as of endendendend----1H1H1H1H’’’’11112. Lease 2. Lease 2. Lease 2. Lease investments valued PLN investments valued PLN investments valued PLN investments valued PLN 3,1b3,1b3,1b3,1bnnnn
• Internet banking platformInternet banking platformInternet banking platformInternet banking platform• BecBecBecBecaaaame a leading me a leading me a leading me a leading internet banking provider internet banking provider internet banking provider internet banking provider in Polandin Polandin Polandin Poland
• Widened product offering Widened product offering Widened product offering Widened product offering and functionalitiesand functionalitiesand functionalitiesand functionalities
• Ukrainian subsidiaryUkrainian subsidiaryUkrainian subsidiaryUkrainian subsidiary• Focused on corporate Focused on corporate Focused on corporate Focused on corporate bankingbankingbankingbanking
• Significant restructuring Significant restructuring Significant restructuring Significant restructuring started in 2009started in 2009started in 2009started in 2009
• 1% share in Group1% share in Group1% share in Group1% share in Group’’’’s total s total s total s total assets and assets and assets and assets and result on result on result on result on business activitiesbusiness activitiesbusiness activitiesbusiness activities
PKO Bank Polski business lines ….
Source: Company information, Chamber of Fund and Asset Management, Polish Bank Association, PFSA as of March 2012.Notes: (1) Bankowy Fundusz Leasingowy. (2) Consolidated accounts for Platforma Inteligo.
(1)
Product factories Online Ukraine
(2)
…. supported by key subsidiaries
1.1.1.1. PKO Bank Polski: The Leading Polish and CEE BankPKO Bank Polski: The Leading Polish and CEE BankPKO Bank Polski: The Leading Polish and CEE BankPKO Bank Polski: The Leading Polish and CEE Bank
2.2.2.2. Operating EnvironmentOperating EnvironmentOperating EnvironmentOperating Environment
3.3.3.3. Continued Strong Financial PerformanceContinued Strong Financial PerformanceContinued Strong Financial PerformanceContinued Strong Financial Performance
4.4.4.4. Focused StrategyFocused StrategyFocused StrategyFocused Strategy
5.5.5.5. AppendixAppendixAppendixAppendix
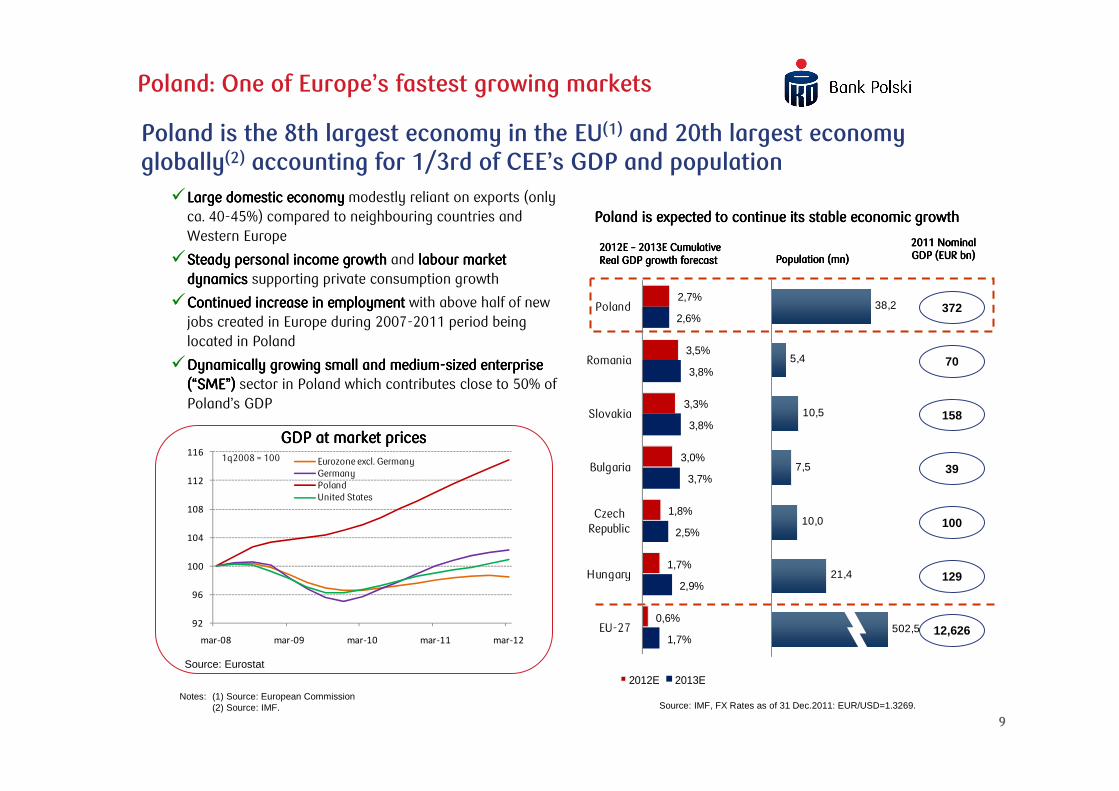
9
Poland: One of Europe’s fastest growing markets
372
70
158
39
100
129
12,626
2012012012012E 2E 2E 2E –––– 2013201320132013E Cumulative E Cumulative E Cumulative E Cumulative Real GDP growth forecastReal GDP growth forecastReal GDP growth forecastReal GDP growth forecast Population (mn)Population (mn)Population (mn)Population (mn)
2012012012011111 Nominal Nominal Nominal Nominal GDP (EUR bn) GDP (EUR bn) GDP (EUR bn) GDP (EUR bn)
Poland is expected to continue its stable economic growthPoland is expected to continue its stable economic growthPoland is expected to continue its stable economic growthPoland is expected to continue its stable economic growth
Poland is the 8th largest economy in the EU(1) and 20th largest economy globally(2) accounting for 1/3rd of CEE’s GDP and population
Notes: (1) Source: European Commission(2) Source: IMF.
�Large domestic economyLarge domestic economyLarge domestic economyLarge domestic economy modestly reliant on exports (only ca. 40-45%) compared to neighbouring countries and Western Europe
�Steady personal income growthSteady personal income growthSteady personal income growthSteady personal income growth and labour market labour market labour market labour market dynamics dynamics dynamics dynamics supporting private consumption growth
�Continued increase in employmentContinued increase in employmentContinued increase in employmentContinued increase in employment with above half of new jobs created in Europe during 2007-2011 period being located in Poland
�Dynamically growing small and mediumDynamically growing small and mediumDynamically growing small and mediumDynamically growing small and medium----sized enterprisesized enterprisesized enterprisesized enterprise((((““““SMESMESMESME””””)))) sector in Poland which contributes close to 50% of Poland’s GDP
38,2
5,4
10,5
7,5
10,0
21,4
502,5
GDP GDP GDP GDP at market pricesat market pricesat market pricesat market prices
92
96
100
104
108
112
116
mar-08 mar-09 mar-10 mar-11 mar-12
Eurozone excl. GermanyGermanyPolandUnited States
1q2008 = 100
2,7%
3,5%
3,3%
3,0%
1,8%
1,7%
0,6%
2,6%
3,8%
3,8%
3,7%
2,5%
2,9%
1,7%
Poland
Romania
Slovakia
Bulgaria
Czech Republic
Hungary
EU-27
2012E 2013E
Source: IMF, FX Rates as of 31 Dec.2011: EUR/USD=1.3269.
Source: Eurostat
10
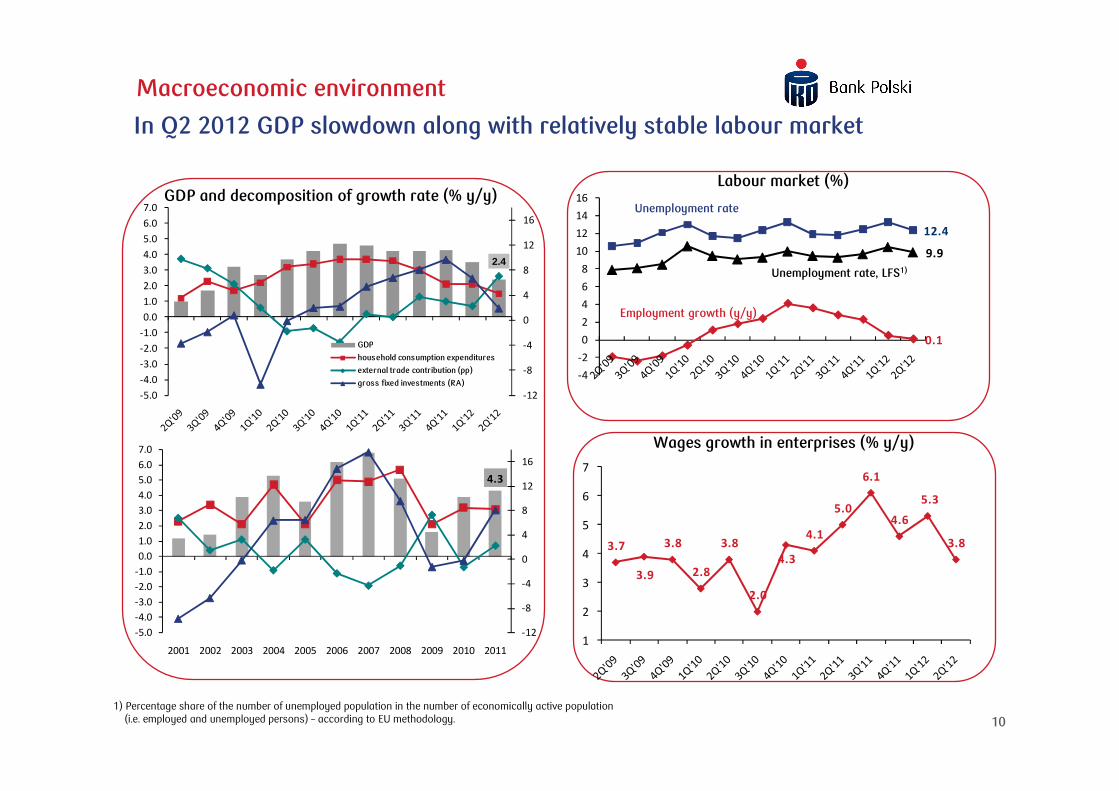
Macroeconomic environment
GDP and decomposition of growth rate (% y/y)Labour market (%)
Unemployment rate
Employment growth (y/y)
Wages growth in enterprises (% y/y)
3.7
3.9
3.8
2.8
3.8
2.0
4.3
4.1
5.0
6.1
4.6
5.3
3.8
1
2
3
4
5
6
7
Unemployment rate, LFS1)
1) Percentage share of the number of unemployed population in the number of economically active population (i.e. employed and unemployed persons) – according to EU methodology.
In Q2 2012 GDP slowdown along with relatively stable labour market
0.1
12.4
9.9
-4
-2
0
2
4
6
8
10
12
14
16
2.4
-12
-8
-4
0
4
8
12
16
-5.0
-4.0
-3.0
-2.0
-1.0
0.0
1.0
2.0
3.0
4.0
5.0
6.0
7.0
GDP
household consumption expenditures
external trade contribution (pp)
gross fixed investments (RA)
4.3
-12
-8
-4
0
4
8
12
16
-5.0
-4.0
-3.0
-2.0
-1.0
0.0
1.0
2.0
3.0
4.0
5.0
6.0
7.0
2001 2002 2003 2004 2005 2006 2007 2008 2009 2010 2011

11
4.75
4.73
5.13
3
4
5
6
4.26
3.553.39
2
3
4
5
Inflation rate (% y/y)
Interest rates (% eop)
PLN exchange rates
PLN/CHF
PLN/USD
PLN/EUR
5-year yield
Reference rate
Macroeconomic environment
3.5 3.4 3.5
2.62.3
2.5
3.1
4.3 4.23.9
4.6
3.9
4.3
1
2
3
4
5
WIBOR 3M
Elevated inflation, stronger PLN, and lower yields
• CPI inflation increased to 4.3% y/y in June 2012 (vs. 3.9% y/y in March) due to high growth of food prices whereas EURO 2012 effects were negligible. Inflation remains above NBP target (2.5%)
• Elevated CPI inflation prompted the NBP to rise interest rates by 25bp in May, to 4,75%. Given the continued growth moderation the MPC will most likely stay on hold in the next 3-6 months
• Zloty appreciation – a result of global decrease in risk premium due to EBC’s monetary easing (LTRO, rate cut) and dominant in Q1 2012 market expectations of a Fed’s third round of quantitative easing (QE3)

12
10.1
13.5
3.4
0
10
20
30
-2.7
12.1
10.3
-10
0
10
20
30
40
50
60
70
,
Financial Market
Loan growth rates (% y/y)
Mutual funds market (PLN bn)
Housing
ConsumerCorporate
Private individuals
Total
Corporates
Deposit growth rates (% y/y)
Total
2.2
128.3
-140
-105
-70
-35
0
35
70
105
140
-5
-3
-1
1
3
5
7
9
net inflow
net mutual fund assets
Slightly weaker loans growth, stable deposits dynamics
• Loans – trends in Q2 2012: (i) moderation in corporate credit growth (12.1% y/y in Q2 vs. 15.1% y/y in Q1), (ii) slower mortgages growth (11.9% vs. 15.9% y/y, respectively), and (iii) continued decline in consumer loans (-2.7% vs. -2.5% y/y)
•Deposits – trends in Q2 2012: (i) stable retail deposits growth (13.5% y/y in Q2 vs. 12.5% y/y in Q1) and further decrease in growth of corporate deposits (3.4% in Q2 vs. 7.9% y/y in Q1)
• Increase in investment funds assets as a result of stabilization on the equity market and net inflows

1.1.1.1. PKO Bank Polski: The Leading Polish and CEE BankPKO Bank Polski: The Leading Polish and CEE BankPKO Bank Polski: The Leading Polish and CEE BankPKO Bank Polski: The Leading Polish and CEE Bank
2.2.2.2. Operating EnvironmentOperating EnvironmentOperating EnvironmentOperating Environment
3.3.3.3. Continued Strong Financial PerformanceContinued Strong Financial PerformanceContinued Strong Financial PerformanceContinued Strong Financial Performance
4.4.4.4. Focused StrategyFocused StrategyFocused StrategyFocused Strategy
5.5.5.5. AppendixAppendixAppendixAppendix
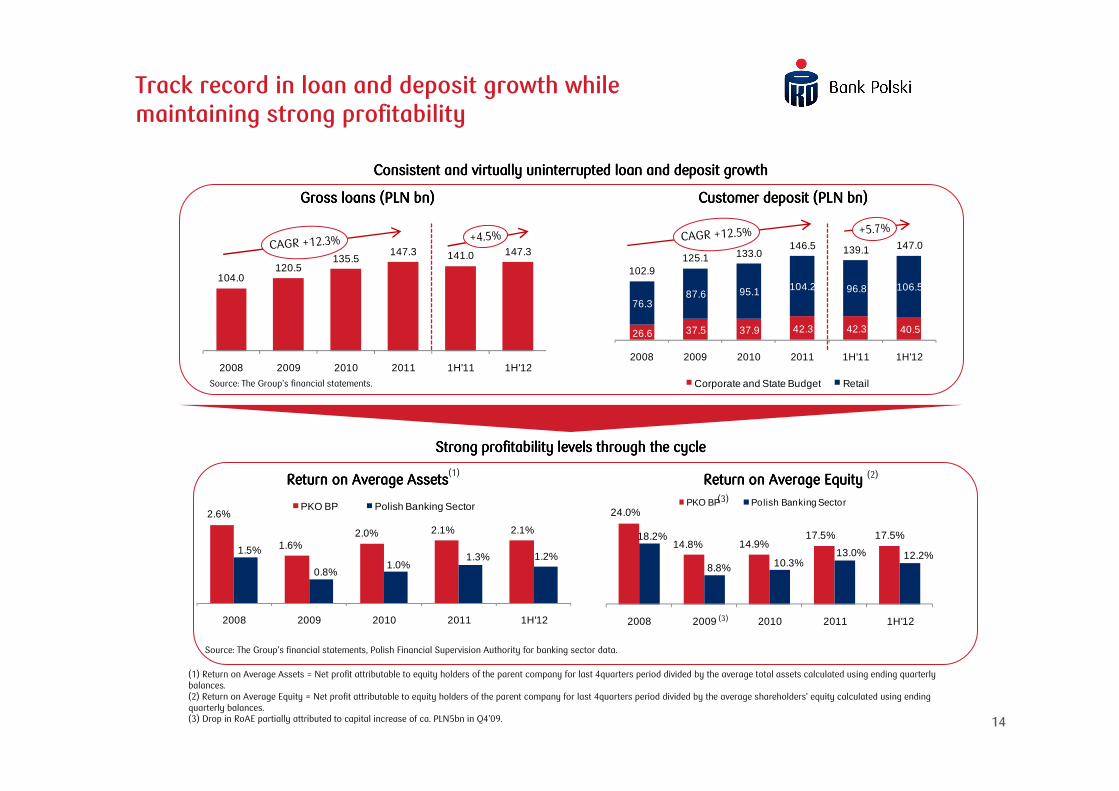
14
26.6 37.5 37.9 42.3 42.3 40.5
76.3 87.6 95.1 104.2 96.8 106.5
102.9 125.1 133.0
146.5 139.1 147.0
2008 2009 2010 2011 1H'11 1H'12
Corporate and State Budget Retail
2.6%
1.6%2.0% 2.1% 2.1%
1.5%
0.8%1.0%
1.3% 1.2%
2008 2009 2010 2011 1H'12
PKO BP Polish Banking Sector 24.0%
14.8% 14.9%17.5% 17.5%18.2%
8.8% 10.3%13.0% 12.2%
2008 2009 2010 2011 1H'12
PKO BP Polish Banking Sector
CAGR +12.5%
(1) Return on Average Assets = Net profit attributable to equity holders of the parent company for last 4quarters period divided by the average total assets calculated using ending quarterly balances.(2) Return on Average Equity = Net profit attributable to equity holders of the parent company for last 4quarters period divided by the average shareholders’ equity calculated using ending quarterly balances.(3) Drop in RoAE partially attributed to capital increase of ca. PLN5bn in Q4’09.
104.0 120.5
135.5 147.3 141.0 147.3
2008 2009 2010 2011 1H'11 1H'12
Gross loans (PLN bn)Gross loans (PLN bn)Gross loans (PLN bn)Gross loans (PLN bn)
CAGR +12.3%
Customer deposit (PLN bn)Customer deposit (PLN bn)Customer deposit (PLN bn)Customer deposit (PLN bn)
Strong profitability levels through the cycleStrong profitability levels through the cycleStrong profitability levels through the cycleStrong profitability levels through the cycle
Track record in loan and deposit growth while maintaining strong profitability
Return on Average AssetsReturn on Average AssetsReturn on Average AssetsReturn on Average Assets Return on Average EquityReturn on Average EquityReturn on Average EquityReturn on Average Equity
Source: The Group’s financial statements.
Source: The Group’s financial statements, Polish Financial Supervision Authority for banking sector data.
Consistent and virtually uninterrupted loan and deposit growthConsistent and virtually uninterrupted loan and deposit growthConsistent and virtually uninterrupted loan and deposit growthConsistent and virtually uninterrupted loan and deposit growth
(3)
(1)
(3)
+4.5%+5.7%
(2)

15
6 127 5 051 6 516
7 609
3 575 4 042
2 412 2 583
3 143 3 101
1 541 1 503
8491 234
539432
200 246
9 388 8 86810 198
11 142
5 316 5 791
2008 2009 2010 2011 1H'11 1H'12
Net interest income Net F&C income Net other income
Revenue growth driven by strong Revenue growth driven by strong Revenue growth driven by strong Revenue growth driven by strong ““““core income core income core income core income (1)(1)(1)(1)””””generation capabilities (PLN mn)generation capabilities (PLN mn)generation capabilities (PLN mn)generation capabilities (PLN mn)
Source: The Group’s financial statements.Note: Numbers may not reconcile due to rounding differences.(1) Core income = Net interest income + Net fee and commission income.(2) Includes transfer centre and own activities.(3) Net interest income for last 4 quarters divided by average interest bearing assets for the period calculated using ending quarterly balances.
CAGR +5.9%
CAGR in the period 2008-2011.Note: CAGR calculated as square root of (ending balance in 2011 divided by ending balance in 2008) – 1.
%
Net interest income breakdown by segmentNet interest income breakdown by segmentNet interest income breakdown by segmentNet interest income breakdown by segment
Net Net Net Net F&C F&C F&C F&C income breakdown by segmentincome breakdown by segmentincome breakdown by segmentincome breakdown by segment
Strong revenue generation driven by core income and high margins
Net interest margins Net interest margins Net interest margins Net interest margins (3)(3)(3)(3) strengthstrengthstrengthstrength
Total Total Total Total 1H 1H 1H 1H 2012012012012222 = PLN = PLN = PLN = PLN 4,042 4,042 4,042 4,042 mnmnmnmn
Total Total Total Total 1H 1H 1H 1H 2012012012012222 = PLN = PLN = PLN = PLN 1,503 1,503 1,503 1,503 mnmnmnmn
5.8%
3.9%
4.4%4.6% 4.7%
2008 2009 2010 2011 1H'12
(2)
(2)
+8.9%
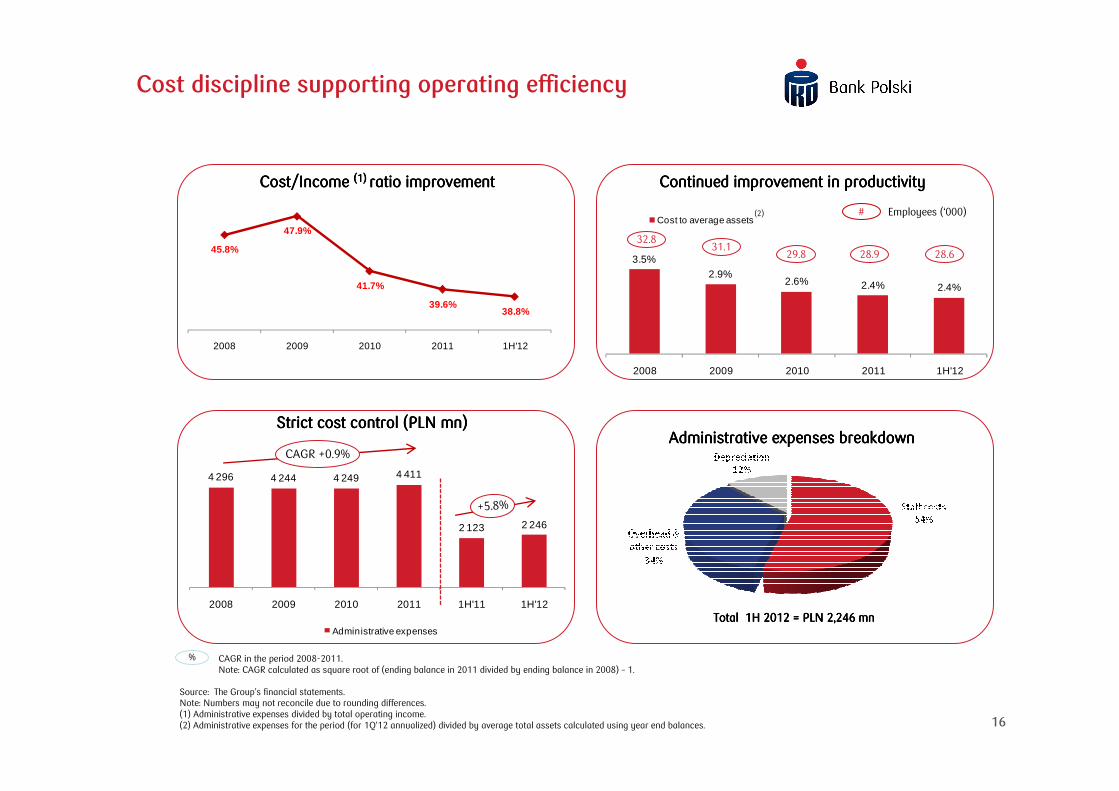
16
Cost discipline supporting operating efficiency
Source: The Group’s financial statements.Note: Numbers may not reconcile due to rounding differences.(1) Administrative expenses divided by total operating income.(2) Administrative expenses for the period (for 1Q’12 annualized) divided by average total assets calculated using year end balances.
Total Total Total Total 1H 1H 1H 1H 2012012012012222 = PLN = PLN = PLN = PLN 2,246 2,246 2,246 2,246 mnmnmnmn
4 296 4 244 4 249 4 411
2 123 2 246
2008 2009 2010 2011 1H'11 1H'12
Administrative expenses
CAGR +0.9%Administrative expenses breakdownAdministrative expenses breakdownAdministrative expenses breakdownAdministrative expenses breakdown
Strict cost control (PLN mn)Strict cost control (PLN mn)Strict cost control (PLN mn)Strict cost control (PLN mn)
CAGR in the period 2008-2011.Note: CAGR calculated as square root of (ending balance in 2011 divided by ending balance in 2008) – 1.
%
3.5%
2.9%2.6% 2.4% 2.4%
2008 2009 2010 2011 1H'12
Cost to average assets
32.831.1
29.8
# Employees (‘000)
45.8%
47.9%
41.7%
39.6%38.8%
2008 2009 2010 2011 1H'12
Continued improvement in productivityContinued improvement in productivityContinued improvement in productivityContinued improvement in productivityCost/Income Cost/Income Cost/Income Cost/Income (1)(1)(1)(1) ratio improvementratio improvementratio improvementratio improvement
(2)
28.9
+5.8%
28.6
17
1.14%1.41% 1.37%
1.30%1.39%
2008 2009 2010 2011 1H'12
3.6%
7.6% 8.0% 8.0%8.7%
4.7%
7.9%8.8%
8.2%8.6%
2008 2009 2010 2011 1H'12
PKO BP Group Polish Banking sector
77.1%
43.2% 44.6% 48.0% 47.0%
2008 2009 2010 2011 1H'12
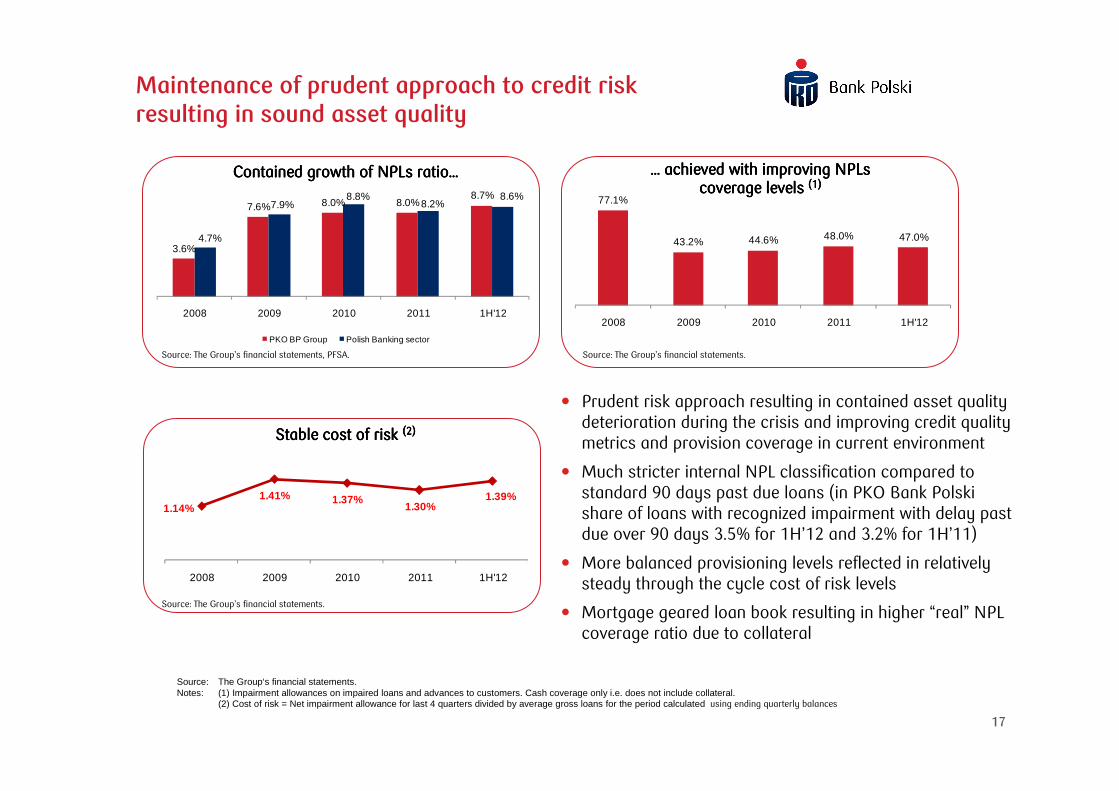
Maintenance of prudent approach to credit risk resulting in sound asset quality
Source: The Group‘s financial statements.Notes: (1) Impairment allowances on impaired loans and advances to customers. Cash coverage only i.e. does not include collateral.
(2) Cost of risk = Net impairment allowance for last 4 quarters divided by average gross loans for the period calculated using ending quarterly balances
... achieved with improving NPLs ... achieved with improving NPLs ... achieved with improving NPLs ... achieved with improving NPLs coverage levels coverage levels coverage levels coverage levels (1)(1)(1)(1)
Contained growth of NPLs ratioContained growth of NPLs ratioContained growth of NPLs ratioContained growth of NPLs ratio…………
StableStableStableStable cost of risk cost of risk cost of risk cost of risk (2)(2)(2)(2)
Source: The Group’s financial statements, PFSA. Source: The Group’s financial statements.
Source: The Group’s financial statements.
� Prudent risk approach resulting in contained asset quality deterioration during the crisis and improving credit quality metrics and provision coverage in current environment
� Much stricter internal NPL classification compared to standard 90 days past due loans (in PKO Bank Polski share of loans with recognized impairment with delay past due over 90 days 3.5% for 1H’12 and 3.2% for 1H’11)
� More balanced provisioning levels reflected in relatively steady through the cycle cost of risk levels
� Mortgage geared loan book resulting in higher “real” NPL coverage ratio due to collateral

18
3.2% 3.5% 3.3% 3.5% 3.5%
3.7% 3.8% 3.9%4.2% 4.5%
6.9%7.3% 7.2%
7.7% 7.9%
Q2'11 Q3'11 Q4'11 Q1'12 Q2'12
118 114124 131 135
98116
143
179
205
6042 46
40 22
312298
288
255270
Q2'11 Q3'11 Q4'11 Q1'12 Q2'12
Total Corporate loans Mortgage loans Consumer loans
50.0% 48.7% 47.9% 47.9% 47.1%
37.3% 38.2% 38.9% 39.2% 39.0%
71.1%
60.5%
52.5% 53.2% 52.4%
68.9% 69.9%72.7% 73.8% 74.2%
Q2'11 Q3'11 Q4'11 Q1'12 Q2'12
Total Corporate loans Mortgage loans Consumer loans
Cost of risk for last 12M (bp.)
Quality of loan portfolio
delay past due over 90 days
other premises
Share of loans with recognized impairment Coverage of loans with recognized impairment by impairment allowance
• Share of loans with recognized impairment for PKO Bank Polski increased by 0.2 pp. q/q
• Coverage of loans with recognized impairment by impairment allowance at level 47.1%, lower than in previous quarter
• Drop of cost of risk in case of mortgage loans comparing to previous quarter
• Increase in cumulative cost in corporate loans (mainly due to one-offs concerning entities valued with individual method)
Stable cost of risk in Q2 2012
Standalone data
19
Amounts due to
banks
3%
Derivative
financial
instruments
2%
Amounts due to
customers
88%
Debt securities in
issue
4%
Subordinated
liabilities
1%
Other liabilities
2%
Less than 3 months
37%
From 3 months to 1
year
1%
From 1 year to 5
years
62%
Funding sources
Deposits are the primary source of fundingLiabilities structureLiabilities structureLiabilities structureLiabilities structure
(total as at 30 June 12: PLN 167.4 bn)Deposit structureDeposit structureDeposit structureDeposit structure
(total as at 30 June 12: PLN 147.0 bn)Debt securities structureDebt securities structureDebt securities structureDebt securities structure
(total as at 30 June 12: PLN 7.3 bn)
Amounts due to
corporate
entities
24%
Amounts due to
state budget
entities
3%
Amounts due to
retail clients
72%
• Retail and corporate deposits are the primary source of funding• Financing agreements as at end-1H 2012 included:− July 2007 CHF 950 mn 5-year credit facility (credit matured in July 2012;
the same month Bank opened a new CHF 410 mn 3-year credit facility)− EUR 800 mn 5Y bonds raised in October 2010 - 1st tranche of the EMTN
Programme− CHF 250 mn 5Y bonds issuance in July 2011 - 2nd tranche of the EMTN
Programme − PLN 2,481 mn domestic issue (short term) • Moreover: − EUR 50 mn 10Y bonds issuance in July 2012 (EMTN, 3rd tranche, private
placement) − CHF 500 mn 3.25Y bonds issuance priced in August with issue date in
September 2012 (EMTN, 4th tranche) and− Stand-alone USD 1 bn 10Y 144A bonds issuance in September 2012
98%93%
98% 97% 96%92% 90%
95% 93% 93%
2008 2009 2010 2011 1H'12
Net loans to deposit ratio Net loans to deposit ratio (adjusted)1)
1) Adjusted ratio uses the aggregate of amounts due to customerstogether with amounts due to banks other than central banks for deposits
Stable development of BankStable development of BankStable development of BankStable development of Bank’’’’s deposit bases deposit bases deposit bases deposit base
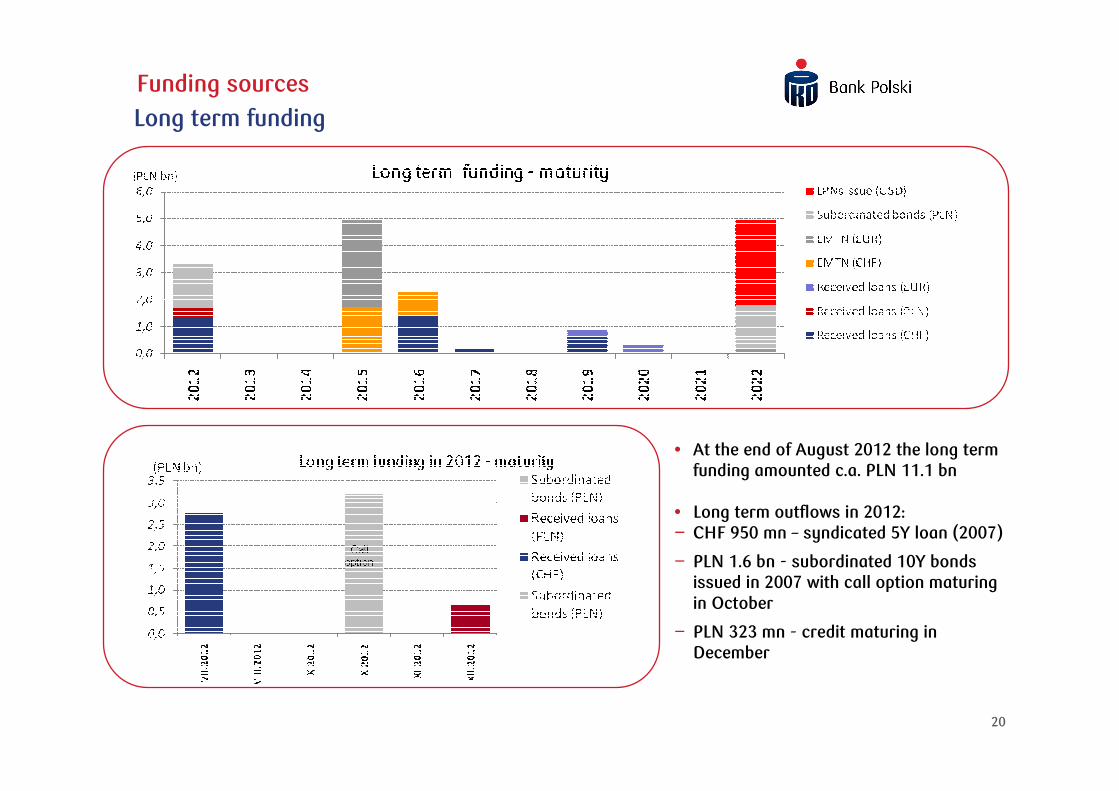
20
Funding sources
Long term funding
Call option
Call option
• At the end of August 2012 the long term funding amounted c.a. PLN 11.1 bn
• Long term outflows in 2012:− CHF 950 mn – syndicated 5Y loan (2007)
− PLN 1.6 bn - subordinated 10Y bonds issued in 2007 with call option maturing in October
− PLN 323 mn - credit maturing in December
21
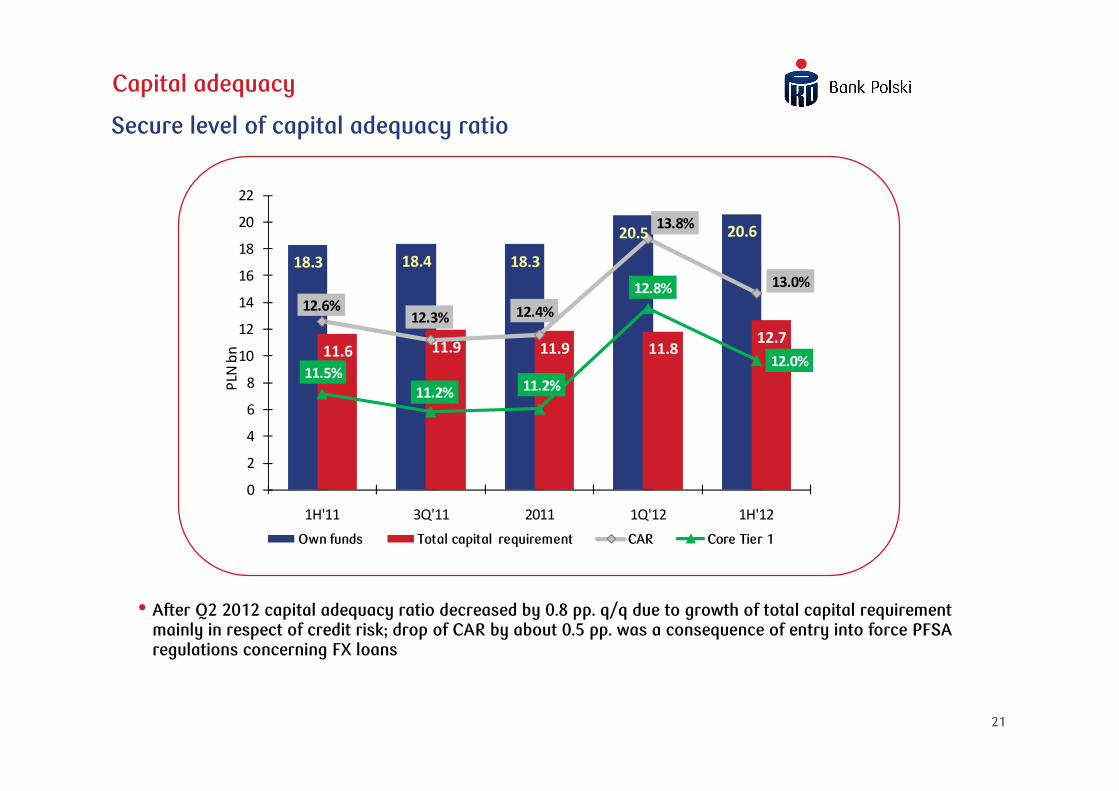
Capital adequacy
Secure level of capital adequacy ratio
• After Q2 2012 capital adequacy ratio decreased by 0.8 pp. q/q due to growth of total capital requirement mainly in respect of credit risk; drop of CAR by about 0.5 pp. was a consequence of entry into force PFSA regulations concerning FX loans
18.3 18.4 18.3
20.5 20.6
11.6 11.9 11.9 11.812.7
12.6%12.3% 12.4%
13.8%
13.0%
11.5%
11.2%11.2%
12.8%
12.0%
10.0%
10.5%
11.0%
11.5%
12.0%
12.5%
13.0%
13.5%
14.0%
14.5%
0
2
4
6
8
10
12
14
16
18
20
22
1H'11 3Q'11 2011 1Q'12 1H'12
PLN
bn
Own funds Total capital requirement CAR Core Tier 1

1.1.1.1. PKO Bank Polski: The Leading Polish and CEE BankPKO Bank Polski: The Leading Polish and CEE BankPKO Bank Polski: The Leading Polish and CEE BankPKO Bank Polski: The Leading Polish and CEE Bank
2.2.2.2. Operating EnvironmentOperating EnvironmentOperating EnvironmentOperating Environment
3.3.3.3. Continued Strong Financial PerformanceContinued Strong Financial PerformanceContinued Strong Financial PerformanceContinued Strong Financial Performance
4.4.4.4. Focused StrategyFocused StrategyFocused StrategyFocused Strategy
5.5.5.5. Appendix Appendix Appendix Appendix
23
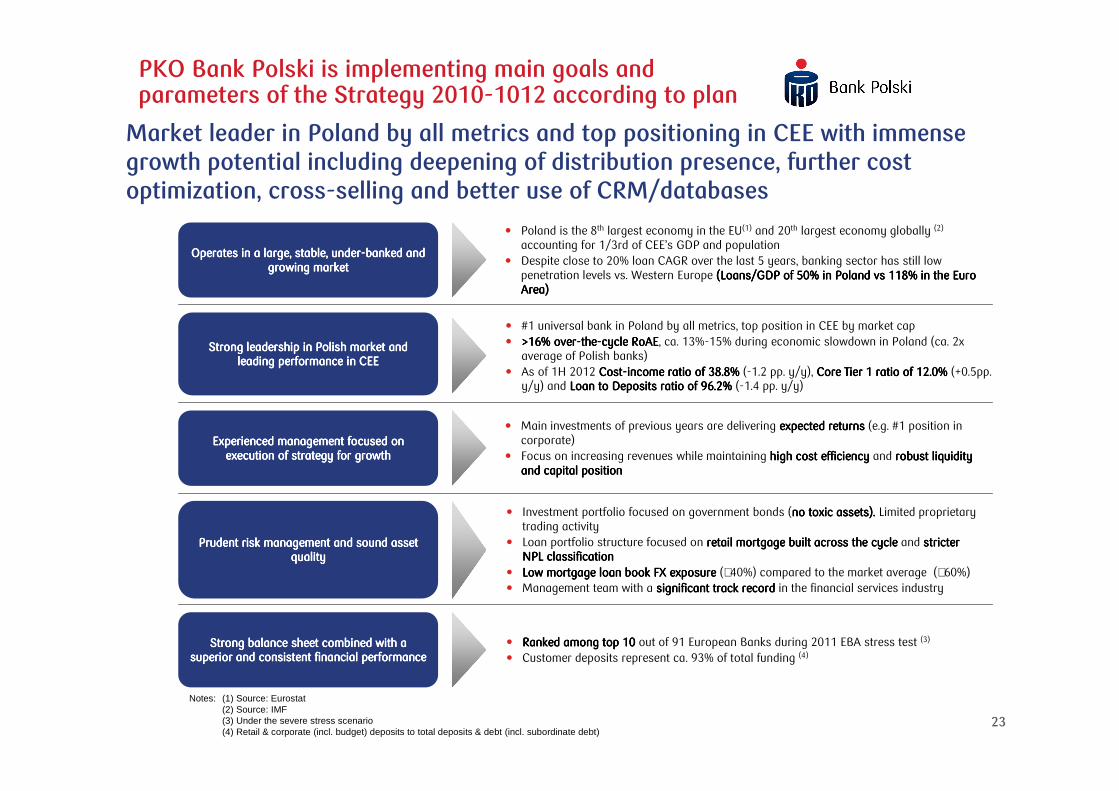
PKO Bank Polski is implementing main goals and parameters of the Strategy 2010-1012 according to plan
Operates in a large, stable, underOperates in a large, stable, underOperates in a large, stable, underOperates in a large, stable, under----banked and banked and banked and banked and growing market growing market growing market growing market
Strong leadership in Polish market and Strong leadership in Polish market and Strong leadership in Polish market and Strong leadership in Polish market and leading performance in CEEleading performance in CEEleading performance in CEEleading performance in CEE
Experienced management focused on Experienced management focused on Experienced management focused on Experienced management focused on execution of strategy for growthexecution of strategy for growthexecution of strategy for growthexecution of strategy for growth
Prudent risk management and sound asset Prudent risk management and sound asset Prudent risk management and sound asset Prudent risk management and sound asset qualityqualityqualityquality
Strong balance sheet combined with a Strong balance sheet combined with a Strong balance sheet combined with a Strong balance sheet combined with a superior and consistent financial performancesuperior and consistent financial performancesuperior and consistent financial performancesuperior and consistent financial performance
� Poland is the 8th largest economy in the EU(1) and 20th largest economy globally (2)
accounting for 1/3rd of CEE’s GDP and population� Despite close to 20% loan CAGR over the last 5 years, banking sector has still low
penetration levels vs. Western Europe (Loans/GDP of 50% in Poland vs 118% in the Euro (Loans/GDP of 50% in Poland vs 118% in the Euro (Loans/GDP of 50% in Poland vs 118% in the Euro (Loans/GDP of 50% in Poland vs 118% in the Euro Area)Area)Area)Area)
� #1 universal bank in Poland by all metrics, top position in CEE by market cap� >16% over>16% over>16% over>16% over----thethethethe----cycle RoAEcycle RoAEcycle RoAEcycle RoAE, ca. 13%-15% during economic slowdown in Poland (ca. 2x
average of Polish banks)� As of 1H 2012 CostCostCostCost----income ratio of 3income ratio of 3income ratio of 3income ratio of 38.88.88.88.8% % % % (-1.2 pp. y/y), Core Tier 1 ratio of 1Core Tier 1 ratio of 1Core Tier 1 ratio of 1Core Tier 1 ratio of 12222....0000% % % % (+0.5pp.
y/y) and Loan to Deposits ratio of 9Loan to Deposits ratio of 9Loan to Deposits ratio of 9Loan to Deposits ratio of 96.26.26.26.2% % % % (-1.4 pp. y/y)
� Main investments of previous years are delivering expected returnsexpected returnsexpected returnsexpected returns (e.g. #1 position in corporate)
� Focus on increasing revenues while maintaining high cost efficiencyhigh cost efficiencyhigh cost efficiencyhigh cost efficiency and robust liquidity robust liquidity robust liquidity robust liquidity and capital positionand capital positionand capital positionand capital position
� Investment portfolio focused on government bonds (no toxic assets). no toxic assets). no toxic assets). no toxic assets). Limited proprietary trading activity
� Loan portfolio structure focused on retail mortgage built across the cycle retail mortgage built across the cycle retail mortgage built across the cycle retail mortgage built across the cycle and stricter stricter stricter stricter NPL classificationNPL classificationNPL classificationNPL classification
� Low mortgage loan book FX exposure Low mortgage loan book FX exposure Low mortgage loan book FX exposure Low mortgage loan book FX exposure (∼40%) compared to the market average (∼60%)� Management team with a significant track record significant track record significant track record significant track record in the financial services industry
� Ranked among top 10 Ranked among top 10 Ranked among top 10 Ranked among top 10 out of 91 European Banks during 2011 EBA stress test (3)
� Customer deposits represent ca. 93% of total funding (4)
Notes: (1) Source: Eurostat(2) Source: IMF(3) Under the severe stress scenario(4) Retail & corporate (incl. budget) deposits to total deposits & debt (incl. subordinate debt)
Market leader in Poland by all metrics and top positioning in CEE with immense growth potential including deepening of distribution presence, further cost optimization, cross-selling and better use of CRM/databases

Thank you!

Appendix

26
Key strategic initiatives for PKO Bank Polski development plan
Build customer Build customer Build customer Build customer loyalty and loyalty and loyalty and loyalty and attract new attract new attract new attract new clientsclientsclientsclients
� Customer segmentation and product innovation � Branch network optimisation: refreshed logo, style and marketing campaigns, growing in
under-represented locations� Focus on customer service as a competitive advantage� Automation and centralisation of approval processes to provide rapid response to clients
Increase Increase Increase Increase business with business with business with business with
existing existing existing existing customerscustomerscustomerscustomers
� Enhance profitability per client via focus on cross-selling of non-loan products:
– Retail: asset management, brokerage, bancassurance
– Corporate: transactional services, leasing/factoring, investment banking� Focus on enhancing CRM capabilities � Incorporate cross-sell into employees’ KPIs
Maintain Maintain Maintain Maintain operational operational operational operational excellenceexcellenceexcellenceexcellence
� Centralize key process function, reduction of back offices from #100 to #5� Automation of sales process, flexibility and swiftness of new technological solutions,
simplifying procedures� Enhancing and improving Risk Management and customer monitoring� New internal scoring model
Focus on core Focus on core Focus on core Focus on core activitiesactivitiesactivitiesactivities
� Maintain leadership in retail and corporate supplemented by a strong product factory� Selling non core assets (e.g. real estate)� Continue restructuring of Kredobank (Ukraine)
Attract and retain Attract and retain Attract and retain Attract and retain experienced experienced experienced experienced
management and management and management and management and staff, and foster a staff, and foster a staff, and foster a staff, and foster a
dynamic dynamic dynamic dynamic organisationalorganisationalorganisationalorganisational
cultureculturecultureculture
� Streamlining of organisational structure� Attracting and retaining the best talent in the country
– Improved remuneration, back office centralization and internal communication
Target Target Target Target ““““generation Ygeneration Ygeneration Ygeneration Y””””, , , , ““““young professionalsyoung professionalsyoung professionalsyoung professionals””””,,,,““““newnewnewnew”””” generation of generation of generation of generation of pensioners (IT savvy,pensioners (IT savvy,pensioners (IT savvy,pensioners (IT savvy,experienced)experienced)experienced)experienced)
Broad product range Broad product range Broad product range Broad product range
Sustainable efficiencySustainable efficiencySustainable efficiencySustainable efficiencyabove peersabove peersabove peersabove peers
Consistent with historicalConsistent with historicalConsistent with historicalConsistent with historicalstrategystrategystrategystrategy
Optimise group structureOptimise group structureOptimise group structureOptimise group structure
� Detail strategic planning and budgeting process focused on capital allocation to units that improve the risk-return profile of the bank
� Retention of conservative liquidity position at the highest vs. European peers
Prudent approach Prudent approach Prudent approach Prudent approach towardstowardstowardstowards risksrisksrisksrisks
Strong liquidity Strong liquidity Strong liquidity Strong liquidity and capital and capital and capital and capital
basebasebasebase
27
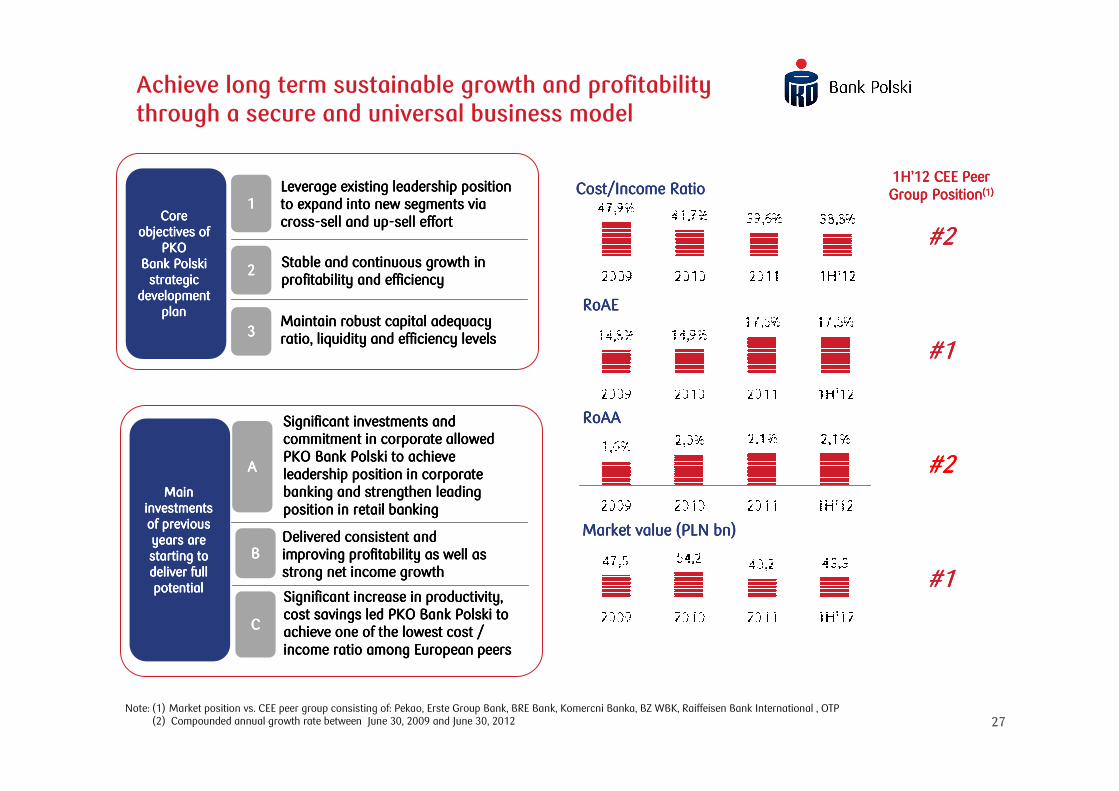
Achieve long term sustainable growth and profitability through a secure and universal business model
Core Core Core Core objectives of objectives of objectives of objectives of
PKO PKO PKO PKO BBBBank ank ank ank PPPPolskiolskiolskiolskistrategic strategic strategic strategic
development development development development planplanplanplan
Main Main Main Main investments investments investments investments of previous of previous of previous of previous years are years are years are years are starting to starting to starting to starting to deliver full deliver full deliver full deliver full potentialpotentialpotentialpotential
1111Leverage existing leadership position Leverage existing leadership position Leverage existing leadership position Leverage existing leadership position to expand into new segments via to expand into new segments via to expand into new segments via to expand into new segments via crosscrosscrosscross----sell and upsell and upsell and upsell and up----sell effortsell effortsell effortsell effort
2222
3333Maintain robust capital adequacy Maintain robust capital adequacy Maintain robust capital adequacy Maintain robust capital adequacy ratio, liquidity and efficiency levelsratio, liquidity and efficiency levelsratio, liquidity and efficiency levelsratio, liquidity and efficiency levels
AAAA
Significant investments and Significant investments and Significant investments and Significant investments and commitment in corporate allowed commitment in corporate allowed commitment in corporate allowed commitment in corporate allowed PKO BPKO BPKO BPKO Bank ank ank ank PPPPolskiolskiolskiolski to achieve to achieve to achieve to achieve leadership position in corporate leadership position in corporate leadership position in corporate leadership position in corporate banking and strengthen leading banking and strengthen leading banking and strengthen leading banking and strengthen leading position in retail bankingposition in retail bankingposition in retail bankingposition in retail banking
BBBBDeliverDeliverDeliverDeliveredededed consistent and consistent and consistent and consistent and improving profitability as well as improving profitability as well as improving profitability as well as improving profitability as well as strong net income growth strong net income growth strong net income growth strong net income growth
CCCC
Significant increase in productivity, Significant increase in productivity, Significant increase in productivity, Significant increase in productivity, cost savings led PKO Bcost savings led PKO Bcost savings led PKO Bcost savings led PKO Bank ank ank ank PPPPolskiolskiolskiolski to to to to achieve one of the lowest cost / achieve one of the lowest cost / achieve one of the lowest cost / achieve one of the lowest cost / income ratio among European peers income ratio among European peers income ratio among European peers income ratio among European peers
1H1H1H1H’’’’11112 2 2 2 CEE Peer CEE Peer CEE Peer CEE Peer Group PositionGroup PositionGroup PositionGroup Position(1)(1)(1)(1)
####2222
####1111
####2222
Note: (1) Market position vs. CEE peer group consisting of: Pekao, Erste Group Bank, BRE Bank, Komercni Banka, BZ WBK, Raiffeisen Bank International , OTP(2) Compounded annual growth rate between June 30, 2009 and June 30, 2012
#1#1#1#1
Cost/Income RatioCost/Income RatioCost/Income RatioCost/Income Ratio
RoRoRoRoAAAAEEEE
RoRoRoRoAAAAAAAA
Market value (PLNMarket value (PLNMarket value (PLNMarket value (PLN bn)bn)bn)bn)
Stable and continuous growthStable and continuous growthStable and continuous growthStable and continuous growth in in in in profitability and efficiencyprofitability and efficiencyprofitability and efficiencyprofitability and efficiency
28
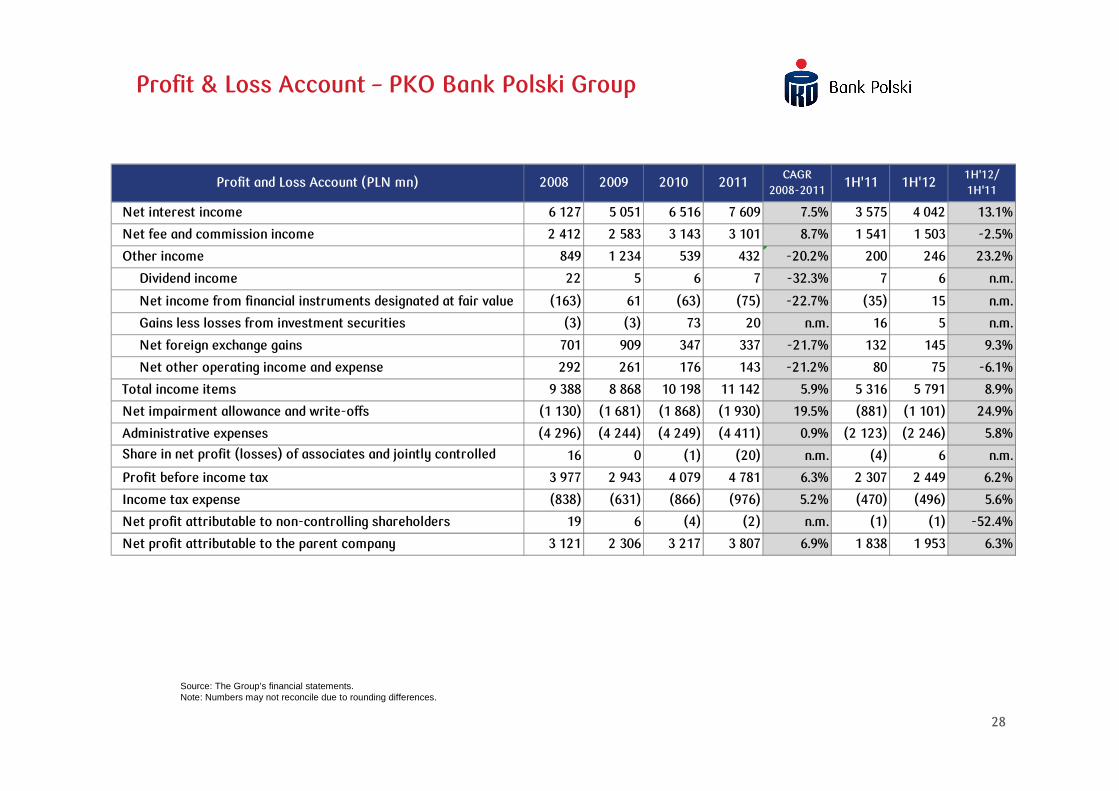
Profit & Loss Account – PKO Bank Polski Group
Source: The Group’s financial statements.Note: Numbers may not reconcile due to rounding differences.
Profit and Loss Account (PLN mn) 2008 2009 2010 2011CAGR
2008-20111H'11 1H'12
1H'12/
1H'11
Net interest income 6 127 5 051 6 516 7 609 7.5% 3 575 4 042 13.1%
Net fee and commission income 2 412 2 583 3 143 3 101 8.7% 1 541 1 503 -2.5%
Other income 849 1 234 539 432 -20.2% 200 246 23.2%
Dividend income 22 5 6 7 -32.3% 7 6 n.m.
Net income from financial instruments designated at fair value (163) 61 (63) (75) -22.7% (35) 15 n.m.
Gains less losses from investment securities (3) (3) 73 20 n.m. 16 5 n.m.
Net foreign exchange gains 701 909 347 337 -21.7% 132 145 9.3%
Net other operating income and expense 292 261 176 143 -21.2% 80 75 -6.1%
Total income items 9 388 8 868 10 198 11 142 5.9% 5 316 5 791 8.9%
Net impairment allowance and write-offs (1 130) (1 681) (1 868) (1 930) 19.5% (881) (1 101) 24.9%
Administrative expenses (4 296) (4 244) (4 249) (4 411) 0.9% (2 123) (2 246) 5.8%
Share in net profit (losses) of associates and jointly controlled
entities 16 0 (1) (20) n.m. (4) 6 n.m.
Profit before income tax 3 977 2 943 4 079 4 781 6.3% 2 307 2 449 6.2%
Income tax expense (838) (631) (866) (976) 5.2% (470) (496) 5.6%
Net profit attributable to non-controlling shareholders 19 6 (4) (2) n.m. (1) (1) -52.4%
Net profit attributable to the parent company 3 121 2 306 3 217 3 807 6.9% 1 838 1 953 6.3%

29
Statement of financial position – PKO Bank Polski Group
Source: The Group’s financial statements.Note: Numbers may not reconcile due to rounding differences, presented balances as of the last day of respective periods.
Assets (PLN mn) 2008 2009 2010 2011CAGR
2008-20111H'11 1H'12
1H'12/
1H'11
Cash and balances with the Central Bank 5 837 7 094 6 182 9 142 16.1% 7 644 8 837 15.6%
Amounts due from other banks 3 364 2 023 2 307 2 396 -10.7% 2 226 2 761 24.1%
Financial assets held for trading 1 496 2 213 1 504 1 311 -4.3% 1 618 390 -75.9%
Derivative financial instruments 3 598 2 029 1 719 3 065 -5.2% 1 695 2 857 68.5%
Financial instruments valued at fair value through profit or loss 4 556 12 361 10 758 12 467 39.9% 12 331 14 947 21.2%
Loans and advances to customers 101 108 116 573 130 668 141 634 11.9% 135 680 141 331 4.2%
Investment securities available for sale 8 615 7 954 10 219 14 393 18.7% 10 968 12 742 16.2%
Tangible fixed assets 2 965 2 778 2 576 2 541 -5.0% 2 518 2 495 -0.9%
Other assets 3 099 3 454 3 726 3 798 7.0% 4 021 4 078 1.4%
TOTAL ASSETS 134 636 156 479 169 661 190 748 12.3% 178 702 190 438 6.6%
Liabilities and eqiuty (PLN mn) 2008 2009 2010 2011CAGR
2008-20111H'11 1H'12
1H'12/
1H'11
Amounts due to the Central Bank 3 7 3 3 7.0% 2 3 21.1%
Amounts due to the other banks 6 989 5 146 5 234 6 239 -3.7% 6 220 5 741 -7.7%
Derivative financial instruments 6 150 1 544 2 405 2 645 -24.5% 2 259 2 760 22.2%
Amounts due to customers 102 939 125 073 132 981 146 474 12.5% 139 093 146 987 5.7%
Debt securities in issue 212 289 3 299 7 772 232.4% 3 457 7 303 111.3%
Subordinated liabilities 1 619 1 612 1 612 1 614 -0.1% 1 613 1 614 0.1%
Other liabilities 2 727 2 371 2 767 3 178 5.2% 5 415 3 023 -44.2%
Total equity 13 998 20 436 21 360 22 822 17.7% 20 642 23 008 11.5%
TOTAL LIABILITIES AND EQIUTY 134 636 156 479 169 661 190 748 12.3% 178 702 190 438 6.6%
30
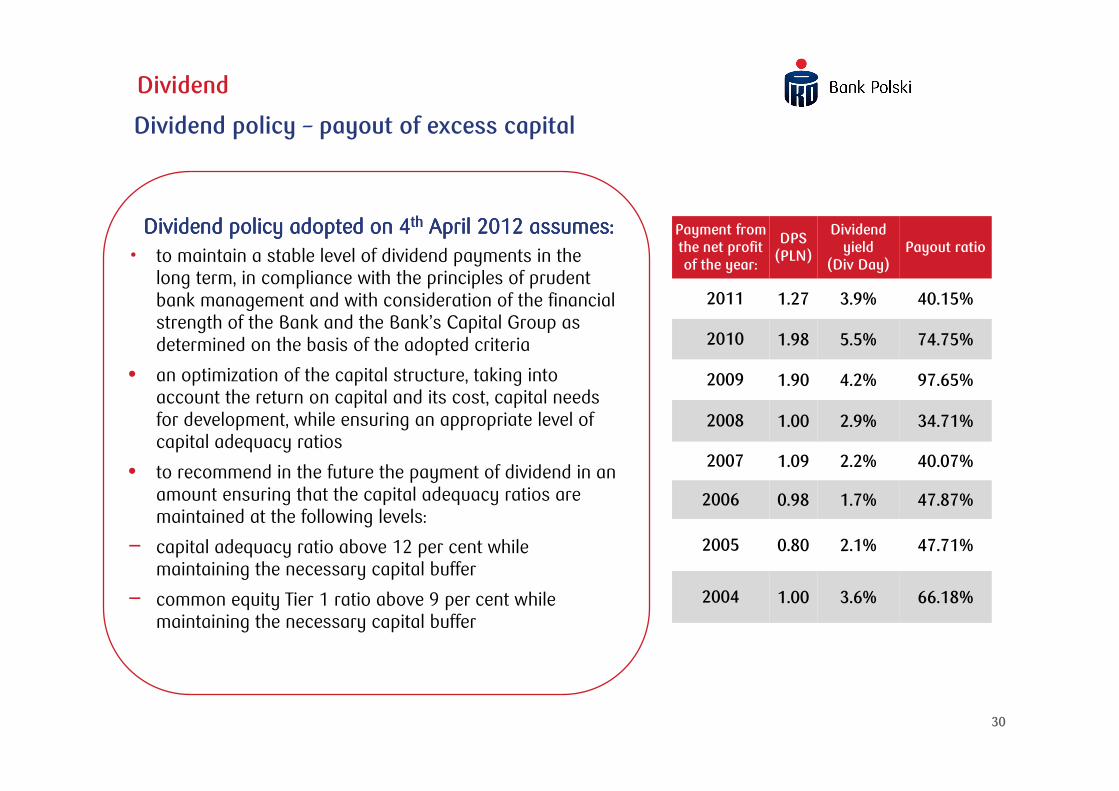
Dividend
Payment from the net profit of the year:
DPS (PLN)
Dividend yield
(Div Day)Payout ratio
2011 1.27 3.9% 40.15%
2010 1.98 5.5% 74.75%
2009 1.90 4.2% 97.65%
2008 1.00 2.9% 34.71%
2007 1.09 2.2% 40.07%
2006 0.98 1.7% 47.87%
2005 0.80 2.1% 47.71%
2004 1.00 3.6% 66.18%
• to maintain a stable level of dividend payments in the long term, in compliance with the principles of prudent bank management and with consideration of the financial strength of the Bank and the Bank’s Capital Group as determined on the basis of the adopted criteria
• an optimization of the capital structure, taking into account the return on capital and its cost, capital needs for development, while ensuring an appropriate level of capital adequacy ratios
• to recommend in the future the payment of dividend in an amount ensuring that the capital adequacy ratios are maintained at the following levels:
− capital adequacy ratio above 12 per cent while maintaining the necessary capital buffer
− common equity Tier 1 ratio above 9 per cent while maintaining the necessary capital buffer
Dividend policy adopted on 4Dividend policy adopted on 4Dividend policy adopted on 4Dividend policy adopted on 4thththth April 2012 assumes:April 2012 assumes:April 2012 assumes:April 2012 assumes:
Dividend policy – payout of excess capital

31
94.4 95.9 99.6 102.5 102.4
7.8 8.5 8.9 8.2 8.24.6 5.2 5.4 4.7 4.5106.8 109.6 114.0 115.4 115.1
30.06.11 30.09.11 31.12.11 31.03.12 30.06.12
Deposits* (PLN bn)
Housing SME Retail and private banking
-1 789 -1 832
-785 -813
71 86
1 262 1 168
2 684 2 857
1 442 1 466
1H 2011 1H 2012
Gross financial result of retail segment (PLN mn)
Net interest income
Net F&Cincome
Other income
Net impairment allowance
Administrative expenses
1.9 1.8 1.6 1.6 1.9
1.3 0.8 0.9 0.9 1.0
2.82.3
1.8 1.71.6
0.8
0.91.2
0.50.5
6.8
5.95.5
4.75.0
Q2'11 Q3'11 Q4'11 Q1'12 Q2'12
New sales of loans* (PLN bn)
Housing market client Mortgage banking
SME Retail and private banking
22.5 22.6 21.6 20.9 20.4
15.5 15.8 15.3 15.4 14.2
61.2 65.0 65.3 64.3 65.3
7.1 7.5 7.9 7.9 6.6
106.4 110.9 110.1 108.5 106.5
30.06.11 30.09.11 31.12.11 31.03.12 30.06.12
Gross loans* (PLN bn)
Housing market client Mortgage banking
SME Retail and private banking
Retail segment
* Bank’s management dataChange y/yChange y/y
-7.2%
-34.4%
+6.7%
-8.4%
-9.7%
+8.5%
+5.0%
-1.9%
-42.5%
-24.4%
-0.3%
-26.5%
+7.8%
+0.1%
Consolidated data
+1.6%
+6.4%
-7.4%
+2.4%
+3.6%

32
90.2% 90.3% 90.7%98.7% 99.9%
9.8% 9.7% 9.3%1.3% 0.1%
Q2'11 Q3'11 Q4'11 Q1'12 Q2'12
Structure of new sales of mortgage loans
PLN FX
60.5% 59.1% 59.6% 61.5% 61.6%
39.5% 40.9% 40.4% 38.5% 38.4%
30.06.11 30.09.11 31.12.11 31.03.12 30.06.12
Structure of mortgage loans porfolio
PLN FX
Retail segment- mortgage loans
81% 81% 81% 80% 80%
Average LTV of loans portfolio
126 132 133 130 132
111 113 114 114 115
159175 176
167 171
30.06.11 30.09.11 31.12.11 31.03.12 30.06.12
Average carrying value of mortgage loan (PLN '000)
Total PLN FX
70% 69% 69% 69% 68%
Average LTV of new sales
179 172 168 165 162173 164 161 164 162
272292 296
346
217
Q2'11 Q3'11 Q4'11 Q1'12 Q2'12
Average value of mortgage loan in new slaes(PLN '000)
Total PLN FX
Standalone data
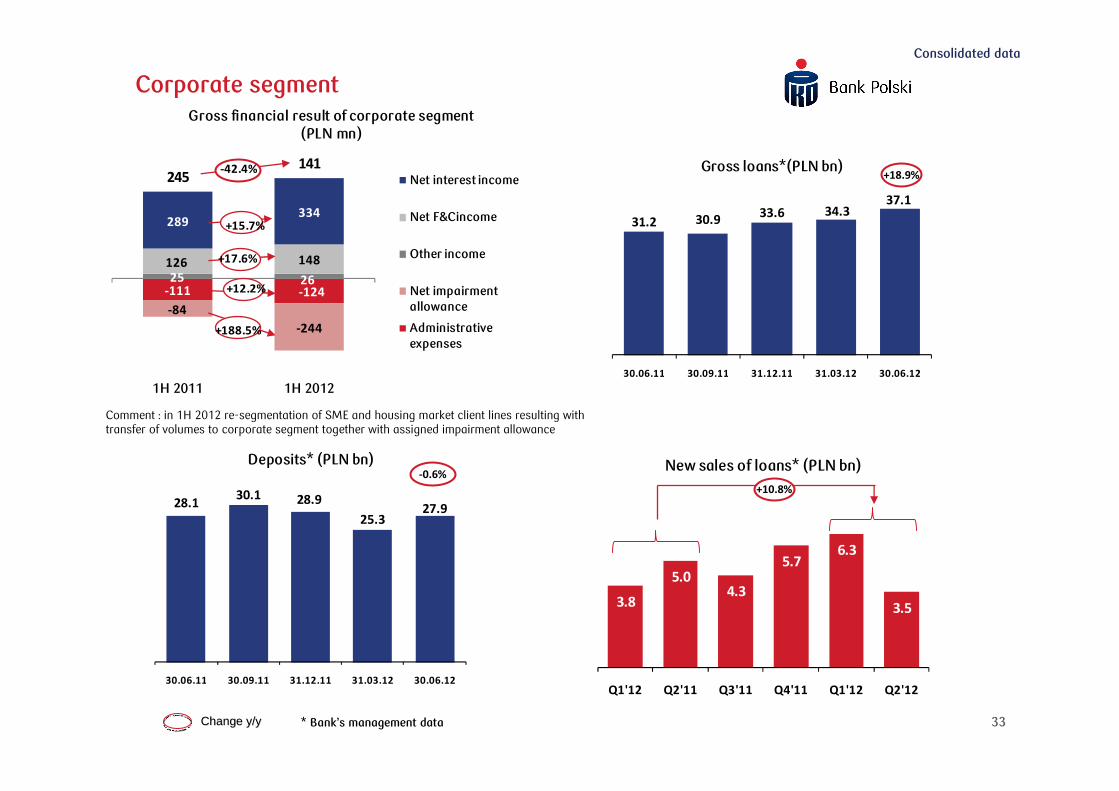
33
31.2 30.933.6 34.3
37.1
30.06.11 30.09.11 31.12.11 31.03.12 30.06.12
Gross loans*(PLN bn)
28.130.1 28.9
25.327.9
30.06.11 30.09.11 31.12.11 31.03.12 30.06.12
Deposits* (PLN bn)
3.8
5.04.3
5.76.3
3.5
Q1'12 Q2'11 Q3'11 Q4'11 Q1'12 Q2'12
New sales of loans* (PLN bn)
-111 -124
-84
-244
25 26
126 148
289334
245141
1H 2011 1H 2012
Gross financial result of corporate segment (PLN mn)
Net interest income
Net F&Cincome
Other income
Net impairment allowance
Administrative expenses
Corporate segment
+18.9%
-0.6%
Change y/yChange y/y
Consolidated data
* Bank’s management data
+188.5%
+12.2%
+17.6%
+15.7%
-42.4%
Comment : in 1H 2012 re-segmentation of SME and housing market client lines resulting with transfer of volumes to corporate segment together with assigned impairment allowance
+10.8%
34
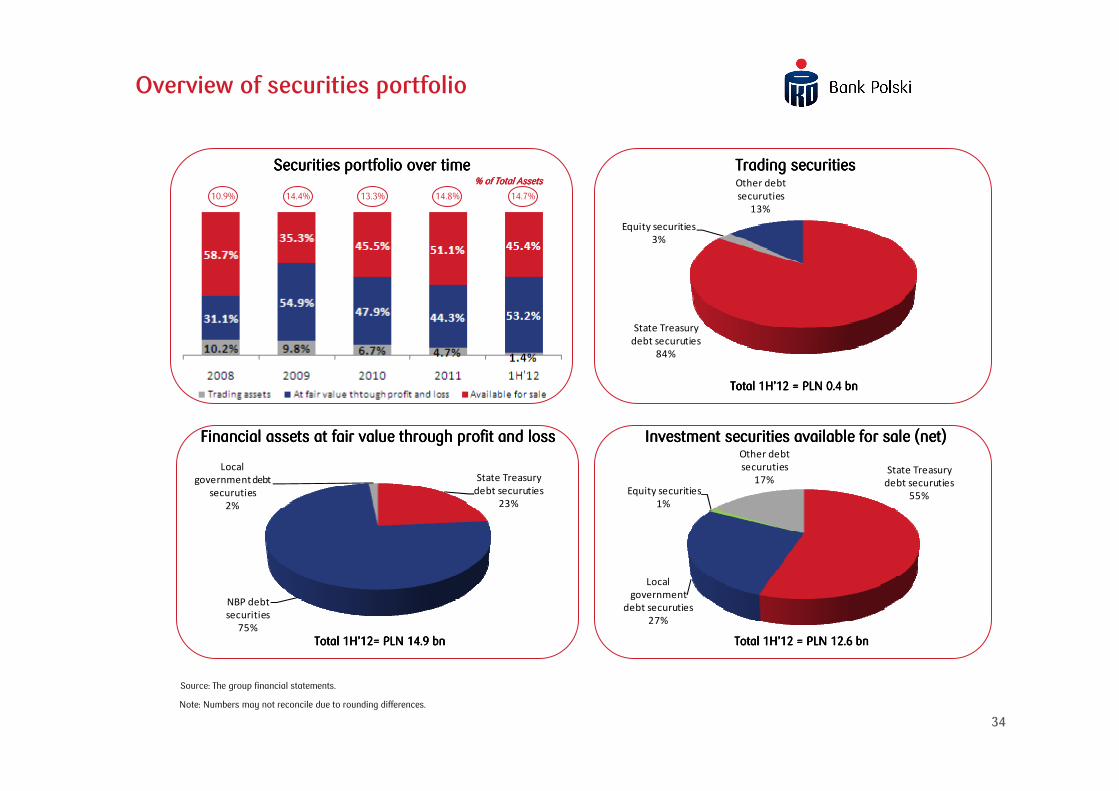
Overview of securities portfolio
Financial assets at fair value through profit Financial assets at fair value through profit Financial assets at fair value through profit Financial assets at fair value through profit andandandand loss loss loss loss Investment securities available for sale (net)Investment securities available for sale (net)Investment securities available for sale (net)Investment securities available for sale (net)
Securities portfolio over timeSecurities portfolio over timeSecurities portfolio over timeSecurities portfolio over time Trading securitiesTrading securitiesTrading securitiesTrading securities
10.9% 14.4% 13.3%
% of Total Assets% of Total Assets% of Total Assets% of Total Assets
Total Total Total Total 1H1H1H1H’’’’12121212 = PLN = PLN = PLN = PLN 0.4 0.4 0.4 0.4 bnbnbnbn
Total Total Total Total 1H1H1H1H’’’’12121212 = PLN 1= PLN 1= PLN 1= PLN 12.6 2.6 2.6 2.6 bnbnbnbnTotal Total Total Total 1H1H1H1H’’’’12121212= PLN = PLN = PLN = PLN 14.9 14.9 14.9 14.9 bnbnbnbn
Source: The group financial statements.
Note: Numbers may not reconcile due to rounding differences.
14.8% 14.7%
State Treasury
debt securuties
84%
Equity securities
3%
Other debt
securuties
13%
State Treasury
debt securuties
23%
NBP debt
securities
75%
Local
government debt
securuties
2%
State Treasury
debt securuties
55%
Local
government
debt securuties
27%
Equity securities
1%
Other debt
securuties
17%

35
Disclaimer
This presentation (the ”Presentation”) has been prepared by Powszechna Kasa Oszczędności Bank Polski S.A. (”PKO BP S.A.”, ”Bank”) solely for use by its clients and shareholders or analysts and should not be treated as a part of any an invitation or offer to sell any securities, invest or deal in or a solicitation of an offer to purchase any securities or recommendation to conclude any transaction, in particular with respect to securities of PKO BP S.A. The information contained in this Presentation is derived from publicly available sources which Bank believes are reliable, but PKO BP SA does not make any representation as to its accuracy or completeness. PKO BP SA shall not be liable for the consequences of any decision made based on information included in this Presentation.
The information contained in this Presentation has not been independently verified and is, in any case, subject to changes and modifications. PKO BP SA’s disclosure of the data included in this Presentation is not a breach of law for listed companies, in particular for companies listed on the Warsaw Stock Exchange. The information provided herein was included in current or periodic reports published by PKO BP SA or is additional information that is not required to be reported by Bank as a public company.
In no event may the content of this Presentation be construed as any type of explicit or implicit representation or warranty made by PKO BP SA or, its representatives. Likewise, neither PKO BP SA nor any of its representatives shall be liable in any respect whatsoever (whether in negligence or otherwise) for any loss or damage that may arise from the use of this Presentation or of any information contained herein or otherwise arising in connection with this Presentation.
PKO BP SA does not undertake to publish any updates, modifications or revisions of the information, data or statements contained herein should there be any change in the strategy or intentions of PKO BP SA, or should facts or events occur that affect PKO BP SA’s strategy or intentions, unless such reporting obligations arises under the applicable laws and regulations.
This Presentation contains certain market information relating to the banking sector in Poland, including information on the market share of certain banks and PKO BP SA. Unless attributed exclusively to another source, such market information has been calculated based on data provided by third party sources identified herein and includes estimates, assessments, adjustments and judgments that are based on PKO BP SA’s experience and familiarity with the sector in which PKO BP SA operates. Because such market information has been prepared in part based upon estimates, assessments, adjustments and judgments and not verified by an independent third party, such market information is, unless otherwise attributed to a third party source, to a certain degree subjective. While it is believed that such estimates, assessments, adjustments and judgments are reasonable and that the market information prepared is appropriately reflective of the sector and the markets in which PKO BP SA operates, there is no assurance that such estimates, assessments and judgments are the most appropriate for making determinations relating to market information or that market information prepared by other sources will not differ materially from the market information included herein.
PKO BP SA hereby informs persons viewing this Presentation that the only source of reliable data describing PKO BP SA’s financial results, forecasts, events or indexes are current or periodic reports submitted by PKO BP SA in satisfaction of its disclosure obligation under Polish law.
This Presentation is not for release, directly or indirectly, in or into the United States of America, Australia, Canada or Japan.

PKO Bank Polski websitePKO Bank Polski websitePKO Bank Polski websitePKO Bank Polski website:www.pkobp.pl
PKO Bank Polski SA Investor Relations Office contactPKO Bank Polski SA Investor Relations Office contactPKO Bank Polski SA Investor Relations Office contactPKO Bank Polski SA Investor Relations Office contact:Ms. Lidia Wilk – Director Pulawska 1502-515 WarsawPolandTel: +48 22 521 91 82Fax: +48 22 521 91 83E-mail: [email protected]: [email protected]


