38
Temi di discussione (Working Papers) Place-based policy and local TFP by Giuseppe Albanese, Guido de Blasio and Andrea Locatelli Number 1253 December 2019

Temi di discussione(Working Papers)
Place-based policy and local TFP
by Giuseppe Albanese, Guido de Blasio and Andrea Locatelli
Num
ber 1253D
ecem
ber
201
9


Temi di discussione(Working Papers)
Place-based policy and local TFP
by Giuseppe Albanese, Guido de Blasio and Andrea Locatelli
Number 1253 - December 2019

The papers published in the Temi di discussione series describe preliminary results and are made available to the public to encourage discussion and elicit comments.
The views expressed in the articles are those of the authors and do not involve the responsibility of the Bank.
Editorial Board: Federico Cingano, Marianna Riggi, Monica Andini, Audinga Baltrunaite, Marco Bottone, Nicola Curci, Davide Delle Monache, Sara Formai, Francesco Franceschi, Salvatore Lo Bello, Juho Taneli Makinen, Luca Metelli, Mario Pietrunti, Massimiliano Stacchini.Editorial Assistants: Alessandra Giammarco, Roberto Marano.
ISSN 1594-7939 (print)ISSN 2281-3950 (online)
Printed by the Printing and Publishing Division of the Bank of Italy

PLACE-BASED POLICY AND LOCAL TFP
by Giuseppe Albanese*, Guido de Blasio♦ and Andrea Locatelli■
Abstract
Total Factor Productivity (TFP) explains most of the differences in income levels between territories. A major policy issue is whether place-based policies are capable of promoting TFP growth in backward areas. We provide some evidence of the effect of the European Regional Development Fund (ERDF) on local TFP growth in Southern Italy. Although TFP growth is on average rather unresponsive to EU programs, we provide some evidence of a positive effect for ERDF infrastructure investments and for areas with higher institutional quality and population density.
JEL Classification: R58, O47, D24. Keywords: ERDF programs, TFP, manufacturing firms. DOI: 10.32057/0.TD.2019.1253
Contents
1. Introduction ......................................................................................................................... 5 2. Literature review.................................................................................................................. 7 3. The ERDF programs ............................................................................................................ 8 4. Empirical model and data .................................................................................................. 10 5. Baseline results .................................................................................................................. 12 6. Decomposing the impact of policy .................................................................................... 14
6.1 Types of intervention .................................................................................................. 14 6.2 Heterogeneity by area characteristics ......................................................................... 15
7. Concluding remarks ........................................................................................................... 16 Tables and figures .................................................................................................................. 17 Appendix I - Building TFP at LLM level .............................................................................. 25 Appendix II - Lasso covariates ............................................................................................... 26 References .............................................................................................................................. 28
_______________________________________ * Bank of Italy, Economic Research Unit, Catanzaro Branch.♦ Bank of Italy, Bank of Italy, Structural Economic Analysis Directorate.■ Bank of Italy, Economic Research Division, Trento Branch.


1 Introduction1
Total Factor Productivity (TFP) is a crucial variable to explain differences in income levels cross
territories. Hsieh and Klenow (2010) underscore that TFP accounts for 50-70 percent of the cross-
country income differences. Hornbeck and Moretti (2019) estimate large differences in TFP levels
and growth rates across US metropolitan statistical areas (MSAs) and suggest that increases of local
TFP bring substantial benefits to workers. Being a measure of the efficiency through which the factors
of production are combined to produce the output, TFP is seen as reflecting many potential
determinants (according to Caselli, 2005, it represents the “measure of our ignorance”): at the local
level, these determinants range from the effectiveness of the transportation infrastructure to
technological improvements and productivity spillovers from agglomeration economies. As lagging
regions are characterized by low TFP, place-based (cohesion) policy is envisaged to tackle the causes
that hider its growth.
To what extent are place-based interventions effective in reaching the goal of fostering local
TFP growth? Unfortunately, this question has proved to be difficult to answer. The main reason is
that TFP data are hard to get, because they need to be estimated using model-based techniques from
firm-level archives. In this paper, we exploit the firm-level TFP estimates provided by Ciani et al.
(2019), which are available for manufacturing firms (as in Hornbeck and Moretti, 2019) for the period
between 1995-2015. For this analysis, we aggregate these firm-level productivity data at the level of
the local labor market (LLM).
Evaluating the impact of the policy on local TFP represents a departure from previous studies,
which have mostly focused on firm-level measures of TFP (Criscuolo et al., 2019). Our LLM-level
proxy captures also the sources of productivity growth that are external to the firms, i.e., not specific
to the actual firms that have been subsidized. This is a significant progress, as a large share of
financing is spent on local transportation infrastructure and horizontal projects (such as those intended
to spur local technological improvements, e.g., technological parks and broadband connections). Our
measure of local TFP also reflects any productivity spillovers resulting from local agglomeration
economies. Looking at the local TFP also supplements previous literature on area-wide outcomes,
such as investment or employment (Neumark and Simpson, 2015). To the extent that TFP
1 The authors are grateful to Paolo Sestito, Andrea Conte, Alessio d’Ignazio, Emanuela Ciapanna, Francesca Lotti, Andrea Linarello, Andrea Fracasso, Mauro Caselli, Marco Di Cataldo, Paolo Pasimeni and seminar participants at the 59th ERSA Congress, at the University of Trento and at 2019 Barcelona Workshop on regional and urban economics – VII JRC Regional modelling workshop for helpful comments. The views expressed in this paper are those of the authors and do not necessarily correspond to those of the Bank of Italy.
5

improvements due to the policy come hand in hand with the adoption of capital- or labor-saving
technologies, the previous evidence might provide an underestimation of the overall policy impacts.
We link TFP data with an archive of European Regional Development Fund (ERDF)
disbursements for the EU programming cycle 2007-2013. The ERDF is the main policy instrument
available in the EU to tackle the roots of TFP underdevelopment, as it finances research and
innovation activities as well as infrastructure investment. We focus on the South of Italy, the most
backward area of the country; in fact, the ERDF allocations towards this region have been more
generous and the LLMs are more similar to each other for a number of socio-economic features, with
respect to their northern counterparts. As described in Ciani et al. (2019), southern TFP is
substantially lower than that prevailing in the rest of the country; the estimated divide ranges between
about 12 per cent (if labor input is measured as labor cost) and 30 per cent (if the number of employees
is used in its place). Irrespective of the proxy of labor used for estimation, there has been a modest
catching-up of the TFP of the South over the 1995-2015 period (between 5-7 per cent). Thus, it seems
relevant to check whether cohesion money, which disproportionally benefit southern areas, are at
least partly responsible for that.
We estimate the impact of ERDF programs on local TFP by using cross-LLM evidence that
tackle omitted variable bias by using an extraordinary ample set of controls compounded with Belloni
at al. (2014) double-selection procedure (LASSO). Using the same econometric framework, over the
same period and across the same areas Ciani and de Blasio (2015) estimate that regional transfers had
no detectable impact on local population and house prices and, at best, a modest effect on
employment. Our main results indicate that ERDF 2007-2013 programs did not have a significant
impact on local TFP growth. Yet, in an investigation of heterogeneous effects by type of expenditure,
we find that the ERDF infrastructure investments did have a positive and significant impact on TFP
growth, while this was not the case for incentives and public procurement spending. We finally show
that some characteristics of the local context matter, in particular the quality of institutions and the
existing degree of urbanization. The former feature could be particularly relevant in our case study,
since Southern Italy generally performs very poorly both in the national and international
comparison.2
The remaining of the paper is structured as follows. Section 2 reviews the relevant literature.
Section 3 provides details on the ERDF program. Section 4 describes the data, in particular those on
2 According to the 2017 European Quality of Government Index (Charron et al., 2014), all Southern Italian regions are in the last quarter of the distribution of institutional quality among European NUTS2.
6
TFP, and describes our empirical strategy. Sections 5-6 outline the results, which are corroborated
with a full-fledged robustness analysis, and present some interesting dimension of heterogeneity.
Section 7 concludes.
2 Literature review
This work contributes to the strand of literature that has tried to estimate the effectiveness of place-
based policies (Neumark and Simpson, 2015). The results of these studies are mixed, but for the most
part they suggest that place-based interventions have a limited impact and suffer from various
drawbacks. In general, there is abundant evidence that many policies do not create new firms, jobs or
investment, but simply move them over space and time (Freedman, 2013; von Ehrlich and
Seidel, 2018), especially those focused on geographically limited areas. Results are also
heterogeneous by policy instrument. Tax exemption policies and direct subsidies for hiring or
investments seem to work little (Busso et al., 2013; Kolko and Neumark, 2010); when they work,
the side effects could be greater than the direct benefits (Reynolds and Rohlin, 2015).
Infrastructure policies seem to work better. For instance, the “Tennessee Valley Authority” has had
a lasting effect in the development of a backward area of the United States (Kline and Moretti,
2014). Again, “Zones Franches Urbaines” in France seem to be more successful if they are located
in areas with more infrastructure (Briant et al., 2015).
Much attention has been devoted to EU regional policy (Becker et al., 2010). On average, its
effect seems positive and significant; however, there is much heterogeneity: positive results seem to
be drawn by a handful of well-managed regions and with an educated labor force (Becker et al.,
2013). With regard to Italy, the evidence found in previous works suggests that effectiveness was
rather limited. Bronzini and de Blasio (2006) estimate a very small impact of a major incentive
scheme (Law 488/1992, intended to subsidize firms located in economically depressed areas) on
firms’ investment, mostly due to anticipation effects. Also, Accetturo and de Blasio (2012) find that
the “Patti Territoriali” program (in which local communities played a significant role in designing the
development plan) were ineffective in fostering economic growth. Further, Andini and de Blasio
(2014) conclude that the “Contratti di Programma” intervention (consisting in the Government
approval and financing of industrial projects proposed by private firms) had limited impact on local
growth, while stimulating spatial substitution from southern untreated areas to treated ones. Ciani and
de Blasio (2015) find that European Structural Funds (ESF) had a very limited impact on
employment, population and house prices in Southern Italy between 2007-2013, with modest effects
7

on employment being connected to the acceleration and retargeting of payment started in 2011. Some
evidence of a positive impact of overall EU funding on employment is only found in Giua (2017)
who studies the EU 2000-2006 programming cycle and considers, in an RDD set-up, the differences
in employment growth across municipalities on the two sides of the Objective 1 border. Overall,
Accetturo and de Blasio (2019) review the evidence from 1995 onwards and conclude that it is quite
hard to find rigorously-derived results in favor of effectiveness.
The evidence on the link between place-based policy and productivity is rather limited and
generally not very favorable. Bernini and Pellegrini (2011) evaluated the impact of Law 488/92 on
the performance of private firms and found evidence that the subsidies, while having some positive
effects on employment and investment, had a negative impact on labor productivity and TFP growth
(firms may have overshot the optimal amount of inputs in order to obtain the subsidy). Similarly,
Criscuolo et al. (2019) found that a major program to support manufacturing jobs in the UK
(“Regional Selective Assistance”) had some positive effect on employment and investment by small
firms, but not on their TFP. In a study of the Latvian economy, Benkovskis et al. (2018), focusing on
funding received by firms from the ERDF, alone – excluding beneficiaries from the European Social
Fund (ESF) or the Cohesion Fund (CF) – find that such projects had no average effect on TFP in the
short run but a small positive effect with some time lag. In a wider study on six OECD countries
(including Italy), Bachtrögler and Hammer (2018) merge newly-collected data on Structural Funds
received by firms with a measure of their individual TFP; their analysis provides mixed evidence of
the effectiveness of EU spending in promoting productivity growth (depending on the choice of the
capital proxy used for the estimation of the production function). Contrasting evidence on the
effectiveness of place-based policy in fostering productivity can be found in a recent paper by
Brachert et al. (2019), which finds a positive impact on the district-level growth of gross value added
and productivity by a prominent scheme (“Improving the Regional Economic Structure”) realized in
West Germany between 2000 and 2006.
3 The ERDF programs
The Structural Funds represent financial instruments of the EU regional policy, intended to pursue
the goal of economic, social and territorial cohesion by narrowing the development disparities among
regions and member states. For the period 2007-2013, the budget allocated to the Structural Funds
8

amounted to around 278 billion euros, which represents 28 percent of the Community budget.3 There
are two Structural Funds: the ERDF provides support for the creation of infrastructures and
productive job-creating investment, mainly for businesses; the ESF contributes to the integration into
working life of the unemployed and disadvantaged sections of the population, mainly for social
inclusion. In the period 2007-2013, they accounted, respectively, for 202 and 76 billion euros. In this
paper we will focus on ERDF interventions alone, given our focus on the TFP of manufacturing firms.
The ERDF support programs addressing regional development, economic change and
competitiveness throughout the EU. In Italy, the ERDF has financed 28 national and regional
programs during the 2007-2013 cycle. Funding priorities have included research and innovation,
SME support, and infrastructure investment. The bulk of expenditure has flown to the “Convergence
Objective” areas, which were regions with GDP per capita less than 75 percent of the EU average. In
Italy, they included five Southern regions (Apulia, Basilicata, Calabria, Campania and Sicily). The
three remaining Southern regions (Abruzzo, Molise and Sardinia) were classified as
“Competitiveness Objective” areas (along with the Centre-North regions), and have been receiving
fewer funds from EU programs in per capita terms (Figure 1).
The information on ERDF expenditure in Italy comes from the OpenCoesione website.4 It
collects all the information relative to projects at least partially funded by EU Structural Funds starting
from the 2007-2013 programming cycle. In this archive, expenditure data include not only the money
coming from the EU funds, but also the national co-financing from the Italian Government (or local
authorities). Importantly, the data provide geo-referenced information about the targeted places.
Although the vast majority of projects (over 95 percent) take place at the level of municipalities, some
target a higher administrative level (i.e., provinces or regions). In such cases the expenditure was
distributed between the respective municipalities on the basis of their population in the initial year of
our analysis (2007).
In the empirical analysis, we aggregate TFP and ERDF data to the level of LLMs, which are
geographical areas designed by the National Statistical Institute (Istat) to be approximately a self-
contained commuting zone (on the basis of the 2001 Census). All variables relative to payments are
expressed in per capita terms (2007 population is used as a denominator). Table 1 shows the main
descriptive statistics.
3 In this paper, we do not consider the CF, which is intended for countries whose per capita GDP is below 90% of the Community average; the Italian per capita GDP lies above this threshold. 4 www.opencoesione.gov.it
9

In our sample, average TFP stagnated between 2007 and 2015. The productivity decline
experienced in the years 2008 and 2009 – when the economy was hit by the international financial
crisis (its impact was less severe in the South than in the North of Italy, where firms are more open
to international trade) – was followed by a period of slow recovery, hindered by the strong
dependence of the southern economy from public demand. Our data show a significant degree of
heterogeneity in local productivity dynamics, ranging between a drop of more than 1 per cent to a
growth close to 1.8 per cent. Over the same period, also ERDF disbursements displayed substantial
LLM variation, ranging between 100 euros and 4,700 euros per capita.
ERDF disbursements started in 2007 (in Southern LLMs only some 450 million euros were
spent in that year, representing about 1.6 percent of the total expenditure over the entire period) and
became significant from 2008 (Figure 2); their rate of growth progressively increased in the two
following years. In 2011 there was a significant expansion, which followed the actions taken by the
Italian government to speed-up the spending and re-focusing the programs, to try to mitigate the
impact of the long recession. Finally, there was an acceleration at the end of the cycle 2007-2013,
that extends to 2015 following the “N+2” rule.5
Figure 3 shows the distribution of TFP variation and spending across LLMs. Both maps
display a substantial geographical variability, which we exploit for our investigation.
4 Empirical model and data
Our focus lies on the effect of ERDF programs on TFP growth (∆Φ𝐢𝐢) measured at the local level. The
unit of observation for the analysis is the LLM, to which subscript 𝑖𝑖 refers. In this Section, local TFP
is calculated as an unweighted average of firm-level data; in Section 5 we also experiment using
firms’ value added as a weight. Appendix I summarizes the model-based estimation of firm TFP from
Ciani et al. (2019) on which we rely.
Model 1 is our baseline specification in which we estimate the impact of the overall amount
of per capita ERDF expenditure (𝑠𝑠𝑖𝑖) received by LLM 𝑖𝑖 in the entire period of analysis on the growth
of local TFP between 2007-2015. The estimated equation is:
∆Φi = δln (si) + β0 + fi′ω + ∆εi (1),
5 EU financing rules implied that, for each year N of the period 2007-2013, annual funding from the Cohesion policy had to be spent by the end of the second year after its allocation (N+2).
10
where ∆Φi represents the growth of average TFP in LLM 𝑖𝑖 expressed in terms of a log-
difference, ln (si) is the natural logarithm of the overall ERDF expenditure, fi′ is a vector of LLM-
specific variables which is included to predict local counterfactual trends in TFP, and ∆εi is the error
term.
In order to predict local counterfactual trends in TFP, we included a vector of LLM-specific
variables fi′. The introduction of these covariates in our specification in first differences allows for
linear time trends that depend on pre-determined differences in these variables. For OLS to
consistently estimate the true effect of cumulate payments, we need expenditure to be orthogonal to
shocks ∆εi, given the LLM characteristics included in fi′.
In estimating equation (1), a trade-off arises between two opposite concerns. On the one hand,
our empirical strategy requires a very long set of covariates fi′ to gain credible estimates of parameter
δ: we considered an extensive set of (82) local variables,6 which regard geography and socio-
economic characteristics of LLMs that could influence productivity at the local level. On the other
hand, using a large set of covariates may hinder the precision of the estimators and create problems
for standard inference because of the small sample size. One approach to solve this problem is to
follow Belloni et al. (2014), and select a smaller set of variables using a “double selection method”.
Instead of assuming that one needs to control for the entire list of variables fi′, it may be assumed that
there is a smaller set of covariates such that, once controlling for them, ln (si) can be considered
exogenous. The problem is that this subset is a priori unknown. The standard procedure would be to
consider only those variables that the researcher or the literature consider more relevant. Differently,
Belloni et al. (2014) propose to select them by using a Least Absolute Shrinkage and Selection
Operator (LASSO), which minimizes the sum of squared residuals and an additional penalty
parameter that aims at reducing the overall size of the model. The selection must be conducted on the
two reduced forms:
∆Φi = β0Φ + fi′β1Φ + ∆viΦ (2a)
ln (si) = β0s + fi′β1s + ∆vis (2b)
6 The list of variables, referred to 2001, includes: population and population density; geographical features (latitude, longitude, altitude, coastal location); presence of a provincial capital; employment, unemployment and activity rates; institutional quality (measured at provincial level with the index by Nifo and Vecchione, 2014); human capital (number of graduate people over adult population); social capital (number of non-profit organizations per capita); bankarization (number of bank offices per capita); presence of an industrial district; sector composition (share of workers in 57 Ateco 2-digit sectors); size of local manufacturing plants (share of manufacturing workers belonging to ten size classes: 1-2, 3-5, 6-9, 10-19, 20-59, 50-99, 100-199, 200-499, 500-999, 1,000 or more). Additional information and descriptive statistics on variables are reported in the Appendix II.
11
and the final set of variables should be the union of those selected in (2a) and (2b). The reason
is that the selection aims at maximizing the predictive power of the covariates, which is captured by
the reduced forms rather than by the equation of interest.
To exploit the panel dimension of our data, we have also estimated the effect of annual per
capita expenditure sit on annual growth:
∆Φit = δln (siτ) + γt + ∆εit (3),
where t = 2008, … ,2015 and τ = t − l, l = 0,1,2 to account for lagged effects.
By considering the year-to-year variability as in equation (3) we can experiment with a
number of different strategies. First of all, we can control for LLM-specific linear time trends by
adding LLM fixed effects gi, which would capture a constant growth over the years for each LLM:
∆Φit = δln (siτ) + γt + gi + ∆εit (4a).
Shocks ∆εit must be, conditional on time effects γt and LLM effects gi, uncorrelated with
payments in all time periods. However, there may be non-linear trends that would require introducing
additional interactions between the LLM fixed effects and higher order time trends in the regression,
which is not feasible given the short length of our panel. So we also exploit a different strategy, based
on our set of time-invariant covariates fi′ (see footnote 6). We introduce them in a year-to-year
regression and we also interact them with a linear time trend t and its square. This allows for linear
and quadratic trends that depend on these pre-determined variables:
∆Φit = δln (sit) + γt + fi′ω1 + t × fi′ω2 + t2 × fi′ω3 + ∆εit (4b).
Due to the high-dimensionality of the model (4b), we have again adopted the LASSO “double
selection” strategy of Belloni et al. (2014) to estimate its parameters.
5 Baseline results
Table 2 reports the estimates of coefficient 𝛿𝛿 in equation (1) for Southern LLMs, which represents
the effect of the ERDF programs on local TFP. Our baseline specification in column 1 includes the
subset of covariates selected using Belloni et al. (2014) “double selection” strategy among the set of
variables described in Section 4. Appendix II illustrates the controls selected by the LASSO procedure
for the specifications of Table 2. In column 2, we include initial (2007) productivity, to explicitly
12

account for a convergence mechanism in TFP growth,7 and in column 3 we also add a set of regional
fixed effects.8 In column 4, as a further check, we augment our set of LASSO potential covariates
with their squared terms and pairwise interactions (for a total of about 6,500 variables). Our estimates
of coefficient 𝛿𝛿 are not statistically different from zero in any specification considered; this suggests
that the ERDF programs had no appreciable impact on local TFP.
To corroborate this evidence, we conduct an extensive list of robustness checks reported in
Tables 3 and 4. To check whether the result is guided by our sample choice, we first repeat the analysis
on the entire country (Table 3, panel A); we then restrict the attention only to “Convergence
Objective” regions (panel B).9 One additional concern is that our time window includes the very large
2008-2009 decline in both economic activity and TFP documented, among others, by Ciani et al.
(2019); to account for this issue, we shorten our estimation window to the years 2010-2015 (panel
C). Finally, since a large part of expenditure is concentrated between 2013-15 and its effect could
materialize in the following years, we also extend the time horizon by considering TFP growth
between 2007 and 2017 (panel D). In all these cases our results are confirmed.
In Table 4 we explore to what extent our results are robust to measuring local TFP in
alternative ways. In panel A, we replicate our analysis weighing TFP with firms’ value added rather
than use unweighted means. We notice that this measure, although being more representative of the
aggregate productivity dynamics, may suffer more severely from the absence of establishment-level
data, compared to the unweighted average. In panel B, we use the TFP measure obtained when the
number of employees is chosen as a measure for labor input; this measure presents some advantages
over labor costs (it does not require special treatments, e.g. deflation, nor is it affected by the cost of
living) but it may be less suitable to account for labor quality and intensity (see, e.g., Fox and Smeets,
2011, and Irarrazabal et al., 2013). In panel C, we use TFP data derived from distinguishing between
blue-collar and white-collar workers in the labor input of the TFP equation. In panel D, we use TFP
data derived from using as proxy for the capital input the estimates of total capital (both tangible and
intangible) obtained by Lenzu and Manaresi (2017) using the perpetual inventory method, rather than
the book value of tangible assets. Finally, in panel E, we replicate the analysis approximating firms’
7 More specifically, we applied the LASSO estimator to the following growth equation: ∆Φi = δln (si) + ΦiT + β0 +fi′ω + ∆εi, where the change in outcome is taken to be related to the initial level of productivity (i.e. at time T=2007). The convergence term is not penalized in the LASSO procedure; as a result, it is always included among the predictors in our equation of interest. 8 This specification allows us to capture the effect of unobservable local dynamics common to LLMs in a region. 9 As mentioned in Section 3, “Convergence Objective” Southern regions are Apulia, Basilicata, Calabria, Campania and Sicily, whereas Abruzzo, Molise and Sardinia are classified as “Competitiveness Objective” regions, along with the Centre-North regions.
13

productivity with value added per employee rather than TFP. For all these sensitivity checks, our
results always confirm that local productivity dynamics do not show any association with ERDF
spending.
Finally, Table 5 shows our panel data results. More in details, Columns 1-3 and 4-6 report,
respectively, the estimates obtained from models (4a) and (4b) using 0, 1 or 2 lags. Even in this case,
our estimates fail to point to any significant effect of ERDF programs on the TFP of manufacturing
firms, both when considering contemporaneous spending and when its lags are included in the
model.10
6 Decomposing the impact of policy
6.1 Types of intervention
Until now, we have ignored the nature of expenditure promoted by ERDF programs. In particular,
during the programming cycle 2007-2013, 54 per cent of expenditure was devoted to infrastructure
spending, while 20 per cent was used to grant firm subsidies (the rest is mainly related to purchase of
goods and services by the public administration). On a theoretical perspective, both of these types of
expenditure could have positive effects on TFP: in the first case through increasing the stock of public
capital, in the second case by stimulating research and innovation, or the investment in technology
and other productive capital.
Table 6 shows the results obtained applying our empirical model separately to cumulate
spending in public work and to firm subsidies separately. There is supportive evidence in favor of a
positive effect of the infrastructure investment realized by ERDF programs on the change in TFP of
manufacturing firms: our estimate suggest that a 10 percent increase in ERDF spending on
infrastructure led to a 0.3 percentage average increase in TFP. To the contrary, money transferred to
firms in the form of grants and subsidies seems to have had a negligible impact on productivity. Of
course, we cannot exclude that the amount of money spent in subsidies had some significant effect
for the pool of targeted firms. Nevertheless, the economic return of this expenditure is nil if estimated
10 One may be concerned that the allocation of funds may be influenced by previous productivity levels. To address this concern, we have re-estimated our models including both lags and leads of ERDF expenditure. This allows us to rule out the possibility of reverse causality: a zero estimated coefficient in the OLS regression of model (1) could be compatible with 𝛿𝛿 > 0 and 𝑐𝑐𝑐𝑐𝑐𝑐(∆𝜀𝜀𝑖𝑖,∆𝑠𝑠𝑖𝑖) < 0 (or vice versa), i.e. with the presence of some shock in TFP that generated a variation in the amount of ERDF funds disbursed to the municipalities in the LLM. The results (available upon request) show no significant inter-temporal relation between TFP and ERDF funds; in particular, we do not find any significant relationship between TFP dynamic in period t and funds in the following couple of years.
14

at the macro (LLMs) level. As further evidence, Table 6 (Columns 3-4) shows that there is no
association between TFP dynamics and either the purchase of goods and services by the public
administration or the expenditure for promoting employment and social inclusion by the ESF
programs.
We have also estimated the policy effect at different points of the distributions of TFP across
LLMs. In particular estimates reported in Table 7 show that infrastructure investment realized by
ERDF promoted TFP growth along the entire distribution of productivity growth, which explains the
positive overall effect described in the previous paragraph. On the contrary, public procurement and
firm subsidies were effective in fostering TFP growth only among the LLMs displaying the most
sluggish TFP dynamics, leading to an insignificant overall average effect.
6.2 Heterogeneity by area characteristics
Estimates in Section 5 focus on the average effect of ERDF programs in the overall sample of LLMs.
Now we move to verify if there is some relevant heterogeneity due to differential trends for different
groups of LLMs. In Table 8, we test for the presence of interactions between ERDF spending and a
some socio-economic characteristics of LLMs.
A first feature is the quality of local institutions. As suggested by an increasing literature (see,
for instance, Becker et al., 2013; Rodríguez-Pose and Garcilazo, 2015), institutional quality at the
local level seems to be one of the main drivers of the effectiveness of cohesion policy in Europe and
Italy. The measure of institutional quality that we adopt in this paper is the Institutional Quality Index
(IQI) index proposed by Nifo and Vecchione (2014). The index is a synthetic indicator of institutional
quality in Italian provinces for the period 2004-2012, based on a large set of elementary indexes
grouped into five dimensions (voice and accountability, government effectiveness, regulatory quality,
rule of law, corruption).11 Our results confirm the evidence found in the previous literature: Column
1 suggests in fact that areas characterized by higher institutional quality experiences a more sustained
TFP dynamic.
Secondly, the effect of ERDF programs on TFP could vary with the characteristics of the local
productive system. In this regard, Di Giacinto et al. (2014) document for Italy different trends of local
productivity between industrial districts and urban areas, with a gap in favor of the latter group.
Similarly, Columns 2-4 show that ERDF expenditure in more urbanized areas, as measured by their
11 For more technical details, see Nifo and Vecchione (2014)
15

population density, reap a significantly larger productivity gain than that devoted to less urbanized
areas, while the association between ERDF intervention and TFP dynamics is nil for any degree of
industrial specialization (measured by the share of manufacturing workers to total employment or by
the presence of an industrial district).
More in detail, Table 9 expands this analysis, considering the three categories of ERDF
expenditure in turn. In Columns 1-3 we show that the quality of local institutions matters especially
for the effectiveness of spending for public works. In the Columns 4-6 we focus on the role played
by the degree of urbanization and find that it is particularly conducive to productivity gains in the
case of incentives.
7 Concluding remarks
The impact of place-based policies on local outcomes has been heavily investigated, but
mainly with reference to the factors of production: labor and capital. Few studies have looked at the
effect on TFP, which is however a key economic variable as it explains the bulk of the differences in
income levels across areas and reflects all the local impediments to growth. Cohesion policy has the
objective of tackling exactly these sorts of impediments. Moreover, estimating the impact of this
policy on TFP provides useful complements to the existing estimates on labor and capital outcomes,
which might underestimate the policy impact in case of labor- or capital-saving productivity
improvements. The reason why TFP is not a standard outcome for (cohesion) program-evaluation
exercises is that this unobserved variable must be estimated through model-based techniques on firm-
level data. The availability of such data has allowed us to provide a first assessment, which refers to
the lagging areas of the south of Italy.
Our results suggest that local TFP growth was on average rather unresponsive to the European
financing. In an investigation of heterogeneous effects, we find that the ineffectiveness of the policy
is related to composition issues, since we can detect a positive effect only for half of ERDF
expenditure which is devoted to infrastructure investments. We also show that some characteristics
of local context, such as institutional quality and the existing degree of urbanization, do matter.
16

Tables and figures
Figure 1: Map of “Competitiveness Objective” regions and “Convergence Objective” regions.
Notes: The figure also reports the names of bordering “Competitiveness Objective” regions and “Convergence Objective” regions.
Table 1. Descriptive statistics on ERDF programs and TFP, Southern Italy LLMs Mean
Std Min Max Obs
TFP average 2007-15 growth 0.049 0.265 -1.067 1.783 286
Cumulate 2008-15 per-capita payments 1,271.3 724.2 100.9 4,726.8 286
Log Cumulate 2008-15 per-capita payments 6.95 0.72 4.61 8.46 286
Notes: The TFP average growth over 2007-15 is calculated as change in log-level.
17

Figure 2: ERDF 2007-2013 programs, cumulative spending, Southern Italy
Notes: Expenditure by ERDF 2007-2013 programs in Southern Italy (EU funds plus national co-funding). Data are taken from Opencoesione website.
18
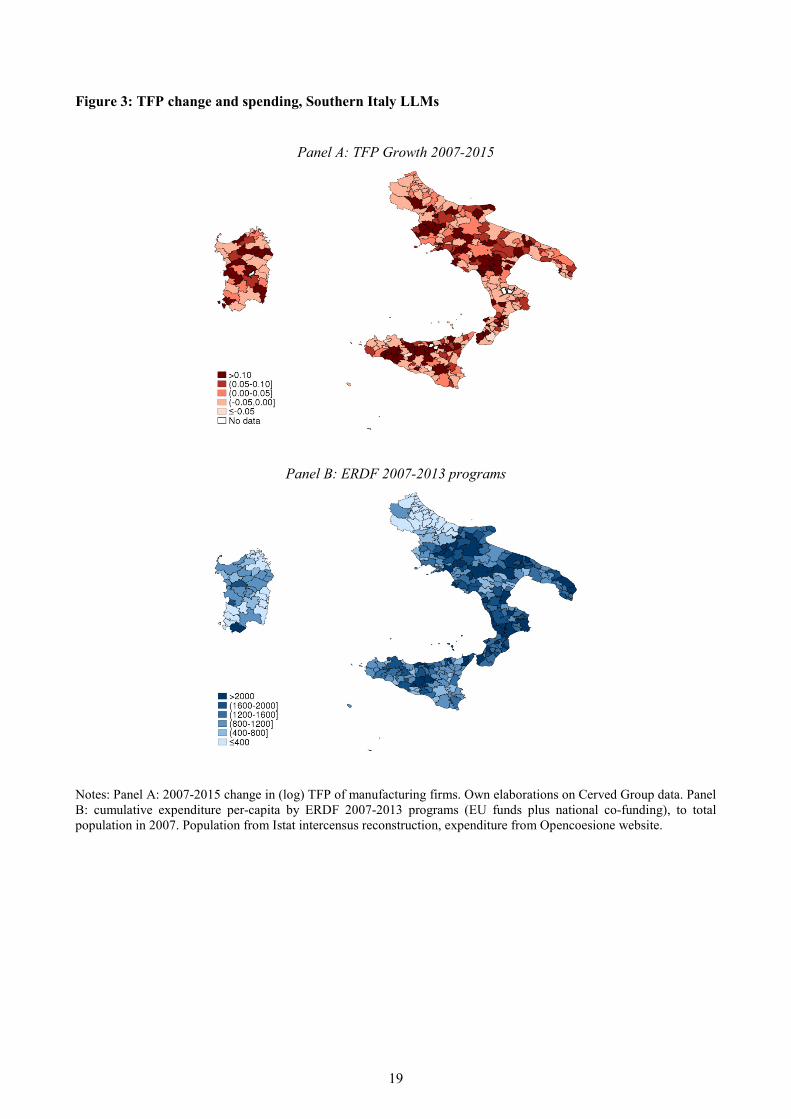
Figure 3: TFP change and spending, Southern Italy LLMs
Panel A: TFP Growth 2007-2015
Panel B: ERDF 2007-2013 programs
Notes: Panel A: 2007-2015 change in (log) TFP of manufacturing firms. Own elaborations on Cerved Group data. Panel B: cumulative expenditure per-capita by ERDF 2007-2013 programs (EU funds plus national co-funding), to total population in 2007. Population from Istat intercensus reconstruction, expenditure from Opencoesione website.
19
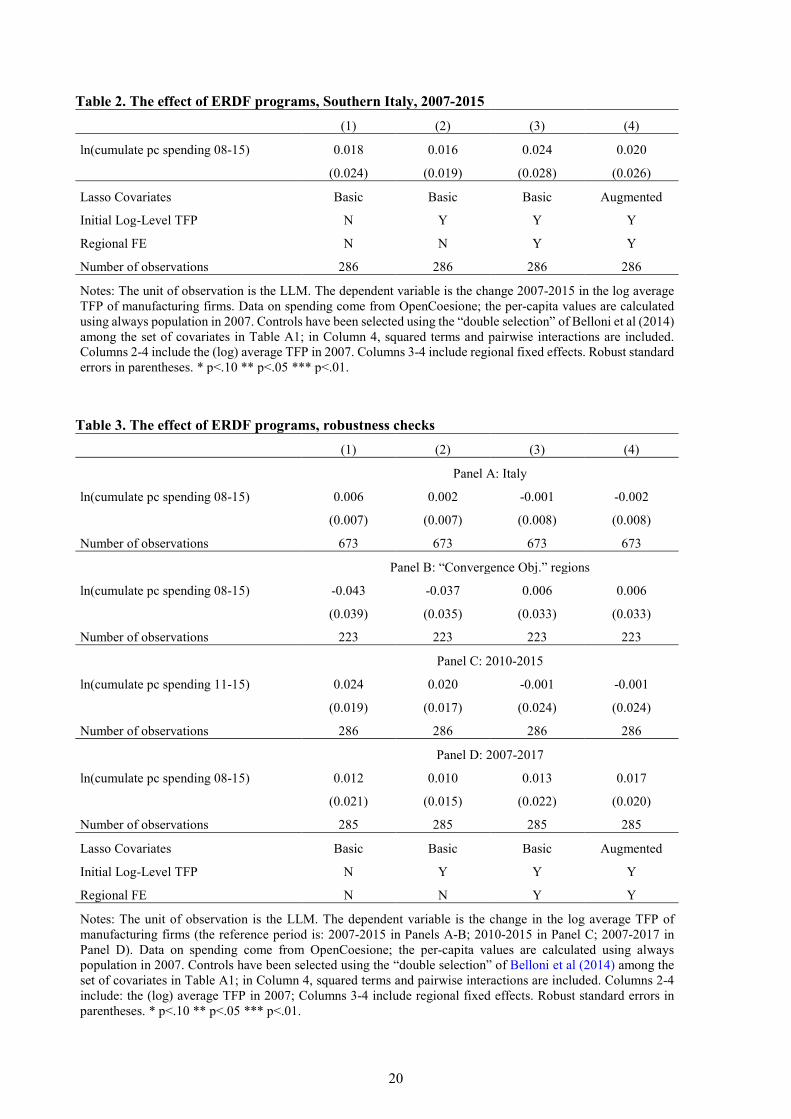
Table 2. The effect of ERDF programs, Southern Italy, 2007-2015 (1) (2) (3) (4)
ln(cumulate pc spending 08-15) 0.018 0.016 0.024 0.020
(0.024) (0.019) (0.028) (0.026)
Lasso Covariates Basic Basic Basic Augmented
Initial Log-Level TFP N Y Y Y
Regional FE N N Y Y
Number of observations 286 286 286 286
Notes: The unit of observation is the LLM. The dependent variable is the change 2007-2015 in the log average TFP of manufacturing firms. Data on spending come from OpenCoesione; the per-capita values are calculated using always population in 2007. Controls have been selected using the “double selection” of Belloni et al (2014) among the set of covariates in Table A1; in Column 4, squared terms and pairwise interactions are included. Columns 2-4 include the (log) average TFP in 2007. Columns 3-4 include regional fixed effects. Robust standard errors in parentheses. * p<.10 ** p<.05 *** p<.01.
Table 3. The effect of ERDF programs, robustness checks (1) (2) (3) (4)
Panel A: Italy
ln(cumulate pc spending 08-15) 0.006 0.002 -0.001 -0.002
(0.007) (0.007) (0.008) (0.008)
Number of observations 673 673 673 673
Panel B: “Convergence Obj.” regions
ln(cumulate pc spending 08-15) -0.043 -0.037 0.006 0.006
(0.039) (0.035) (0.033) (0.033)
Number of observations 223 223 223 223
Panel C: 2010-2015
ln(cumulate pc spending 11-15) 0.024 0.020 -0.001 -0.001
(0.019) (0.017) (0.024) (0.024)
Number of observations 286 286 286 286
Panel D: 2007-2017
ln(cumulate pc spending 08-15) 0.012 0.010 0.013 0.017
(0.021) (0.015) (0.022) (0.020)
Number of observations 285 285 285 285
Lasso Covariates Basic Basic Basic Augmented
Initial Log-Level TFP N Y Y Y
Regional FE N N Y Y
Notes: The unit of observation is the LLM. The dependent variable is the change in the log average TFP of manufacturing firms (the reference period is: 2007-2015 in Panels A-B; 2010-2015 in Panel C; 2007-2017 in Panel D). Data on spending come from OpenCoesione; the per-capita values are calculated using always population in 2007. Controls have been selected using the “double selection” of Belloni et al (2014) among the set of covariates in Table A1; in Column 4, squared terms and pairwise interactions are included. Columns 2-4 include: the (log) average TFP in 2007; Columns 3-4 include regional fixed effects. Robust standard errors in parentheses. * p<.10 ** p<.05 *** p<.01.
20
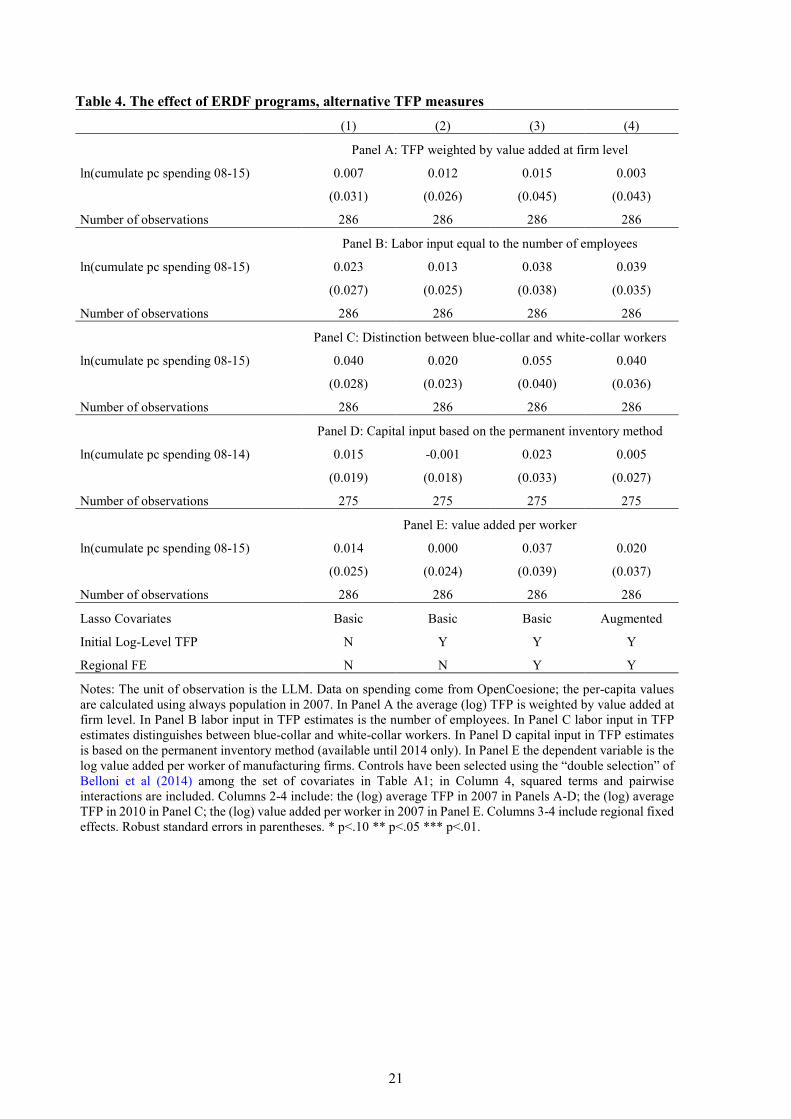
Table 4. The effect of ERDF programs, alternative TFP measures (1) (2) (3) (4)
Panel A: TFP weighted by value added at firm level
ln(cumulate pc spending 08-15) 0.007 0.012 0.015 0.003
(0.031) (0.026) (0.045) (0.043)
Number of observations 286 286 286 286
Panel B: Labor input equal to the number of employees
ln(cumulate pc spending 08-15) 0.023 0.013 0.038 0.039
(0.027) (0.025) (0.038) (0.035)
Number of observations 286 286 286 286
Panel C: Distinction between blue-collar and white-collar workers
ln(cumulate pc spending 08-15) 0.040 0.020 0.055 0.040
(0.028) (0.023) (0.040) (0.036)
Number of observations 286 286 286 286
Panel D: Capital input based on the permanent inventory method
ln(cumulate pc spending 08-14) 0.015 -0.001 0.023 0.005
(0.019) (0.018) (0.033) (0.027)
Number of observations 275 275 275 275
Panel E: value added per worker
ln(cumulate pc spending 08-15) 0.014 0.000 0.037 0.020
(0.025) (0.024) (0.039) (0.037)
Number of observations 286 286 286 286
Lasso Covariates Basic Basic Basic Augmented
Initial Log-Level TFP N Y Y Y
Regional FE N N Y Y
Notes: The unit of observation is the LLM. Data on spending come from OpenCoesione; the per-capita values are calculated using always population in 2007. In Panel A the average (log) TFP is weighted by value added at firm level. In Panel B labor input in TFP estimates is the number of employees. In Panel C labor input in TFP estimates distinguishes between blue-collar and white-collar workers. In Panel D capital input in TFP estimates is based on the permanent inventory method (available until 2014 only). In Panel E the dependent variable is the log value added per worker of manufacturing firms. Controls have been selected using the “double selection” of Belloni et al (2014) among the set of covariates in Table A1; in Column 4, squared terms and pairwise interactions are included. Columns 2-4 include: the (log) average TFP in 2007 in Panels A-D; the (log) average TFP in 2010 in Panel C; the (log) value added per worker in 2007 in Panel E. Columns 3-4 include regional fixed effects. Robust standard errors in parentheses. * p<.10 ** p<.05 *** p<.01.
21
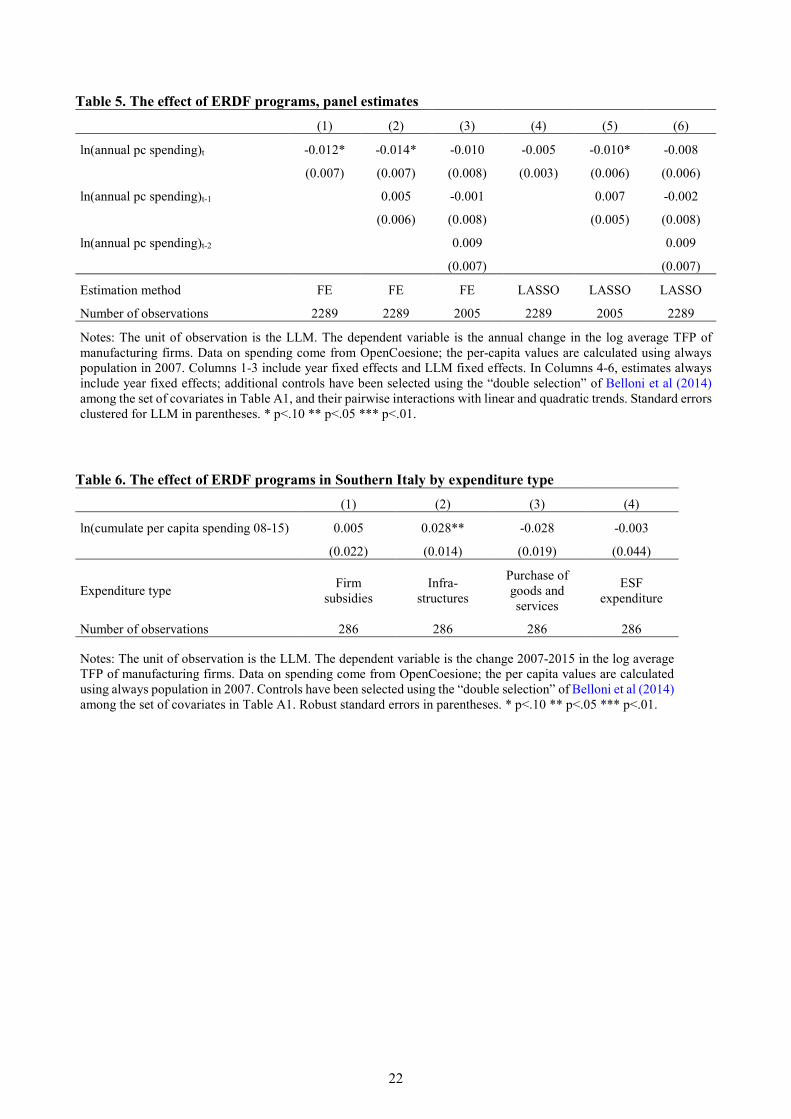
Table 5. The effect of ERDF programs, panel estimates (1) (2) (3) (4) (5) (6)
ln(annual pc spending)t -0.012* -0.014* -0.010 -0.005 -0.010* -0.008
(0.007) (0.007) (0.008) (0.003) (0.006) (0.006)
ln(annual pc spending)t-1 0.005 -0.001 0.007 -0.002
(0.006) (0.008) (0.005) (0.008)
ln(annual pc spending)t-2 0.009 0.009
(0.007) (0.007)
Estimation method FE FE FE LASSO LASSO LASSO
Number of observations 2289 2289 2005 2289 2005 2289
Notes: The unit of observation is the LLM. The dependent variable is the annual change in the log average TFP of manufacturing firms. Data on spending come from OpenCoesione; the per-capita values are calculated using always population in 2007. Columns 1-3 include year fixed effects and LLM fixed effects. In Columns 4-6, estimates always include year fixed effects; additional controls have been selected using the “double selection” of Belloni et al (2014) among the set of covariates in Table A1, and their pairwise interactions with linear and quadratic trends. Standard errors clustered for LLM in parentheses. * p<.10 ** p<.05 *** p<.01.
Table 6. The effect of ERDF programs in Southern Italy by expenditure type (1) (2) (3) (4)
ln(cumulate per capita spending 08-15) 0.005 0.028** -0.028 -0.003
(0.022) (0.014) (0.019) (0.044)
Expenditure type Firm subsidies
Infra- structures
Purchase of goods and services
ESF expenditure
Number of observations 286 286 286 286
Notes: The unit of observation is the LLM. The dependent variable is the change 2007-2015 in the log average TFP of manufacturing firms. Data on spending come from OpenCoesione; the per capita values are calculated using always population in 2007. Controls have been selected using the “double selection” of Belloni et al (2014) among the set of covariates in Table A1. Robust standard errors in parentheses. * p<.10 ** p<.05 *** p<.01.
22

Table 7. The effect of ERDF programs, quantile regressions (1) (2) (3) (4)
Q10 0.042* 0.042* 0.039*** 0.051**
(0.023) (0.022) (0.015) (0.025)
Q25 0.049*** 0.044** 0.029** 0.049**
(0.014) (0.017) (0.012) (0.022)
Q50 0.024 0.011 0.023** -0.001
(0.019) (0.020) (0.012) (0.017)
Q75 0.039 -0.003 0.039** -0.025
(0.026) (0.019) (0.016) (0.023)
Q90 -0.011 -0.042 0.066* -0.093*
(0.080) (0.050) (0.037) (0.055)
Expenditure type All Firm subsidies
Infra- structures
Purchase of goods and services
Number of observations 286 286 286 286
Notes: Quantile regressions. The unit of observation is the LLM. The dependent variable is the change 2007-2015 in the log average TFP of manufacturing firms. Data on spending come from OpenCoesione; the per-capita values are calculated using always population in 2007. Controls are those selected using the “double selection” of Belloni et al (2014) among the set of covariates in Table A1. Bootstrapped standard errors in parentheses. * p<.10 ** p<.05 *** p<.01.
Table 8. The effect of ERDF programs, heterogeneous effects (1) (2) (3) (4)
ln(cumulate pc spending 08-15) -0.002 0.010 0.012 0.022
(0.026) (0.028) (0.030) (0.023)
ln(cumulate pc spending 08-15) X Quality of Institutions
0.040**
(0.019)
ln(cumulate pc spending 08-15) X Share of manufacturing
0.000
(0.000)
ln(cumulate pc spending 08-15) X Industrial district
0.032
(0.036)
ln(cumulate pc spending 08-15) X Urbanization (pop density)
0.009**
(0.005)
Number of observations 286 286 286 286
Notes: The unit of observation is the LLM. The dependent variable is the change 2007-2015 in the log average TFP of manufacturing firms. Data on spending come from OpenCoesione; the per-capita values are calculated using always population in 2007. Controls have been selected using the “double selection” of Belloni et al (2014) among the set of covariates in Table A1. Robust standard errors in parentheses. * p<.10 ** p<.05 *** p<.01.
23

Table 9. The effect of ERDF programs, heterogeneous effects by expenditure type (1) (2) (3) (4) (5) (6)
ln(cumulate pc spending 08-15) -0.006 -0.001 -0.039* 0.014 0.023 -0.016
(0.020) (0.019) (0.021) (0.021) (0.014) (0.019)
ln(cumulate pc spending 08-15) X Quality of Institutions
0.047* 0.055** 0.036
(0.024) (0.024) (0.024)
ln(cumulate pc spending 08-15) X Urbanization (pop density)
0.012** 0.010* 0.094*
(0.005) (0.005) (0.062)
Expenditure type Firm subsidies
Infra- structures
Purchase of goods
and services
Firm subsidies
Infra- structures
Purchase of goods
and services
Number of observations 286 286 286 286 286 286
Notes: The unit of observation is the LLM. The dependent variable is the change 2007-2015 in the log average TFP of manufacturing firms. Data on spending come from OpenCoesione; the per-capita values are calculated using always population in 2007. Controls have been selected using the “double selection” of Belloni et al (2014) among the set of covariates in Table A1. Robust standard errors in parentheses. * p<.10 ** p<.05 *** p<.01.
24

Appendix I - Building TFP at LLM level
TFP at the LLM level (Φi) is obtained aggregating firm-level TFP, borrowed from the work of Ciani
et al. (2019). They consider a Cobb-Douglas production function, which expresses the maximum
quantity of a good produced by firm 𝑖𝑖 at time 𝑡𝑡 as a multiplicative function of productive inputs:
VAit = ωitKitβKLit
βLeϵit (A1),
where production is approximated by value added (VA) and capital (K) and labor (L) inputs
are approximated by tangible assets and labor costs respectively (Ciani et al., 2019, consider the use
of alternative proxies. For a detailed discussion about the choice and the treatment of the variables
used for the estimation, please refer to Ciani et al., 2019. Here we adhere to their favorite
specification). All data are taken from the archives of Cerved Group and deflated with the sector-
specific deflator of the value added. Parameters 𝛽𝛽𝐾𝐾,𝛽𝛽𝐿𝐿 are estimated from a log-specification of the
production function:
ln(VAit) = βK ln(Kit) + βL ln(Lit) + ln (ωit) + ϵit (A2)
following the methodology proposed by Levinsohn and Petrin (2003), which allows to
account for the simultaneity between productivity shocks and the choice of the amount of labor input.
TFP is computed as the exponent of the residual:
ωıt� = eln(VAit)−βK� ln(Kit)−βL� ln(Lit) (A3).
25
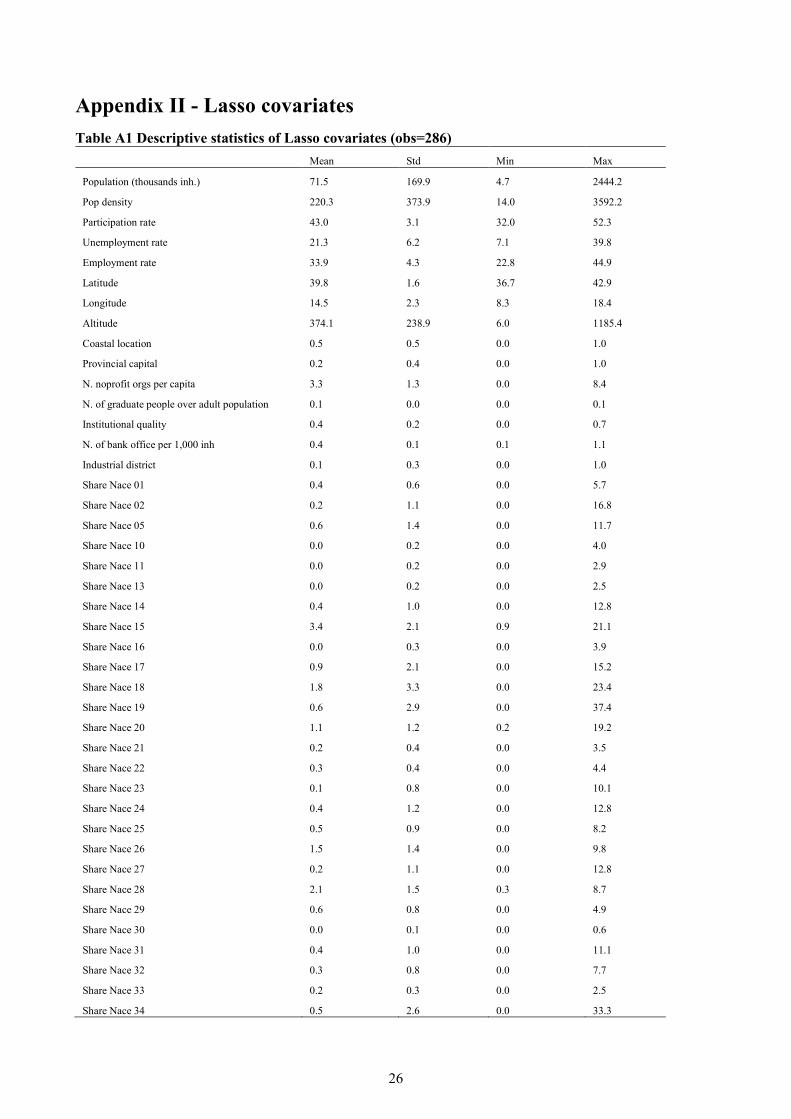
Appendix II - Lasso covariates Table A1 Descriptive statistics of Lasso covariates (obs=286)
Mean Std Min Max
Population (thousands inh.) 71.5 169.9 4.7 2444.2
Pop density 220.3 373.9 14.0 3592.2
Participation rate 43.0 3.1 32.0 52.3
Unemployment rate 21.3 6.2 7.1 39.8
Employment rate 33.9 4.3 22.8 44.9
Latitude 39.8 1.6 36.7 42.9
Longitude 14.5 2.3 8.3 18.4
Altitude 374.1 238.9 6.0 1185.4
Coastal location 0.5 0.5 0.0 1.0
Provincial capital 0.2 0.4 0.0 1.0
N. noprofit orgs per capita 3.3 1.3 0.0 8.4
N. of graduate people over adult population 0.1 0.0 0.0 0.1
Institutional quality 0.4 0.2 0.0 0.7
N. of bank office per 1,000 inh 0.4 0.1 0.1 1.1
Industrial district 0.1 0.3 0.0 1.0
Share Nace 01 0.4 0.6 0.0 5.7
Share Nace 02 0.2 1.1 0.0 16.8
Share Nace 05 0.6 1.4 0.0 11.7
Share Nace 10 0.0 0.2 0.0 4.0
Share Nace 11 0.0 0.2 0.0 2.9
Share Nace 13 0.0 0.2 0.0 2.5
Share Nace 14 0.4 1.0 0.0 12.8
Share Nace 15 3.4 2.1 0.9 21.1
Share Nace 16 0.0 0.3 0.0 3.9
Share Nace 17 0.9 2.1 0.0 15.2
Share Nace 18 1.8 3.3 0.0 23.4
Share Nace 19 0.6 2.9 0.0 37.4
Share Nace 20 1.1 1.2 0.2 19.2
Share Nace 21 0.2 0.4 0.0 3.5
Share Nace 22 0.3 0.4 0.0 4.4
Share Nace 23 0.1 0.8 0.0 10.1
Share Nace 24 0.4 1.2 0.0 12.8
Share Nace 25 0.5 0.9 0.0 8.2
Share Nace 26 1.5 1.4 0.0 9.8
Share Nace 27 0.2 1.1 0.0 12.8
Share Nace 28 2.1 1.5 0.3 8.7
Share Nace 29 0.6 0.8 0.0 4.9
Share Nace 30 0.0 0.1 0.0 0.6
Share Nace 31 0.4 1.0 0.0 11.1
Share Nace 32 0.3 0.8 0.0 7.7
Share Nace 33 0.2 0.3 0.0 2.5
Share Nace 34 0.5 2.6 0.0 33.3
26

Table A1 (Continue) Mean Std Min Max
Share Nace 35 0.2 0.7 0.0 8.0
Share Nace 36 0.7 1.3 0.0 11.6
Share Nace 37 0.0 0.1 0.0 0.5
Share Nace 40 0.6 1.2 0.0 17.7
Share Nace 41 0.2 0.9 0.0 12.3
Share Nace 45 10.5 3.7 3.6 26.8
Share Nace 50 3.0 0.9 0.7 8.2
Share Nace 51 3.3 1.9 0.5 14.8
Share Nace 52 12.3 2.5 5.5 21.1
Share Nace 55 5.4 5.0 1.5 37.8
Share Nace 60 2.5 1.4 0.5 12.8
Share Nace 61 0.0 0.2 0.0 2.3
Share Nace 62 0.0 0.3 0.0 4.8
Share Nace 63 0.9 1.3 0.0 12.6
Share Nace 64 1.3 0.5 0.5 4.0
Share Nace 65 1.2 0.4 0.4 2.6
Share Nace 66 0.0 0.0 0.0 0.5
Share Nace 67 0.5 0.2 0.0 1.1
Share Nace 70 0.3 0.4 0.0 3.4
Share Nace 71 0.1 0.2 0.0 1.7
Share Nace 72 0.6 0.4 0.0 3.3
Share Nace 73 0.2 0.6 0.0 9.4
Share Nace 74 5.6 2.1 1.7 20.9
Share Nace 75 6.7 3.0 1.2 21.1
Share Nace 80 15.1 5.0 5.1 38.6
Share Nace 85 8.1 4.4 1.0 32.5
Share Nace 90 0.6 0.6 0.0 4.1
Share Nace 91 0.4 0.4 0.0 2.8
Share Nace 92 0.9 0.7 0.0 7.0
Share Size 1-2 25.4 14.8 3.0 79.7
Share Size 3-5 16.4 7.8 2.6 43.1
Share Size 6-9 11.6 5.1 0.0 28.2
Share Size 10-19 14.3 6.9 0.0 47.7
Share Size 20-49 13.7 9.3 0.0 44.3
Share Size 50-99 6.5 7.7 0.0 42.3
Share Size 100-199 4.2 7.0 0.0 41.4
Share Size 200-499 4.6 10.2 0.0 65.0
Share Size 500-999 1.5 6.0 0.0 58.9
Share Size 1000+ 1.9 7.8 0.0 56.5
27

References
Accetturo, A. and G. de Blasio (2012). “Policies for Local Development: an evaluation of Italy’s
Patti Territoriali”. Regional Science and Urban Economics, 42(1–2): 15–26.
Accetturo, A. and G. de Blasio (2019). “Morire di aiuti. I fallimenti delle politiche per il Sud (e
come evitarli)”. IBL Libri.
Andini, M. and G. de Blasio (2014). “Local development that money can’t buy: Italy’s Contratti
di Programma”. Journal of Economic Geography, 16(2): 365-393.
Bachtrögler, J. and C. Hammer (2018). “Who are the beneficiaries of the structural funds and the
cohesion fund and how does the cohesion policy impact firm-level performance?”. OECD Economic
Department Working Papers no. 1499
Becker, S. O., P. H. Egger and M. Von Ehrlich (2010). “Going NUTS: the effects of EU
Structural Funds on regional performance”. Journal of Public Economics, 94(9-10): 578-590.
Becker, S. O., P. H. Egger and M. Von Ehrlich (2013). “Absorptive capacity and the growth and
investment effects of regional transfers: A regression discontinuity design with heterogeneous treatment
effects”. American Economic Journal: Economic Policy, 5(4): 29-77.
Belloni. A., V. Chernozhukov and C. Hansen (2014). “High-dimensional methods and inference
on structural and treatment effects”. Journal of Economic Perspective, 28(2): 29–50.
Benkovskis, K., P. Tkacevs, and N. Yashiro (2018). “Do EU Funds boost productivity and
employment?”. OECD Economics Department Working Papers No 1525.
Bernini, C. and G. Pellegrini (2011). “How are growth and productivity in private firms affected
by public subsidy? Evidence from a regional policy”. Regional Science and Urban Economics, 41(3),
253-265.
Brachert, M., E. Dettmann and M. Tize (2019). “The regional effects of a place-based policy –
Causal evidence from Germany”. Regional Science and Urban Economics, forthcoming.
Briant, A., M. Lafourcade and B. Schmutz (2015). “Can tax breaks beat geography? Lessons
from the French Enterprise Zones Experience”. American Economic Journal: Economic Policy, 7(2):
88-124.
Bronzini, R., G. de Blasio (2006). “Evaluating the impact of investment incentives: the case
of Italy’s law 488/1992”. Journal of Urban Economics, 60: 327–349.
Busso, M., J. Gregory and P. Kline (2013). “Assessing the incidence and the efficiency of
a prominent place based policy”. American Economic Review, vol. 103(2), pp. 897-947.
28
Caselli, F. (2005). “Accounting for cross‐country income differences” in P. Aghion and S.N.
Durlauf (eds.) Handbook of Economic Growth, Volume 1A, 679‐741.
Charron, N., L. Dijkstra and V. Lapuente (2014). “Regional governance matters: quality of
government within European Union member states”. Regional Studies, vol. 48(1), pp. 68-90.
Ciani, E. and G. De Blasio (2015). “European structural funds during the crisis: evidence from
Southern Italy”. IZA Journal of Labor Policy, 4(1), 20.
Ciani, E., A. Locatelli, and M. Pagnini (2019) “TFP differentials across Italian macro-regions:
an analysis of manufacturing corporations between 1995 and 2015”. Journal of Economic Policy,
forthcoming.
Criscuolo, C., R. Martin, H. G. Overman and J. Van Reenen (2019). “Some causal effects of an
industrial policy”. American Economic Review, 109(1), 48-85.
Di Giacinto, V., M. Gomellini, G. Micucci and M. Pagnini (2014). “Mapping local productivity
advantages in Italy: industrial districts, cities or both?”. Journal of Economic Geography, 14(2): 365-
394.
Fox, J. T. and V. Smeets (2011). “Does input quality drive measured differences in firm
productivity?”. International Economic Review, 52 (4): 961–989.
Freedman, M. (2013). “Targeted business incentives and local labor markets”. Journal of Human
Resources, 48(2): 311-344.
Giua, M. (2017). “Spatial discontinuity for the impact assessment of the EU regional policy: The
case of Italian objective 1 regions”. Journal of Regional Science, 57(1): 109-131.
Hornbeck, R. and E. Moretti (2019). “Who Benefits From Productivity Growth? Direct and
Indirect Effects of Local TFP Growth on Wages, Rents, and Inequality”. National Bureau of Economic
Research working paper no. 24661.
Hsieh, C. T. and P. J. Klenow (2010). “Development accounting”. American Economic Journal:
Macroeconomics, 2(1): 207-223.
Irarrazabal, A., A. Moxnes and K. H. Ulltveit-Moe (2013). "Heterogeneous firms or
heterogeneous workers? implications for exporter premiums and the gains from trade", Review of
Economics and Statistics, 95(3): 839-849.
Kline, P. and E. Moretti (2014). “Local economic development, agglomeration economies and
the big push: 100 years of evidence from the Tennessee Valley Authority”. Quarterly Journal of
Economics, 129(1): 275-331.
29

Kolko, J. and D. Neumark (2010). “Do Enterprise Zones create jobs? Evidence from California’s
Enterprise Zone program”. Journal of Urban Economics, 68(1): 1-19.
Levinsohn, J. and A. Petrin (2003). “Estimating Production Functions Using Inputs To Control
For Unobservables”. Review of Economic Studies, 70(2): 317-341.
Lenzu, S. and F. Manaresi (2017). “Rigid factor prices and output losses: evidence from Italian
firms”. Bank of Italy, mimeo.
Neumark, D. and H. Simpson (2015). “Place-Based Policies” in Duranton G., J. V. Henderson
and W. Strange (eds.), “Handbook of Regional and Urban Economics”, Vol. 5: 1197-1287
Nifo, A. and G. Vecchione (2014). “Do institutions play a role in skilled migration? The case of
Italy”. Regional Studies, 48(10): 1628-1649.
Reynolds, C. L. and S. M. Rohlin (2015). “The effects of location based tax policies on the
distribution of household income: evidence from the federal Empowerment Zone program”. Journal of
Urban Economics, 88: 1-15.
Rodríguez-Pose, A., and E. Garcilazo (2015). “Quality of government and the returns of
investment: Examining the impact of cohesion expenditure in European regions”. Regional Studies,
49(8): 1274-1290.
von Ehrlich, M. and T. Seidel (2018), “The persistent effects of place-based policy: evidence
from the West-German Zonenrandgebiet”. American Economic Journal: Economic Policy, 10(4): 344-
374.
30

(*) Requests for copies should be sent to: Banca d’Italia – Servizio Studi di struttura economica e finanziaria – Divisione Biblioteca e Archivio storico – Via Nazionale, 91 – 00184 Rome – (fax 0039 06 47922059). They are available on the Internet www.bancaditalia.it.
RECENTLY PUBLISHED “TEMI” (*)
N. 1243 – Cross-country differences in the size of venture capital financing rounds. A machine learning approach, by Marco Taboga (November 2019).
N. 1244 – Shifting taxes from labour to consumption: the efficiency-equity trade-off, by Nicola Curci and Marco Savegnago (November 2019).
N. 1245 – Credit supply, uncertainty and trust: the role of social capital, by Maddalena Galardo, Maurizio Lozzi and Paolo Emilio Mistrulli (November 2019).
N. 1246 – Financial development and growth in European regions, by Paola Rossi and Diego Scalise (November 2019).
N. 1247 – IMF programs and stigma in Emerging Market Economies, by Claudia Maurini (November 2019).
N. 1248 – Loss aversion in housing assessment among Italian homeowners, by Andrea Lamorgese and Dario Pellegrino (November 2019).
N. 1249 – Long-term unemployment and subsidies for permanent employment, by Emanuele Ciani, Adele Grompone and Elisabetta Olivieri (November 2019).
N. 1250 – Debt maturity and firm performance: evidence from a quasi-natural experiment, by Antonio Accetturo, Giulia Canzian, Michele Cascarano and Maria Lucia Stefani (November 2019).
N. 1251 – Non-standard monetary policy measures in the new normal, by Anna Bartocci, Alessandro Notarpietro and Massimiliano Pisani (November 2019).
N. 1232 – Risky bank guarantees, by Taneli Mäkinen, Lucio Sarno and Gabriele Zinna (July 2019).
N. 1233 – News and consumer card payments, by Guerino Ardizzi, Simone Emiliozzi, Juri Marcucci and Libero Monteforte (October 2019).
N. 1234 – Forecasting with instabilities: an application to DSGE models with Financial Frictions, by Roberta Cardani, Alessia Paccagnini and Stefania Villa (October 2019).
N. 1235 – The real effects of ‘ndrangheta: firm-level evidence, by Litterio Mirenda, Sauro Mocetti and Lucia Rizzica (October 2019).
N. 1236 – Forward-looking effective tax rates in the banking sector, by Ernesto Zangari and Elena Pisano (October 2019).
N. 1237 – A profit elasticity approach to measure banking competition in Italian credit markets, by Michele Benvenuti and Silvia Del Prete (October 2019).
N. 1238 – What do almost 20 years of micro data and two crises say about the relationship between central bank and interbank market liquidity? Evidence from Italy, by Massimiliano Affinito (October 2019).
N. 1239 – Bank credit, liquidity and firm-level investment: are recessions different?, by Ines Buono and Sara Formai (October 2019).
N. 1240 – Youth drain, entrepreneurship and innovation, by Massimo Anelli, Gaetano Basso, Giuseppe Ippedico and Giovanni Peri (October 2019).
N. 1241 – Fiscal devaluation and labour market frictions in a monetary union, by Lorenzo Burlon, Alessandro Notarpietro and Massimiliano Pisani (October 2019).
N. 1242 – Financial conditions and growth at risk in Italy, by Piergiorgio Alessandri, Leonardo Del Vecchio and Arianna Miglietta (October 2019).

"TEMI" LATER PUBLISHED ELSEWHERE
2017
AABERGE, R., F. BOURGUIGNON, A. BRANDOLINI, F. FERREIRA, J. GORNICK, J. HILLS, M. JÄNTTI, S. JENKINS, J. MICKLEWRIGHT, E. MARLIER, B. NOLAN, T. PIKETTY, W. RADERMACHER, T. SMEEDING, N. STERN, J. STIGLITZ, H. SUTHERLAND, Tony Atkinson and his legacy, Review of Income and Wealth, v. 63, 3, pp. 411-444, WP 1138 (September 2017).
ACCETTURO A., M. BUGAMELLI and A. LAMORGESE, Law enforcement and political participation: Italy 1861-65, Journal of Economic Behavior & Organization, v. 140, pp. 224-245, WP 1124 (July 2017).
ADAMOPOULOU A. and G.M. TANZI, Academic dropout and the great recession, Journal of Human Capital, V. 11, 1, pp. 35–71, WP 970 (October 2014).
ALBERTAZZI U., M. BOTTERO and G. SENE, Information externalities in the credit market and the spell of credit rationing, Journal of Financial Intermediation, v. 30, pp. 61–70, WP 980 (November 2014).
ALESSANDRI P. and H. MUMTAZ, Financial indicators and density forecasts for US output and inflation, Review of Economic Dynamics, v. 24, pp. 66-78, WP 977 (November 2014).
BARBIERI G., C. ROSSETTI and P. SESTITO, Teacher motivation and student learning, Politica economica/Journal of Economic Policy, v. 33, 1, pp.59-72, WP 761 (June 2010).
BENTIVOGLI C. and M. LITTERIO, Foreign ownership and performance: evidence from a panel of Italian firms, International Journal of the Economics of Business, v. 24, 3, pp. 251-273, WP 1085 (October 2016).
BRONZINI R. and A. D’IGNAZIO, Bank internationalisation and firm exports: evidence from matched firm-bank data, Review of International Economics, v. 25, 3, pp. 476-499 WP 1055 (March 2016).
BRUCHE M. and A. SEGURA, Debt maturity and the liquidity of secondary debt markets, Journal of Financial Economics, v. 124, 3, pp. 599-613, WP 1049 (January 2016).
BURLON L., Public expenditure distribution, voting, and growth, Journal of Public Economic Theory,, v. 19, 4, pp. 789–810, WP 961 (April 2014).
BURLON L., A. GERALI, A. NOTARPIETRO and M. PISANI, Macroeconomic effectiveness of non-standard monetary policy and early exit. a model-based evaluation, International Finance, v. 20, 2, pp.155-173, WP 1074 (July 2016).
BUSETTI F., Quantile aggregation of density forecasts, Oxford Bulletin of Economics and Statistics, v. 79, 4, pp. 495-512, WP 979 (November 2014).
CESARONI T. and S. IEZZI, The predictive content of business survey indicators: evidence from SIGE, Journal of Business Cycle Research, v.13, 1, pp 75–104, WP 1031 (October 2015).
CONTI P., D. MARELLA and A. NERI, Statistical matching and uncertainty analysis in combining household income and expenditure data, Statistical Methods & Applications, v. 26, 3, pp 485–505, WP 1018 (July 2015).
D’AMURI F., Monitoring and disincentives in containing paid sick leave, Labour Economics, v. 49, pp. 74-83, WP 787 (January 2011).
D’AMURI F. and J. MARCUCCI, The predictive power of google searches in forecasting unemployment, International Journal of Forecasting, v. 33, 4, pp. 801-816, WP 891 (November 2012).
DE BLASIO G. and S. POY, The impact of local minimum wages on employment: evidence from Italy in the 1950s, Journal of Regional Science, v. 57, 1, pp. 48-74, WP 953 (March 2014).
DEL GIOVANE P., A. NOBILI and F. M. SIGNORETTI, Assessing the sources of credit supply tightening: was the sovereign debt crisis different from Lehman?, International Journal of Central Banking, v. 13, 2, pp. 197-234, WP 942 (November 2013).
DEL PRETE S., M. PAGNINI, P. ROSSI and V. VACCA, Lending organization and credit supply during the 2008–2009 crisis, Economic Notes, v. 46, 2, pp. 207–236, WP 1108 (April 2017).
DELLE MONACHE D. and I. PETRELLA, Adaptive models and heavy tails with an application to inflation forecasting, International Journal of Forecasting, v. 33, 2, pp. 482-501, WP 1052 (March 2016).
FEDERICO S. and E. TOSTI, Exporters and importers of services: firm-level evidence on Italy, The World Economy, v. 40, 10, pp. 2078-2096, WP 877 (September 2012).
GIACOMELLI S. and C. MENON, Does weak contract enforcement affect firm size? Evidence from the neighbour's court, Journal of Economic Geography, v. 17, 6, pp. 1251-1282, WP 898 (January 2013).
LOBERTO M. and C. PERRICONE, Does trend inflation make a difference?, Economic Modelling, v. 61, pp. 351–375, WP 1033 (October 2015).

"TEMI" LATER PUBLISHED ELSEWHERE
MANCINI A.L., C. MONFARDINI and S. PASQUA, Is a good example the best sermon? Children’s imitation of parental reading, Review of Economics of the Household, v. 15, 3, pp 965–993, WP No. 958 (April 2014).
MEEKS R., B. NELSON and P. ALESSANDRI, Shadow banks and macroeconomic instability, Journal of Money, Credit and Banking, v. 49, 7, pp. 1483–1516, WP 939 (November 2013).
MICUCCI G. and P. ROSSI, Debt restructuring and the role of banks’ organizational structure and lending technologies, Journal of Financial Services Research, v. 51, 3, pp 339–361, WP 763 (June 2010).
MOCETTI S., M. PAGNINI and E. SETTE, Information technology and banking organization, Journal of Journal of Financial Services Research, v. 51, pp. 313-338, WP 752 (March 2010).
MOCETTI S. and E. VIVIANO, Looking behind mortgage delinquencies, Journal of Banking & Finance, v. 75, pp. 53-63, WP 999 (January 2015).
NOBILI A. and F. ZOLLINO, A structural model for the housing and credit market in Italy, Journal of Housing Economics, v. 36, pp. 73-87, WP 887 (October 2012).
PALAZZO F., Search costs and the severity of adverse selection, Research in Economics, v. 71, 1, pp. 171-197, WP 1073 (July 2016).
PATACCHINI E. and E. RAINONE, Social ties and the demand for financial services, Journal of Financial Services Research, v. 52, 1–2, pp 35–88, WP 1115 (June 2017).
PATACCHINI E., E. RAINONE and Y. ZENOU, Heterogeneous peer effects in education, Journal of Economic Behavior & Organization, v. 134, pp. 190–227, WP 1048 (January 2016).
SBRANA G., A. SILVESTRINI and F. VENDITTI, Short-term inflation forecasting: the M.E.T.A. approach, International Journal of Forecasting, v. 33, 4, pp. 1065-1081, WP 1016 (June 2015).
SEGURA A. and J. SUAREZ, How excessive is banks' maturity transformation?, Review of Financial Studies, v. 30, 10, pp. 3538–3580, WP 1065 (April 2016).
VACCA V., An unexpected crisis? Looking at pricing effectiveness of heterogeneous banks, Economic Notes, v. 46, 2, pp. 171–206, WP 814 (July 2011).
VERGARA CAFFARELI F., One-way flow networks with decreasing returns to linking, Dynamic Games and Applications, v. 7, 2, pp. 323-345, WP 734 (November 2009).
ZAGHINI A., A Tale of fragmentation: corporate funding in the euro-area bond market, International Review of Financial Analysis, v. 49, pp. 59-68, WP 1104 (February 2017).
2018
ACCETTURO A., V. DI GIACINTO, G. MICUCCI and M. PAGNINI, Geography, productivity and trade: does selection explain why some locations are more productive than others?, Journal of Regional Science, v. 58, 5, pp. 949-979, WP 910 (April 2013).
ADAMOPOULOU A. and E. KAYA, Young adults living with their parents and the influence of peers, Oxford Bulletin of Economics and Statistics,v. 80, pp. 689-713, WP 1038 (November 2015).
ANDINI M., E. CIANI, G. DE BLASIO, A. D’IGNAZIO and V. SILVESTRINI, Targeting with machine learning: an application to a tax rebate program in Italy, Journal of Economic Behavior & Organization, v. 156, pp. 86-102, WP 1158 (December 2017).
BARONE G., G. DE BLASIO and S. MOCETTI, The real effects of credit crunch in the great recession: evidence from Italian provinces, Regional Science and Urban Economics, v. 70, pp. 352-59, WP 1057 (March 2016).
BELOTTI F. and G. ILARDI Consistent inference in fixed-effects stochastic frontier models, Journal of Econometrics, v. 202, 2, pp. 161-177, WP 1147 (October 2017).
BERTON F., S. MOCETTI, A. PRESBITERO and M. RICHIARDI, Banks, firms, and jobs, Review of Financial Studies, v.31, 6, pp. 2113-2156, WP 1097 (February 2017).
BOFONDI M., L. CARPINELLI and E. SETTE, Credit supply during a sovereign debt crisis, Journal of the European Economic Association, v.16, 3, pp. 696-729, WP 909 (April 2013).
BOKAN N., A. GERALI, S. GOMES, P. JACQUINOT and M. PISANI, EAGLE-FLI: a macroeconomic model of banking and financial interdependence in the euro area, Economic Modelling, v. 69, C, pp. 249-280, WP 1064 (April 2016).
"TEMI" LATER PUBLISHED ELSEWHERE
BRILLI Y. and M. TONELLO, Does increasing compulsory education reduce or displace adolescent crime? New evidence from administrative and victimization data, CESifo Economic Studies, v. 64, 1, pp. 15–4, WP 1008 (April 2015).
BUONO I. and S. FORMAI The heterogeneous response of domestic sales and exports to bank credit shocks, Journal of International Economics, v. 113, pp. 55-73, WP 1066 (March 2018).
BURLON L., A. GERALI, A. NOTARPIETRO and M. PISANI, Non-standard monetary policy, asset prices and macroprudential policy in a monetary union, Journal of International Money and Finance, v. 88, pp. 25-53, WP 1089 (October 2016).
CARTA F. and M. DE PHLIPPIS, You've Come a long way, baby. Husbands' commuting time and family labour supply, Regional Science and Urban Economics, v. 69, pp. 25-37, WP 1003 (March 2015).
CARTA F. and L. RIZZICA, Early kindergarten, maternal labor supply and children's outcomes: evidence from Italy, Journal of Public Economics, v. 158, pp. 79-102, WP 1030 (October 2015).
CASIRAGHI M., E. GAIOTTI, L. RODANO and A. SECCHI, A “Reverse Robin Hood”? The distributional implications of non-standard monetary policy for Italian households, Journal of International Money and Finance, v. 85, pp. 215-235, WP 1077 (July 2016).
CECCHETTI S., F. NATOLI and L. SIGALOTTI, Tail co-movement in inflation expectations as an indicator of anchoring, International Journal of Central Banking, v. 14, 1, pp. 35-71, WP 1025 (July 2015).
CIANI E. and C. DEIANA, No Free lunch, buddy: housing transfers and informal care later in life, Review of Economics of the Household, v.16, 4, pp. 971-1001, WP 1117 (June 2017).
CIPRIANI M., A. GUARINO, G. GUAZZAROTTI, F. TAGLIATI and S. FISHER, Informational contagion in the laboratory, Review of Finance, v. 22, 3, pp. 877-904, WP 1063 (April 2016).
DE BLASIO G, S. DE MITRI, S. D’IGNAZIO, P. FINALDI RUSSO and L. STOPPANI, Public guarantees to SME borrowing. A RDD evaluation, Journal of Banking & Finance, v. 96, pp. 73-86, WP 1111 (April 2017).
GERALI A., A. LOCARNO, A. NOTARPIETRO and M. PISANI, The sovereign crisis and Italy's potential output, Journal of Policy Modeling, v. 40, 2, pp. 418-433, WP 1010 (June 2015).
LIBERATI D., An estimated DSGE model with search and matching frictions in the credit market, International Journal of Monetary Economics and Finance (IJMEF), v. 11, 6, pp. 567-617, WP 986 (November 2014).
LINARELLO A., Direct and indirect effects of trade liberalization: evidence from Chile, Journal of Development Economics, v. 134, pp. 160-175, WP 994 (December 2014).
NUCCI F. and M. RIGGI, Labor force participation, wage rigidities, and inflation, Journal of Macroeconomics, v. 55, 3 pp. 274-292, WP 1054 (March 2016).
RIGON M. and F. ZANETTI, Optimal monetary policy and fiscal policy interaction in a non_ricardian economy, International Journal of Central Banking, v. 14 3, pp. 389-436, WP 1155 (December 2017).
SEGURA A., Why did sponsor banks rescue their SIVs?, Review of Finance, v. 22, 2, pp. 661-697, WP 1100 (February 2017).
2019
ALBANESE G., M. CIOFFI and P. TOMMASINO, Legislators' behaviour and electoral rules: evidence from an Italian reform, European Journal of Political Economy, v. 59, pp. 423-444, WP 1135 (September 2017).
ARNAUDO D., G. MICUCCI, M. RIGON and P. ROSSI, Should I stay or should I go? Firms’ mobility across banks in the aftermath of the financial crisis, Italian Economic Journal / Rivista italiana degli economisti, v. 5, 1, pp. 17-37, WP 1086 (October 2016).
BASSO G., F. D’AMURI and G. PERI, Immigrants, labor market dynamics and adjustment to shocks in the euro area, IMF Economic Review, v. 67, 3, pp. 528-572, WP 1195 (November 2018).
BUSETTI F. and M. CAIVANO, Low frequency drivers of the real interest rate: empirical evidence for advanced economies, International Finance, v. 22, 2, pp. 171-185, WP 1132 (September 2017).
CAPPELLETTI G., G. GUAZZAROTTI and P. TOMMASINO, Tax deferral and mutual fund inflows: evidence from a quasi-natural experiment, Fiscal Studies, v. 40, 2, pp. 211-237, WP 938 (November 2013).

"TEMI" LATER PUBLISHED ELSEWHERE
CARDANI R., A. PACCAGNINI and S. VILLA, Forecasting with instabilities: an application to DSGE models with financial frictions, Journal of Macroeconomics, v. 61, WP 1234 (September 2019).
CIANI E., F. DAVID and G. DE BLASIO, Local responses to labor demand shocks: a re-assessment of the case of Italy, Regional Science and Urban Economics, v. 75, pp. 1-21, WP 1112 (April 2017).
CIANI E. and P. FISHER, Dif-in-dif estimators of multiplicative treatment effects, Journal of Econometric Methods, v. 8. 1, pp. 1-10, WP 985 (November 2014).
CHIADES P., L. GRECO, V. MENGOTTO, L. MORETTI and P. VALBONESI, Fiscal consolidation by intergovernmental transfers cuts? The unpleasant effect on expenditure arrears, Economic Modelling, v. 77, pp. 266-275, WP 985 (July 2016).
COLETTA M., R. DE BONIS and S. PIERMATTEI, Household debt in OECD countries: the role of supply-side and demand-side factors, Social Indicators Research, v. 143, 3, pp. 1185–1217, WP 989 (November 2014).
COVA P., P. PAGANO and M. PISANI, Domestic and international effects of the Eurosystem Expanded Asset Purchase Programme, IMF Economic Review, v. 67, 2, pp. 315-348, WP 1036 (October 2015).
GIORDANO C., M. MARINUCCI and A. SILVESTRINI, The macro determinants of firms' and households' investment: evidence from Italy, Economic Modelling, v. 78, pp. 118-133, WP 1167 (March 2018).
GOMELLINI M., D. PELLEGRINO and F. GIFFONI, Human capital and urban growth in Italy,1981-2001, Review of Urban & Regional Development Studies, v. 31, 2, pp. 77-101, WP 1127 (July 2017).
MAGRI S, Are lenders using risk-based pricing in the Italian consumer loan market? The effect of the 2008 crisis, Journal of Credit Risk, v. 15, 1, pp. 27-65, WP 1164 (January 2018).
MIGLIETTA A, C. PICILLO and M. PIETRUNTI, The impact of margin policies on the Italian repo market, The North American Journal of Economics and Finance, v. 50, WP 1028 (October 2015).
MONTEFORTE L. and V. RAPONI, Short-term forecasts of economic activity: are fortnightly factors useful?, Journal of Forecasting, v. 38, 3, pp. 207-221, WP 1177 (June 2018).
MERCATANTI A., T. MAKINEN and A. SILVESTRINI, The role of financial factors for european corporate investment, Journal of International Money and Finance, v. 96, pp. 246-258, WP 1148 (October 2017).
NERI S. and A. NOTARPIETRO, Collateral constraints, the zero lower bound, and the debt–deflation mechanism, Economics Letters, v. 174, pp. 144-148, WP 1040 (November 2015).
RIGGI M., Capital destruction, jobless recoveries, and the discipline device role of unemployment, Macroeconomic Dynamics, v. 23, 2, pp. 590-624, WP 871 (July 2012).
FORTHCOMING
ALBANESE G., G. DE BLASIO and P. SESTITO, Trust, risk and time preferences: evidence from survey data, International Review of Economics, WP 911 (April 2013).
APRIGLIANO V., G. ARDIZZI and L. MONTEFORTE, Using the payment system data to forecast the economic activity, International Journal of Central Banking, WP 1098 (February 2017).
ARDUINI T., E. PATACCHINI and E. RAINONE, Treatment effects with heterogeneous externalities, Journal of Business & Economic Statistics, WP 974 (October 2014).
BRONZINI R., G. CARAMELLINO and S. MAGRI, Venture capitalists at work: a Diff-in-Diff approach at late-stages of the screening process, Journal of Business Venturing, WP 1131 (September 2017).
BELOTTI F. and G. ILARDI, Consistent inference in fixed-effects stochastic frontier models, Journal of Econometrics, WP 1147 (October 2017).
CIANI E. and G. DE BLASIO, European structural funds during the crisis: evidence from Southern Italy, IZA Journal of Labor Policy, WP 1029 (October 2015).
COIBION O., Y. GORODNICHENKO and T. ROPELE, Inflation expectations and firms' decisions: new causal evidence, Quarterly Journal of Economics, WP 1219 (April 2019).
CORSELLO F. and V. NISPI LANDI, Labor market and financial shocks: a time-varying analysis, Journal of Money, Credit and Banking, WP 1179 (June 2018).
COVA P., P. PAGANO, A. NOTARPIETRO and M. PISANI, Secular stagnation, R&D, public investment and monetary policy: a global-model perspective, Macroeconomic Dynamics, WP 1156 (December 2017).

"TEMI" LATER PUBLISHED ELSEWHERE
D’AMURI F., Monitoring and disincentives in containing paid sick leave, Labour Economics, WP 787 (January 2011).
D’IGNAZIO A. and C. MENON, The causal effect of credit Guarantees for SMEs: evidence from Italy, Scandinavian Journal of Economics, WP 900 (February 2013).
ERCOLANI V. and J. VALLE E AZEVEDO, How can the government spending multiplier be small at the zero lower bound?, Macroeconomic Dynamics, WP 1174 (April 2018).
FEDERICO S. and E. TOSTI, Exporters and importers of services: firm-level evidence on Italy, The World Economy, WP 877 (September 2012).
FERRERO G., M. GROSS and S. NERI, On secular stagnation and low interest rates: demography matters, International Finance, WP 1137 (September 2017).
GERALI A. and S. NERI, Natural rates across the Atlantic, Journal of Macroeconomics, WP 1140 (September 2017).
GIACOMELLI S. and C. MENON, Does weak contract enforcement affect firm size? Evidence from the neighbour's court, Journal of Economic Geography, WP 898 (January 2013).
LIBERATI D. and M. LOBERTO, Taxation and housing markets with search frictions, Journal of Housing Economics, WP 1105 (March 2017).
LOSCHIAVO D., Household debt and income inequality: evidence from italian survey data, Review of Income and Wealth, WP 1095 (January 2017).
NATOLI F. and L. SIGALOTTI, Tail co-movement in inflation expectations as an indicator of anchoring, International Journal of Central Banking, WP 1025 (July 2015).
PANCRAZI R. and M. PIETRUNTI, Natural expectations and home equity extraction, Journal of Housing Economics, WP 984 (November 2014).
PEREDA FERNANDEZ S., Teachers and cheaters. Just an anagram?, Journal of Human Capital, WP 1047 (January 2016).
RAINONE E., The network nature of otc interest rates, Journal of Financial Markets, WP 1022 (July 2015). RIZZICA L., Raising aspirations and higher education. evidence from the UK's widening participation
policy, Journal of Labor Economics, WP 1188 (September 2018). SEGURA A., Why did sponsor banks rescue their SIVs?, Review of Finance, WP 1100 (February 2017).


