Page 1
Running Title:
Placental structure in type 1 diabetes:
relation to fetal insulin, leptin and IGF-I
Scott M Nelson1, Philip M Coan
2, Graham J Burton
2 and Robert S Lindsay
3
1. Reproductive and Maternal Medicine, University of Glasgow, 10 Alexandra Parade,
Glasgow G31 2ER
2. Department of Physiology, Development and Neuroscience and the Centre for
Trophoblast Research, University of Cambridge, Cambridge CB2 3EG
3. BHF Glasgow Cardiovascular Research Centre, University of Glasgow, 126 University
Place, Glasgow, G12 8TA
Author for Correspondence (to whom reprint requests should be addressed):
Professor Scott M Nelson
Email: [email protected]
Submitted 15 May 2009 and accepted 30 July 2009.
This is an uncopyedited electronic version of an article accepted for publication in Diabetes. The American
Diabetes Association, publisher of Diabetes, is not responsible for any errors or omissions in this version
of the manuscript or any version derived from it by third parties. The definitive publisher-authenticated
version will be available in a future issue of Diabetes in print and online at
http://diabetes.diabetesjournals.org.
Diabetes Publish Ahead of Print, published online August 18, 2009
Copyright American Diabetes Association, Inc., 2009
Page 2
2
Objective: Alteration of placental structure may influence fetal overgrowth and complications of
maternal diabetes. We examined the placenta in a cohort of offspring of mothers with type 1
diabetes (OT1DM) to assess structural changes and determine whether these were related to
maternal HbA1c, fetal hematocrit, fetal hormonal or metabolic axes.
Research Design and Methods: Placental samples were analysed using stereological techniques
to quantify volumes and surface areas of key placental components in 88 OT1DM and 39
controls, and results related to maternal HbA1c and umbilical cord analytes (insulin, leptin,
adiponectin, IGF-I, hematocrit, lipids, CRP, IL-6).
Results: Intervillous space volume was increased in OT1DM (OT1DM 250±81 cm3 vs control
217±65cm3: P=0.02) with anisomorphic growth of villi (p=0.025). The placentae showed a trend
to increased weight (OT1DM 690±19g; control 641±22g: P=0.08) but villous, non-parenchymal,
trophoblast and capillary volumes did not differ. Villous surface area, capillary surface area,
membrane thickness and calculated morphometric diffusing capacity were also similar in T1DM
and controls. HbA1c at 26-34 weeks associated with birthweight (r=0.27, p=0.03), placental
weight (r=0.41, p=0.0009) and intervillous space volume (r=0.38, p=0.0024). In multivariate
analysis of cord parameters in OT1DM, fetal IGF-I emerged as a significant correlate of most
components (intervillous space, villous, trophoblast, capillary volumes all P<0.01). By contrast
fetal insulin was only independently associated with capillary surface area (positive, r2 6.7%;
P=0.02).
Conclusions: There are minimal placental structural differences between OT1DM and controls.
Fetal IGF-I but not fetal insulin emerges as a key correlate of placental substructural volumes,
thereby facilitating feedback to the placenta regarding fetal metabolic demand.
Page 3
3
aternal diabetes is associated with
adverse consequences to mother
and baby, with increased risks of
perinatal morbidity and mortality in particular
in association with fetal macrosomia. The
Pedersen hypothesis proposed that maternal
hyperglycaemia drives increased trans-
placental glucose transfer, and thereby a
compensatory fetal hyperinsulinaemia and
induction of fetal growth(1). Although the
fetal consequences of maternal glycaemia are
clearly recognised, there is still uncertainty
about the role of the placenta in determining
these outcomes. Specifically the nature and
scale of attendant structural change within the
type 1 diabetic placenta remains contentious.
Notably the respective contribution of
placental structural differences and how these
relate to fetal hormonal axes in the attainment
of enhanced placental and fetal growth is also
unknown, even in control populations.
Classically, older histological studies
of type 1 diabetic placentas have described
grossly abnormal placentas which are
enlarged, thick and plethoric, with
abnormalities of villous maturation(2). These
changes would all support the increased
incidence of placental related complications
observed in diabetic pregnancy(3). However
other historical series have not detected
significant differences(2) and more recent
stereological studies continue to differ with
either no disparity in placental composition(4;
5), or isolated changes including increases in
capillary volume and surface area(6; 7),
increased villous surface area(8), increased
total diffusive conductance(9) and increased
intervillous and trophoblast volume(7; 10).
This lack of consistency may reflect a
combination of small series, grouping of
different classes of maternal diabetes,
differences in glycaemic control between
individual patients, recent improvements in
antenatal care and differing methodology.
To date studies in diabetes have also
largely used fetal macrosomia as a surrogate
of maternal glycaemia and excessive
transplacental glucose transfer(7; 10), rather
than assessment of the fetal hormonal
response including hyperinsulinaemia.
Certainly, fetal hyperinsulinaemia has an
independent positive association with
birthweight and placental weight in offspring
of mothers with type 1 diabetes
(OT1DM)(11). The insulin-like growth
factors (IGF-I and IGF-II), also influence
feto-placental growth. IGF-I has strong
correlations to both birthweight and placental
weight in controls and OT1DM(11-13). The
role of IGF II is less clear in human studies
and is likely modified by circulating IGF2
receptor(12). Adiponectin, although not
directly associated with birthweight, does
correlate with placental weight and
contributes to the matching of fetal and
placental growth in controls and OT1DM(11;
14). Lastly leptin, also correlates with
placental weight in controls and OT1DM and
has recently been proposed as an in-utero
signal of nutrient availability(11; 15).
Collectively these fetal hormone axes may
therefore facilitate enhanced growth of the
fetus and compensatory changes within the
placenta including structural modification,
particularly in response to an excessive
glucose supply as seen in diabetic pregnancy.
To address this potential interaction of
maternal environment, fetal hormones and
M
Page 4
4
placental structure, we have examined
placentas in relation to birthweight, neonatal
adiposity and fetal hormonal indexes, in
particular those of insulin and IGF-I in
offspring of mothers with type 1 diabetes.
RESEARCH DESIGN AND METHODS
Recruitment and collections of cord
bloods: Recruitment, which began in January
1999 and ended in May 2001, took place in
eight hospital-based antenatal centers in
Scotland. A total of 250 women with type 1
diabetes consented to participate in the study
(a 94% participation rate of those enrolled in
and planning to deliver in the centers), and
cord blood samples were obtained from 200
(80%). No differences in gestation at
delivery, maternal age at delivery, years of
diabetes, fetal sex or maternal HbA1c (where
available) were found between those with and
without cord samples.
A detailed sampling protocol was
placed in all centres with local training to
ensure standardisation. Given the effects of
delayed cord clamping on stereological
parameters(16) and to maximise cord blood
available for collection, on immediate
delivery of the fetus two disposable cord
clamps were placed at 10cm from the
umbilicus and a further two disposable cord
clamps placed at 30cm from the umbilicus.
This allowed an isolated loop of cord to be
sampled for cord blood facilitating the short
median collection time for cord samples and a
constant volume of fetal blood in the placenta.
On delivery of the placenta a fifth clamp was
placed at 1cm from the chorionic plate, with
trimming of the cord to that level. To
minimise effects of sample hemolysis on
insulin levels, samples were included only if
collected from the cord within 20 min and
frozen within 60 min. The 200 samples were
therefore restricted to those in whom 1) there
was no evidence of hemolysis of cord blood
(17 excluded); 2) cord blood had been
collected
within 20 min [12 exclusions:
(median, interquartile range) collection time
for remaining samples, 2 min (1-7)]; 3) cord
blood centrifuged and plasma frozen within
60 min [17 exclusions: time from collection to
freezing for remaining samples, 17 min (11-
26)]; 4) antenatal glucocorticoids not
administered in the 24 h before birth (15
excluded); 5) children delivered before 33
weeks gestation (five excluded) and finally 6)
placental tissue sampled appropriately at time
of birth (59 excluded). A total of 89 patients
met these selection criteria.
A convenience sample of control
mothers, with no history
of obstetric or
metabolic disease, and with negative routine
screening
for gestational diabetes (national
guidelines:
http://www.sign.ac.uk/guidelines/fulltext/55/s
ection8.html) were recruited from routine
obstetric follow-up clinics after the 34th week
of pregnancy in the same centers at the same
time. Of the 145 women who gave initial
consent, cord samples were attempted in 75
and obtained in 70. Thirty-nine collections
met the above restriction criteria.
Data on clinical
outcome including
caesarean section, intercurrent medical
conditions,
and hypertensive conditions of
pregnancy were obtained by case note review.
Gestational ages were calculated from
estimated dates of delivery from chart review.
This date was derived from dates
of last
menstrual period (LMP), where available, or
by ultrasound if there was either conflict with
Page 5
5
dates as assessed by LMP (>6 d) or LMP was
unavailable.
Weight was measured at birth and, for
offspring born between 33 and 42 weeks of
gestation, further expressed as an SD
score(17). Skinfold thickness at subscapular
and triceps was measured using Holtain
calipers by pediatricians at each site using a
centrally agreed protocol, available in writing
at the time of measurement. Skinfolds were
not measured in all subjects. There were no
significant
differences in baseline
demographic or biochemical measures
between those with and without skinfold
measurements in either
control subjects or
OT1DM (data not shown). All mothers gave
informed
consent and the local ethical
committees approved protocols.
Stereological analysis: On
completion of the cord sampling procedure
and after delivery of the placenta, the
placental membranes were trimmed, the
umbilical cord shortened to within 1cm of the
chorionic plate and any large maternal clots
removed. Placentae were then weighed to the
nearest 1g. The feto-placental index (FPI)
[birthweight (grams) divided by placental
weight (grams)] was calculated for each
delivery. Samples of placenta were then
taken in a systematic random fashion.
Specifically the placenta was cut with a sharp
knife into a series of parallel slices 1-2 cm
thick. The slices were then diced into smaller
blocks 2-3 cm wide and fixed by immersion
4% formaldehyde for 24 hours and
subsequently embedded in paraffin wax.
Placental blocks were cut into 3µm sections
and stained with haematoxylin and eosin
(H&E). These were used to estimate the
volume fractions and surface areas as
previously described, with avoidance of
section edges(10). Placentae from OT1DM
and controls were treated in an identical
manner.
All estimates were made at the light
microscope level by a combination of point
and intersect counting, and computer-assisted
length measurements using the CAST system
v2.0 (Olympus, Denmark). Fields of view
were selected in a systematic random fashion
and analysed as previously
described(10)(Figure 1). In brief volume
densities of intermediate and terminal villi,
and of the villous trophoblast and capillaries
were estimated by test point counting.
Villous and capillary surface densities were
estimated by intersect counting. For each
placenta, around 200 events were counted
across 20 systematic random fields of view
per section. To convert volume and surface
densities into absolute values (in cm3
and
cm2), the volume of each placenta was taken
as the reference volume. Volumes were
calculated from trimmed placental weights
assuming a specific gravity of 1.05 g cm-3
(18;
19). The intersections of the test lines with
the villous surface also provided random start
points for the measurement of orthogonal
intercepts across the villous membrane, from
the microvilli to the nearest capillary lumen.
Harmonic means of the intercept lengths were
calculated and then converted to diffusion
distances. Given that there are standard
values for physiological constants of oxygen
in red cells, plasma and tissues including the
villous membrane, the overall morphometric
diffusing capacity for oxygen of the villous
membrane of each placenta was able to be
derived from the formula described by Laga
et al (18). This is based on the Fick equation,
Page 6
6
and provides an estimate of the maximal
theoretical diffusion capacity of the placenta.
Changes of growth or adaptation of
villi and the IVS were assessed by the
isomorphy coefficient. Briefly this represents
villous surface area, S, raised to the power 3/2
and divided by the volume, V, of either the
villous or intervillous compartment(20) and is
designed to measure disproportionate growth
of villous surface area compared to villous
volume. Similarly, the coefficients for
capillary surface area relative to villous and
capillary volume were also derived by S3/2
/V.
The villous elaboration index I=S/V 0.667
, was
also calculated for each case. This index
gives similar information to the villous
isomorphy coefficient, with a high value
representing increased elaboration of the
villous surface(8).
Cord blood assays. Plasma insulin,
32-33 split proinsulin, proinsulin, leptin, IGF-
I, adiponectin, plasma total cholesterol,
triglyceride, non-esterified fatty acid, VLDL-
C, LDL-C, HDL-C, CRP, ICAM-1, IL-6 were
assayed as previously described (13; 21-24).
In particular IGF-I was assayed by
chemiluminescence immunoassay (Nichols
Institute Diagnostics, San Juan Capistrano,
CA 92675, USA) using standards referenced
to WHO 1st International Reference Reagent
1988 (Insulin-Like Growth Factor-1 87/518).
The limit of detection is 1·0 nmol/ l. Intra-
and interassay coefficients of variation (CVs)
were 5·5–6.8% and 5·4–7·0%, respectively.
All lipid assays were carried out at the
Biochemistry Department of Glasgow Royal
Infirmary, which is a Centers for
Disease
Control and Prevention (Atlanta) reference
laboratory
and accredited by Clinical
Pathology Accreditation U.K. Maternal
HbA1c was measured centrally by one
laboratory.
Statistical Analysis. Data were
analysed using standard software (Stata 10,
Texas, USA). In several cases (insulin, leptin,
triglyceride, VLDL, NEFA, TC:HDL-C ratio,
CRP, ICAM-1 and IL-6) measures were not
normally distributed and unadjusted values
are presented as median (interquartile range)
and for normally distributed variables mean ±
standard deviation. Variables were
logarithmically transformed to obtain normal
distributions. Inter-group differences were
assessed by unpaired t-test after checking
homogeneity of variance by means of the F
test, analysis of variance or, where further
predictor variables were included, by general
linear models. Exploration of more complex
statistical models did not suggest alternative
relationships. Spearman correlation
coefficients are reported. Stepwise logistic
regression was performed using an alpha of
p≤0.1 for adding or removing predictors from
the model. Statistical significance was
determined at p <0.05.
RESULTS
Fetal cord analytes and placental
structure in OT1DM versus control
subjects. Maternal and fetal characteristics of
this cohort have been previously described
and are included in Table 1. Maternal type 1
diabetes was associated with marked
increases in standardised birthweight and
absolute values of cord insulin, proinsulin and
split 32-33 insulin(21), cortisol, leptin and
CRP, with reductions in adiponectin, HDL-C,
NEFA and IL-6 (Table 1). All differences
remained significant after adjustment for sex
and mode of delivery. There was a trend
Page 7
7
towards increased placental weight in
OT1DM strengthened by adjustment for sex
and gestation-at-delivery (p=0.06). FPI did
not differ (Table 1).
Analysis of placental stereological data
demonstrated that intervillous space volume
fraction and absolute intervillous space
volume were increased in OT1DM (Table 2).
Adjustment for mode of delivery, sex,
gestational age at birth and smoking status
strengthened this difference for both (p=0.028
and p=0.008 respectively). The contribution
of trophoblast to villous structure was reduced
in OT1DM (p=0.01), however this was not
associated with an overall reduction in
trophoblast volume, or villous surface area
(Table 2). Absolute values of capillary
volume and surface area were similarly
unaltered by the presence of maternal
diabetes.
Assessment of the complexity of the
villous trees using the villous isomorphy
coefficient and the elaboration index
demonstrated that branching was reduced in
OT1DM (p=0.025 and p=0.019 respectively).
With respect to capillary development the
ratio of capillary surface area relative to
capillary volume was also reduced in OT1DM
(p=0.01). The villous isomorphy coefficient
and elaboration index were unrelated to
gestational age, mode of delivery, sex and
smoking status. Capillary development, as
related to capillary surface area relative to
capillary volume, was however related to
gestational age and adjustment attenuated the
OT1DM specific difference (p=0.24).
Placental composition, relationship
with birthweight and adiposity. Assessment
of the relationship of birthweight to placental
structure demonstrated a strong association
with placental weight (controls r=0.62,
P<0.0001; OT1DM r=0.62, p<0.0001), with
additional strong correlations of birthweight
to the individual placental components
including villous volume (controls r=0.34,
p=0.03; OT1DM r=0.24, p=0.03), intervillous
space volume (controls r=0.58, p=0.001;
OT1DM r=0.44, P<0.0001) and non-
parenchymal volume (controls r=0.24,
p=0.13; OT1DM r=0.42, p<0.0001) in
controls and OT1DM. All relationships were
strengthened after standardising birthweight
for gestational age and sex (p<0.05 for
controls and OT1DM for all). Capillary
volume (r=0.23, p=0.03) and capillary surface
area (r=0.21, p=0.05) were associated with
standardised birthweight in OT1DM only.
For the subset with neonatal anthropometry,
total skinfold thickness was associated with
placental weight (controls r=0.36, p=0.15;
OT1DM r=0.31, p=0.05) and capillary
volume (controls r=0.13, p=0.62; OT1DM
r=0.32, p=0.046), with no relationship seen to
other placental components.
Placental composition, relationship
with fetal hormones. Analysis of the
associations of fetal hormonal axes to
placental compartments demonstrated that
insulin, in addition to known associations
with birthweight (r=0.42, p<0.0001) and
placental weight (r=0.44, p<0.0001) in
OT1DM, demonstrated OT1DM-specific
correlations to villous volume (r=0.23,
p=0.03), intervillous space volume (r=0.25,
p=0.02), non-parenchymal volume (r=0.23,
p=0.03) and capillary volume (r=0.27,
p=0.009). Cord IGF-I levels were associated
with birthweight in controls and OT1DM
(controls r=0.32, p=0.04; OT1DM r=0.48,
p<0.0001), but only correlated with placental
Page 8
8
weight and substructural indices in OT1DM -
specifically; placental weight (r=0.49,
p<0.0001), villous volume (r=0.23, p=0.03),
intervillous space volume (r=0.35, p<0.001)
and non-parenchymal volume (r=0.29,
p=0.005), with a weaker relationship to
capillary volume (r=0.18, p=0.08). Cord
leptin values demonstrated associations with
birthweight (controls r=0.48, p=0.002;
OT1DM r=0.40, p<0.0001) and placental
weight (controls r=0.40, p=0.01; OT1DM
r=0.33, p=0.0019) in controls and OT1DM,
but were only related to intervillous space
volume (controls r=0.30, p=0.07; OT1DM
r=0.32, p=0.002). Assessment of maternal
glycaemic state in OT1DM demonstrated that
maternal HbA1c at 26-34 weeks was
associated with birthweight (r=0.27, p=0.03),
placental weight (r=0.41, p=0.0009),
intervillous volume (r=0.38, p=0.0024) and
non-parenchymal volume (r=0.25, p=0.05).
First and third trimester maternal HbA1c
demonstrated similar relationships with
intervillous volume (r=0.34, p=0.059; r=0.31,
p=0.03 respectively), but not with any of the
other placental parameters including placental
weight. Cord adiponectin and cortisol were
unrelated to birthweight or placental
parameters, and no consistent associations
were observed for fetal inflammatory indices,
fetal hematocrit or fetal lipids and placental
composition. Isomorphy coefficients were
also unrelated to birthweight, placental weight
or cord analytes in controls or OT1DM.
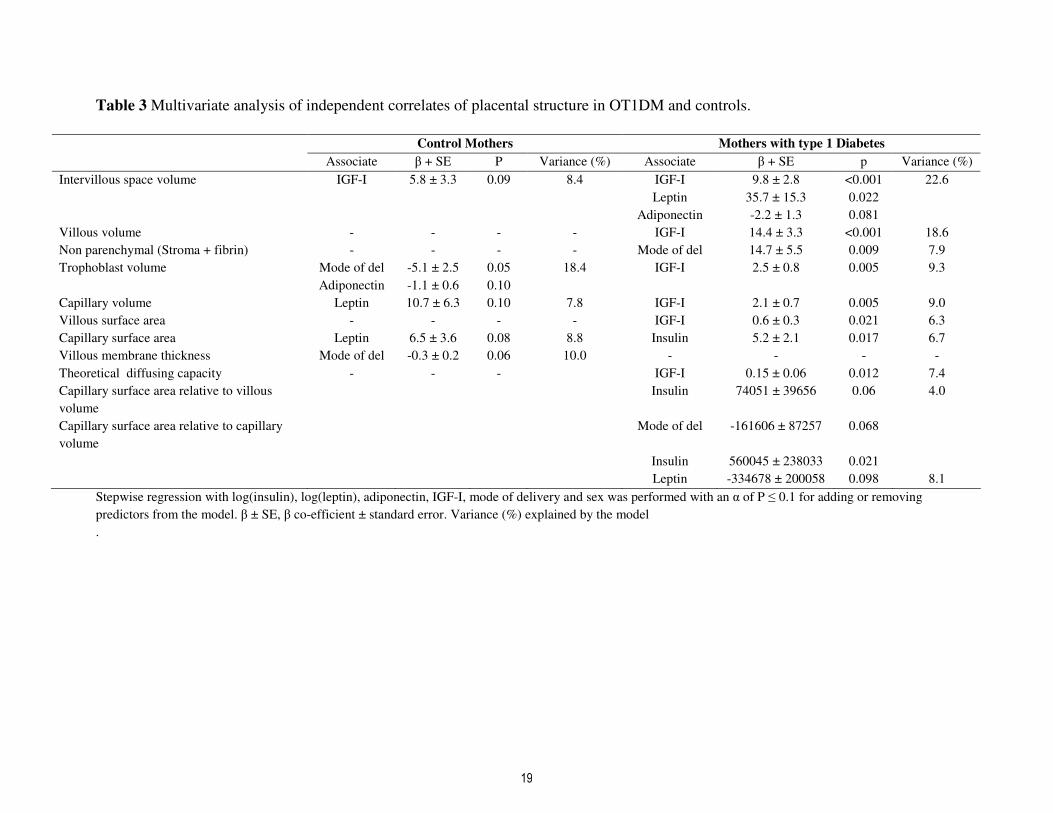
In stepwise regression models (Table
3), cord IGF-I was associated with
intervillous volume in controls and OT1DM,
with further contributions of IGF-I to non-
parenchymal volume, trophoblast volume,
capillary volume, villous surface area and
theoretical diffusion capacity in OT1DM
(P<0.05 for all). In contrast insulin was only
positively associated with capillary surface
area, an association which was restricted to
OT1DM (p=0.017). Inclusion of maternal
HbA1c at 26-34 weeks, attenuated this
association with insulin, and IGF-I became
the sole associate of capillary surface area (β
0.87 ± 0.4, p=0.022, r2 8.9%). Notably
HbA1c at 26-34 weeks was not related to any
other placental parameters and did not alter
the noted associations of IGF-I demonstrated
in Table 3, and indeed made IGF-I the sole
associate of non-parenchymal volume in
OT1DM (β5.2 ± 2.7, p=0.06, r2 6.1%). For
the isomorphic variables, insulin was
associated with capillary surface area relative
to both villous volume and capillary volume
(Table 3), an effect which was partially
explained by maternal HbA1c.
To assess the role of fetal hypoxia in
determining placental structure, the surrogate
marker of fetal hematocrit was included in the
models. This did not attenuate the
associations of IGF-I with placental structure
in OT1DM. However in controls, fetal
hematocrit demonstrated positive associations
with intervillous volume (p=0.023), which
was independent of sex (p=0.06), and leptin
(p=0.036), with IGF-I dropping out of the
model. Fetal hematocrit was also associated
in controls with capillary volume (p=0.043)
which was independent of the previously
observed relationship with leptin (p=0.013)
(Table 3).
DISCUSSION
To our knowledge this is the largest
series examining placental stereology in a
contemporary cohort of women with type 1
Page 9
9
diabetes. It gives an important opportunity
both to examine the influence of maternal
diabetes on placental structure but also to
assess whether hormones in the fetal
circulation- particularly insulin and leptin
which are markedly raised in this cohort-
correlate with placental substructure. We find
that overall there are relatively few systematic
differences between placentas from mothers
with diabetes and controls. In particular, the
key measures that might be expected to
influence substrate diffusion across the
placenta (villous surface area, capillary
surface area, villous membrane thickness) are
not altered. In keeping with this, the placental
morphometric diffusing capacity was also not
different between diabetic and control
pregnancies.
Historically, a range of abnormalities
have been described in the placenta in type 1
diabetes, including increased placental size in
conjunction with fetal macrosomia. In the
oldest series, gross pathology including an
increased rate of placental infarcts was
described, as well as villous immaturity. In
series from the 1990’s microscopic
morphology was often described as normal,
particularly where maternal diabetes was well
controlled(25). Increases in capillary volume
and surface area(6; 7), villous surface area(8),
increased total diffusive conductance(9) and
intervillous and trophoblast volume(7; 10)
were described and their presence or absence
often ascribed to the degree of maternal
diabetes control. In our series we did not
observe these changes with the exception of
an increase in intervillous space volume,
which classically indicates a deficiency of
terminal villi and persisting villous
immaturity. Consistent with this and previous
reports(20) we observe a reduction in the
villous coefficient and elaboration index -
measures of the complexity of the villous tree
that would impinge upon the intervillous
space, suggesting that the observed villous
growth is anisomorphic. Importantly
however, despite this reduction in villous
development, there is no overall impact on
villous volume or surface area, primarily due
to an increased total placental volume in
OT1DM. One might speculate that the
reduction in villous development and
increased placental growth are compensatory
changes but it is not possible to determine the
primary direction of this relationship.
Appropriately, we demonstrate that individual
placental components, including villous
volume, all correlate with birthweight.
Despite these limited changes, the
inconsistent nature of the studies to date
combined with the major findings of our
series, supports the view that there are
minimal changes in placental structure
inherent in contemporary diabetic pregnancy.
This is of interest as the overall hormonal
environment on the fetal side of the
circulation is markedly abnormal, with
median fetal insulin and leptin levels 4 and 3
times higher respectively, than controls. It is
therefore striking that these significant
increases in insulin and leptin, do not appear
to be driving any consistent change in
placental structure. Only IGF-I displayed a
consistent relationship with the volumes of
the intervillous space, villous trophoblast and
placental capillaries.
Insulin has classically been proposed
as a mediator of enhanced placental
development in type 1 diabetes and was
thought to underlie the reported increases in
Page 10
10
proliferation rates of trophoblast, villous
stromal cells and villous capillaries.
However, insulin is not usually transported
across the villous membrane, and its effects
may be different on the fetal and maternal
side of the placenta. In the first trimester,
insulin receptors are localised to the
intervillous surface of the villous trophoblast,
with expression predominantly on the
surfaces of sprouting segments of the villous
tree(26). In contrast, by the third trimester the
highest immunoreactivity for the insulin
receptor is found in the fetal villous
endothelium, in particular in segments with
capillary sprouting(27). Further analysis of
the transcriptional profile and
phosphorylation status of first and third
trimester isolated trophoblast and endothelial
cells in response to hyperinsulinaemia
suggests that there is spatio-temporal shift in
insulin response(28) leading to the
hypothesis that there is predominant effect of
maternal insulin in early pregnancy and fetal
insulin in later pregnancy (27). Fetal insulin
levels would be predicted to contribute to
control of villous differentiation in
accordance with fetal growth and nutritional
needs in later pregnancy. In the current study
we demonstrate that fetal insulin is an
independent associate of capillary surface
area, and of capillary surface area relative to
villous and capillary volume. Our observed
relationship with capillary development
would be consistent with insulin receptor
localisation to endothelial cells and the ability
of fetal insulin to enhance capillary
development including longitudinal growth
within a fixed villous volume(6). It is notable
however that there appears to be little impact
of fetal insulin on trophoblast volumes
independent of the effects of IGF I. In this
analysis we rely on cord measures of insulin
and IGF-1. It is possible that fetal
hyperinsulinaemia earlier in pregnancy is
acting, however if hyperinsulinaemia is
established earlier in pregnancy it is likely
that cord insulin will also be increased. This is
apparent in the strong relationship of cord
insulin and IGF-1 to measures such as
birthweight(13) and our biologically plausible
association of fetal insulin with placental
capillary volumes.
The relationship of circulating fetal
IGF-I to many of the placental components is
striking. Cord IGF-I is strongly associated
with birthweight and placental weight(12) and
IGF-I deletion or reduced receptor expression
in humans are both associated with a
reduction in birthweight and placental
weight(29; 30). Conversely prolonged
administration of exogenous IGF-I to growth
restricted fetuses substantially increases body
and placental weight(31). In short term
studies, exogenous fetal IGF-I increases
placental amino acid transfer and uptake and
decreases proteolysis, facilitating organ
specific and placental growth(32). These
relationships are in contrast to those observed
in mice suggesting species specificity, where
deletion of IGF-I or its receptor IGF-Ir is
associated with a significant reduction in fetal
but not placental weight(33). Therefore,
although IGF-I may directly be enhancing
placental growth, via receptors expressed in
trophoblast and endothelium(34-36),
alternative indirect mediators like adiponectin
which have been implicated in the matching
of fetal and placental weight may
contribute(11; 14). However, cord levels of
IGF-I and adiponectin are not correlated, and
Page 11
11
adiponectin was not an independent associate
in the multivariate models. Fetal lipids, in
particular HDL is associated with IGF-1 in
fetal and adult life(37; 38). However we did
not demonstrate any relationship of fetal
lipids with placental parameters (data not
shown) despite recent recognition that
placental endothelial cells efficiently transport
cholesterol(39). Similarly, although
inflammatory signals, including IL-6 can
increase IGF-I expression(40), we did not
observe an independent effect of
inflammatory mediators on placental
parameters (data not shown). Lastly,
inclusion of fetal hematocrit, an index of fetal
hypoxia, did not alter these relationships but
did demonstrate the expected positive
association with capillary volume in
multivariate models. Overall our results
would support the hypothesis that in humans
IGF-I is having a direct effect on placental
development.
Leptin has also been proposed as a
regulator of placental growth. In human
trophoblast cells in-vitro, exogenous leptin
treatment has mitogenic
and anti-apoptotic
effects, while inhibition of endogenous
placental leptin expression reduces cell
proliferation and increases apoptotic cell
number
and caspase-3 activity(41).
Furthermore, leptin stimulates activity of the
amino acid transporter system A in human
placental villous fragments at term(42; 43).
Lastly, leptin can induce angiogenesis in
primary cultures of endothelial cells(44).
Despite these effects, leptin infusion does not
induce significant placental growth in
sheep(45) and in the current study leptin did
not show consistent relationships with
placental components in the controls. This
limited effect may reflect differential leptin
receptor expression, as although leptin
receptors have been localised to umbilical
endothelial cells and trophoblast(46; 47), they
have not been demonstrated on placental
endothelium which may explain our observed
lack of association of fetal leptin with
stereological parameters. Although leptin
exerted a small influence on intervillous space
volume independent of IGF-I in the OT1DM
placentas, leptin is markedly raised in
OT1DM, suggesting that the ability of leptin
to induce placental angiogenesis and growth
may be limited.
Maternal HbA1c is associated with
both birthweight and placental weight in this
series. It is notable however that maternal
diabetes and indeed maternal HbA1c are not
related to most of the placental stereological
parameters with the exception of intervillous
space volume. This would suggest that
excess maternal nutrient supply may not be
primarily responsible for changes in placental
development and where present such changes
and increases in placental weight in general
follow increased fetal weight. A notable
feature of this study is the close matching of
fetal growth with placental size, including
placental components. It would appear that
the fetus is capable of modulating placental
transport in response to metabolic demands
and nutrient supply. The signals that facilitate
this feedback loop are largely unknown,
however, this study suggests that IGF-I, and
to a lesser extent insulin and leptin all
contribute, and facilitate varying degrees of
morphological alternation.
In conclusion, we demonstrate that
maternal type 1 diabetes is associated with
minimal changes in placental structure and
Page 12
12
that the changes that do occur relate
principally to villous maturity. Secondly we
identify that fetal IGF-1 is the principal
correlate of placental sub-structure and that
the effect of insulin is limited to capillary
development . Lastly we identify that fetal
leptin has a limited positive effect on
placental angiogenesis, and in conjunction
with IGF-I and insulin contributes to the
metabolic feedback from the fetus to the
placenta regarding its metabolic demands.
ACKNOWLEDGEMENTS
This study was supported by grants
from the Chief Scientist Office of the Scottish
Executive (K/MRS/50/C2726) and GRI
Research Endowment Fund (05REF007).
The study would not have been possible
without contributions of many people to data
collection at the different centers as
previously noted (21). We acknowledge the
expert technical help of Dr Simon Riley who
performed the embedding of the placental
samples.
Page 13
13
REFERENCES
1. Pedersen J: Diabetes and Pregnancy - Blood Sugar of Newborn Infants. Copenhagan, Danish
Science Press Ltd, 1952
2. Benirschke K, Kauffman P, Baergen RN: Maternal diseases complicating pregnancy:
Diabetes, Tumors, Pre-eclampsia, Lupus Anticoagulant. In Pathology of the Human Placenta
Benirschke K, Kauffman P, Baergen RN, Eds. New York, Springer Science + Business Media,
2006, p. 584-656
3. Evers IM, Nikkels PGJ, Sikkema JM, Visser GHA: Placental Pathology in Women with Type
1 Diabetes and in a Control Group with Normal and Large-for-Gestational-Age Infants. Placenta
24:819-825, 2003
4. Mayhew TM, Sisley I: Quantitative studies on the villi, trophoblast and intervillous pores of
placentae from women with well-controlled diabetes mellitus. Placenta 19:371-377, 1998
5. Mayhew TM, Jairam IC: Stereological comparison of 3D spatial relationships involving villi
and intervillous pores in human placentas from control and diabetic pregnancies. J Anat 197 ( Pt
2):263-274, 2000
6. Mayhew TM: Enhanced fetoplacental angiogenesis in pre-gestational diabetes mellitus: the
extra growth is exclusively longitudinal and not accompanied by microvascular remodelling.
Diabetologia 45:1434-1439, 2002
7. Teasdale F: Histomorphometry of the human placenta in Class C diabetes mellitus. Placenta
6:69-81, 1985
8. Boyd PA, Scott A, Keeling JW: Quantitative structural studies on placentas from pregnancies
complicated by diabetes mellitus. Br J Obstet Gynaecol 93:31-35, 1986
9. Mayhew TM, Sorensen FB, Klebe JG, Jackson MR: Oxygen diffusive conductance in
placentae from control and diabetic women. Diabetologia 36:955-960, 1993
10. Jauniaux E, Burton GJ: Villous histomorphometry and placental bed biopsy investigation in
Type I diabetic pregnancies. Placenta 27:468-474, 2006
11. Nelson SM, Freeman DJ, Sattar N, Lindsay RS: Role of adiponectin in matching of fetal and
placental weight in mothers with type 1 diabetes. Diabetes Care 31:1123-1125, 2008
12. Ong K, Kratzsch J, Kiess W, Costello M, Scott C, Dunger D: Size at Birth and Cord Blood
Levels of Insulin, Insulin-Like Growth Factor I (IGF-I), IGF-II, IGF-Binding Protein-1 (IGFBP-
1), IGFBP-3, and the Soluble IGF-II/Mannose-6-Phosphate Receptor in Term Human Infants. J
Clin Endocrinol Metab 85:4266-4269, 2000
13. Lindsay RS, Hamilton BA, Calder AA, Johnstone FD, Walker JD: The relation of insulin,
leptin and IGF-1 to birthweight in offspring of women with type 1 diabetes. Clin Endocrinol
(Oxf) 61:353-359, 2004
14. Kadowaki K, Waguri M, Nakanishi I, Miyashita Y, Nakayama M, Suehara N, Funahashi T,
Shimomura I, Fujita T: Adiponectin Concentration in Umbilical Cord Serum Is Positively
Associated with the Weight Ratio of Fetus to Placenta. J Clin Endocrinol Metab 91:5090-5094,
2006
15. Forhead AJ, Fowden AL: The hungry fetus? Role of leptin as a nutritional signal before
birth. J Physiol 587:1145-1152, 2009
16. Bouw GM, Stolte LAM, Baak JPA, Oort J: Quantitative morphology of the placenta. 1.
Standardization of sampling. Eur J Obstet Gynecol Reprod Biol 6:325-331, 1976
17. Johnstone FD, Mao JH, Steel JM, Prescott RJ, Hume R: Factors affecting fetal weight
distribution in women with type I diabetes. Bjog 107:1001-1006, 2000
Page 14
14
18. Laga EM, Driscoll SG, Munro HN: Quantitative studies of human placenta. I. Morphometry.
Biol Neonate 23:231-259, 1973
19. Jackson MR, Mayhew TM, Haas JD: The volumetric composition of human term placentae:
altitudinal, ethnic and sex differences in Bolivia. J Anat 152:173-187, 1987
20. Mayhew TM: Patterns of villous and intervillous space growth in human placentas from
normal and abnormal pregnancies. Eur J Obstet Gynecol Reprod Biol 68:75-82, 1996
21. Lindsay RS, Walker JD, Halsall I, Hales CN, Calder AA, Hamilton BA, Johnstone FD:
Insulin and insulin propeptides at birth in offspring of diabetic mothers. J Clin Endocrinol Metab
88:1664-1671, 2003
22. Lindsay RS, Walker JD, Havel PJ, Hamilton BA, Calder AA, Johnstone FD: Adiponectin is
present in cord blood but is unrelated to birth weight. Diabetes Care 26:2244-2249, 2003
23. Nelson SM, Freeman DJ, Sattar N, Johnstone FD, Lindsay RS: IGF-1 and leptin associate
with fetal HDL-cholesterol at birth: examination in offspring of mothers with type 1 diabetes.
Diabetes (in press), 2007
24. Nelson SM, Sattar N, Freeman DJ, Walker JD, Lindsay RS: Inflammation and Endothelial
Activation Is Evident at Birth in Offspring of Mothers With Type 1 Diabetes. Diabetes 56:2697-
2704, 2007
25. Desoye G: The Placenta. In Diabetes in Women Reece EA, Coustan DR, Gabbe S, Eds.,
Lippincott Williams, 2004
26. Jones CJ, Hartmann M, Blaschitz A, Desoye G: Ultrastructural localization of insulin
receptors in human placenta. Am J Reprod Immunol 30:136-145, 1993
27. Desoye G, Hartmann M, Blaschitz A, Dohr G, Hahn T, Kohnen G, Kaufmann P: Insulin
receptors in syncytiotrophoblast and fetal endothelium of human placenta. Immunohistochemical
evidence for developmental changes in distribution pattern. Histochemistry 101:277-285, 1994
28. Hiden U, Maier A, Bilban M, Ghaffari-Tabrizi N, Wadsack C, Lang I, Dohr G, Desoye G:
Insulin control of placental gene expression shifts from mother to foetus over the course of
pregnancy. Diabetologia 49:123-131, 2006
29. Woods KA, Camacho-Hubner C, Savage MO, Clark AJL: Intrauterine Growth Retardation
and Postnatal Growth Failure Associated with Deletion of the Insulin-Like Growth Factor I
Gene. N Engl J Med 335:1363-1367, 1996
30. Laviola L, Perrini S, Belsanti G, Natalicchio A, Montrone C, Leonardini A, Vimercati A,
Scioscia M, Selvaggi L, Giorgino R, Greco P, Giorgino F: Intrauterine Growth Restriction in
Humans Is Associated with Abnormalities in Placental Insulin-Like Growth Factor Signaling.
Endocrinology 146:1498-1505, 2005
31. Kimble RM, Breier BH, Gluckman PD, Harding JE: Enteral IGF-I enhances fetal growth and
gastrointestinal development in oesophageal ligated fetal sheep. J Endocrinol 162:227-235, 1999
32. Harding JE, Liu L, Evans PC, Gluckman PD: Insulin-like growth factor 1 alters feto-
placental protein and carbohydrate metabolism in fetal sheep. Endocrinology 134:1509-1514,
1994
33. Baker J, Liu JP, Robertson EJ, Efstratiadis: A Role of Insulin-like Growth factors in
embryonic and Postnatal Growth. Cell 75:73 - 82, 1993
34. Hayati AR, Cheah FC, Tan AE, Tan GC: Insulin-like growth factor-1 receptor expression in
the placentae of diabetic and normal pregnancies. Early Hum Dev 83:41-46, 2007
35. Holmes R, Porter H, Newcomb P, Holly JM, Soothill P: An immunohistochemical study of
type I insulin-like growth factor receptors in the placentae of pregnancies with appropriately
grown or growth restricted fetuses. Placenta 20:325-330, 1999
Page 15
15
36. Hiden U, Glitzner E, Hartmann M, Desoye G: Insulin and the IGF system in the human
placenta of normal and diabetic pregnancies. J Anat 215:60-68, 2009
37. Ceda GP, Dall'Aglio E, Magnacavallo A, Vargas N, Fontana V, Maggio M, Valenti G, Lee
PD, Hintz RL, Hoffman AR: The insulin-like growth factor axis and plasma lipid levels in the
elderly. J Clin Endocrinol Metab 83:499-502, 1998
38. Nelson SM, Freeman DJ, Sattar N, Johnstone FD, Lindsay RS: IGF-1 and leptin associate
with fetal HDL-cholesterol at birth: examination in offspring of mothers with type 1 diabetes.
Diabetes:db07-0585, 2007
39. Stefulj J, Panzenboeck U, Becker T, Hirschmugl B, Schweinzer C, Lang I, Marsche G,
Sadjak A, Lang U, Desoye G, Wadsack C: Human Endothelial Cells of the Placental Barrier
Efficiently Deliver Cholesterol to the Fetal Circulation via ABCA1 and ABCG1. Circ Res
104:600-608, 2009
40. Franchimont N, Gangji V, Durant D, Canalis E: Interleukin-6 with Its Soluble Receptor
Enhances the Expression of Insulin-Like Growth Factor-I in Osteoblasts. Endocrinology
138:5248-5255, 1997
41. Magarinos MP, Sanchez-Margalet V, Kotler M, Calvo JC, Varone CL: Leptin Promotes Cell
Proliferation and Survival of Trophoblastic Cells. Biol Reprod 76:203-210, 2007
42. Jansson N, Greenwood SL, Johansson BR, Powell TL, Jansson T: Leptin Stimulates the
Activity of the System A Amino Acid Transporter in Human Placental Villous Fragments. J Clin
Endocrinol Metab 88:1205-1211, 2003
43. von Versen-Hoynck F, Rajakumar A, Parrott MS, Powers RW: Leptin Affects System A
Amino Acid Transport Activity in the Human Placenta: Evidence for STAT3 Dependent
Mechanisms. Placenta 30:361-367, 2009
44. Bouloumie A, Drexler HCA, Lafontan M, Busse R: Leptin, the Product of Ob Gene,
Promotes Angiogenesis. Circ Res 83:1059-1066, 1998
45. Forhead AJ, Lamb CA, Franko KL, O'Connor DM, Wooding FBP, Cripps RL, Ozanne S,
Blache D, Shen QW, Du M, Fowden AL: Role of leptin in the regulation of growth and
carbohydrate metabolism in the ovine fetus during late gestation. J Physiol 586:2393-2403, 2008
46. Ashworth CJ, Hoggard N, Thomas L, Mercer JG, Wallace JM, Lea RG: Placental leptin. Rev
Reprod 5:18-24, 2000
47. Hauguel-de Mouzon S, Lepercq J, Catalano P: The known and unknown of leptin in
pregnancy. Am J Obstet Gynecol 194:1537-1545, 2006
Page 16
16
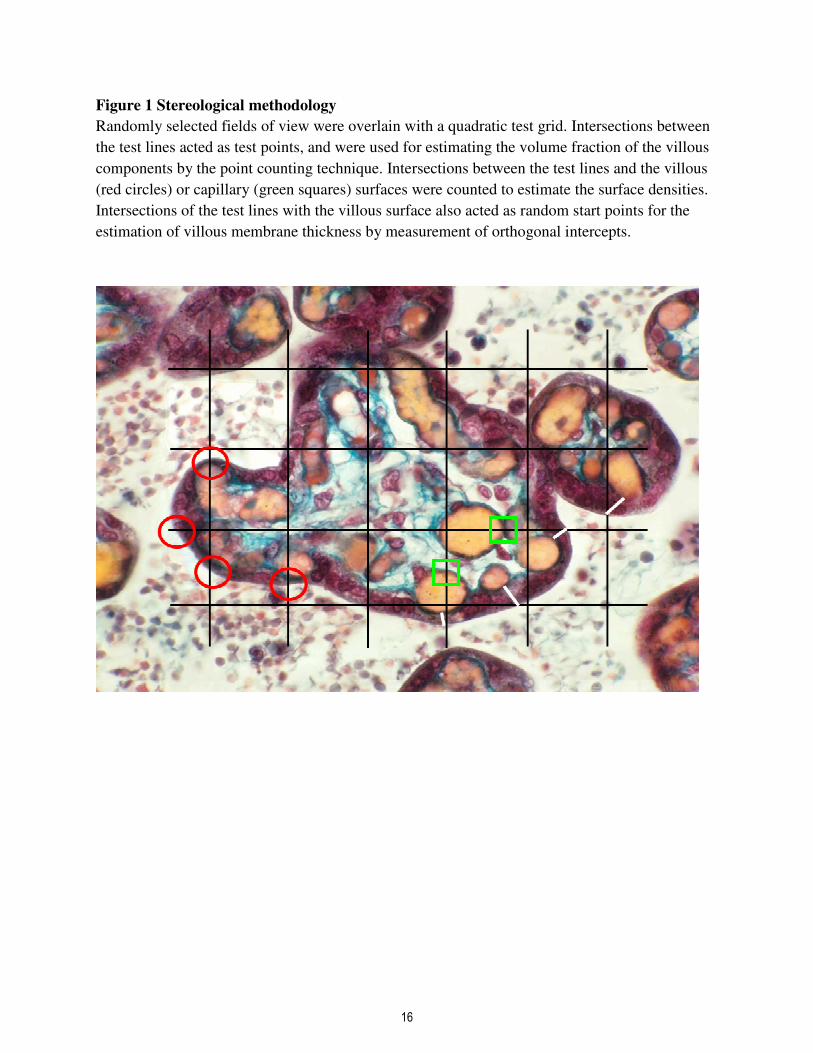
Figure 1 Stereological methodology
Randomly selected fields of view were overlain with a quadratic test grid. Intersections between
the test lines acted as test points, and were used for estimating the volume fraction of the villous
components by the point counting technique. Intersections between the test lines and the villous
(red circles) or capillary (green squares) surfaces were counted to estimate the surface densities.
Intersections of the test lines with the villous surface also acted as random start points for the
estimation of villous membrane thickness by measurement of orthogonal intercepts.
Page 17
17
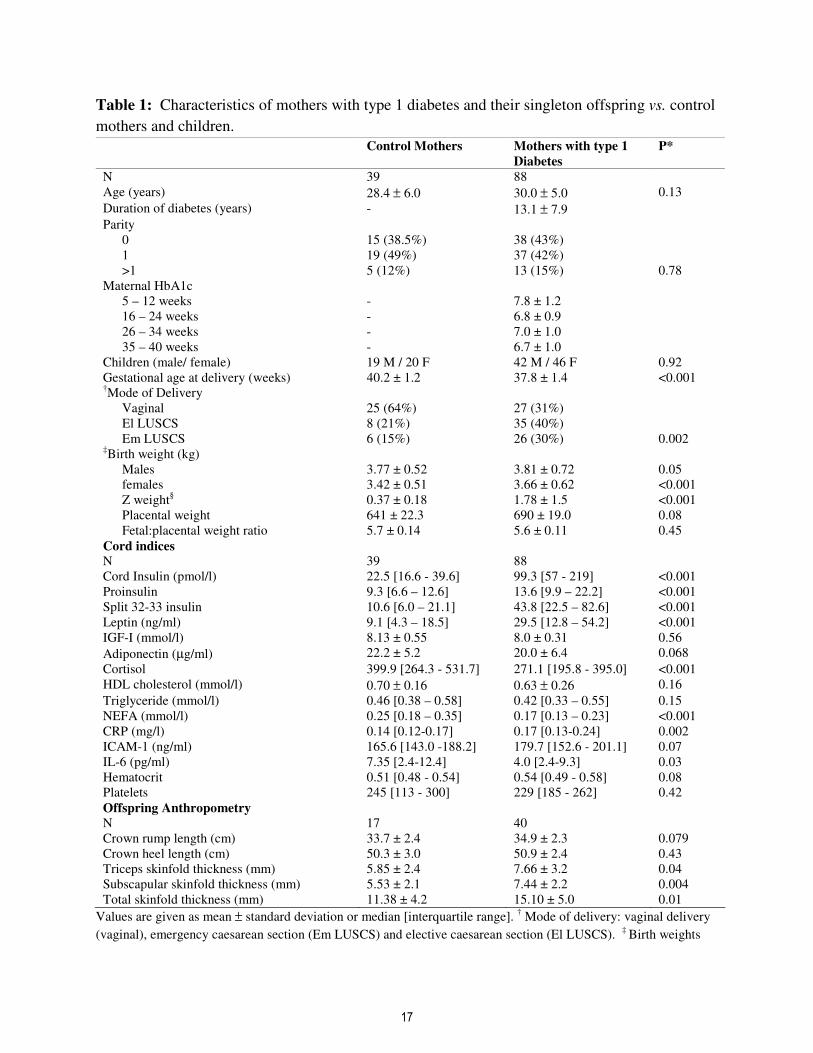
Table 1: Characteristics of mothers with type 1 diabetes and their singleton offspring vs. control
mothers and children.
Control Mothers Mothers with type 1
Diabetes
P*
N 39 88
Age (years) 28.4 ± 6.0 30.0 ± 5.0 0.13
Duration of diabetes (years) - 13.1 ± 7.9
Parity
0 15 (38.5%) 38 (43%)
1 19 (49%) 37 (42%)
>1 5 (12%) 13 (15%) 0.78
Maternal HbA1c
5 – 12 weeks - 7.8 ± 1.2
16 – 24 weeks - 6.8 ± 0.9
26 – 34 weeks - 7.0 ± 1.0
35 – 40 weeks - 6.7 ± 1.0
Children (male/ female) 19 M / 20 F 42 M / 46 F 0.92
Gestational age at delivery (weeks) 40.2 ± 1.2 37.8 ± 1.4 <0.001 †Mode of Delivery
Vaginal 25 (64%) 27 (31%)
El LUSCS 8 (21%) 35 (40%)
Em LUSCS 6 (15%) 26 (30%) 0.002 ‡Birth weight (kg)
Males 3.77 ± 0.52 3.81 ± 0.72 0.05
females 3.42 ± 0.51 3.66 ± 0.62 <0.001
Z weight§ 0.37 ± 0.18 1.78 ± 1.5 <0.001
Placental weight 641 ± 22.3 690 ± 19.0 0.08
Fetal:placental weight ratio 5.7 ± 0.14 5.6 ± 0.11 0.45
Cord indices
N 39 88
Cord Insulin (pmol/l) 22.5 [16.6 - 39.6] 99.3 [57 - 219] <0.001
Proinsulin 9.3 [6.6 – 12.6] 13.6 [9.9 – 22.2] <0.001
Split 32-33 insulin 10.6 [6.0 – 21.1] 43.8 [22.5 – 82.6] <0.001
Leptin (ng/ml) 9.1 [4.3 – 18.5] 29.5 [12.8 – 54.2] <0.001
IGF-I (mmol/l) 8.13 ± 0.55 8.0 ± 0.31 0.56
Adiponectin (µg/ml) 22.2 ± 5.2 20.0 ± 6.4 0.068
Cortisol 399.9 [264.3 - 531.7] 271.1 [195.8 - 395.0] <0.001
HDL cholesterol (mmol/l) 0.70 ± 0.16 0.63 ± 0.26 0.16
Triglyceride (mmol/l) 0.46 [0.38 – 0.58] 0.42 [0.33 – 0.55] 0.15
NEFA (mmol/l) 0.25 [0.18 – 0.35] 0.17 [0.13 – 0.23] <0.001
CRP (mg/l) 0.14 [0.12-0.17] 0.17 [0.13-0.24] 0.002
ICAM-1 (ng/ml) 165.6 [143.0 -188.2] 179.7 [152.6 - 201.1] 0.07
IL-6 (pg/ml) 7.35 [2.4-12.4] 4.0 [2.4-9.3] 0.03
Hematocrit 0.51 [0.48 - 0.54] 0.54 [0.49 - 0.58] 0.08
Platelets 245 [113 - 300] 229 [185 - 262] 0.42
Offspring Anthropometry
N 17 40
Crown rump length (cm) 33.7 ± 2.4 34.9 ± 2.3 0.079
Crown heel length (cm) 50.3 ± 3.0 50.9 ± 2.4 0.43
Triceps skinfold thickness (mm) 5.85 ± 2.4 7.66 ± 3.2 0.04
Subscapular skinfold thickness (mm) 5.53 ± 2.1 7.44 ± 2.2 0.004
Total skinfold thickness (mm) 11.38 ± 4.2 15.10 ± 5.0 0.01
Values are given as mean ± standard deviation or median [interquartile range]. † Mode of delivery: vaginal delivery
(vaginal), emergency caesarean section (Em LUSCS) and elective caesarean section (El LUSCS). ‡
Birth weights
Page 18
18
given as unadjusted, P value for difference dependent on maternal diabetes status adjusted for gestational age at
delivery. § Z weight is standard deviation score compared to standard values for gestational age, gender and maternal
parity. A subset of offspring had detailed anthropometry performed. Cord hormonal profiles of singleton offspring
of mothers with type 1 diabetes vs. control offspring. Unadjusted values are given as mean ± standard deviation or
median [interquartile range]. * P= value of significance in unpaired t –test, χ2 or Mann-Whitney test as appropriate.
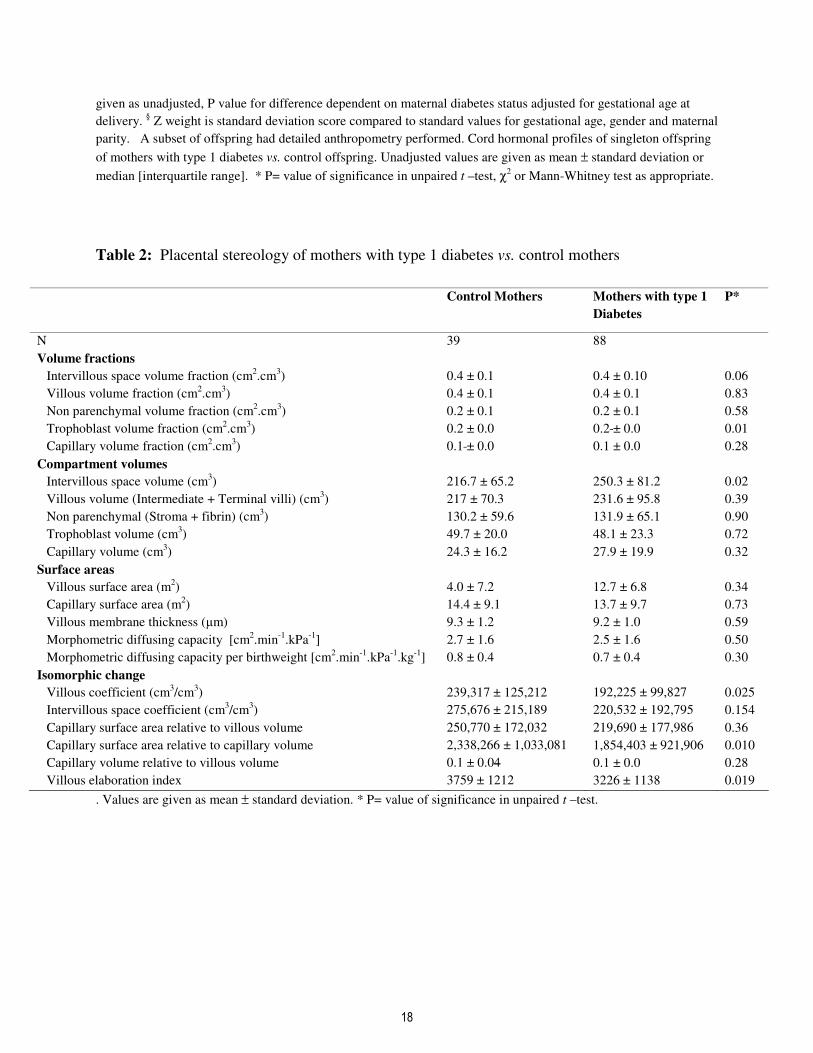
Table 2: Placental stereology of mothers with type 1 diabetes vs. control mothers
Control Mothers Mothers with type 1
Diabetes
P*
N 39 88
Volume fractions
Intervillous space volume fraction (cm2.cm
3) 0.4 ± 0.1 0.4 ± 0.10 0.06
Villous volume fraction (cm2.cm
3) 0.4 ± 0.1 0.4 ± 0.1 0.83
Non parenchymal volume fraction (cm2.cm
3) 0.2 ± 0.1 0.2 ± 0.1 0.58
Trophoblast volume fraction (cm2.cm
3) 0.2 ± 0.0 0.2 ± 0.0 0.01
Capillary volume fraction (cm2.cm
3) 0.1 ± 0.0 0.1 ± 0.0 0.28
Compartment volumes
Intervillous space volume (cm3) 216.7 ± 65.2 250.3 ± 81.2 0.02
Villous volume (Intermediate + Terminal villi) (cm3) 217 ± 70.3 231.6 ± 95.8 0.39
Non parenchymal (Stroma + fibrin) (cm3) 130.2 ± 59.6 131.9 ± 65.1 0.90
Trophoblast volume (cm3) 49.7 ± 20.0 48.1 ± 23.3 0.72
Capillary volume (cm3) 24.3 ± 16.2 27.9 ± 19.9 0.32
Surface areas
Villous surface area (m2) 4.0 ± 7.2 12.7 ± 6.8 0.34
Capillary surface area (m2) 14.4 ± 9.1 13.7 ± 9.7 0.73
Villous membrane thickness (µm) 9.3 ± 1.2 9.2 ± 1.0 0.59
Morphometric diffusing capacity [cm2.min
-1.kPa
-1] 2.7 ± 1.6 2.5 ± 1.6 0.50
Morphometric diffusing capacity per birthweight [cm2.min
-1.kPa
-1.kg
-1] 0.8 ± 0.4 0.7 ± 0.4 0.30
Isomorphic change
Villous coefficient (cm3/cm
3) 239,317 ± 125,212 192,225 ± 99,827 0.025
Intervillous space coefficient (cm3/cm
3) 275,676 ± 215,189 220,532 ± 192,795 0.154
Capillary surface area relative to villous volume 250,770 ± 172,032 219,690 ± 177,986 0.36
Capillary surface area relative to capillary volume 2,338,266 ± 1,033,081 1,854,403 ± 921,906 0.010
Capillary volume relative to villous volume 0.1 ± 0.04 0.1 ± 0.0 0.28
Villous elaboration index 3759 ± 1212 3226 ± 1138 0.019
. Values are given as mean ± standard deviation. * P= value of significance in unpaired t –test.
Page 19
19
Table 3 Multivariate analysis of independent correlates of placental structure in OT1DM and controls.
Control Mothers Mothers with type 1 Diabetes
Associate β + SE P Variance (%) Associate β + SE p Variance (%)
Intervillous space volume IGF-I 5.8 ± 3.3 0.09 8.4 IGF-I 9.8 ± 2.8 <0.001 22.6
Leptin 35.7 ± 15.3 0.022
Adiponectin -2.2 ± 1.3 0.081
Villous volume - - - - IGF-I 14.4 ± 3.3 <0.001 18.6
Non parenchymal (Stroma + fibrin) - - - - Mode of del 14.7 ± 5.5 0.009 7.9
Trophoblast volume Mode of del -5.1 ± 2.5 0.05 18.4 IGF-I 2.5 ± 0.8 0.005 9.3
Adiponectin -1.1 ± 0.6 0.10
Capillary volume Leptin 10.7 ± 6.3 0.10 7.8 IGF-I 2.1 ± 0.7 0.005 9.0
Villous surface area - - - - IGF-I 0.6 ± 0.3 0.021 6.3
Capillary surface area Leptin 6.5 ± 3.6 0.08 8.8 Insulin 5.2 ± 2.1 0.017 6.7
Villous membrane thickness Mode of del -0.3 ± 0.2 0.06 10.0 - - - -
Theoretical diffusing capacity - - - IGF-I 0.15 ± 0.06 0.012 7.4
Capillary surface area relative to villous
volume
Insulin 74051 ± 39656 0.06 4.0
Capillary surface area relative to capillary
volume
Mode of del -161606 ± 87257 0.068
Insulin 560045 ± 238033 0.021
Leptin -334678 ± 200058 0.098 8.1
Stepwise regression with log(insulin), log(leptin), adiponectin, IGF-I, mode of delivery and sex was performed with an α of P ≤ 0.1 for adding or removing
predictors from the model. β ± SE, β co-efficient ± standard error. Variance (%) explained by the model
.